
 Submit a Paper
 Propose a Special lssue
 Open Access
ARTICLE

Efficient Arabic Essay Scoring with Hybrid Models: Feature Selection, Data Optimization, and Performance Trade-Offs
1 Department of Computer Science, College of Computer and Information Sciences, Jouf University, Sakaka, 72388, Saudi Arabia
2 Information Systems Department, College of Computer and Information Sciences, Jouf University, Sakaka, 72388, Saudi Arabia
* Corresponding Authors: Meshrif Alruily. Email: ; Ayman Mohamed Mostafa. Email:
Computers, Materials & Continua 2026, 86(1), 1-28. https://doi.org/10.32604/cmc.2025.063189
Received 08 January 2025; Accepted 29 April 2025; Issue published 10 November 2025
 View Full Text
 Download PDF
Abstract
Automated essay scoring (AES) systems have gained significant importance in educational settings, offering a scalable, efficient, and objective method for evaluating student essays. However, developing AES systems for Arabic poses distinct challenges due to the language’s complex morphology, diglossia, and the scarcity of annotated datasets. This paper presents a hybrid approach to Arabic AES by combining text-based, vector-based, and embedding-based similarity measures to improve essay scoring accuracy while minimizing the training data required. Using a large Arabic essay dataset categorized into thematic groups, the study conducted four experiments to evaluate the impact of feature selection, data size, and model performance. Experiment 1 established a baseline using a non-machine learning approach, selecting top-N correlated features to predict essay scores. The subsequent experiments employed 5-fold cross-validation. Experiment 2 showed that combining embedding-based, text-based, and vector-based features in a Random Forest (RF) model achieved an R2 of 88.92% and an accuracy of 83.3% within a 0.5-point tolerance. Experiment 3 further refined the feature selection process, demonstrating that 19 correlated features yielded optimal results, improving R2 to 88.95%. In Experiment 4, an optimal data efficiency training approach was introduced, where training data portions increased from 5% to 50%. The study found that using just 10% of the data achieved near-peak performance, with an R2 of 85.49%, emphasizing an effective trade-off between performance and computational costs. These findings highlight the potential of the hybrid approach for developing scalable Arabic AES systems, especially in low-resource environments, addressing linguistic challenges while ensuring efficient data usage.Keywords
Automated essay scoring (AES) systems are now essential in today’s educational landscape. The latter provides scalable and efficient means of assessing large volumes of student-written essays, saving time and resources for educators. Recent advancements in natural language processing (NLP) and machine learning (ML) have made AES systems for languages like English as good as human graders. However, the problem is that developing effective AES systems in Arabic is a bit different. Arabic is a morphologically rich language with rich word structure, rich syntactic forms, and root-based morphology that have a profound effect on how meaning is conveyed [1]. Another layer of complexity is the diglossia of the language, that is, the coexistence of Modern Standard Arabic and several regional dialects. The language of formal education does not always match everyday spoken vernacular, which makes it harder for AES systems to accurately interpret and score essays. In addition, there are a few large, annotated Arabic essay datasets, which are essential for training ML models well. Automatically evaluating Arabic essays is a much tougher task than other languages because of these factors.
As presented in [2], the main objective of automated essay scoring (AES) is to use AI language models like GPT to automatically score essays, accurately and reliably. This study attempts to assess the efficacy of GPT-3’s text-DaVinci-003 model in scoring a large corpus of non-native written English essays and to evaluate the impact of linguistic features on the performance of AES. It also investigates the possibilities of AES tools to help with human assessment and to assist in the writing of assessments and feedback in educational and research contexts. The authors of [3] presented an Automatic Arabic Essay Evaluator (AAEE) system to grade school children’s essays in Arabic according to criteria used by Saudi Arabian instructors. Language proficiency and essay structure are evaluated by the system using Latent Semantic Analysis and Rhetorical Structure Theory. On 350 transcribed essays, AAEE scored 90% accuracy and had a correlation of 0.756 between automatic and teacher evaluations, which outperformed the human-human correlation of 0.709. The goal is to give students faster and more consistent feedback to help them get better at writing. The authors of [4] proposed an algorithm for estimating textual similarity scores and using these scores across multiple tasks including text ranking, essay grading, and question-answering systems. We study Arabic texts and use different vectorization schemes such as lexical-based, frequency-based, and pre-trained model-based features. It explores the use of AraBERT, an Arabic Bidirectional Encoder Representation from the Transformers model, in two variants: as a feature extractor and as a fine-tuned model. The purpose of this research is to compare and evaluate these two approaches for predicting relevancy scores of Arabic text units. The authors of [5] designed an Arabic Automated Essay Grading (AAEG) system capable of scoring students’ answers to Arabic essay questions at a level like that of human teachers. This system is designed to fill the void in the research of automated Arabic essay grading and to increase accuracy by utilizing the Arabic WordNet model for semantic analysis. The model uses a hybrid stemming method and uses Arabic WordNet synonyms to maintain fair scoring even when students choose different words from the reference answer. The authors of [6] presents a hybrid machine learning model for efficient Arabic essay scoring, combining feature selection, data optimization, and algorithm tuning to enhance accuracy and fairness. Inspired by personalized recommender systems, the model not only automates scoring based on linguistic features but also offers individualized feedback to support student improvement. This approach highlights the potential of AI to deliver scalable, adaptive, and data-driven educational tools for Arabic language learning.
The linguistic complexity of Arabic because of its morphological abundance dialectal variations and lexical variation makes it impossible for any single similarity model or analytical technique to deliver precise scoring performance. The combination of text-based vector-based and embedding-based similarity features has become essential for researchers who study Arabic AES systems. These combination models employ features from surface lexical matching frequency-based representation and deep semantic understanding to enhance Arabic AES system performance while exploiting the strengths of each method. Hybrid models combine text-based, vector-based, and embedding-based feature extraction methods to better understand the complexities of the Arabic language. Prior studies have demonstrated the effectiveness of such hybrid approaches in improving AES performance. For instance, Lotfy et al. [7] achieved high accuracy using a combination of string-based and corpus-based similarity algorithms with machine learning models, while Badry et al. [8] integrated local and global weight-based LSA features to enhance short-answer scoring. Similarly, Alobed et al. [5] employed Arabic WordNet semantics in a hybrid model to maintain fair scoring across lexical variations.
The combination of multiple analytic methods through hybrid models enhances Arabic AES systems because they process both structural and semantic elements of the language. The main difficulties in implementing Arabic AES require effective data utilization and feature selection strategies. The main challenge for the system lies in achieving high-scoring accuracy while using minimal labeled data without straining system resources. The researchers face difficulties in determining the impact that different similarity measures have on the overall system performance. The promising outcomes achieved by deep learning approaches depend on extensive datasets but these resources are scarce in educational settings that acquire small amounts of annotated Arabic texts. Our research presents a hybrid AES system that combines text-based vector-based along with embedding-based similarity features as solutions to these challenges. Evaluation of this model takes place using performance indicators R2, Cohen’s Kappa, and tolerance-based accuracy. An Optimal Data Efficiency Training strategy enables us to evaluate the performance effects as the amount of training data changes. The main scope of our research focuses on answering two essential questions.
Q1: What is the optimal amount of training data needed to balance model performance and computational efficiency?
Q2: How do different similarity measures and feature combinations impact the performance of Arabic AES models?
Our work significantly contributes to developing efficient, scalable, and accurate Arabic AES systems. We demonstrate the effectiveness of hybrid models and provide insights into balancing data usage and performance. These findings directly affect the implementation of AES systems in Arabic-speaking educational institutions, where scalability and efficiency are essential. The organization of the paper is as follows: Section 1 introduces the topic and provides a background on Automated essay scoring (AES) systems, emphasizing the challenges specific to Arabic. Section 2 reviews related work in Arabic AES, summarizing advancements in methodologies and performance metrics. Section 3 details the methodology, including dataset preparation, feature extraction, scoring approaches, and experimental setup. Section 4 presents the results from multiple experiments, evaluating various similarity measures, feature selection, and data efficiency. Section 5 discusses the findings of the research questions, providing insights into performance trade-offs and the scalability of the proposed model. Finally, Section 6 concludes with key insights, contributions, and future research directions, emphasizing the efficacy of the hybrid model for Arabic AES.
Automated essay scoring (AES) for Arabic essays has gained significant attention in recent years, with researchers exploring various approaches to improve accuracy and efficiency in scoring. This section reviews the existing literature on Arabic essay scoring systems, focusing on methodologies, datasets, and performance metrics. Gomaa and Fahmy [9] came up with the Answer to Vector method, which changes both the model’s answers and the students’ answers into meaningful vectors using skip-thought vector techniques to measure similarity. Their model showed good results on three benchmark datasets, achieving a top Pearson correlation value of 0.63 on the Texas dataset.
Recent studies have used a mix of pre-processing techniques, similarity measures, and machine learning algorithms to improve performance. Lotfy et al. [7] propose an approach that combines string-based and corpus-based similarity algorithms with feature selection methods, achieving high-scoring accuracy using the Random Forest algorithm, with a Pearson correlation of 91.30%. These results show the effectiveness of combining similarity measures and machine learning models in Arabic AES systems. Alammary [10] made a new feature extraction technique designed for Arabic questions to help in the automated classification of assessment questions for Arab teachers. This technique used a modified TF-IDF called term frequency part-of-speech-inverse document frequency, which considered the special features of the Arabic language. It reached an accuracy of 0.787, proving its usefulness for Arabic assessment. Nael et al. [11] introduced a deep learning-based method, AraScore, for grading Arabic short answers. They tested many models like RNNs, LSTM, Bi-LSTM, Bert, and ELECTRA, achieving top results with a QWK score of 0.78 on the ASAP Short Answer Scoring dataset. Even with differences between translated and original Arabic texts, their model performed well. Badry et al. [8] created an automatic Arabic short-answer grading system using Latent Semantic Analysis (LSA) on the AR-ASAG dataset. Their hybrid approach, combining local and global weight-based LSA, gave good results, with an F1-score of 82.82% and an RMSE of 0.798, showing how effective their method is. Meccawy et al. [12] tested a knowledge-based similarity approach using Word2vec and BERT for Arabic AES. Their study showed how contextual embedding models affect scoring accuracy, with BERT giving the best RMSE (1.003) and Pearson correlation (0.84). This highlights how advanced NLP methods can improve Arabic AES systems. Soulimani et al. [13] created a dataset of Arabic questions, answers, and grades, adapting methods from English ASAG to Arabic. Their study on deep learning-based grading for sixth-grade students’ answers showed high accuracy, suggesting potential use for early detection of learning problems and targeted educational help.
One prominent method is using Latent Semantic Analysis (LSA) combined with linguistic features, as demonstrated in [14]. This approach achieved a remarkable 96.72% accuracy and a correlation of 0.78 on essays written by college students, highlighting the strength of semantic techniques in AES. Likewise, the “AAEE—Automated Evaluation of Students’ Essays in Arabic Language” system applied LSA along with Rhetorical Structure Theory, obtaining 90% correct scores and a correlation of 0.756 on school-level essays. These studies illustrate how LSA can effectively capture deeper semantic relationships in Arabic essays. Alsanie et al. [15] explored the lexical, syntactic, and semantic levels of Arabic essays, demonstrating performance similar to human raters. This method shows the importance of a multi-level approach in assessing various linguistic features. Additionally, Automated Scoring of Arabic Short Answer Essays Using Longest Common Subsequence and Arabic WordNet combined sequence alignment techniques with Arabic WordNet, achieving a Pearson correlation of 0.94, demonstrating how language-specific resources can enhance essay scoring. Kusuma et al. [16] used CNN, LSTM, and BERT models, achieving a quadratic weighted kappa (QWK) of 0.801, showcasing how deep learning models can capture complex patterns within the text. Similarly, “Automated Students Arabic Essay Scoring Using Neural Network” utilized Elitist-Jaya optimization along with neural networks, reaching a correlation of 0.92 with human scores, further confirming the effectiveness of neural models in accurately evaluating Arabic essays. Abdeljaber et al. [2] suggests using the longest common subsequence (LCS) algorithm as a string-based text similarity method for scoring Arabic short answers more effectively. The basic LCS is improved by adding weight-based measurement techniques and using Arabic WordNet to understand the meaning better. Experiments done on a dataset of 330 student answers showed an RMSE value of 0.81 and a Pearson correlation of 0.94, proving the high accuracy of this method. The results show that this approach performs better than similar studies and scores student answers in a way that is very similar to human grading. Rule-based approaches also contribute to the landscape of Arabic AES. Alqahtani et al. [17] applied surface-level processing to unrestricted Arabic essays, correctly evaluating 73% of essays. Although rule-based systems often lack the depth of machine learning models, they provide a lightweight alternative that can be useful in constrained environments.
To tackle data sparsity and enhance training data, Jong et al. [18] used back-translation to expand the dataset size, which increased the robustness of the neural model in scoring. Such data augmentation methods are vital for low-resource languages like Arabic, where there is limited annotated data for training. Other studies have aimed at reducing biases and improving model robustness. For instance, Jeon et al. [19] addressed the issue of essay length bias, which has historically affected the accuracy of AES results. This research emphasizes the importance of ensuring fairness in AES models, particularly for diverse datasets like Arabic, where essay lengths can vary significantly. Recently, there has been increased interest in hybrid and multi-stage learning frameworks. Liu et al. [20] proposed a multi-stage learning approach that outperformed baselines on five out of eight prompts, demonstrating the potential of integrating multiple learning stages to enhance performance. Likewise, Cozma et al. [21] surpassed state-of-the-art deep learning models by combining traditional machine learning techniques with word embeddings, a method that is particularly effective for smaller datasets. Moreover, Wu [22] used Latent Semantic Analysis (LSA) and Rhetorical Structure Theory (RST) to evaluate Arabic school essays, achieving a good correlation of 0.756 with human scores (Azmi). Ran et al. [23] examined how data sparsity affects automated essay scoring systems using RankSVM and KNN. Their study showed that these models perform well even when data is limited (Ran). Kumar et al. [24] worked on solving the challenge of “black box” models in deep learning by analyzing rubric scores with neural networks. Their model matched well with rubric-based human grading (Kumar). Boulanger and Kumar [25] applied deep learning to essay scoring, achieving strong results on different data sets from the ASAP competition, proving neural networks are useful in this field. Gaheen et al. [26] used Elitist-Jaya optimization and neural networks to score Arabic essays, achieving a high correlation of 0.92 with human graders. Finally, Alshalabi et al. built an automated system for scoring Arabic essays in online exams, using stemming techniques and Levenshtein edit operations, achieving efficient results (Alshalabi).
Despite the progress made in Arabic Automated essay scoring (AES) through various approaches—including rule-based systems, traditional machine learning techniques, and deep learning models—several critical challenges persist [27]. Many existing methods focus exclusively on either surface-level text matching or deep semantic analysis, resulting in models that either miss nuanced language features or require vast amounts of data and computational resources. In particular, issues such as data sparsity, limited interpretability, and the difficulty in capturing both explicit lexical overlaps and underlying semantic relationships remain significant hurdles. Motivated by these challenges, our research introduces a hybrid model that integrates text-based, vector-based, and embedding-based similarity measures. This approach leverages robust feature engineering and optimal data efficiency to enhance scoring accuracy while maintaining transparency and reducing data demands. By addressing these shortcomings, our work contributes an innovative solution tailored for low-resource educational environments where annotated Arabic essay datasets are limited.
In general, the reviewed studies show a range of methods for Arabic AES, from traditional rule-based approaches to advanced deep learning models. Each method has its own strengths depending on the specific task and dataset. Recently, there has been a trend toward using hybrid models and neural networks because they are better at understanding complex language patterns. However, challenges like data sparsity and fairness issues, such as essay length bias, still need to be addressed. With ongoing progress in natural language processing and deep learning, Arabic AES is expected to achieve even higher accuracy and become more useful in various educational contexts.
In this study, we constructed a scoring model for student essays that can accurately predict student essay scores through machine learning techniques, mimicking the judgment of human graders. Our methodology involved several key steps: collecting and preparing a robust dataset, extracting meaningful features that capture the nuances of student essays, selecting and training various predictive models, and rigorously evaluating their performance. We carefully orchestrated each of these steps to create a model that is accurate, efficient, and practical for real-world educational settings.
The dataset was gathered based on a comprehensive collection of student essays and the process by which they were annotated with grades assigned by human experts. This foundational data is crucial, as it serves both as the training ground for our models and the benchmark against which we measure their performance. During the feature extraction process, we explored innovative methods we employed to quantify the similarity between student answers and teacher-provided model answers. These similarity measures are the heart of our predictive capabilities, forming the core features fed into our machine learning models. We categorized these measures into three main types: text-based similarity, vector-based similarity, and embedding-based similarity. Each category offers a different lens through which to interpret the student responses, capturing lexical choices, syntactic structures, and semantic meanings.
The essay scoring approach explored various tested strategies, from straightforward non-machine learning methods to more sophisticated multi-model approaches that utilize a blend of similarity measures. By experimenting with these different approaches, we sought to optimize our ability to predict essay scores accurately and to understand the impact of different feature sets on model performance. In the performance measurement step, we discussed the metrics we used to evaluate our models’ accuracy and reliability. These include standard error metrics like R-squared (R2), and Mean Squared Error (MSE), as well as custom-designed metrics such as accuracy within specific tolerance levels. Our emphasis here is on replicating human judgment as closely as possible, ensuring that our model’s scores align with those a human grader would assign. Finally, the experimental setup subsection presents our comprehensive framework for validating our approaches, as illustrated in Fig. 1. We conducted multiple experiments to assess the effectiveness of different models and feature combinations. These experiments included testing various configurations, such as optimal data efficiency training, feature selection, and cross-validation, all designed to identify the best-performing model. Each experiment was meticulously planned to ensure that our findings were both reliable and applicable to general contexts.
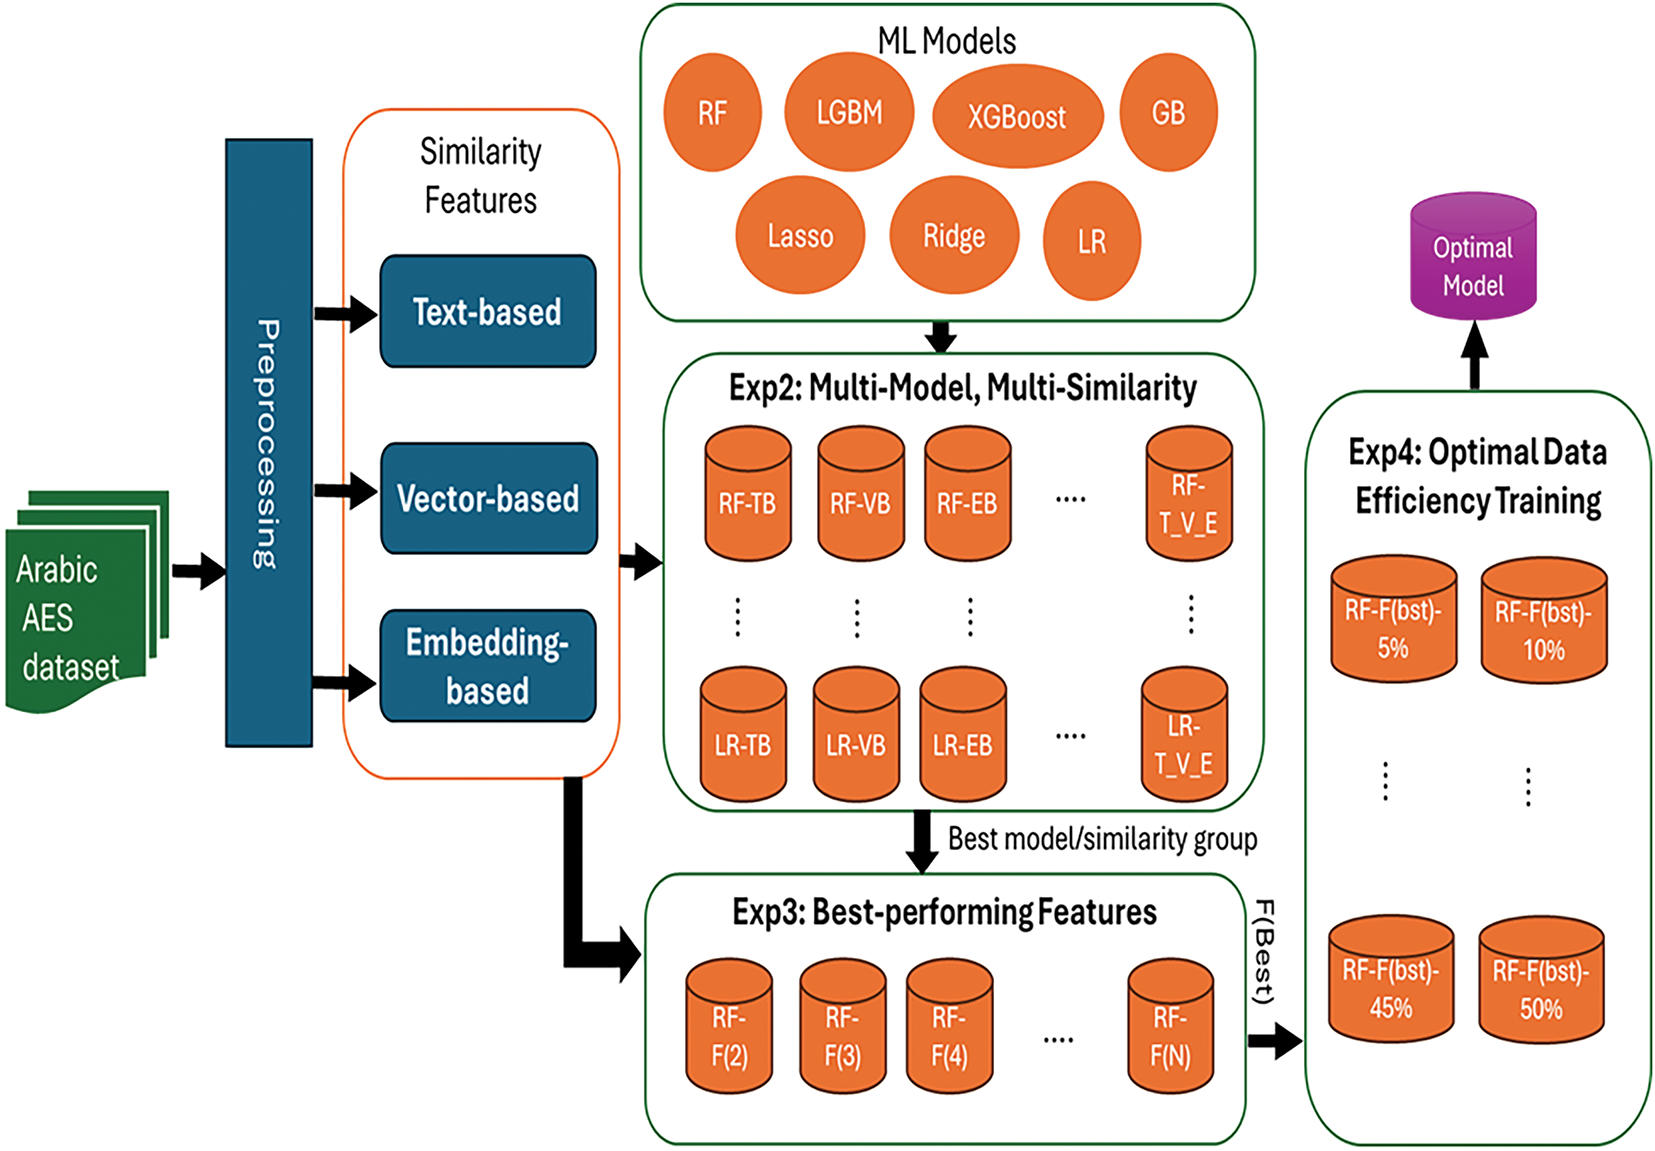
Figure 1: The key stages and experiments of proposed Arabic automatic essay scoring (AES) system
The dataset utilized in this research represents the first large-scale Arabic essay scoring dataset, structured around 22 questions that are thematically grouped into five distinct categories:
1. History-related topics: This includes questions that cover subjects such as civilizations, historical inscriptions, and historical sources.
2. Geography-related topics: These questions explore factors of ancient civilizations and the impact of geography on their development.
3. Social studies & economy-related topics: Questions here address the importance of history, livestock, agriculture, and economic contributions.
4. Engineering and architecture-related topics: Focuses on Egyptian architectural innovations and their influence on society.
5. Social and economic impact: This category includes questions about social revolutions, and the Nile’s influence on industry and agriculture.
As presented in Fig. 2, each of these 22 questions includes one teacher-provided model answer and 300 student answers, which were graded by two independent graders on a scale from 0 to 5.
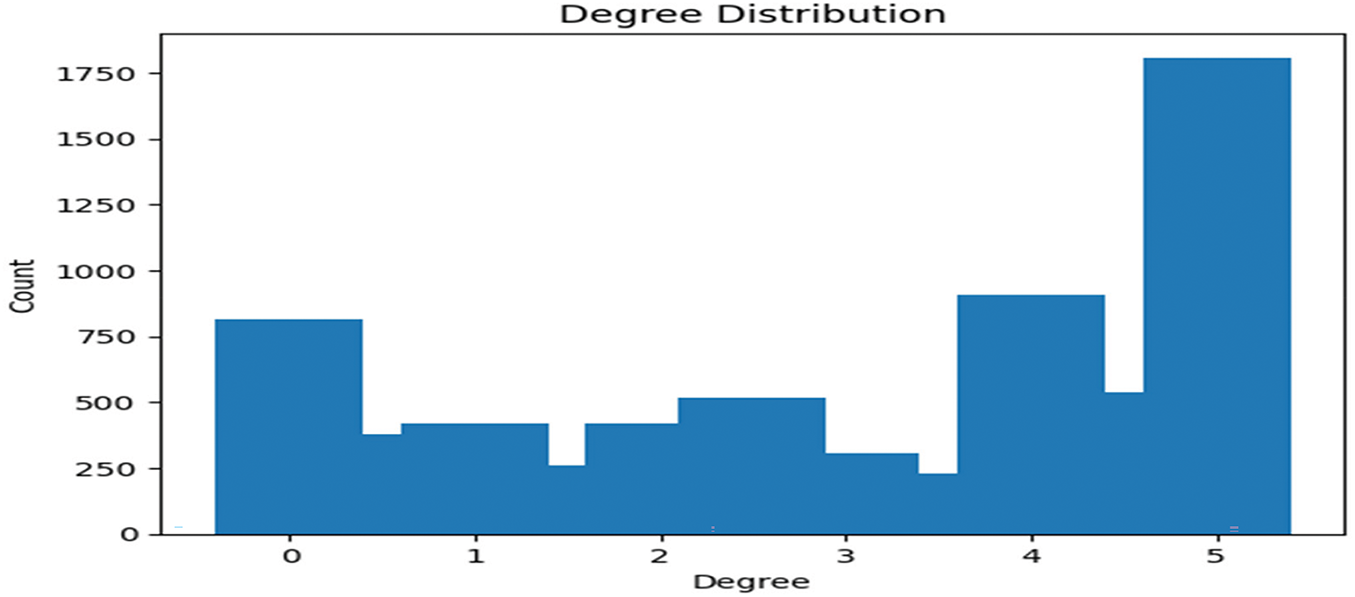
Figure 2: Degree distributions of questions
The data preprocessing involved multiple steps:
1. Handling missing values: Any null or missing values in the dataset were cleaned to ensure the completeness of the data.
2. Tokenization: Each answer was tokenized, meaning the text was split into individual words or tokens to facilitate further text analysis.
3. Lemmatization: Lemmatization was applied to convert words to their base forms. This helped in reducing variations of words to a common root, improving the quality of feature extraction and similarity measures.
3.3 Extracting Similarity Measures Features
In this sub-section, we detail the rationale for selecting multiple similarity measures and explain their respective strengths. Each measure addresses different aspects of textual similarity, thereby ensuring a comprehensive evaluation of the essays. Text-based similarity measures, such as Jaccard, word overlap, n-gram overlap, and lexical matching, are highly effective at identifying exact word matches and surface-level similarities. These methods are particularly useful in detecting direct correspondence between the student and teacher answers. However, they may fall short when synonyms or paraphrasing occur. To address this limitation, vector-based similarity measures are employed. By transforming text into TF-IDF vectors, these measures capture the relative importance of words across the document set and can reveal more subtle differences in term usage. Finally, embedding-based similarity measures leverage pre-trained models like Fast Text to capture deep semantic relationships and contextual meaning beyond surface-level word matching. By combining these complementary approaches, our hybrid model benefits from the explicit matching capabilities of text-based methods, the statistical insights of vector-based methods, and the semantic depth provided by embedding. This integrated strategy enhances the robustness and accuracy of our automated essay scoring system.
3.3.1 Text-Based Similarity (Word-Level)
Text-based similarity measures are applied at the word level between student and teacher answers. These methods assess the overlap or difference between sets of words, rather than characters, and provide a score indicating the similarity between the two answers. Here, we describe the key similarity measures used and their corresponding mathematical formulations.
(A) Jaccard Word Similarity
The Jaccard similarity index compares the words between the two sets (student and teacher answers). It is calculated as the ratio of the intersection of the two word sets over their union.
where:
•
•
•
(B) Word Overlap Similarity
This method calculates the proportion of words in the student answer that overlap with the teacher answer.
where:
(C) N-gram Overlap Similarity
N-grams are contiguous sequences of n words in the text. The N-gram overlap similarity compares the sequences of words (e.g., bigrams, trigrams) between the two answers.
where:
•
•
(D) Lexical Matching Similarity
Lexical matching counts the number of exact word matches between the two answers. It’s a straightforward comparison method where each word from the student answer is compared with the teacher answer.
This ratio indicates the proportion of words in the student answer that exactly match the teacher’s answer.
(E) Levenshtein Distance (Edit Distance)
Although applied at the word level, this method calculates the number of insertions, deletions, or substitutions required to transform one sequence of words into another. The distance is minimized for more similar texts.
This method is adapted to compare words rather than characters.
(F) Jaro-Winkler and Jaro Similarity
These methods measure the similarity between two strings by considering transpositions and common characters within a certain distance. Jaro-Winkler enhances Jaro by assigning higher importance to the beginning of the strings, but both are applied here at the word level.
where:
•
•
In vector-based similarity, each answer is converted into a vector representation using TF-IDF (Term Frequency-Inverse Document Frequency). TF-IDF assigns a weight to each word, based on its frequency in the document and its inverse frequency across all documents.
(A) Cosine Similarity
Cosine similarity calculates the cosine of the angle between two vectors, providing a measure of how similar the answers are in a multi-dimensional space.
where:
•
•
•
(B) Euclidean Distance
This measure calculates the straight-line distance between two vectors in space.
3.3.3 Embedding-Based Similarity
For embedding-based similarity, we used pre-trained Word2Vec embedding from FastText. The pre-trained embedding were derived from a large corpus of Arabic text and offer vector representations for over 2 million words, with a vector size of 300 dimensions.
(A) Embedding Process:
1. Word Embedding: Each word in the student and teacher answers is converted into a 300-dimensional vector.
2. Answer Embedding: To represent an entire answer, we calculated the mean of the word vectors for each answer.
where:
•
•
(B) Similarity Measures: We applied various similarity calculations on these embedding:
1. Cosine Similarity (as in Eq. (7))
2. Euclidean Distance (as in Eq. (8))
3. Jaccard Similarity, Dice Coefficient, Overlap Coefficient: Adapted to work with embedding vectors to assess semantic similarity.
These measures assess the closeness of the embedding in vector space, offering a deeper understanding of the semantic similarity between the student and teacher answers.
In this section, we explore four different approaches to predict the essay scores using machine learning models and similarity measures. Each approach is designed to assess the effectiveness of various similarity feature sets and machine learning algorithms to predict the student scores, and their mathematical formulations are described below.
3.4.1 Non-Machine Learning Approach
This approach uses the top-most correlated similarity features to estimate the score directly, without any machine learning model. The features are selected and combined iteratively to improve the prediction accuracy. Here’s how the process works:
• Step 1: Extract similarity features for each student-teacher answer pair using the methods described earlier (text-based, vector-based, and embedding-based).
• Step 2: Calculate the mean of the top-N correlated features for each answer pair.
• Step 3: Use this mean value as the predicted score. The score is scaled to fit the range of 0 to 5.
• Step 4: Iterate by adding one feature at a time (from 2 to N, where N is the total number of features) and evaluate the performance.
This method provides a simple baseline to compare against machine learning approaches.
3.4.2 Multi-Model, Multi-Similarity Approach
This approach evaluates multiple machine learning models with different similarity groups, using 5-fold cross-validation to ensure robust performance assessment. The following models were applied:
• Models: XGBoost, LightGBM (LGBM), Random Forest, Gradient Boosting, Linear Regression, Ridge, Lasso
• Similarity Groups:
– Embedding-based features alone
– Vector-based features alone
– Text-based features alone
– Combined groups: Embedding + Text, Embedding + Vector, Text + Vector, Embedding + Text + Vector
For each combination, the following steps are performed:
• Step 1: Train the model on one similarity group using 5-fold cross-validation.
• Step 2: Evaluate the model’s performance using Mean Absolute Error (MAE), Mean Squared Error (MSE), Weighted Mean Absolute Error (WMAE), R-squared (R2), Cohen’s Kappa, and accuracy within 0.5 tolerance.
• Step 3: Rank the models based on their average performance across the folds.
• Step 4: Identify the best model and best-performing similarity group.
where:
• f is the machine learning function.
•
• S represents the similarity features
3.4.3 Feature Selection on the Best Model
This approach involves selecting the best-performing features from the best model identified in the previous step. The method is as follows:
• Step 1: Use the top-ranked similarity group (e.g., ‘Embedding + Text + Vector’).
• Step 2: Rank the similarity features based on their correlation with the target score.
• Step 3: Incrementally add one feature at a time (from 1 to M, where M is the maximum number of features) and train the best model (RF).
• Step 4: Evaluate performance after each addition using 5-fold cross-validation and select the optimal number of features that yields the best performance.
where:
•
•
•
3.4.4 Optimal Data Efficiency Training
In this approach, we simulate a real-case scenario where a teacher has a template answer and a few student answers. The aim is to find the minimum number of student answers required to train a model that results in acceptable performance. The method follows an incremental training strategy:
• Step 1: Start with 5% of the training data and train the best model (RF).
• Step 2: Evaluate the model’s performance on a large portion of unseen data.
• Step 3: Incrementally add 5% more training data and repeat the process until 50% of the data is used.
• Step 4: Identify the point at which the model achieves acceptable performance metrics R2.
In this study, a variety of performance metrics were used to assess the accuracy and reliability of the predicted essay scores in comparison to the actual scores provided by human graders. These metrics evaluate the error, correlation, and agreement between predicted and actual values, ensuring that the scoring model can replicate human judgment effectively.
3.5.1 Mean Absolute Error (MAE)
Mean Absolute Error is one of the most widely used metrics in regression tasks. It computes the average of the absolute differences between the predicted scores and the actual scores. This metric provides an intuitive understanding of how far the predictions are from the true values, where a lower MAE reflects better model performance. MAE is particularly useful because it treats all errors equally without emphasizing larger errors more than smaller ones.
where:
•
•
•
•
3.5.2 Mean Squared Error (MSE)
The Mean Squared Error is another commonly used metric, which, unlike MAE, squares the differences between predicted and actual scores. This gives more weight to larger errors, making the metric sensitive to outliers or extreme deviations. MSE helps detect when the model produces predictions that deviate significantly from the true score, providing insight into the consistency of the predictions.
The lower the MSE, the better the model is at predicting scores without large deviations. MSE is ideal when minimizing large errors is crucial.
3.5.3 Weighted Mean Absolute Error (WMAE)
In this essay scoring task, some grades may be more critical or frequent than others. Therefore, the Weighted Mean Absolute Error (WMAE) gives different importance (weights) to different data points (grades). For instance, higher weights can be assigned to scores at the upper or lower ends of the range, reflecting their significance in assessing the model’s ability to handle extreme cases.
where:
•
R-Squared is a statistical measure that indicates the proportion of variance in the actual scores that can be explained by the model’s predictions. An R2 value closer to 1 suggests that the model explains a large portion of the variance, and thus has strong predictive power. R2 is useful for assessing the overall fit of the model to the data.
where
Cohen’s Kappa is used to measure the agreement between two raters (in this case, the model and the human graders) while accounting for the agreement that could happen by chance. Unlike simple accuracy, Cohen’s Kappa provides a more realistic estimate of agreement by factoring in chance levels of agreement, especially in tasks with multiple categories (e.g., essay grades).
where:
•
•
3.5.6 Accuracy within Tolerance
This custom metric is designed specifically for essay scoring tasks where small deviations between the predicted and actual scores may be considered acceptable. The accuracy within tolerance measures the percentage of predicted scores that fall within a certain tolerance range from the actual scores.
For instance:
• Accuracy within 0.5 tolerance: This metric calculates the proportion of essays for which the predicted score is within 0.5 points of the actual score.
where:
• I is an indicator function that equals 1 if the condition is true and 0 otherwise. Similar metrics are used for other tolerance levels:
• Accuracy within 1.0 tolerance: Tolerance of 1.0 point.
This measure is particularly valuable in education, where minor grading differences (e.g., 0.5 points) may still be considered acceptable by human standards.
The Pearson correlation coefficient measures the linear correlation between the predicted and actual scores. It ranges from −1 to 1, where 1 indicates perfect positive correlation, 0 indicates no correlation, and −1 indicates perfect negative correlation. This metric helps assess the strength and direction of the relationship between the actual and predicted grades.
where:
•
•
Our experiments were meticulously designed to evaluate different models and feature combinations:
• Experiment 1: Established a baseline using the non-machine learning approach with top-N correlated features.
• Experiment 2: Applied various machine learning models with different similarity feature groups using 5-fold cross-validation.
• Experiment 3: Performed feature selection on the best model to find the optimal feature subset.
• Experiment 4: Explored Optimal Data Efficiency Training to determine the minimal amount of data needed for acceptable performance.
Each experiment was conducted with careful consideration to ensure the reliability of the results. We aimed to identify the best-performing model that balances accuracy and computational efficiency.
Overall, the methodology is structured to ensure a thorough and rigorous evaluation of the essay scoring model, focusing on replicating the nuanced judgment of human graders while maintaining high reliability and scalability. Each phase of the methodology, from feature extraction to model selection and performance measurement, was meticulously designed to explore and optimize different approaches for accurate prediction of student essay scores. The conducted experiments provided valuable insights into the strengths and limitations of various similarity measures, as well as the performance of different machine learning models.
Furthermore, by incorporating Optimal Data Efficiency Training, the study simulates real-world scenarios, demonstrating the model’s ability to perform effectively even with limited student responses, making it adaptable to practical applications. This comprehensive exploration of the methodology not only contributes to the field of automated essay scoring but also paves the way for developing scalable, data-efficient, and reliable systems that can support educational institutions in grading at scale. Through this approach, the study emphasizes the importance of balancing model accuracy with practical usability, offering a system that can be integrated into real-world educational contexts to enhance grading efficiency and consistency.
4.1 Experiment 1: Non-Machine Learning Approach with Correlated Features
As presented in Fig. 3, the first experiment involved using the non-machine learning approach, where we selected the top-N most correlated features to predict essay scores. The goal of this experiment was to establish a baseline and observe how the inclusion of correlated features affected the performance of the model. The following key performance metrics were used for evaluation: Weighted Mean Absolute Error (WMAE), Mean Absolute Error (MAE), Mean Squared Error (MSE), R-squared (R2), Pearson Correlation, Cohen’s Kappa, and accuracy within tolerances of 0.5 and 1.0.
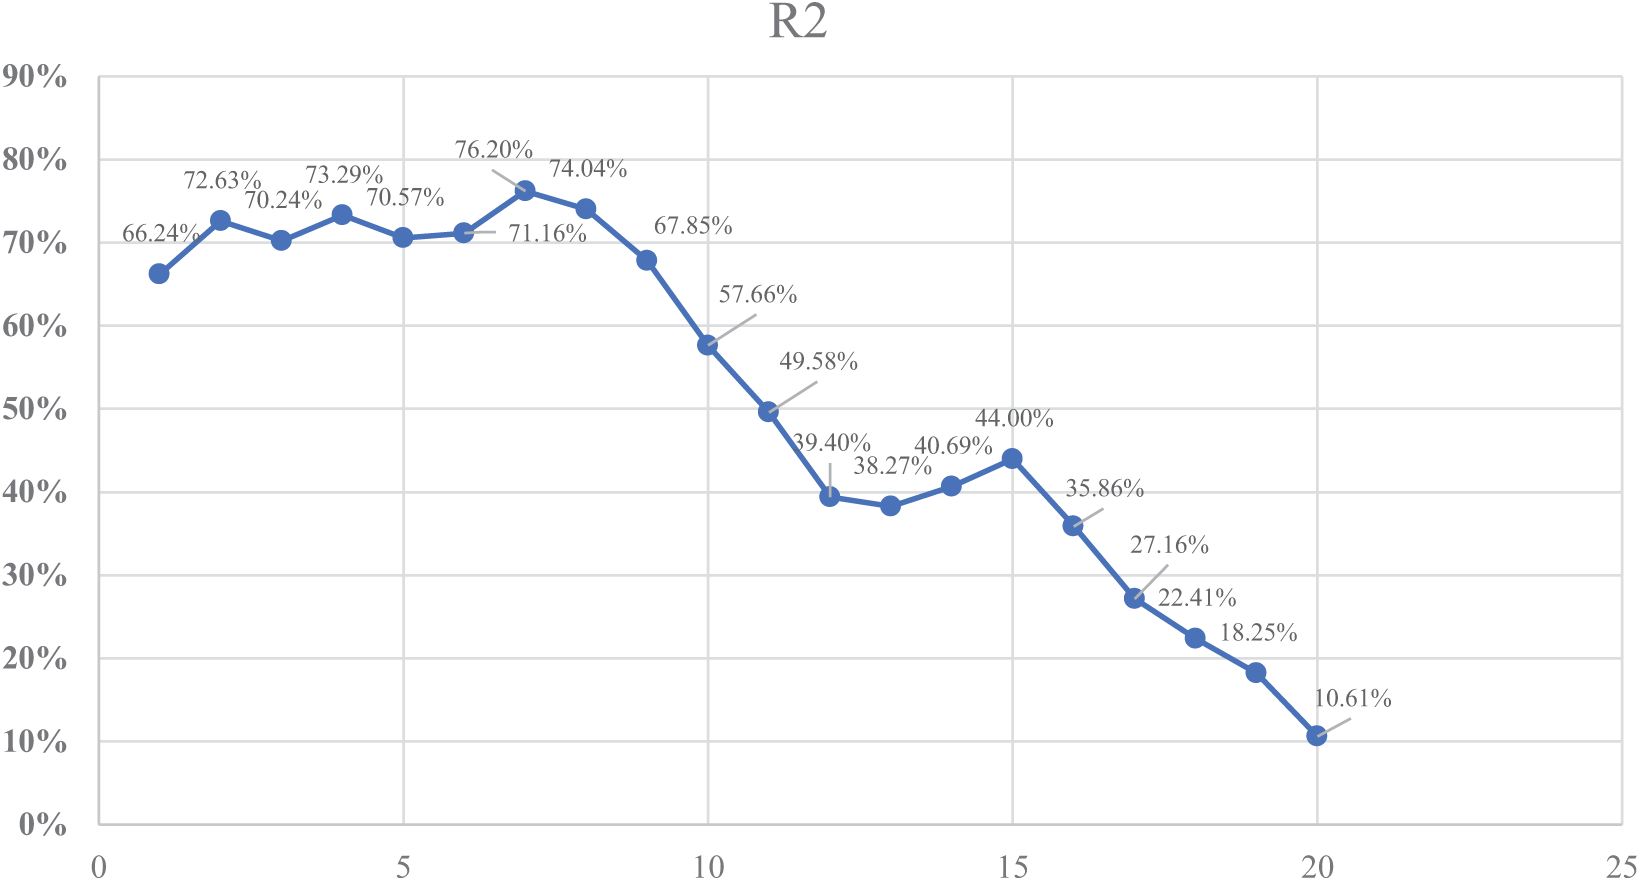
Figure 3: R2 values for each feature set
The experiment was conducted by starting with a single correlated feature and iteratively adding one more feature at a time, up to 20 correlated features. At each step, the performance of the model was evaluated based on the metrics. The R2 values for each feature set are visualized in the figure below.
The results of the experiment can be summarized as follows:
• Optimal Performance: The best performance was achieved when using 7 correlated features. At this point, the model reached its highest R2 (76.20%), indicating that 76.20% of the variance in the essay scores was explained by the model. The MAE was 0.65, and the WMAE was 0.70. The Accuracy within 1.0 tolerance was 74.09%, meaning that in 74% of cases, the predicted scores were within 1 point of the actual human-assigned scores.
• Diminishing Returns with More Features: Beyond 7 features, performance began to degrade, with increases in error metrics (WMAE, MAE, and MSE) and a drop in R2. For example, when using 20 features, the R2 dropped to 10.61%, and WMAE increased to 1.23, showing clear signs of overfitting.
• Cohen’s Kappa: The highest Cohen’s Kappa value was observed with 2 features (26.08%), suggesting a relatively higher agreement between the predicted and actual scores early in the process. However, as more features were added, the agreement level decreased, indicating that the added features may have contributed to noise rather than improving prediction accuracy.
This experiment demonstrated that a limited number of well-selected features can significantly improve the model’s ability to replicate human grading. The best results were obtained with 7 features, beyond which the model’s performance deteriorated, suggesting overfitting. The findings from this experiment set the foundation for further optimization in future experiments, where more advanced machine learning techniques will be explored using the identified optimal feature set.
4.2 Experiment 2: Multi-Model, Multi-Similarity Approach
In the second experiment, we explored the performance of various machine learning models by applying them to different combinations of similarity features. The goal was to determine how different feature sets (similarity groups) and models impact the predictive accuracy of essay scoring. The following similarity feature groups were tested: Embedding + Text + Vectorizer, Embedding + Text, Embedding + Vectorizer, Text + Vectorizer, and Vectorizer alone.
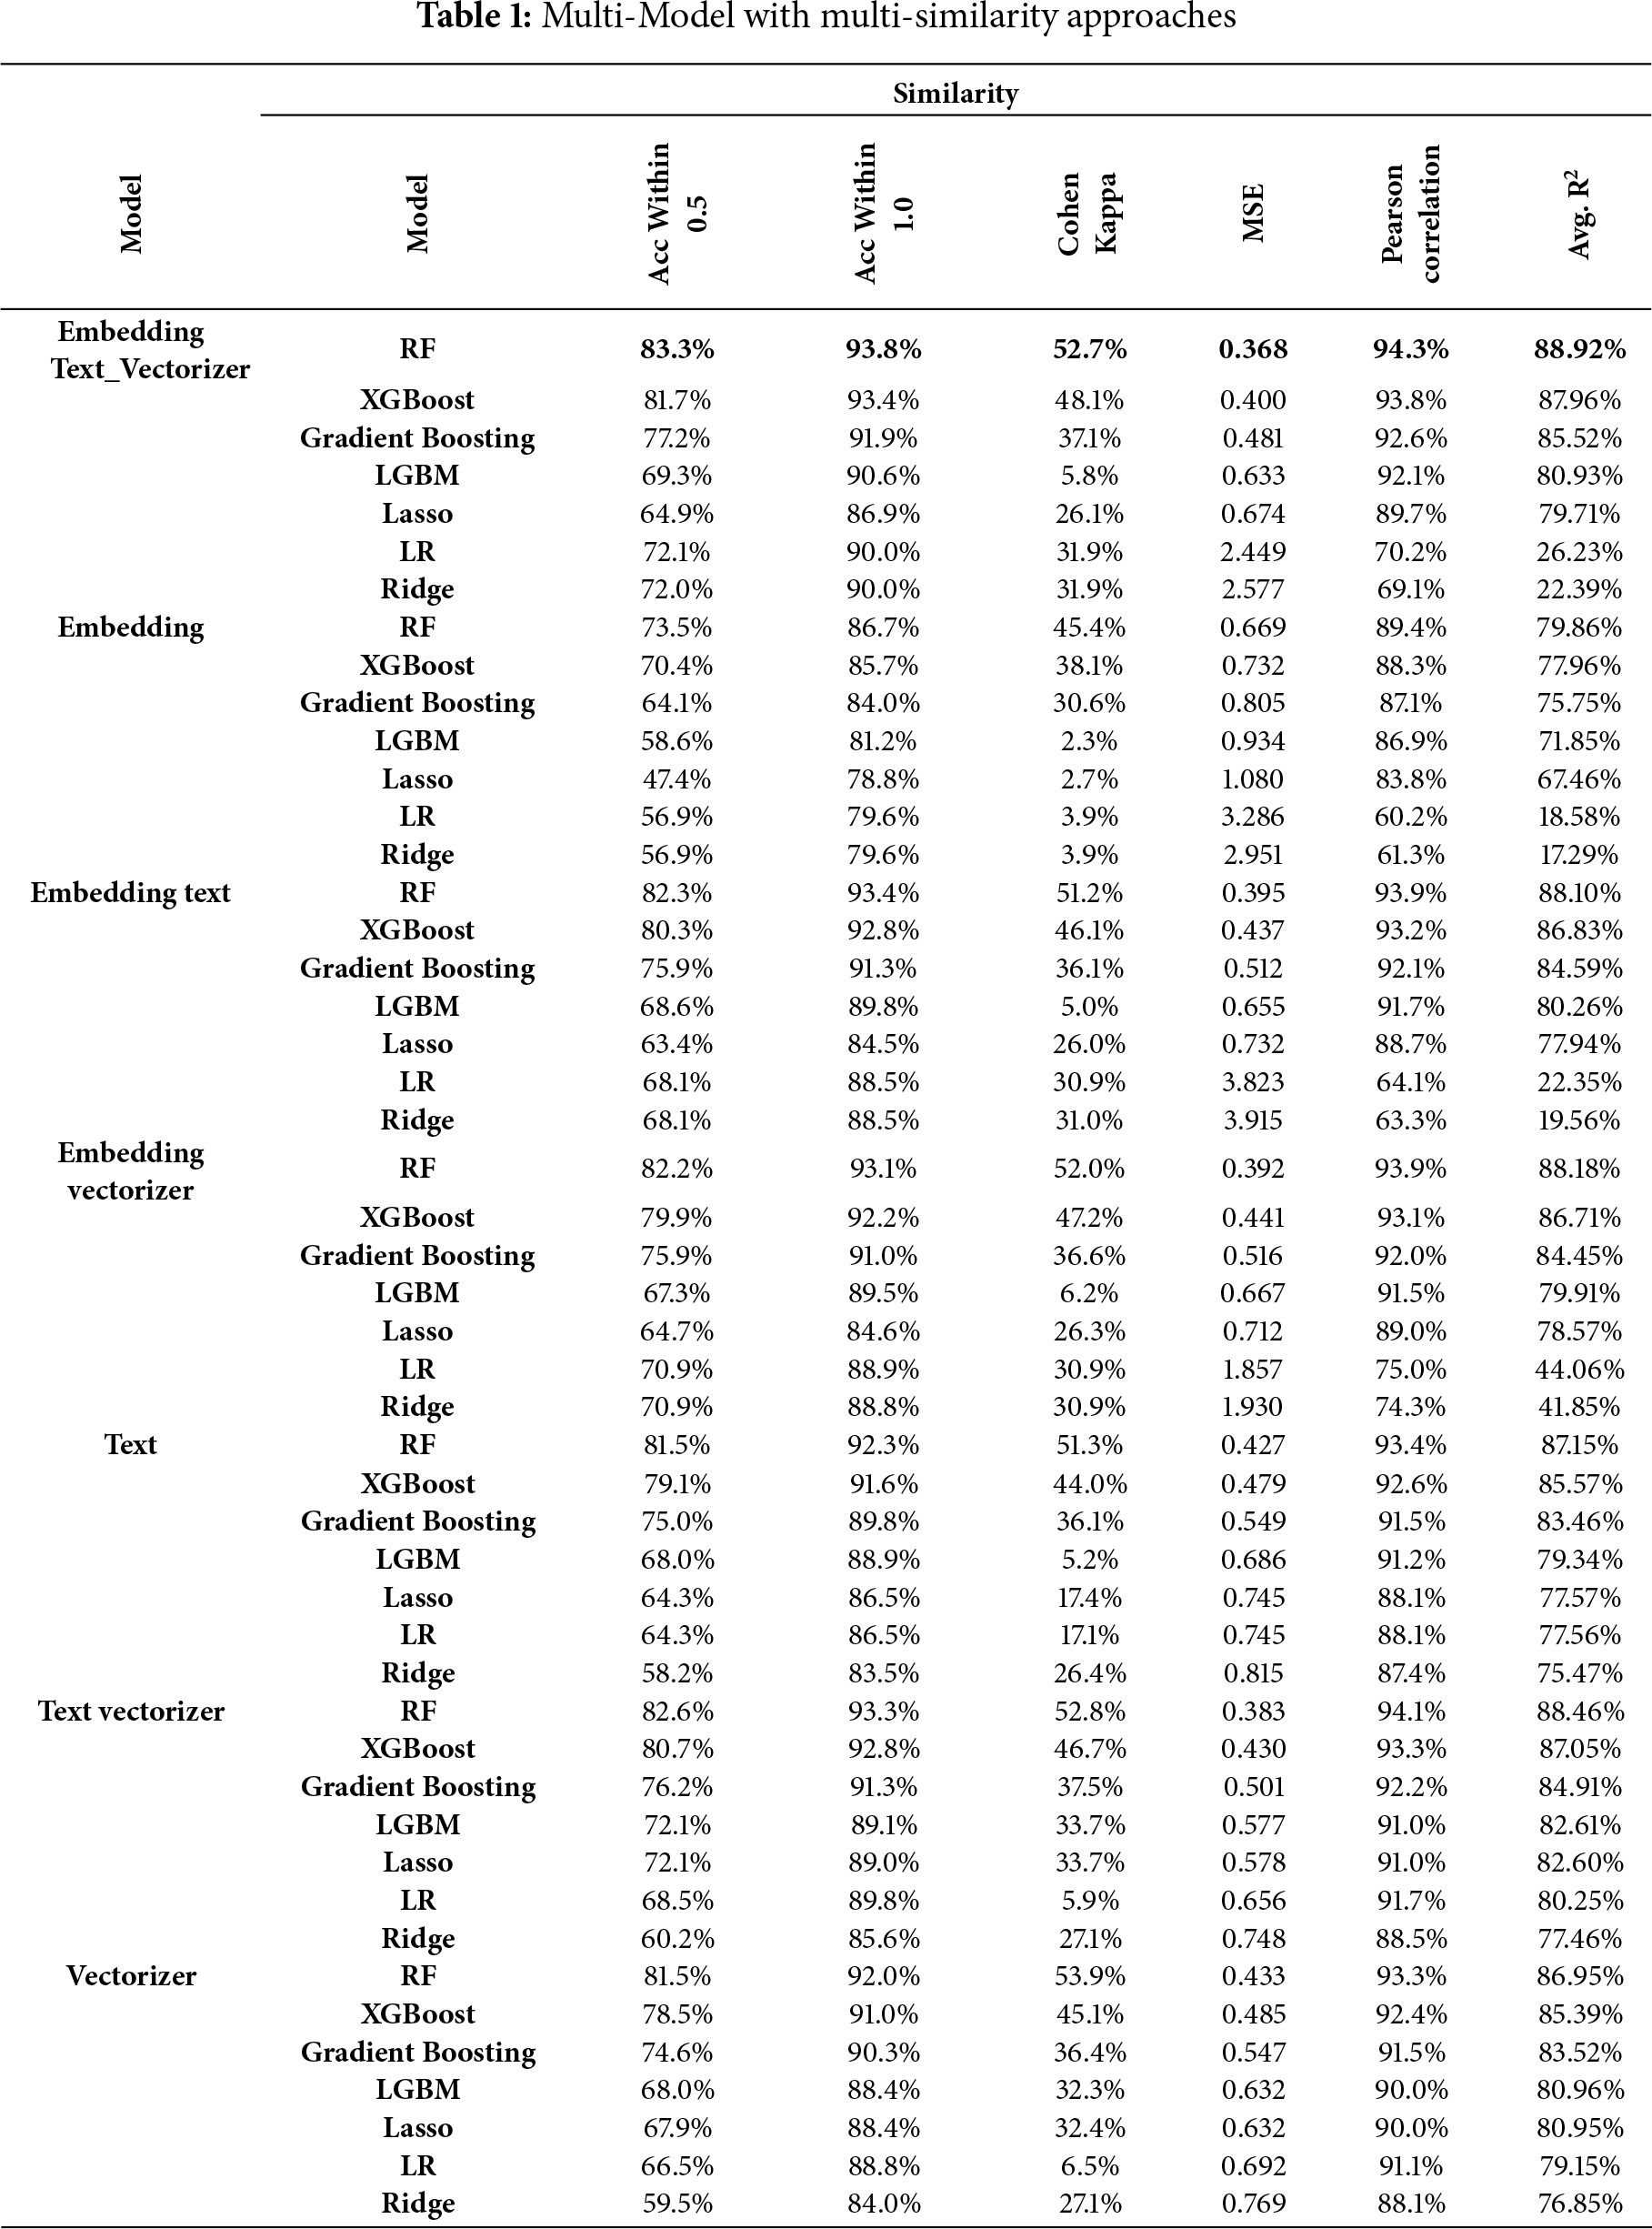
As presented in Table 1, several models were trained and evaluated, including RF, XGBoost, Gradient Boosting, LGBM, Linear Regression, Ridge, and Lasso.
The performance of the models was assessed based on the following key metrics: Accuracy within 0.5, 1.0, and 1.5 tolerance levels, Cohen’s Kappa, Mean Squared Error (MSE), Pearson Correlation, and R-squared (R2).
Based on Table 1, the overall results can be represented as follows:
• Best Similarity Group and Model: The combination of Embedding + Text + Vectorizer with the RF model yielded the best overall performance across almost all metrics. It achieved an Accuracy within 0.5 tolerance of 83.3%, and Accuracy within 1.0 tolerance of 93.8%. The Cohen’s Kappa was 52.7%, indicating a strong agreement between the predicted and actual scores. The R2 was 88.92%, and the Pearson Correlation was 94.3%, reflecting a very strong correlation between predicted and actual scores.
• XGBoost and Gradient Boosting: These models also performed well across multiple feature sets, especially with the Embedding + Text + Vectorizer and Embedding + Text combinations. The XGBoost model achieved an Accuracy within 1.0 tolerance of 93.4%, with a relatively high Cohen’s Kappa of 48.1% and R2 of 87.96%. However, it did not outperform RF.
• Other Models: Models such as Lasso, Linear Regression, and Ridge showed significantly lower performance across all similarity groups. For instance, in the Embedding + Text + Vectorizer group, Lasso achieved only 64.9% accuracy within 0.5 tolerance and an R2 of 79.71%. Similarly, Linear Regression and Ridge struggled with high MSE values and poor agreement (low Cohen’s Kappa) compared to the more advanced tree-based models.
• Embedding + Text Group: The RF model continued to demonstrate strong performance with the Embedding + Text similarity group, achieving an Accuracy within 1.0 tolerance of 93.4% and an R2 of 88.10%. While the performance slightly decreased compared to the Embedding + Text + Vectorizer combination, the results were still among the best, proving that this group is a solid alternative when fewer features are desirable.
• Vectorizer Alone: Using only the Vectorizer feature set, the performance of all models dropped. However, RF still managed an Accuracy within 1.0 tolerance of 92.0%, showing that even this limited feature set can still perform relatively well with the right model. However, the R2 dropped to 86.95%, which is lower than when additional features were used.
This experiment demonstrated the importance of combining multiple similarity features (Embedding, Text, and Vectorizer) for achieving the best predictive accuracy in essay scoring. The RF model consistently outperformed other models across most feature groups, particularly with the Embedding + Text + Vectorizer combination. The high performance of XGBoost and Gradient Boosting models also highlights the effectiveness of tree-based ensemble methods for this task.
In contrast, simpler models such as Lasso, Linear Regression, and Ridge struggled to capture the complexity of the data and did not perform as well, particularly when using richer feature sets. The results suggest that using advanced tree-based models in combination with multiple similarity groups yields the most reliable and accurate predictions, closely mimicking human grading behavior.
The findings from this experiment will inform the choice of models and feature sets in subsequent experiments, where additional optimizations such as feature selection will be tested to further refine the scoring model.
4.3 Experiment 3: Feature Selection on the Best Model
In this experiment, the primary objective was to optimize the performance of the best model identified in the previous experiment (RF with the Embedding + Text + Vectorizer similarity group) by selecting the most important correlated features. The goal was to identify the optimal number of features that maximized the model’s accuracy, without introducing unnecessary complexity. As presented in Table 2, the feature selection process involved incrementally adding one feature at a time, starting from one feature up to 20 features. The model was evaluated after each addition using the following metrics: Accuracy within 0.5, 1.0, and 1.5 tolerance levels, Cohen’s Kappa, Mean Squared Error (MSE), Pearson Correlation, and R-squared (R2). Fig. 4 summarizes the performance of the model as more features were added.
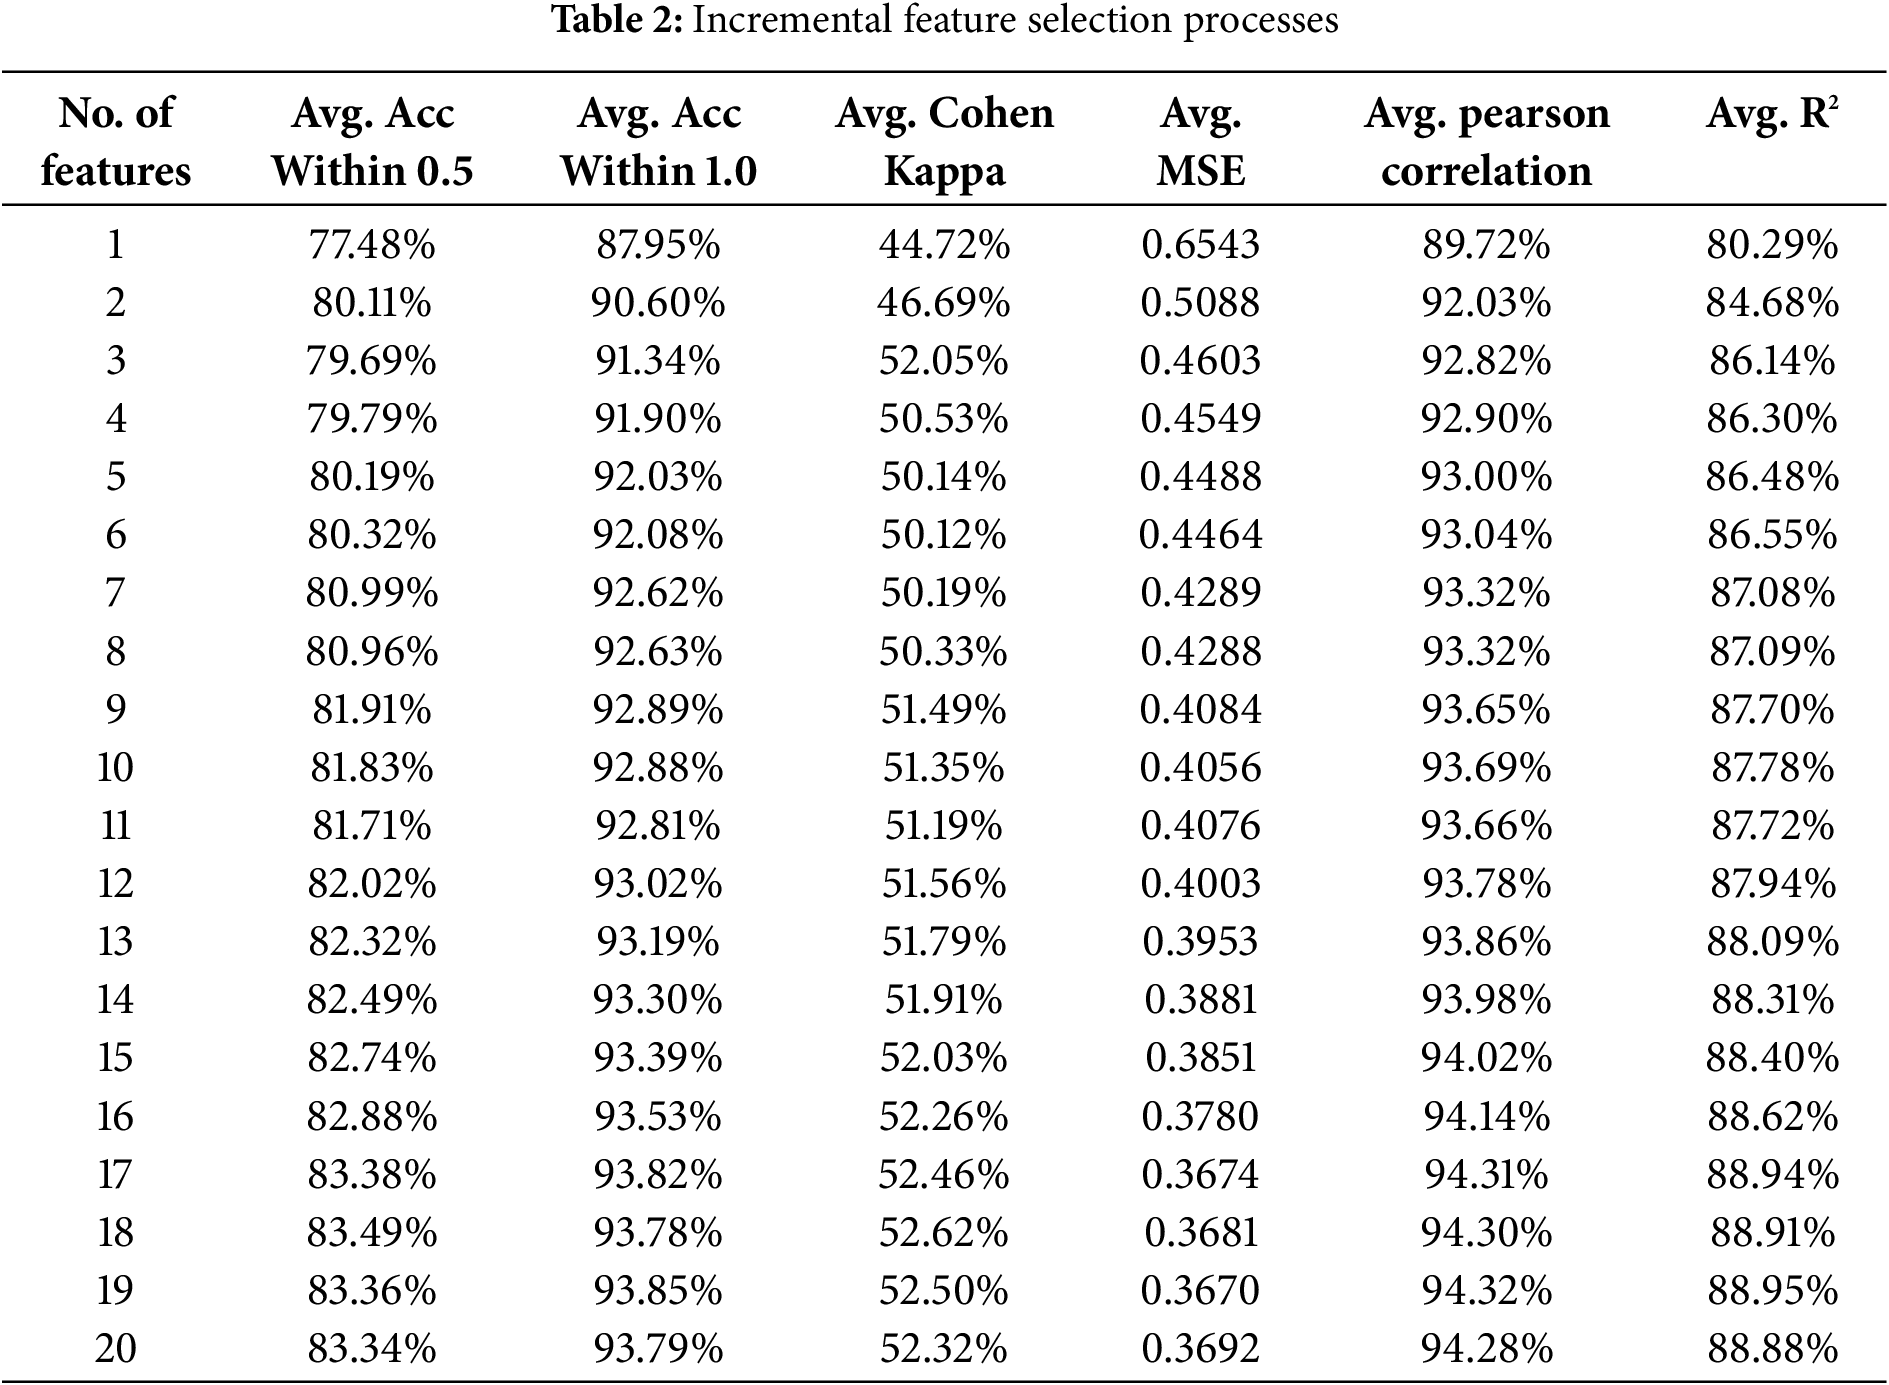
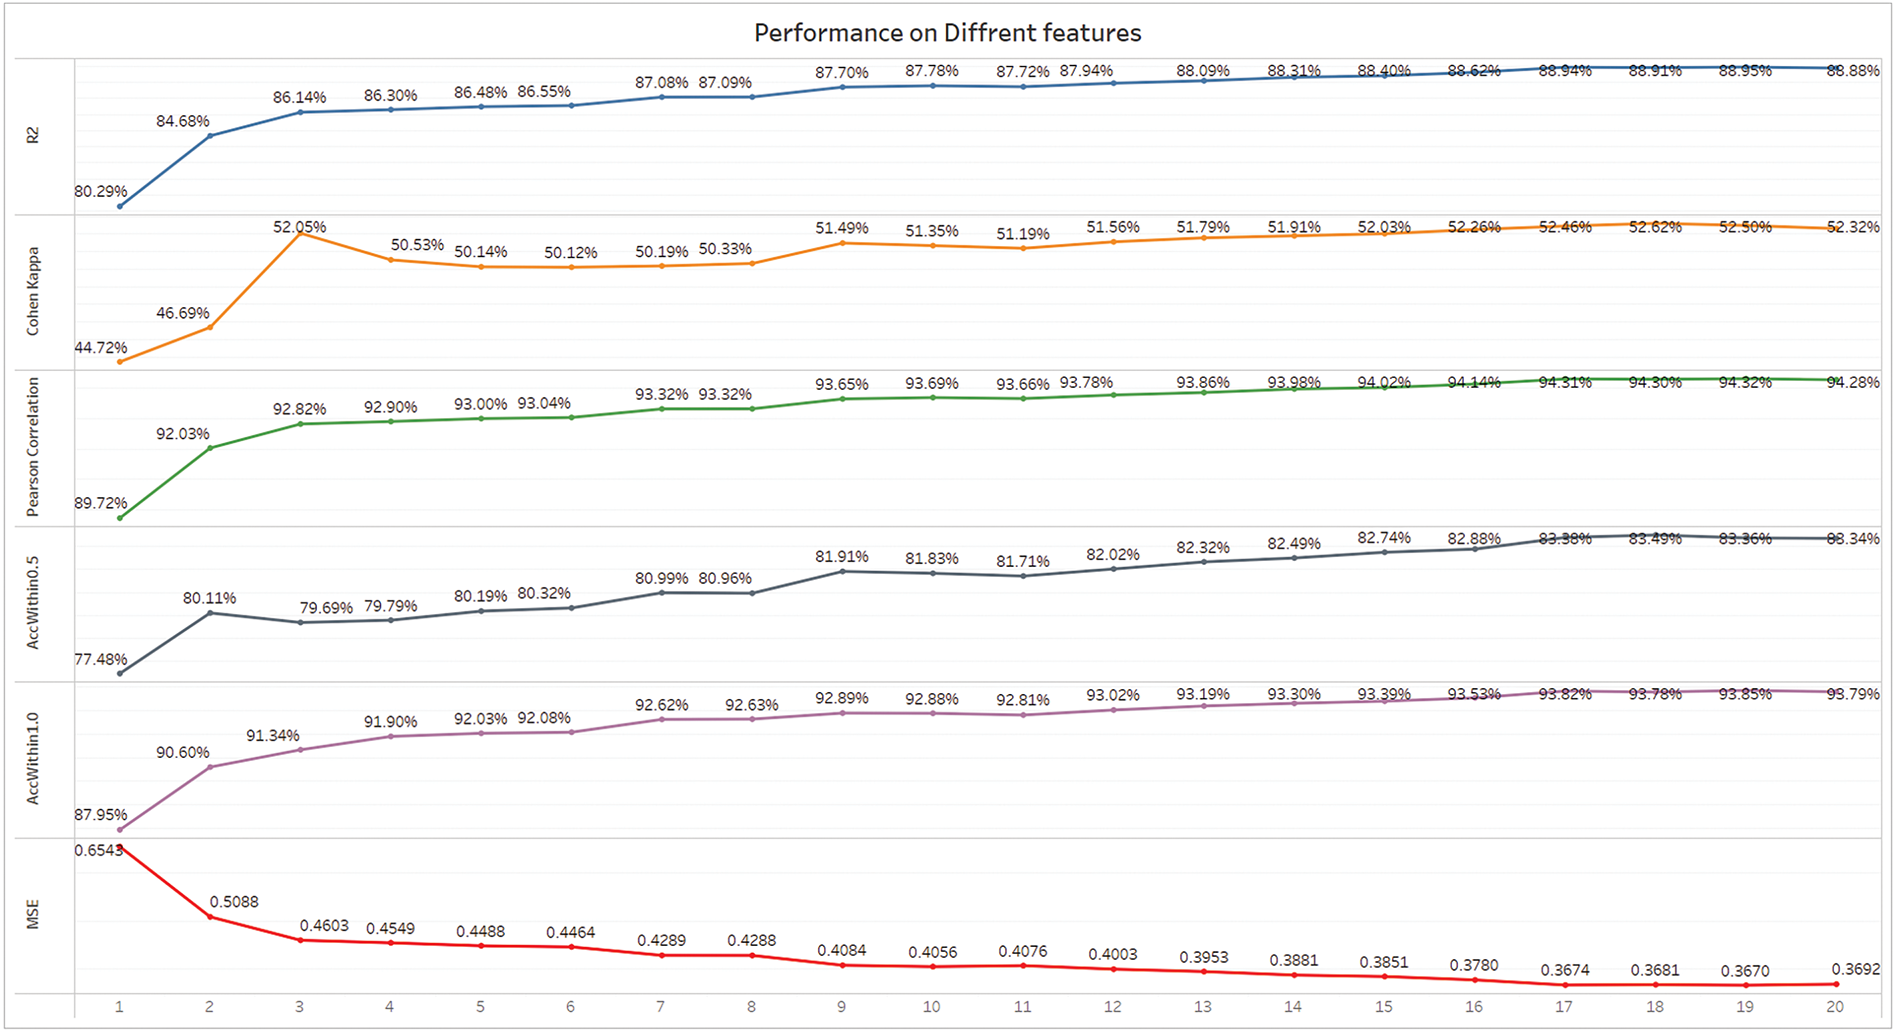
Figure 4: Performance of Models on different features
Based on the conducted results in Fig. 4, the following results are explored:
• Best Performance Based on R2 and Cohen’s Kappa: According to both the R2 and Cohen’s Kappa metrics, the model reached its peak performance with 19 features. The R2 value was 88.95%, indicating that 88.95% of the variance in essay scores was explained by the model, while the Cohen’s Kappa value was 52.50%, reflecting strong agreement between the model’s predictions and human-graded scores. These two metrics together suggest that 19 features provide the best balance between model accuracy and consistency with human grading.
• Performance across Metrics:
– The Accuracy within 1.0 tolerance was 93.85%, meaning that in 93.85% of cases, the model’s predictions were within 1 point of the actual human-assigned scores.
– Pearson Correlation reached 94.32%, indicating a very strong correlation between predicted and actual scores.
– The MSE was also low at 0.3670, showing that the model had a low average prediction error when 19 features were used.
Diminishing Returns Beyond 19 Features: While the model’s performance continued to improve as features were added up to 19, the gains began to diminish beyond that point. The addition of the 20th feature did not provide any significant improvements, with R2 slightly dropping to 88.88%. This suggests that 19 features strike the optimal balance between capturing the most important aspects of the data without overfitting.
This experiment highlights the importance of feature selection in enhancing the performance of the essay scoring model. The results indicate that using 19 features yields the best overall performance in terms of both R2 and Cohen’s Kappa. These metrics suggest that the model not only explains the variance in scores effectively but also replicates human grading patterns with a high level of accuracy and consistency.
By selecting 19 features, we can achieve the highest predictive power without overcomplicating the model, ensuring that it remains efficient while maintaining excellent performance. This feature selection strategy will be applied to future model iterations to further refine and improve essay scoring accuracy.
4.4 Experiment 4: Optimal Data Efficiency Training
In Experiment 4, the aim is to evaluate the impact of adding incremental amounts of training data on the model’s performance, measured by R2. The experiment seeks to determine the minimal data usage necessary to achieve a good balance between performance improvement and the cost of increased data usage. To achieve this, a utility function is used to calculate the trade-off between performance improvements and data increases.
4.4.1 Utility Function Definition
The utility function employed is:
where:
•
•
The goal of the experiment is to maximize U, where an optimal stopping point is achieved when the improvement in performance is substantial enough to justify the additional data usage. A higher utility score means a better balance between the model’s performance improvement and the amount of data used. Fig. 5 summarizes the R2 and related performance metrics obtained for different portions of training data in the validation and test datasets.
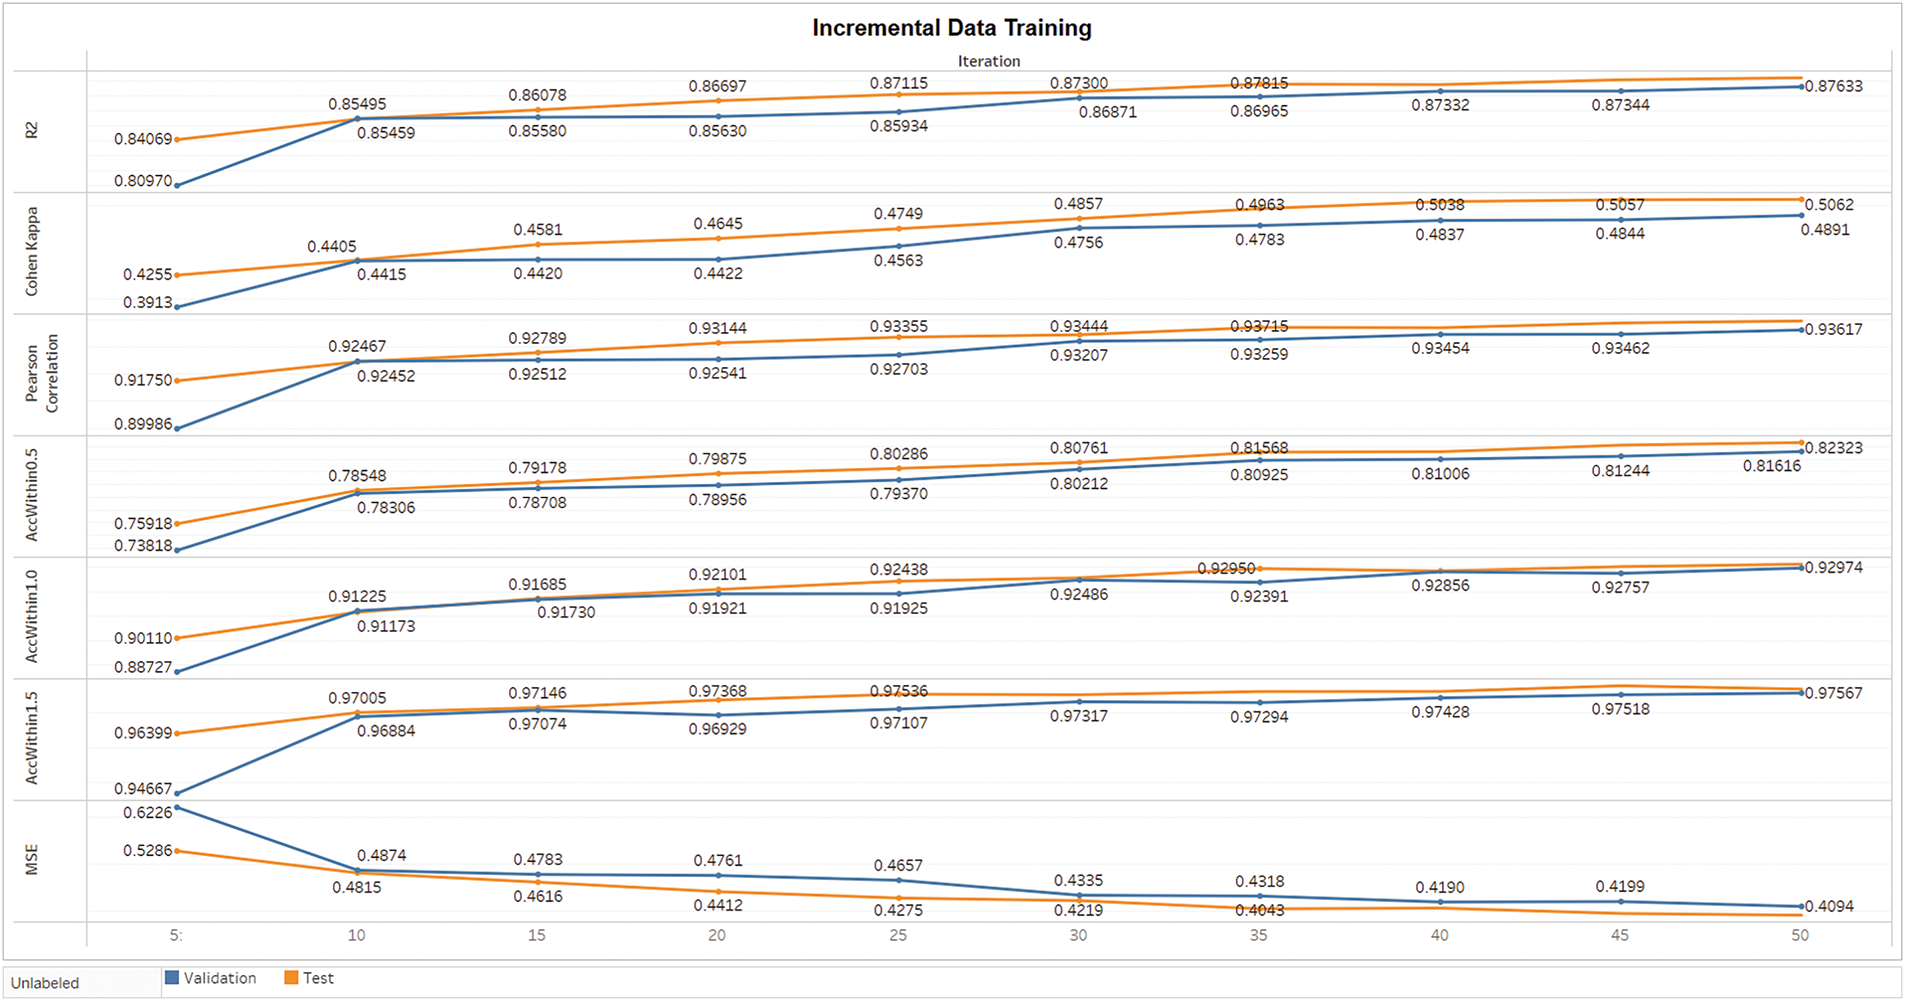
Figure 5: Incremental data training of models
4.4.2 Performance vs. Data Usage Trade-Off
In machine learning, increasing the size of the training data typically leads to better performance. However, this improvement follows a law of diminishing returns—the more data is added, the smaller the incremental improvement becomes, while the cost of processing and handling the data continues to increase. Hence, this experiment applies a utility-based method to assess the point at which the additional data no longer justifies the marginal improvement in performance.
• Validation R2 values for different portions of training data were computed to evaluate the model’s performance.
• The percentage increase in data usage was tracked, and the improvement in performance (ΔP) was calculated as the difference in R2 between consecutive portions of data.
• The utility score was calculated for each portion of the data, allowing us to compare the trade-offs.
The best performance from Experiment 3 serves as a benchmark with R2 = 88.95%. In this experiment, the focus is on the improvement in R2 with each increment of training data and the corresponding increase in data usage.
4.4.4 Validation Data R2 Values
The R2 values obtained from the validation data across different portions of training data were as follows:
• 5% of training data: R2 = 80.97%
• 10% of training data: R2 = 85.49%
• 15% of training data: R2 = 85.58%
• 20% of training data: R2 = 85.63%
• 25% of training data: R2 = 86.87%
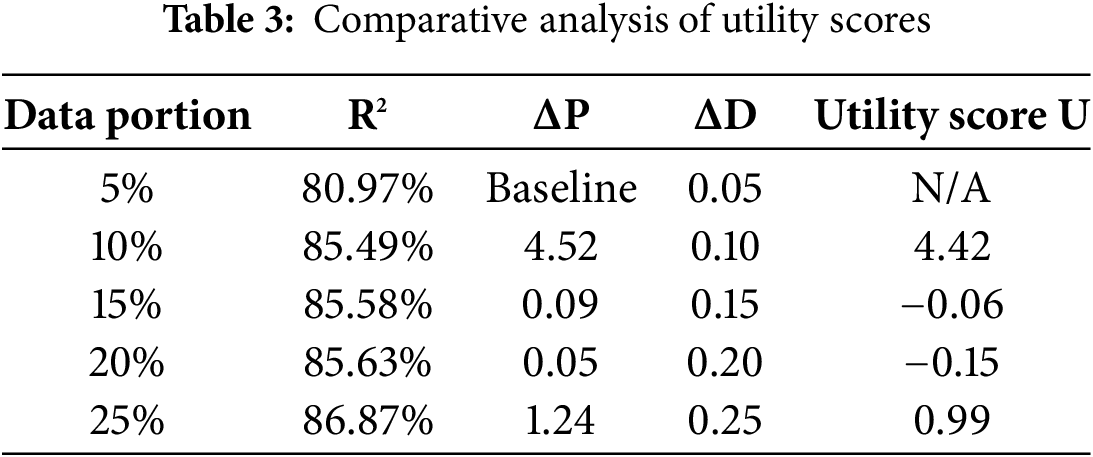
As presented in Table 3, the utility for each portion of training data is calculated using the difference in R2 (performance improvement) and the Optimal Data Efficiency Training increase. Here’s how the utility function was applied:
(A) 5% of Training Data (Baseline):
• R2 = 80.97%
• Performance Improvement (ΔP): This is the baseline, so there is no comparison to previous steps.
• Data Increase (ΔD): ΔD = 0.05
• Utility: Baseline, no utility calculated.
(B) 10% of Training Data:
• R2 = 85.49%
• Performance Improvement (ΔP): ΔP = 85.49 − 80.97 = 4.52
• Data Increase (ΔD): ΔD = 0.10
• Utility: U = 4.52 − 0.10 = 4.42
– Analysis: The addition of 5% more data results in a significant performance improvement, yielding a high utility score of 4.42. This suggests that the model benefits considerably from the extra data, making this a very efficient point in terms of the trade-off between performance and data.
(C) 15% of Training Data:
• R2 = 85.58%
• Performance Improvement (ΔP): ΔP = 85.58 – 85.49 = 0.09
• Data Increase (ΔD): ΔD = 0.15
• Utility: U = 0.09–0.15 = −0.06
– Analysis: Increasing the training data to 15% leads to only a marginal improvement in performance (0.09 increase in R2), resulting in a negative utility score of −0.06. The performance gain does not justify the increase in data usage at this point.
(D) 20% of Training Data:
• R2 = 85.63%
• Performance Improvement (ΔP): ΔP = 85.63 − 85.58 = 0.05
• Data Increase (ΔD): ΔD = 0.20
• Utility: U = 0.05 − 0.20 = −0.15
– Analysis: At 20%, the performance improvement is negligible, resulting in a utility score of −0.15. This suggests that further increases in data usage are yielding diminishing returns, and the cost of data outweighs the performance gain.
(E) 25% of Training Data:
• R2 = 86.87%
• Performance Improvement (ΔP): ΔP = 86.87 − 85.63 = 1.24
• Data Increase (ΔD): ΔD = 0.25
• Utility: U = 1.24 − 0.25 = 0.99
– Analysis: At 25%, the model experiences a larger performance improvement compared to previous steps, resulting in a positive utility score of 0.99. However, the performance gain is still less efficient when compared to the earlier jump between 5% and 10% of data.
(F) Major Key Observations
• 5% to 10%: The model benefits the most from this increase, as the performance improvement is large relative to the increase in data usage, resulting in a high utility score of 4.42.
• 10% to 15% and beyond: The performance improvements beyond 10% are marginal and do not justify the additional data usage. This leads to negative utility scores at 15% and 20%.
• 25%: At 25%, the utility score becomes positive again due to a larger performance improvement, but the marginal gain in performance does not outweigh the smaller data increments seen at earlier steps.
4.4.6 Optimal Stopping Point at 10% of Training Data
The training data is used to determine the optimal stopping point based on the utility scores, and we find that this is 10% of the training data. Here, the model shows a large performance improvement (R2 = 85.49%) with only a small increase in data usage, achieving the highest utility score of 4.42. For 15% and 20% the utility scores are negative, indicating that the performance gains are no longer justified by the increase in data usage, and the gains become minimal after 10%. Although 25% has a positive utility score, it does not surpass the efficiency of 10%. As a result, 10% of the training data is the best choice, as it provides strong performance at the cost of the least amount of data usage.
The
The results section describes the results from four separate experiments, each aimed at understanding different aspects of essay scoring and model performance optimization. In Experiment 1, we determined the effect of different correlated features on model performance, and determined that 19 features yielded the best tradeoff between accuracy and efficiency as measured by the R2 curve. Experiment 2 compared different similarity approaches and models, and the RF model using the combination of Embedding, Text, and Vectorizer features performed the best in all metrics. In Experiment 3 we tested the effect of feature selection and found that model performance reached a peak of 19 selected features, resulting in significant improvements in metrics like R2, Cohen Kappa, and accuracy within tolerance levels. Experiment 4 then used Optimal Data Efficiency Training to determine the optimal amount of training data. We found that 10% of training data gave the best utility score, which balances performance gains and data usage well. The results across all four experiments show how careful feature, model, and data portion selection is crucial for building the most efficient and effective essay scoring model. Experiment 4 focused on the utility-based analysis of adding more data and clearly defined how to balance computational resources with performance.
Our methodology is primarily focused on the innovative engineering of features and the effective application of diverse similarity measures to achieve high performance with minimal data. While our current experiments utilize established machine learning algorithms such as Random Forest and XGBoost—which have yielded robust results—we recognize that there is potential for further improvements. Future work could explore advanced hyperparameter optimization techniques, the integration of deep learning architectures, and ensemble strategies to further enhance predictive accuracy. However, the strength of our approach lies in its efficient use of limited data, making it particularly well-suited for low-resource scenarios in Arabic Automated essay scoring. This emphasis on feature engineering and efficient similarity computation not only underpins our current results but also provides a promising foundation for future enhancements.
While our approach combines text-, vector-, and embedding-based similarity measures with a focus on robust feature engineering and minimal data usage, large language models (LLMs) like GPT are pre-trained on extensive datasets and excel at end-to-end language understanding. However, LLMs require substantial computational resources and large-scale annotated data, often operating as opaque, black-box systems. In contrast, our method is tailored for low-resource scenarios, providing a more interpretable and efficient solution for Arabic AES. The research questions posed in the introduction are answered in this section through analysis of the results of the four experiments to give a thorough understanding of the performance, efficiency and scalability of Arabic Automated essay scoring (AES) systems. This study explores the data efficiency, similarity measures, and hybrid models to reveal the key factors that affect the effectiveness of AES models for Arabic language.
Research Question 1: What is the optimal amount of training data required to achieve a balance between model performance and computational efficiency?
This research question was addressed in Experiment 4, which involved Optimal Data Efficiency Training to assess the impact of increasing portions of training data on model performance, particularly measured by R2. The results showed that while the performance of the AES model improves with more data, the improvements follow a pattern of diminishing returns.
At 5% of training data, the model achieved an R2 of 80.97%, which increased to 85.49% when 10% of the data was used. This marked a significant performance improvement with a relatively small increase in data usage, yielding the highest utility score of 4.42. However, as more data was added, the performance gains became marginal, with only slight increases in R2 for 15%, 20%, and 25% of the data, resulting in negative utility scores beyond 10%. This experiment underscores the importance of balancing performance gains with computational resources. The results indicate that 10% of the training data provides the most efficient trade-off, delivering substantial accuracy without requiring excessive data. This finding is particularly relevant in low-resource settings where annotated data for Arabic essays is scarce, as it demonstrates that high performance can be achieved with a relatively small dataset.
Research Question 2: How do different similarity measures and feature combinations affect the performance of Arabic AES models?
In Experiments 1, 2, and 3, we explored the impact of different similarity measures and their combinations on the effectiveness of text-based, vector based, and embedding based approaches, as well as combinations of these methods.
• Text-Based Similarity: These methods were effective at capturing surface level text similarities, using traditional text similarity techniques such as Jaccard and Levenshtein. But they were not able to perform well in cases where semantic relationships were deeper. For example, in Experiment 1, text based approaches barely helped to boost accuracy, but this helped to boost accuracy a bit more and then plateaued as more features were added.
• Vector-Based Similarity: Here, I transformed text into vectors using techniques such as TF-IDF and then calculated similarity using measures like cosine similarity and block distance. It was more robust than text based approaches, as it captures more complex relationships between words. However, vector based methods were not enough for optimal performance.
• Embedding-Based Similarity: Of the three approaches, the most powerful was an embedding-based similarity, which leverages pre-trained word embedding such as Word2Vec and FastText. Experiment 2 shows that these models capture semantic meaning and contextual relationships between words, and perform better than the baseline. For example, the RF model with embedding-based features and vector-based and text-based features performed the best overall across all similarity measures.
Experiment 2 shows that the combination of all three similarity measures (text-based, vector-based, and embedding-based) was the most effective. We find that the RF model trained on this hybrid feature set achieves the best overall performance with 83.3% accuracy within 0.5 tolerance level and R2 of 88.92%. This shows that the combination of different similarity methods, surface-level features, lexical representations, and deep semantic relationships, leads to a more holistic and accurate scoring system.
The implication of these findings is that hybrid models combining multiple feature types are valuable. The best overall results were achieved by combining all feature types, and while embedding based methods showed the greatest improvement. Thus, a multi-faceted approach based on the strengths of different similarity measures is suggested to score Arabic essays.
This study also contributes to shedding light on some broader challenges in Arabic AES, in particular those stemming from the linguistic complexity of Arabic. Arabic’s morphology, diglossia, and extensive use of root-based word forms make it a difficult language for text processing. Embedding-based methods are successful because deep semantic relationships between words are important to scoring Arabic essays. The AES models can overcome some of the challenges posed by the language’s complexity by using pre-trained word embedding such as Word2Vec and FastText, which are specifically trained on large Arabic corpora. Additionally, this study shows the significance of data efficiency in Arabic AES. Experiment 4 results demonstrate the potential to achieve high performance with relatively little data given the scarcity of large, annotated Arabic essay datasets. The AES model was able to reach a performance close to the best attained with the full dataset by using 10% of the training data efficiently. For educational institutions and researchers with limited Arabic essay data, this insight is especially valuable, as small but well-annotated datasets can still produce high-quality AES models. This study has important implications for the future development of Arabic AES systems. Second, hybrid models consisting of combining several similarity measures should be the new standard, as they achieve the best trade-off between robustness and accuracy. Second, the results on data efficiency indicate that future research should concentrate on data augmentation and transfer learning techniques that improve the performance of AES models in low-resource environments. Finally, the demonstrated success of embedding-based approaches suggests that more work should be done on developing Arabic contextual embedding and pre-trained models that can be further used to improve the accuracy of AES systems. The paper has demonstrated that a good mix of embedding-based, text-based, and vector-based similarity measures can be used together to score Arabic essays effectively. With 10% of training data, the tradeoff between data usage and performance was found to be optimal: it gave near-peak performance without incurring unnecessary computational costs. This study answers the research questions and offers valuable insights into the design of efficient, scalable, and accurate Arabic AES systems that can be used in educational institutions around the Arabic-speaking world.
In this paper, we present a comprehensive approach to Automated essay scoring (AES) for Arabic, which overcomes the language’s linguistic challenges while minimizing model performance and data efficiency. We evaluated the effect of different text-based, vector-based, and embedding-based similarity measures, and the effect of training data size on model accuracy through a series of experiments. An RF model combining hybrid embedding, text, and vector features gave an R2 of 88.92%, 83.3% accuracy within a 0.5 tolerance, and a Cohen Kappa of 52.7%. The most interesting result from the study was that near-peak performance could be obtained using only 10 percent of the training data, which reduced computational costs without sacrificing accuracy. This finding is especially pertinent in the absence of large, annotated Arabic essay datasets. The model’s capability to perform well with little data paves the way for further application in educational systems throughout Arabic-speaking regions. The study also highlights the need for embedding-based approaches, especially for capturing the deep semantic relationships characteristic of Arabic’s rich morphology and syntax. While the best overall performance was achieved by integrating text-based and vector-based features with embedding, this was key. This is a good indication of the power of hybrid models, where different feature types work together to create a more robust and accurate scoring system. Finally, this work makes several important contributions to the field of Arabic AES by showing the effectiveness of hybrid models, efficient use of data, and the strength of deep semantic features. The proposed model presents a scalable, accurate, and efficient scoring solution for Arabic essays with clear application in educational institutions. Future work should investigate the combination of transfer learning, domain-specific embedding, and more sophisticated neural architectures to improve the generalization and accuracy of AES systems for Arabic.
Acknowledgement: We sincerely acknowledge the Deanship of Graduate Studies and Scientific Research at Jouf University for their valuable support and contribution to this work.
Funding Statement: This work was funded by Deanship of Graduate studies and Scientific Research at Jouf University under grant No. (DGSSR-2024-02-01264).
Author Contributions: Conceptualization, Mohamed Ezz, Ayman Mohamed Mostafa and Alaa S. Alaerjan; methodology, Meshrif Alruily, Abdulaziz Shehab, Mohamed Ezz and Ayman Mohamed Mostafa; data curation, Bader Aldughayfiq, Mohamed Ezz and Ayman Mohamed Mostafa; formal analysis, Alaa S. Alaerjan and Meshrif Alruily; investigation, Hisham Allahem, Mohamed Ezz and Abdulaziz Shehab; resources, Bader Aldughayfiq, Ayman Mohamed Mostafa and Mohamed Ezz; supervision, Meshrif Alruily, Alaa S. Alaerjan and Mohamed Ezz; writing—original draft, Ayman Mohamed Mostafa, Bader Aldughayfiq, Mohamed Ezz and Hisham Allahem; writing—review and editing, Abdulaziz Shehab, Meshrif Alruily and Hisham Allahem. All authors reviewed the results and approved the final version of the manuscript.
Availability of Data and Materials: The authors confirm that the data supporting the findings of this study are available within the article.
Ethics Approval: As this research relies on publicly available healthcare datasets, no direct data from humans or patients was used, and therefore formal ethical approval was not required. The study adheres to ethical guidelines for handling public datasets, ensuring compliance with data privacy and confidentiality standards.
Conflicts of Interest: The authors declare no conflicts of interest to report regarding the present study.
References
1. Machhout RA, Zribi CBO, Bouzid SM. Arabic automatic essay scoring systems: an overview study. In: Abraham A, Gandhi N, Hanne T, Hong T-P, Nogueira Rios T, Ding W, editors. Intelligent systems design and applications. Cham, Switzerland: Springer International Publishing; 2022. p. 1164–76. doi:10.1007/978-3-030-96308-8_108. [Google Scholar] [CrossRef]
2. Abdeljaber HA. Automatic Arabic short answers scoring using longest common subsequence and Arabic WordNet. IEEE Access. 2021;9:76433–45. doi:10.1109/access.2021.3082408. [Google Scholar] [CrossRef]
3. Azmi AM, Al-Jouie MF, Hussain M. AAEE—Automated evaluation of students’ essays in Arabic language. Inf Process Manag. 2019;56(5):1736–52. doi:10.1016/j.ipm.2019.05.008. [Google Scholar] [CrossRef]
4. Abo-Elghit AH, Hamza T, Al-Zoghby A. Embedding extraction for Arabic text using the AraBERT model. Comput Mater Contin. 2022;72(1):1967–94. doi:10.32604/cmc.2022.025353. [Google Scholar] [CrossRef]
5. Alobed M, Altrad AMM, Bakar ZBA. An adaptive automated arabic essay scoring model using the semantic of Arabic WordNet. In: 2021 2nd International Conference on Smart Computing and Electronic Enterprise (ICSCEE); 2021 Jun 15–17; Cameron Highlands, Malaysia. [Google Scholar]
6. Yanes N, Mostafa AM, Ezz M, Almuayqil SN. A machine learning-based recommender system for improving students learning experiences. IEEE Access. 2020;8:201218–35. doi:10.1109/ACCESS.2020.3036336. [Google Scholar] [CrossRef]
7. Lotfy N, Shehab A, Elhoseny M, Abu-Elfetouh A. An enhanced automatic Arabic essay scoring system based on machine learning algorithms. Comput Mater Contin. 2023;77(1):1227–49. doi:10.32604/cmc.2023.039185. [Google Scholar] [CrossRef]
8. Badry RM, Ali M, Rslan E, Kaseb MR. Automatic Arabic grading system for short answer questions. IEEE Access. 2023;11:39457–65. doi:10.1109/access.2023.3267407. [Google Scholar] [CrossRef]
9. Gomaa WH, Fahmy AA. Ans2vec: a scoring system for short answers. In: The International Conference on Advanced Machine Learning Technologies and Applications (AMLTA2019); 2020 Mar 28–30; Cairo, Egypt. [Google Scholar]
10. Alammary AS. Arabic questions classification using modified TF-IDF. IEEE Access. 2021;9:95109–22. doi:10.1109/access.2021.3094115. [Google Scholar] [CrossRef]
11. Nael O, ELmanyalawy Y, Sharaf N. AraScore: a deep learning-based system for Arabic short answer scoring. Array. 2022;13(4):100109. doi:10.1016/j.array.2021.100109. [Google Scholar] [CrossRef]
12. Meccawy M, Bayazed AA, Al-Abdullah B, Algamdi H. Automatic essay scoring for arabic short answer questions using text mining techniques. Int J Adv Comput Sci Appl. 2023;14(6):768–75. doi:10.14569/ijacsa.2023.0140682. [Google Scholar] [CrossRef]
13. Soulimani YA, El Achaak L, Bouhorma M. Deep learning based Arabic short answer grading in serious games. Int J Electr Comput Eng. 2024;14(1):841–53. doi:10.11591/ijece.v14i1.pp841-853. [Google Scholar] [CrossRef]
14. Alghamdi M, Alkanhal M, Al-Badrashiny M, Al-Qabbany A, Areshey A, Alharbi A. A hybrid automatic scoring system for Arabic essays. AI Commun. 2014;27(2):103–11. doi:10.3233/aic-130586. [Google Scholar] [CrossRef]
15. Alsanie W, Alkanhal MI, Alhamadi M, Alqabbany AO. Automatic scoring of Arabic essays over three linguistic levels. Prog Artif Intell. 2022;11(1):1–13. doi:10.1007/s13748-021-00257-z. [Google Scholar] [CrossRef]
16. Kusuma JS, et al. Automated essay scoring using machine learning. In: Proceedings of 2022 4th International Conference on Cybernetics and Intelligent System (ICORIS); 2022 Oct 8–9; Prapat, Indonesia. [Google Scholar]
17. Alqahtani, Alsaif A. Automatic evaluation for Arabic essays: a rule-based system. In: Proceedings of 2019 IEEE International Symposium on Signal Processing and Information Technology (ISSPIT); 2019 Dec 10–12; Ajman, United Arab Emirates. [Google Scholar]
18. Jong Y-J, Kim Y-J, Ri O-C. Improving performance of automated essay scoring by using back-translation essays and adjusted scores. Math Probl Eng. 2022;2022(1):6906587. doi:10.1155/2022/6906587. [Google Scholar] [CrossRef]
19. Jeon S, Strube M. Countering the influence of essay length in neural essay scoring. In: Proceedings of the Second Workshop on Simple and Efficient Natural Language Processing; 2021 Nov 10; Virtual. [Google Scholar]
20. Liu J, Xu Y, Zhu Y. Automated essay scoring based on two-stage learning. arXiv:1901.07744. 2019. [Google Scholar]
21. Cozma M, Butnaru AM, Ionescu RT. Automated essay scoring with string kernels and word embeddings. arXiv:1804.07954. 2018. [Google Scholar]
22. Wu L. Automatic english essay scoring algorithm based on machine learning. In: Proceedings of the 2023 IEEE International Conference on Integrated Circuits and Communication Systems (ICICACS); 2023 Feb 24–25; Raichur, India. p. 1–4. doi:10.1109/ICICACS57338.2023.10099945. [Google Scholar] [CrossRef]
23. Ran Y, He B, Xu J. A study on performance sensitivity to data sparsity for automated essay scoring. In: Liu W, Giunchiglia F, Yang B, editors. Knowledge science, engineering and management (KSEM 2018). Cham, Switzerland: Springer; 2018. doi:10.1007/978-3-319-99365-2_9. [Google Scholar] [CrossRef]
24. Kumar VS, Boulanger D. Automated essay scoring and the deep learning black box: how are rubric scores determined? Int J Artif Intell Educ. 2021;31(3):538–84. doi:10.1007/s40593-020-00211-5. [Google Scholar] [CrossRef]
25. Boulanger D, Kumar V. Deep learning in automated essay scoring. In: Proceedings of the 14th International Conference, ITS 2018; 2018 Jun 11–15; Montreal, QC, Canada. Cham, Switzerland: Springer; 2018. [Google Scholar]
26. Gaheen MM, El Eraky RM, Ewees AA. Automated students Arabic essay scoring using trained neural network by e-jaya optimization to support personalized system of instruction. Educ Inf Technol. 2021;26(1):1165–81. doi:10.1007/s10639-020-10300-6. [Google Scholar] [CrossRef]
27. Al-Shalabi EF. An automated system for essay scoring of online exams in Arabic based on stemming techniques and Levenshtein edit operations. arXiv:1611.02815. 2016. [Google Scholar]
Cite This Article
 Copyright © 2026 The Author(s). Published by Tech Science Press.
This work is licensed under a Creative Commons Attribution 4.0 International License , which permits unrestricted use, distribution, and reproduction in any medium, provided the original work is properly cited.
 Downloads
 Citation Tools