
 Submit a Paper
 Propose a Special lssue
 Open Access
ARTICLE

GSLDWOA: A Feature Selection Algorithm for Intrusion Detection Systems in IIoT
1 College of Software Engineering, Zhengzhou University of Light Industry, Zhengzhou, 450007, China
2 Information System Engineering College, PLA Cyberspace Force Information Engineering University, Zhengzhou, 450001, China
3 Intelligent Computing Research Department, Zhengzhou Xinda Institute of Advanced Technology, Zhengzhou, 450001, China
4 Network Security Research Department, Zhengzhou New Century Digital Technology Co., Ltd., Zhengzhou, 450007, China
* Corresponding Author: Wanwei Huang. Email:
(This article belongs to the Special Issue: Advances in Machine Learning and Artificial Intelligence for Intrusion Detection Systems)
Computers, Materials & Continua 2026, 86(1), 1-24. https://doi.org/10.32604/cmc.2025.068493
Received 30 May 2025; Accepted 14 August 2025; Issue published 10 November 2025
 View Full Text
 Download PDF
Abstract
Existing feature selection methods for intrusion detection systems in the Industrial Internet of Things often suffer from local optimality and high computational complexity. These challenges hinder traditional IDS from effectively extracting features while maintaining detection accuracy. This paper proposes an industrial Internet of Things intrusion detection feature selection algorithm based on an improved whale optimization algorithm (GSLDWOA). The aim is to address the problems that feature selection algorithms under high-dimensional data are prone to, such as local optimality, long detection time, and reduced accuracy. First, the initial population’s diversity is increased using the Gaussian Mutation mechanism. Then, Non-linear Shrinking Factor balances global exploration and local development, avoiding premature convergence. Lastly, Variable-step Levy Flight operator and Dynamic Differential Evolution strategy are introduced to improve the algorithm’s search efficiency and convergence accuracy in high-dimensional feature space. Experiments on the NSL-KDD and WUSTL-IIoT-2021 datasets demonstrate that the feature subset selected by GSLDWOA significantly improves detection performance. Compared to the traditional WOA algorithm, the detection rate and F1-score increased by 3.68% and 4.12%. On the WUSTL-IIoT-2021 dataset, accuracy, recall, and F1-score all exceed 99.9%.Keywords
The Industrial Internet of Things (IIoT) is the application of IoT technology in industrial fields. IIoT aims to connect various industrial production equipment and systems through the Internet to enable intelligent management and control. IIoT has brought significant opportunities and benefits to the industrial sector, promoting industrial upgrading and innovative development [1]. However, as the scope of the IIoT grows and the number of connected devices increases, security risks are becoming more prevalent, making the IIoT a target for hackers and other malicious actors. If an attack is successful, hackers can manipulate IoT devices, steal sensitive information, interfere with daily operations, and cause serious infrastructure damage. In the security protection system of the IIoT, an intrusion detection system (IDS) is a crucial starting point and a common means of protection [2]. Compared with other methods such as firewalls, network isolation, and encryption technologies, IDS offers distinct advantages, including ease of implementation and high detection accuracy [3].
In intrusion detection, attack features form the basis for identifying malicious behavior. In traditional network environments, these features are relatively stable and easy to capture [4]. In the IIoT context, however, attack features present new trends, including dimensional diversification (penetrating the device, control, and application layers), dynamicization (zero-day vulnerabilities and supply chain attacks cause features to change over time), and increased concealment (blending with normal industrial business flows). Consequently, feature extraction in the Industrial Internet of Things faces challenges such as difficulty fusing multi-source, heterogeneous data; high complexity parsing industrial protocols; dynamic changes in baseline normal behavior; and exacerbated class imbalance problems [5]. Therefore, feature selection from massive, complex data is crucial for dimensionality reduction, noise removal, cross-domain feature association, and adaptation to dynamic scenarios—all of which support the efficiency and accuracy of IIoT intrusion detection.
Feature selection is an effective data preprocessing method that can screen key feature subsets, reduce model training time and computing resource consumption, and enhance adaptability to dynamic environments. This method effectively solves the challenges faced by intrusion detection [6]. Existing feature selection algorithms tend to become trapped in local optima, exhibit high computational complexity, and lack adaptive learning abilities when processing high-dimensional, complex data. These algorithms cannot meet network security requirements such as real-time processing, accuracy, and adaptability. This paper proposes an improved Whale Optimization Algorithm (GSLDWOA: Gaussian Mutation, Non-linear Shrinking, Variable-step Levy Flight and Dynamic Differential Evolution Whale Optimization Algorithm) for feature selection to address the above problems. The goal is to improve the accuracy and efficiency of feature selection in IIoT intrusion detection scenarios, as well as reduce the rates of false and missed alarms. In the initial stage of the algorithm, the method employs a Gaussian Mutation mechanism to increase population diversity. In the iterative stage, Non-linear Shrinking factor strengthens global exploration in the early stage and extends the development stage in the later stage, thereby avoiding premature algorithm maturity. Variable-step Levy Flight operator is introduced in the random search stage to balance global exploration and local development. Dynamic Differential Evolution strategy combined with a Boltzmann distribution-based fitness evaluation strategy is introduced in the position update of the shrinking encirclement and bubble net predation stages to improve population diversity. This paper presents a method that selects the most representative feature subset through rational calculations, which effectively reduces the model’s training and testing time while improving its detection rate and accuracy. The main contributions of this paper are as follows:
• To enhance the diversity of the initial population, the preprocessed data set is initialized at the initial stage of the algorithm to generate an initial population containing multiple potential feature combinations. The Gaussian Mutation mechanism is then used to effectively increase the diversity of the population, laying the foundation for the subsequent algorithm to search for high-quality feature subsets.
• To overcome premature algorithm maturation and balance global exploration and local development, Non-linear Shrinking factor strategy is adopted. This strategy makes the shrinkage factor decrease slowly and nonlinearly. In the early stage of iteration, the algorithm’s global exploration ability is strengthened to fully search the solution space. In the later stage, the development stage is extended to prevent the algorithm from prematurely converging to a local optimal solution and to enhance its ability to solve complex problems.
• To achieve a precise balance between global exploration and local exploitation, as well as to improve population diversity, Variable-step Levy Flight operator is introduced in the random search phase. This operator precisely controls the balance between global exploration and local exploitation. At the same time, Dynamic Differential Evolution strategy combined with a fitness evaluation strategy based on the Boltzmann distribution is introduced in the position update of the shrinking encirclement and bubble net predation phases to increase population diversity and improve the efficiency of key feature subset screening.
The rest of this paper is organized as follows: Section 2 provides an overview of previous related work conducted by other researchers. Section 3 introduces the basic whale optimization algorithm and describes the proposed feature selection algorithm model and its update steps in detail. Section 4 introduces the experimental environment, relevant datasets, and evaluation metrics. It also conducts simulation experiments and performs a subsequent evaluation. Section 5 summarizes the work and discusses future work.
Traditional feature selection algorithms are categorized into three types: Filter, Embedded, and Wrapper methods [7]. These categories are based on how the algorithm is combined with the model during feature selection and how feature subsets are evaluated.
(1) Filter method
The filter method is independent of subsequent learning models, relying on inherent data properties to select features with higher scores as the final subset (based on a set threshold or ranking). It is suitable for initial data preprocessing, quickly reducing feature counts, lowering dimensionality, and providing concise input for subsequent models. Emmanuel et al. proposed a stacked classifier method combined with filter-based feature selection techniques. The experimental results showed that the stacked classifier outperformed a single estimator and other existing methods [8]. Gong et al. proposed the CONMI_FS algorithm, a novel feature selection evaluation method that selects the best feature subset with a high correlation to class variables and low redundancy between selected features. Experimental results demonstrate the high accuracy of CONMI_FS [9]. Wang et al. proposed IA-FLFS, an immune algorithm-based filtering local feature selection method. Compared to other local feature selection algorithms, IA-FLFS has significantly higher accuracy [10]. Ullah and Mahmoud proposed a filter-based feature selection model that evaluates features according to their information gain, considering each feature’s consistency, dependence, information content, and distance. Experimental results demonstrate that the proposed model significantly reduces computational and time complexity [11].
(2) Embedded method
Embedded feature selection combines the feature selection process with the training of the learning model. It automatically selects features while the model is being trained. This approach allows for better adaptation to the model’s structure and the data’s characteristics. The selected features are closely integrated with the model, improving its performance and interpretability. Liu et al. proposed an embedded feature selection method that uses the weighted Gini index (WGI). Comparisons with the Chi2, F-statistic, and Gini index feature selection methods showed that, when only a few features were selected, the F-statistic and Chi2 performed best [12]. Liu et al. proposed a lightweight IDS based on an embedded model (EM) for feature selection and a convolutional neural network (CNN) for attack detection and classification. They performed binary and multi-class classification on the CCD-INID-V1, BaIoT, and CIRA-CIC-DoHBrw-2020 datasets to evaluate the effectiveness of these learning-based security models [13]. Mokbal et al. proposed an IDS framework that uses extreme gradient boosting (XGBoost) and an embedded feature selection method. The proposed IDS framework successfully surpassed the evaluation on the test dataset in terms of both multi-classification and binary classification [14]. Nassreddine et al. proposed a method that combines correlation-based feature selection with XGBoost-based embedded technology. They used SMOTE-TOMEK technology to address the issue of data imbalance. The experimental results showed that the algorithm’s accuracy significantly improved [15].
(3) Wrapper method
In the wrapper method of feature selection, the learning model is used as an evaluation tool. It continuously tries different combinations of features and evaluates their pros and cons based on the learning model’s performance indicators on the validation set (such as accuracy, recall rate, and F1 value). Finally, it selects the subset of features with the best performance. Talpur et al. proposed a novel, wrapper-based Sand Cat Swarm Optimization (SCSO) technique. This technique replicates the hunting and searching strategies of sand cats. It has the advantage of avoiding local optimality and finding an ideal solution with minimal control variables [16]. Maseno and Wang proposed a sequential feature selection method that uses optimized extreme learning machine (ELM) and support vector machine (SVM) classifiers. They also adopted a genetic algorithm (GA) to optimize the ELM weights. The experimental results showed that the proposed model had better intrusion detection performance and accuracy [17]. Aryanti et al. proposed using the Copeland ranking method to aggregate feature weights from multiple wrapper methods, including recursive feature elimination (RFE), Boruta, and custom grid search. According to the experimental results, the proposed method can rank features obtained from various wrapper-based feature selection techniques, thereby improving software defect prediction [18]. Alazzam et al. proposed a new method of binarizing the continuous pigeon-inspired optimizer and compared its performance with that of the traditional binarization method used in continuous swarm intelligence algorithms. Their experimental results showed significant improvements in TPR, FPR, accuracy, and F-score with the proposed algorithm [19]. Vijayanand and Devaraj proposed a method that uses an improved Whale Optimization Algorithm (WOA) by combining genetic algorithm operators with WOA. This improves the search space of WOA, extracts useful features from network data, and enhances the efficiency of intrusion detection [20]. Huang et al. proposed a network intrusion detection feature selection algorithm based on an improved binary pigeon swarm optimization (BPSO) algorithm. According to the experimental results, this method effectively reduces the system training time and improves the detection rate by selecting the most representative feature subset through reasonable calculation [21].
In summary, the current feature selection methods have made progress in addressing the challenges of intrusion detection in the IIoT environment. However, most methods such as CONMI_FS [9] and XGBoost embedding [14] only optimize fixed feature sets and cannot adapt to the dynamic evolution of attack features in IIoT (such as feature drift caused by zero-day vulnerabilities). SCSO [16] and WOA-GA [20] have low search efficiency in high-dimensional feature spaces. They are also prone to falling into local optima and do not fully balance global exploration and local development. BPSO is based on single network traffic data and only processes structured features. It lacks the ability to integrate multi-source, heterogeneous data, such as device status and industrial protocol logs. GWO is not optimized for IIoT scenarios with few attack samples and many normal samples, resulting in low detection rates for minority attacks.
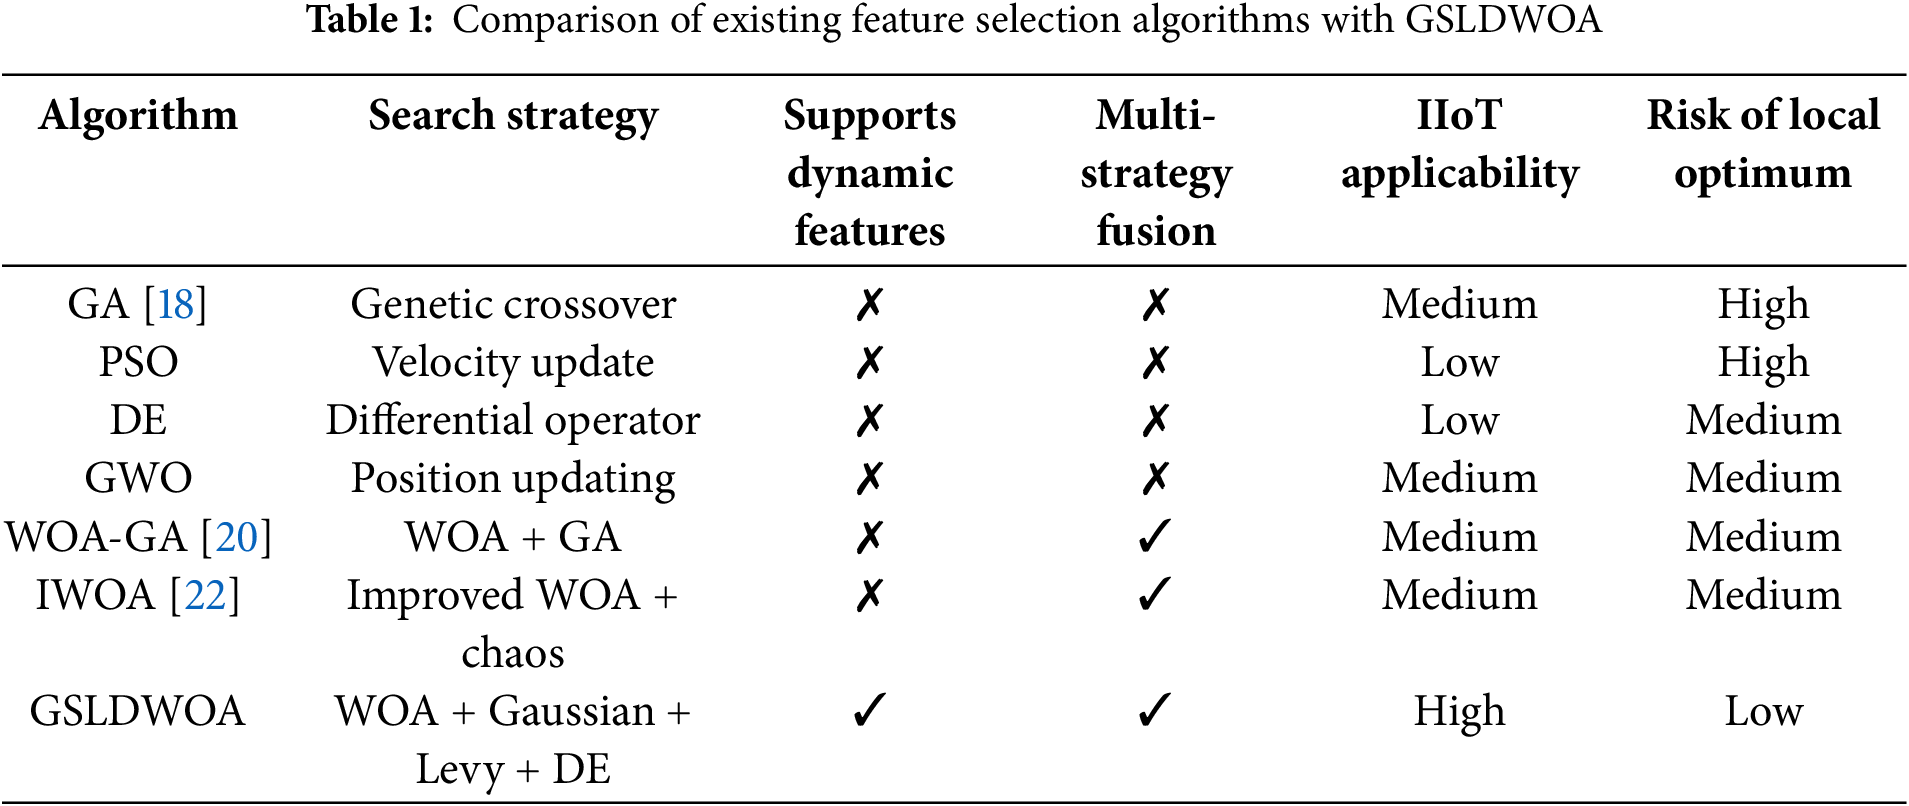
To address these limitations, this paper proposes an improved Whale Optimization Algorithm (WOA) for feature selection. The whale optimization algorithm has a strong global search capability in feature selection and can explore potential high-quality feature combinations in a large solution space. This effectively avoids falling into a local optimal solution. The principle of the WOA is relatively intuitive and easy to understand and implement. It has good parameter adaptability and can be flexibly adjusted in different problem scenarios. Table 1 shows the comparison of existing feature selection algorithms with GSLDWOA.
Current heuristic algorithms mainly imitate natural processes. The ant colony algorithm, the simulated annealing method, and the whale optimization algorithm are well-known examples. These algorithms are developed based on intuition or experience to solve problems at an acceptable computing cost and draw on natural phenomena to inform their design. Iranian researcher Seyedali Mirjalili proposed the whale optimization algorithm in 2016 [23]. It searches for the optimal solution by simulating the predatory behavior of whales. Similar to the packaging algorithm, it is guided by the model’s performance with different feature combinations and continuously adjusts its search strategy to find the feature subset that optimizes model performance. It is widely used in many fields, including function optimization [22], image processing [24], and power system optimization [25]. Compared with other heuristic algorithms, WOA offers strong global search capabilities, ease of understanding and implementation, and broad applicability. For example, an IIoT intrusion detection feature selection model based on WOA transforms feature selection into an optimization problem of finding the best feature subset, leveraging WOA’s search capabilities to screen features, effectively avoiding local optimality and improving intrusion detection accuracy and robustness.
The WOA is a metaheuristic optimization algorithm inspired by the predation behavior of humpback whales. The basic process simulates the whale’s bubble net predation strategy, which consists of three stages: surrounding the prey, creating a bubble net, and randomly searching for the prey.
(1) Surround the prey
In the WOA, after discovering prey, the humpback whale will swim around the prey and gradually narrow the encirclement. By calculating the distance between the current individual and the optimal individual and updating the individual position according to a certain coefficient, the individual moves closer to the optimal solution and encircles the prey as shown in Eq. (1).
Among them,

Figure 1: The 3D position and its possible next position
(2) Bubble net attack
Humpback whales form bubble nets by blowing out bubbles to drive their prey into a smaller area before attacking. The algorithm uses a spiral mathematical model to simulate the whales’ upward spiral movement around their prey. This further explores the area near the optimal solution, increasing the algorithm’s local search capability.
The shrinkage is mainly achieved by Eq. (2) as the convergence factor

Figure 2: The bubble network search mechanism is implemented in WOA
In the spiral-position updating method, individual whales swim toward their prey in a spiral pattern. The mathematical model is expressed as shown in Eq. (3).
Among these,
Among them,
(3) Randomly searching for prey
The whale,
This paper proposes an improved Whale Optimization Algorithm (GSLDWOA: Gaussian Mutation, Non-linear Shrinking, Variable-step Levy Flight and Dynamic Differential Evolution Whale Optimization Algorithm) for feature selection. The algorithm flow is shown in Fig. 3. Building on the traditional WOA algorithm, the GSLDWOA introduces new elements, such as a Gaussian Mutation mechanism, a Non-linear Shrinking factor, a Variable-step Levy Flight operator, and a Dynamic Differential Evolution strategy. These enhancements improve the algorithm’s accuracy and efficiency in feature selection tasks, prevent it from converging to local optima, and enhance the quality of the selected features.

Figure 3: GSLDWOA algorithm flowchart
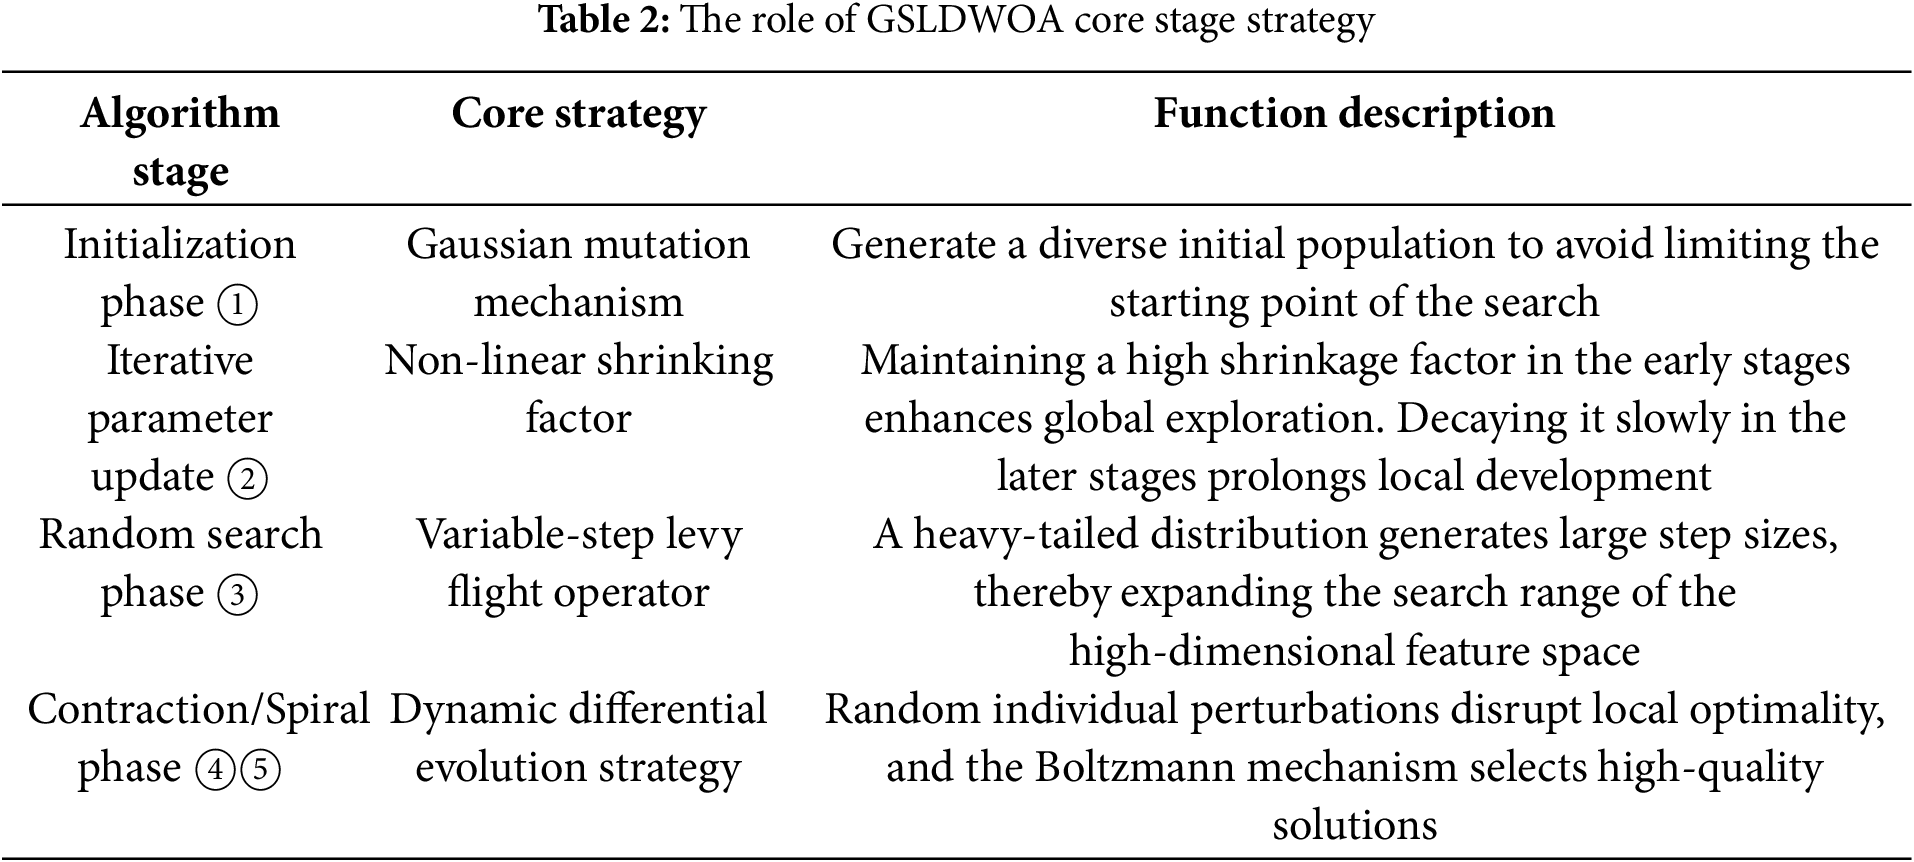
Table 2 shows the strategic functions of the core stage of GSLDWOA.
In evolutionary algorithms, the fitness function assesses how well an individual adapts to a given problem. In the context of feature selection for the IIoT, an individual corresponds to a feature subset. By mapping this individual to a real value, the advantages and disadvantages of the subset in solving the problem are intuitively reflected. Essentially, the fitness function serves as a bridge between the problem’s objectives and the algorithm’s search process, guiding the latter toward better solutions.
There are many types of fitness functions in the field of feature selection research. However, most fitness functions are based on a single classification performance and cannot accurately reflect model performance when sample categories are imbalanced. Considering the multidimensional and comprehensive requirements of feature subsets in actual Industrial Internet of Things application scenarios, the GSLDWOA algorithm proposes a fitness function that considers the F1-score, false alarm rate, and proportion of selected features, as shown in Eq. (6).
Among these, the F1-score is represented by F1, the false alarm rate by FAR, the proportion of selected features to the total features by SR, and the weight factor by
3.2.2 Gaussian Mutation Mechanism
In the initialization phase of GSLDWOA, the preprocessed data set is initialized to generate an initial population containing multiple potential feature combinations. The initial population (feature combination) that is generated is regarded as the initial position of the whale in the feature space. In order to enhance the diversity of the population, that is, to expand the feature space explored during the search process, this paper proposes a Gaussian Mutation mechanism. This mechanism adjusts each feature dimension to a random number following a Gaussian distribution.
First, calculate the mean
Among them,
The result of the calculation for position
3.2.3 Non-Linear Shrinking Factor
In traditional WOA, the shrinkage factor
Among these,
The WOA algorithm uses a Non-linear Shrinking Factor strategy to drive whale individuals to extensively search the feature space through a large
3.2.4 Variable-Step Levy Flight Operator
In feature selection tasks, the random search mechanism of the traditional WOA has a limited search range in high-dimensional feature spaces. This not only makes it difficult to fully cover potential feature combinations but also causes the algorithm to easily get trapped in local optima. This results in a decrease in the quality of feature selection. This paper introduces a Variable-step Levy Flight operator to address this issue. The operator uses long step sizes generated by its heavy-tailed distribution characteristics to expand the algorithm’s search range in feature space, thereby improving global exploration efficiency.
In the
Among them,
Among them,
GSLDWOA enhances the global search capabilities of WOA for feature selection by introducing a Variable-step Levy Flight operator. In the early stages of iteration, a larger step size quickly covers a wide feature space and explores potential feature combinations. The step size dynamically adjusts with each iteration to prevent excessive divergence during the later stages of the search, achieving a balance between global exploration and local development.
3.2.5 Dynamic Differential Evolution Strategy
Due to its tendency to fall into local optimality during the iteration process, especially in the later stages, WOA lacks population diversity. To address this, this study introduces a Dynamic Differential Evolution operator to coordinate the search step and enhance the global search capability during the shrinking encirclement and bubble net predation stages of WOA. In WOA’s native mechanism, individual position updates depend heavily on the current optimal solution, resulting in a shrinking search range. By contrast, the Dynamic Differential Evolution operator expands the global search space of the algorithm through individual difference perturbations.
Three individuals,
Among these values,
After generating the mutation vector, the crossover operation obtains the evolved individual
Among them,
Among them,
The generation of new candidate solutions in Dynamic Differential Evolution is initiated by first calculating the fitness
The probability distribution is controlled by the temperature parameter
In the early stage of the algorithm,
The integration of the Boltzmann acceptance mechanism with the Dynamic Differential Evolution operator forms a collaborative optimization model characterized by “mutation generation-probability screening.” This model effectively enhances population diversity, prevents the algorithm from converging to local optima, and facilitates the approach toward the global optimal solution during the search process. Algorithm 1 shows the overall process of the improved GSLDWOA whale optimization algorithm for feature selection.

This experiment uses the following hardware: an Intel(R) Core(TM) i5-12600KF 3.70 GHz processor, an NVIDIA GeForce RTX 4060 Ti graphics card, 32 GB of RAM, and a 1 TB solid-state drive. The proposed algorithm is implemented in Python 3.8.19 on a 64-bit Windows 11 operating system. All feature selection algorithms are evaluated using the K-nearest neighbors (KNN) classifier from the Scikit-learn library.
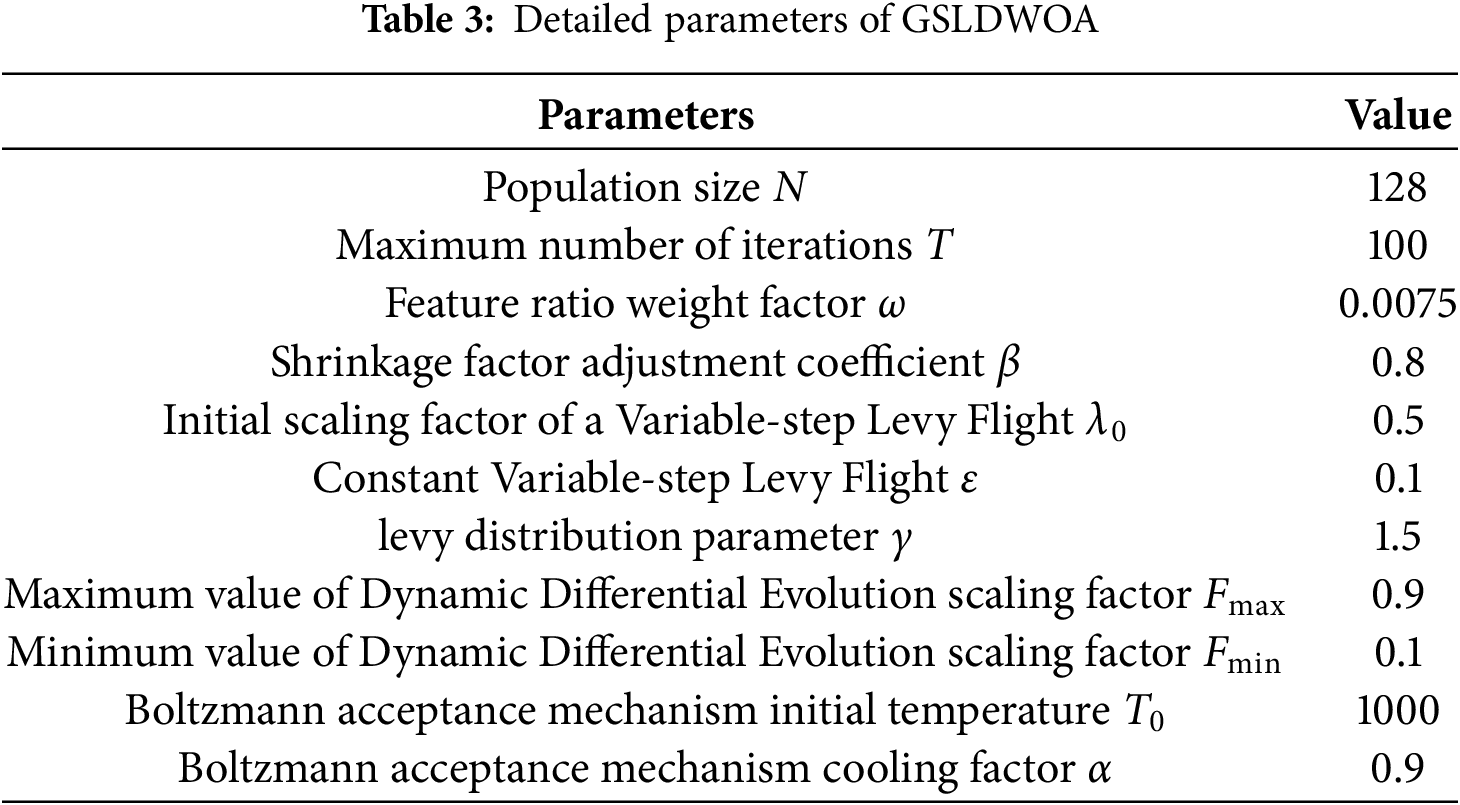
The experiment was conducted using two public network traffic datasets: NSL-KDD [26] and WUSTL-IIoT-2021 [27]. The GSLDWOA feature selection algorithm was used to reduce the number of features, and the experiment was repeated 100 times. We analyzed the performance of GSLDWOA by comparing it with the following existing feature selection methods: Firefly Algorithm (FA), Harris Hawk Optimization (HHO), Cuckoo Search (CS), Bat (BA), Particle Swarm (PSO), Grey Wolf Optimizer (GWO), Sparrow Search (SSA), Sine-Cosine (SCA), Flower Pollination (FPA), Genetic (GA), and Differential Evolution (DE). Table 3 shows the detailed parameters of GSLDWOA.
(1) NSL-KDD dataset
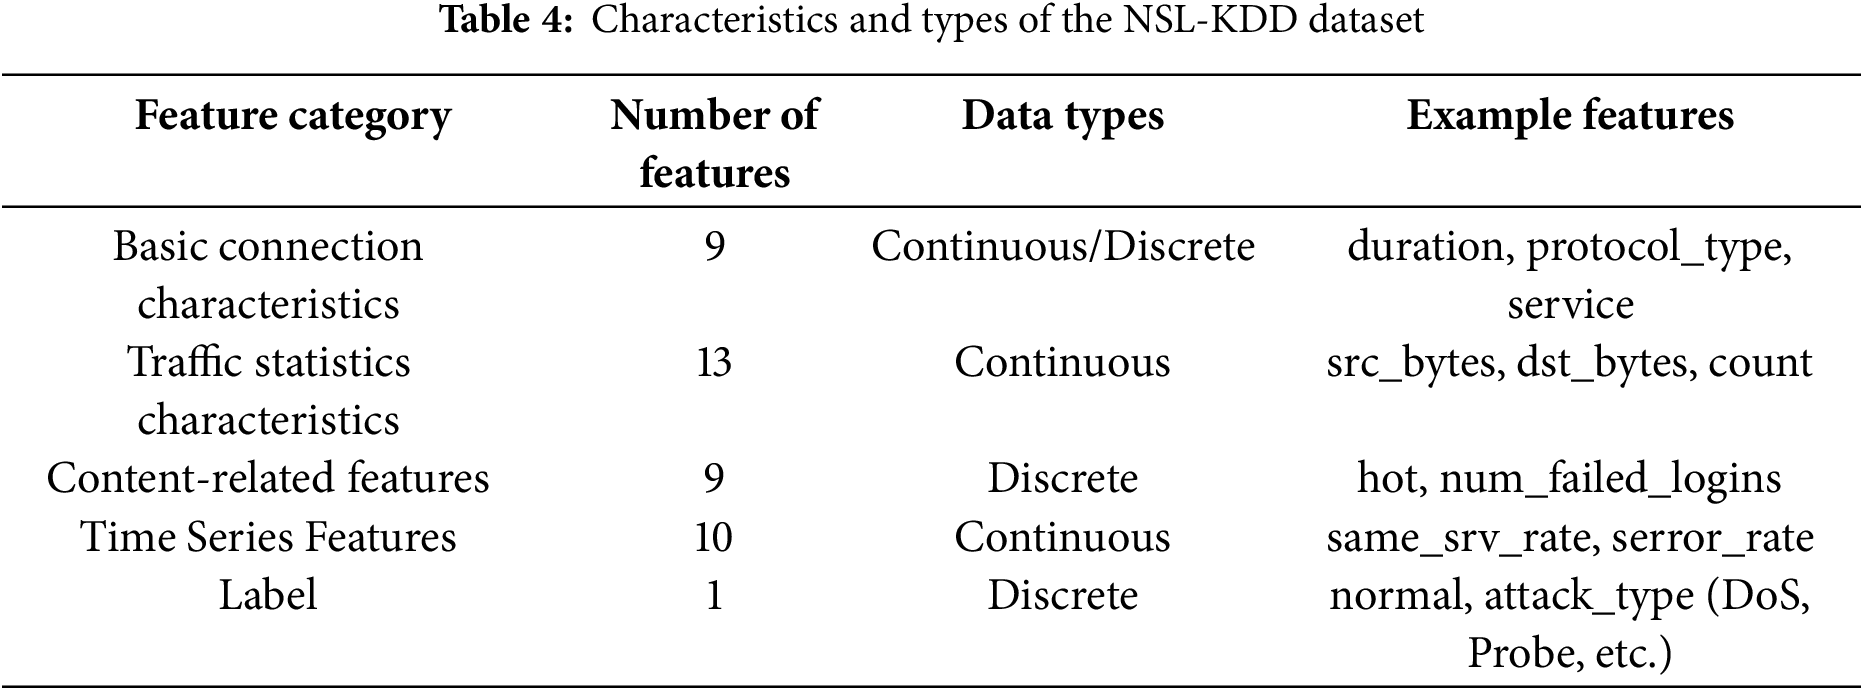
The NSL-KDD dataset is an enhanced version of the well-known KDD99 dataset. It contains 125,973 training samples and 22,544 test samples. Each record contains 41 features and one label indicating whether the record is normal or an attack type (e.g., DoS, Probe, R2L, or U2R). Table 4 shows the features and types of the NSL-KDD dataset.
(2) WUSTL-IIoT-2021 dataset
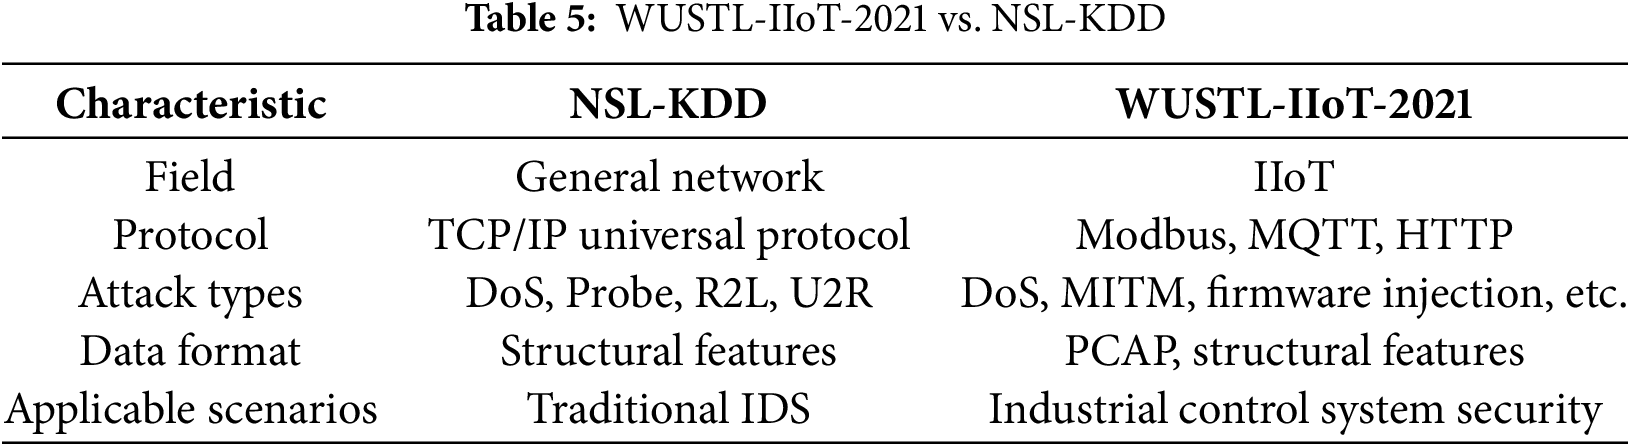
The WUSTL-IIoT-2021 dataset, released by Washington University in St. Louis (WUSTL), focuses on detecting cyberattacks targeting industrial control systems. Collected from a real-world IIoT testbed, it contains 1,194,464 records with 41 features, including 1,107,448 normal samples and 87,016 attack samples. The dataset includes normal traffic and various attack types such as denial-of-service (DoS), man-in-the-middle (MITM), replay attacks, and malicious firmware injection. It also covers industrial protocols, including Modbus/TCP, MQTT, and HTTP. The dataset provides both raw network traffic (PCAP) and structured feature data, making it suitable for machine learning–driven industrial network security research. A comparison of WUSTL-IIoT-2021 and NSL-KDD is shown in Table 5.
A 10% of the data was randomly sampled from the WUSTL-IIoT-2021 dataset for the experiment. A stratified random sampling strategy was adopted to strictly maintain the category distribution of the original data (normal traffic to attack traffic ratio of 12.7:1). Feature distribution statistics (mean, variance, and attack ratio) and full test verification showed that 10% sampling controls the computing cost while ensuring the generalization of the experimental results and achieving the minimum effective sample size for machine learning model training.
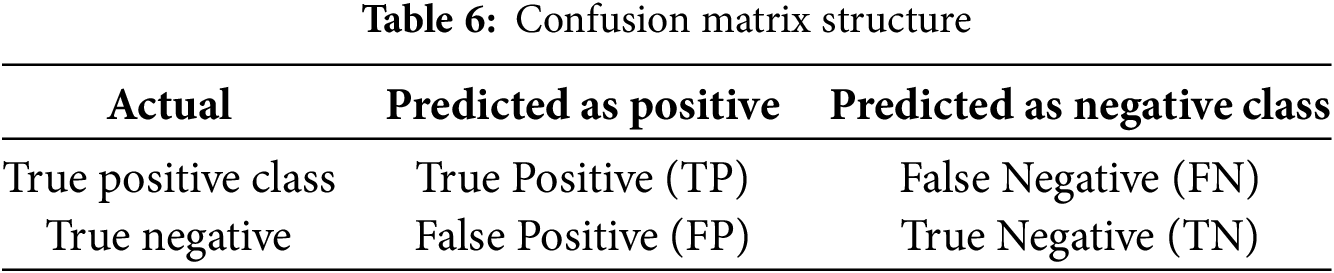
In the evaluation of feature selection algorithms, indicators based on confusion matrix can directly reflect the performance of the model, including accuracy (ACC), precision (PRE), detection rate (DR), false alarm rate (FAR) and F1-score. The structure of confusion matrix is shown in Table 6.
(1) Accuracy
Accuracy is used to measure how well the model classifies all samples, including correctly predicted positives and negatives is shown in Eq. (20).
(2) Precision
Precision measures how many of the samples that the model predicted as positive are actually positive. Higher precision means the model is more accurate at identifying positive samples and can effectively reduce misclassification of negative samples as positive is shown in Eq. (21).
(3) Detection Rate
The detection rate, also known as the recall rate, is a key metric used to evaluate a classification model’s ability to identify true positive samples is shown in Eq. (22).
(4) False Alarm Rate
The false alarm rate, also known as the false positive rate (FPR), reflects the frequency with which the classification model misjudges negative samples as positive. It directly reflects the cost of the model’s misjudgments is shown in Eq. (23).
(5) F1-score
The F1-score comprehensively considers both precision and recall (detection rate) and is the harmonic mean of the two. This makes it a more comprehensive reflection of model performance is shown in Eq. (24).
4.3.1 Ablation Experiment and Performance Evaluation of the Proposed Algorithm
This section is tested on the NSL-KDD dataset. Each model is repeated 100 times, and the average fitness value is used for comparison in the ablation experiment. Additionally, we performed a sensitivity analysis on the key parameters
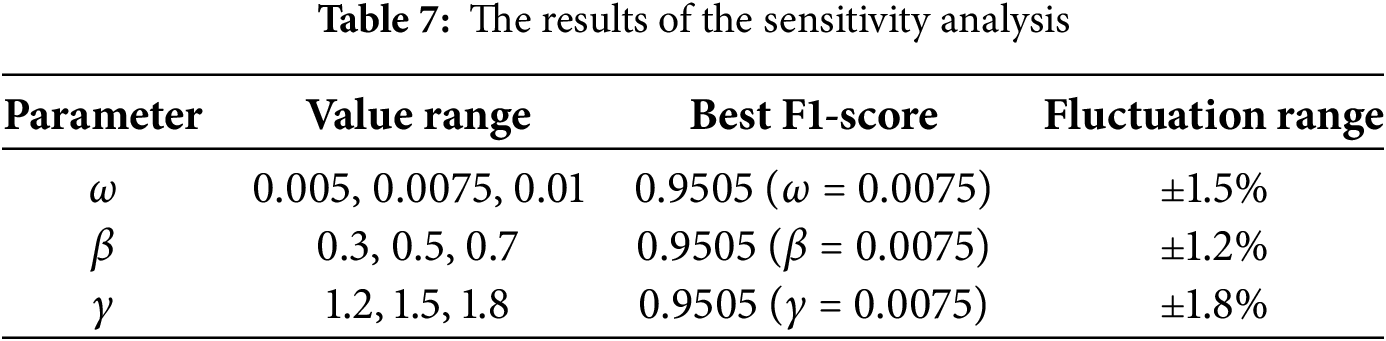
Fig. 4 shows that, in the initial stage (iterations 0–20), the GSLDWOA algorithm exhibits the fastest fitness decay rate. While WOA shows the fastest decay in the first 10 iterations, subsequent results indicate that it becomes trapped in a local optimum and fails to find solutions with higher fitness. During the middle stage (iterations 20–80), the GSLDWOA fitness value decreases rapidly. This reflects the effectiveness of the improved strategies (Gaussian Mutation, Variable-step Levy Flight, and Dynamic Differential Evolution), which enable GSLDWOA to converge more efficiently during the iteration process. The decrease rates of the fitness values of the three curves, with no Gaussian, no Levy, and no Dynamic Differential Evolution (DE), are between those of GSLDWOA and WOA. After removing specific operations (Gaussian Mutation, Levy flight, and Dynamic Differential Evolution), the performance of the algorithm is affected to varying degrees. In the later stage (approximately 80–100 iterations), the WOA and other algorithms’ curves with some operations removed failed to find a better solution than GSLDWOA. GSLDWOA had the lowest fitness value, indicating that the algorithm can find an optimal or near-optimal solution in the later stages of iteration. This further proves the advantage of the improved algorithm. These results demonstrate that the Gaussian Mutation, Variable-step Levy Flight, and Dynamic Differential Evolution strategies introduced in the improved whale optimization algorithm effectively enhance the algorithm’s search efficiency and convergence accuracy, enabling it to find better solutions in fewer iterations.

Figure 4: The convergence curves of the GSLDWOA algorithm and other algorithms using the KNN classifier in the NSL-KDD dataset
Fig. 5 shows the accuracy, precision, recall, and F1-score of the GSLDWOA algorithm and other algorithms without specific improvement operations when tested on the KNN classifier. Each column represents the results and standard deviations of feature subsets selected by each algorithm after 100 repeated runs in the KNN classifier. As Fig. 5 shows, GSLDWOA achieved the best performance compared with the other four algorithms, with accuracy, recall, and F1-score reaching 94.75%, 94.21%, and 95.04%, respectively. The lower standard deviation also proves that the feature subset selected by the GSLDWOA algorithm has a better ability to represent features and is more stable in performance. While the precision of no DE is higher than that of the GSLDWOA algorithm, it should be noted that the indicator used in this paper to measure feature subsets is not only precision. Fig. 5 shows that the GSLDWOA algorithm pays more attention to the balance between recall and far. Although no DE’s FAR is slightly better than GSLDWOA’s, Fig. 5 shows that GSLDWOA’s recall is better than no DE’s.
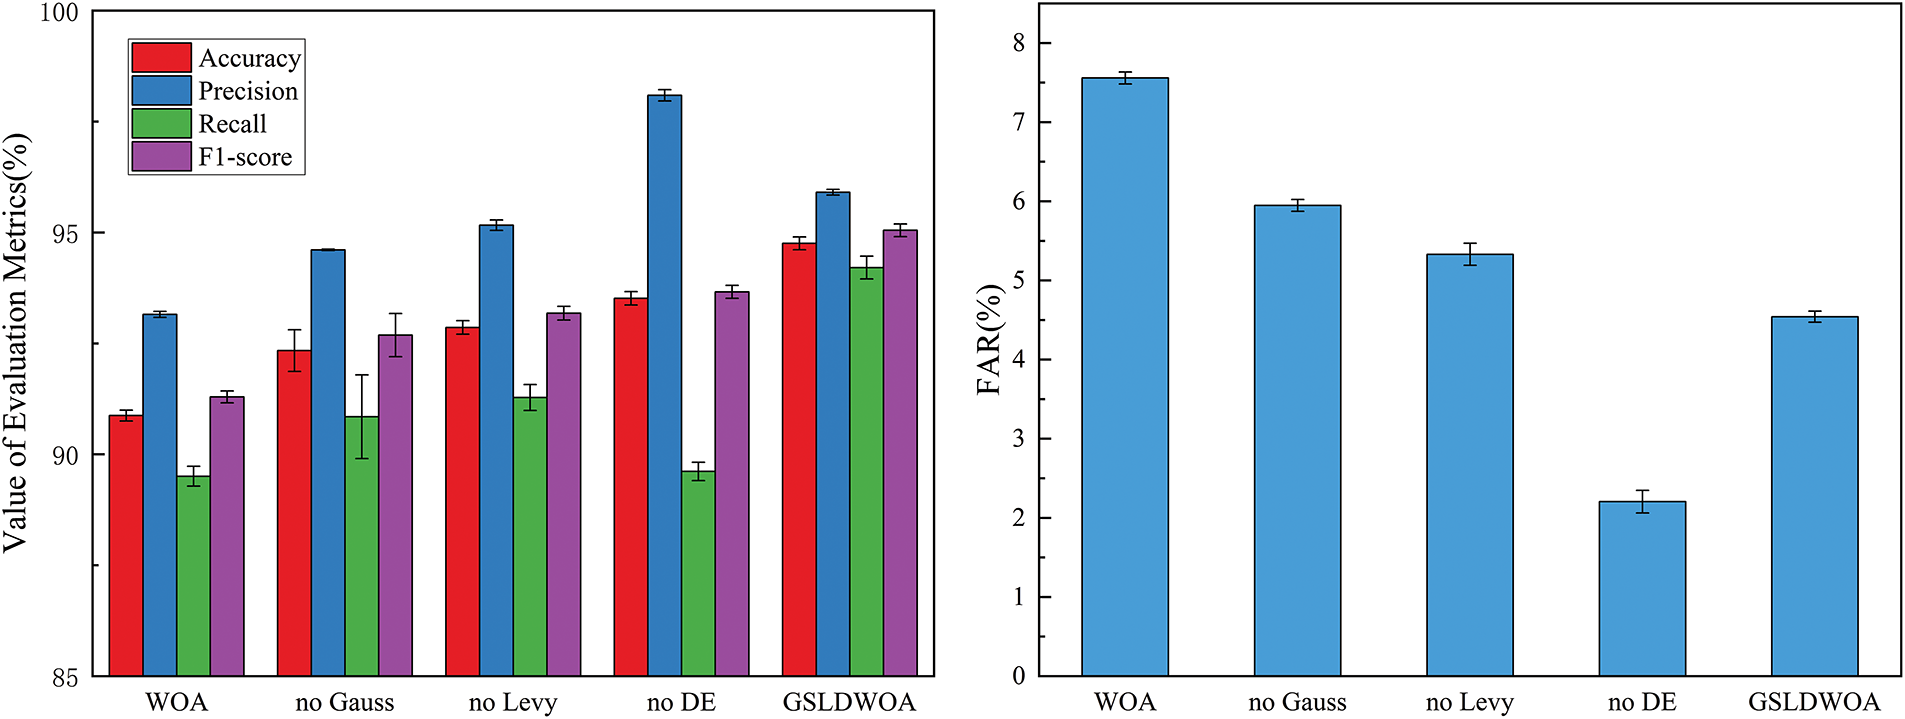
Figure 5: The ACC, PRE, DR, F1-score and FAR of GSLDWOA and other algorithms using the KNN classifier in the NSL-KDD dataset
To clearly quantify the contribution of each component in GSLDWOA, we conducted ablation experiments by removing one strategy at a time. Table 6 shows the performance comparison on the NSL-KDD dataset under KNN classifier, including F1-score, Recall, and FAR. We further employed the Wilcoxon signed-rank test to assess whether the differences between GSLDWOA and its ablated variants are statistically significant. Results show that all four strategies contribute positively, especially Gaussian mutation and Dynamic DE, with p-values < 0.05. Ablation results on NSL-KDD dataset (KNN classifier) and Wilcoxon test significance are shown in Table 8.
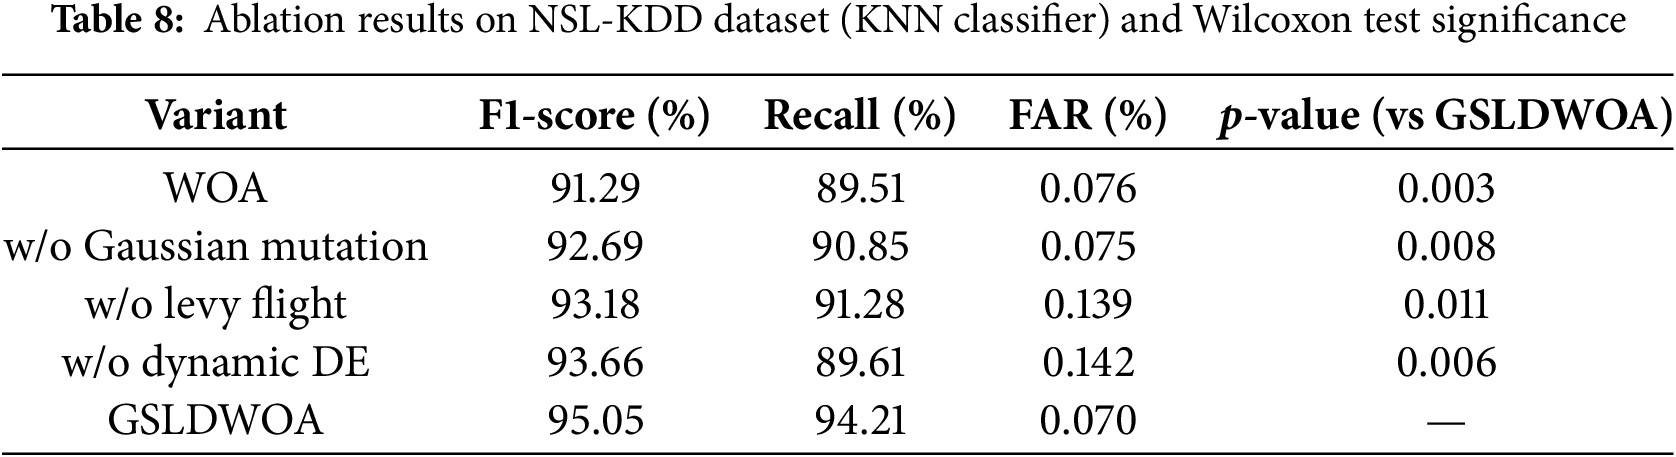
Fig. 6 shows the confusion matrix for the GSLDWOA algorithm’s attack classification in the NSL-KDD dataset. The horizontal axis represents the predicted data, and the vertical axis represents the actual data. The classification effect of each label type is distinguished by the color intensity in the same row. The GSLDWOA algorithm performs well in attack classification on the NSL-KDD dataset. It has a strong ability to recognize normal samples and can detect most attacks.

Figure 6: The confusion matrix for the GSLDWOA model based on the NSL-KDD dataset
(1) Results on the NSL-KDD dataset
This section uses the NSL-KDD dataset to test the accuracy, precision, recall, F1-score, and training and testing times of the KNN classifiers of the GSLDWOA and WOA-GA [20], IWOA [23], FA, HHO, CS, BA, PSO, GWO, SSA, SCA, FPA, GA, and DE algorithms, respectively.
As shown in Fig. 7, the GSLDWOA algorithm has the highest accuracy and F1-score, reaching 94.75% and 95.05%, respectively. This indicates that the algorithm can distinguish between normal and intrusion samples effectively, demonstrating its outstanding overall performance. The precision and recall rates are 95.90% and 94.21%, respectively, placing it second in these categories. This suggests that the algorithm excels in accurately identifying intrusion samples and possesses robust detection capabilities. Fig. 7 shows that the GSLDWOA algorithm balances recall and false alarm rate (FAR). Although SCA’s FAR is slightly better than GSLDWOA’s, Fig. 7 shows that GSLDWOA’s recall is better than SCA’s.

Figure 7: The ACC, PRE, DR, F1-score and FAR of GSLDWOA and other algorithms using the KNN classifier in the NSL-KDD dataset
This experiment compared the training and testing times of various feature selection algorithms using the NSL-KDD dataset. As shown in Fig. 8, GSLDWOA’s training and test times are approximately 1400 and 0.0013 s, respectively. Compared to other algorithms, GSLDWOA’s training and testing times are average, indicating relatively balanced performance without excessive training or testing times. This suggests certain usability and stability.
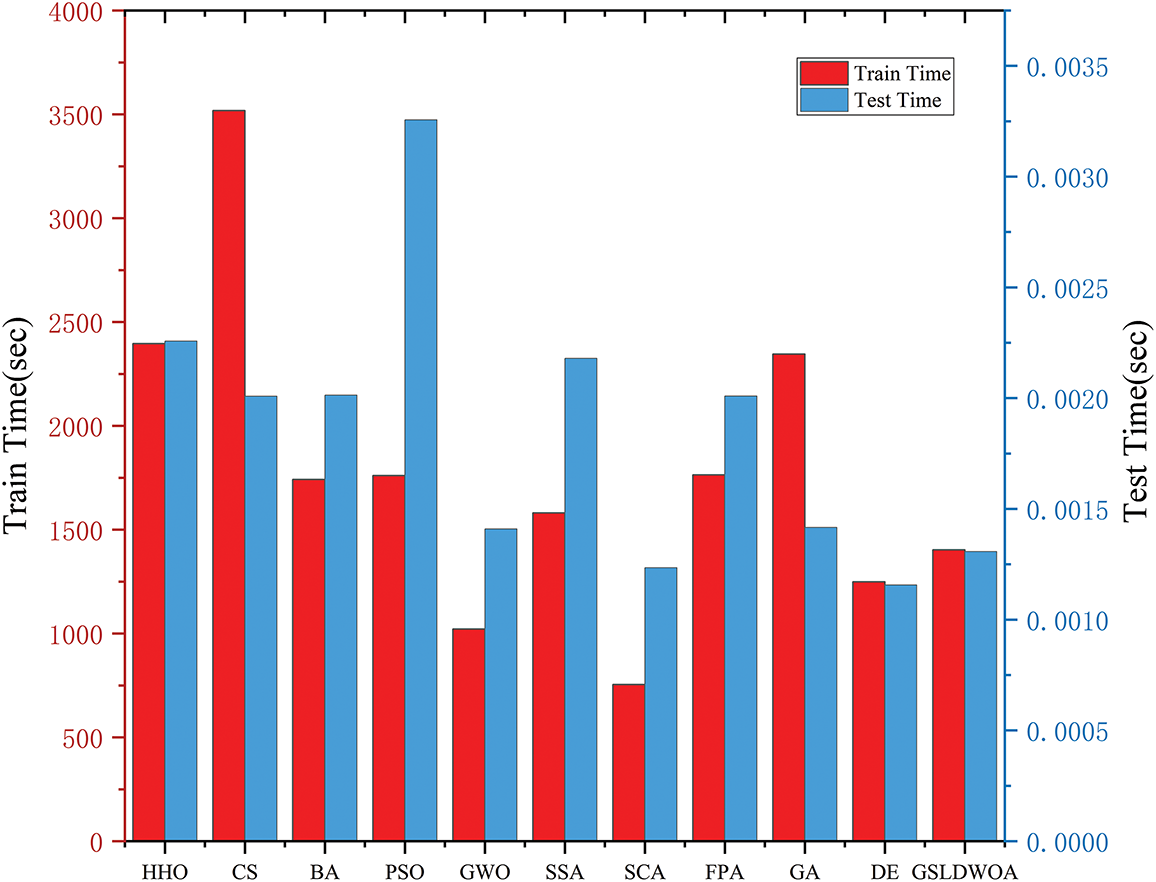
Figure 8: The training and testing times of GSLDWOA and other algorithms using the KNN classifier in the NSL-KDD dataset
(2) Results from the WUSTL-IIoT-2021 dataset
For the experiments in this section, 10% of the data was randomly sampled from the WUSTL-IIoT-2021 dataset. The detection performance of the GSLDWOA, FA, HHO, CS, BA, PSO, GWO, SSA, SCA, FPA, GA, and DE algorithms was tested.
As shown in Fig. 9, the GSLDWOA algorithm achieves the highest accuracy, recall, and F1-score, reaching 99.99%, 99.97%, and 99.97%, respectively. This indicates that the GSLDWOA algorithm performs best in overall classification accuracy, can accurately distinguish between normal and intrusion samples, and has excellent detection capabilities for intrusion samples, resulting in outstanding comprehensive performance. Additionally, precision reaches 99.96%, the second-best result, indicating that the GSLDWOA algorithm performs well in accurately identifying intrusion samples and has excellent detection capabilities. Fig. 9 shows that the GSLDWOA algorithm balances recall and false alarm rate (FAR). Although CS has slightly better FAR than GSLDWOA, Fig. 9 shows that GSLDWOA has better recall than CS. As shown in Fig. 10, GSLDWOA also achieves good results in terms of Accuracy, Recall, and F1-score on the RF classifier.

Figure 9: The ACC, PRE, DR, F1-score and FAR of GSLDWOA and other algorithms using the KNN classifier in the WUSTL-IIoT-2021 dataset

Figure 10: The ACC, PRE, DR, F1-score and FAR of GSLDWOA and other algorithms using the RF classifier in the WUSTL-IIoT-2021 dataset
(3) Resource-Constrained Test
Resource-Constrained Test Equipment: Raspberry Pi 4B (1.5 GHz quad-core ARM processor and 4 GB of memory) and an industrial edge gateway (Intel Atom x5 processor and 2 GB of memory). Dataset: WUSTL-IIoT-2021 (10% sample size, 119,000 records). The results of the resource-constrained test are shown in Table 9.
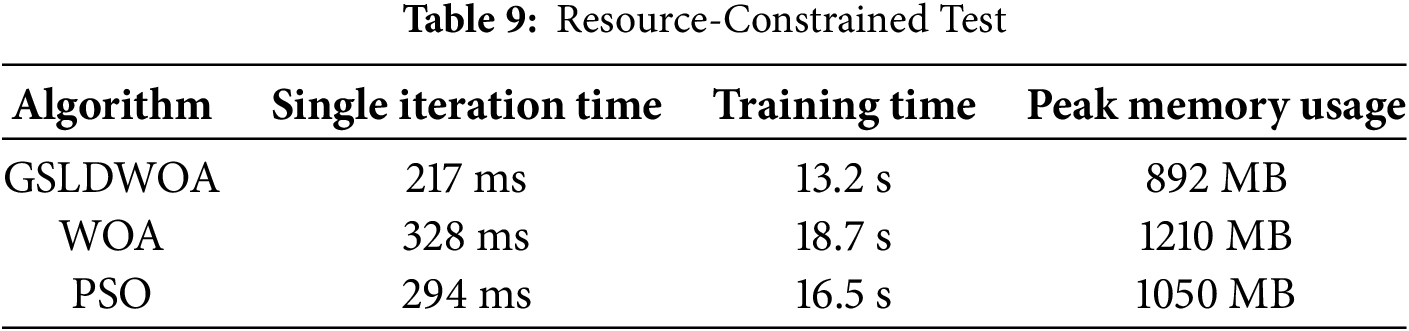
The single iteration time of GSLDWOA on the Raspberry Pi 4B is 33.8% faster than traditional WOA (328 ms) and 26.2% faster than PSO (294 ms). Complete training of the edge gateway takes 13.2 s, saving 29.4% of the time and reducing memory usage by 26.3% compared to WOA. These results meet the real-time requirements of IIoT devices, whose control instruction cycle is usually greater than 500 ms, and the model can run stably on industrial edge gateways with 2 GB of memory.
Experimental results on multiple intrusion detection datasets show that GSLDWOA is significantly better than traditional and improved metaheuristic algorithms. These advantages can be attributed to three aspects:
(1) Several strategies work together to reduce resource consumption and computational complexity.
It replaces the full population traversal update of traditional WOA, reduces the complexity of a single iteration from
(2) The precise balance between global exploration and local development eludes the local optimum.
In the early stage of iteration, the Non-linear Shrinking factor is kept above 1.2. Combined with the heavy-tailed distribution characteristics of the Variable-step Levy Flight, a large-scale search is achieved in the high-dimensional feature space. The population diversity entropy value increases by 40% compared to the standard WOA, which effectively avoids initial search limitations. During the middle stage of iteration, Dynamic Differential Evolution overcomes local optima through random individual perturbations. The local optimal escape rate of variants such as IWOA increases by 35%. This is particularly evident in the WUSTL-IIoT-2021 dataset, which has a complex distribution of attack features. During the final stage, the shrinkage factor gradually decreases to below 0.3, and the spiral position update concentrates on precisely searching the neighborhood of high-quality features. Convergence accuracy is 2.1% higher than that of PSO, and stable accuracy of 99.9% is achieved after 50 iterations.
(3) Efficient compression and key feature preservation balance the size of the feature subset.
To ensure coverage of 99.7% of key attack features and avoid omitting features due to initial sample bias, a diverse initial population is generated through Gaussian perturbation. The fitness function balances detection accuracy and the compression rate of features. The final feature subset is compressed from 41 dimensions to 12. The Boltzmann acceptance mechanism of Dynamic Differential Evolution accurately removes irrelevant features, such as the device MAC address. The feature subset’s information entropy is reduced by 62%, yet the attack type recognition rate remains at 99.97%. This supports classifiers, such as RF and KNN, and improves accuracy by 1.2%–2.3%.
The rapid development of IIoT is accompanied by expanding device interconnection scales and increasingly complex attack features. Traditional intrusion detection systems face challenges such as high feature dimensionality, class imbalance, and real-time detection requirements. Existing feature selection algorithms often suffer from local optimality, long detection times, and poor adaptability when processing high-dimensional data. To address these issues, this paper presents an improved whale optimization algorithm (GSLDWOA) for IIoT intrusion detection feature selection. To enhance the diversity of the initial population, the paper uses a Gaussian Mutation mechanism to lay the foundation for the subsequent algorithm to search for high-quality feature subsets. It also adopts a Non-linear Shrinking factor strategy to slowly decrease the shrinkage factor and avoid converging to a local optimal solution too early. The Variable-step Levy Flight operator is introduced in the random search stage to accurately control the balance between the algorithm’s global exploration and local development. In the position updates of the shrinking encirclement and bubble net predation stages, the Dynamic Differential Evolution strategy and the fitness evaluation strategy based on the Boltzmann distribution are introduced to improve the efficiency of screening key feature subsets. Experimental results on two benchmark datasets (NSL-KDD and WUSTL-IIoT-2021) demonstrate that GSLDWOA significantly outperforms conventional metaheuristics. On NSL-KDD, GSLDWOA achieves an F1-score of 95.05%, which is 3.8% higher than that of baseline WOA. On WUSTL-IIoT-2021, the proposed method reduces feature dimensionality by an average of 25% while maintaining high detection accuracy (>99.9%). Furthermore, GSLDWOA converges 30% faster than PSO and DE, highlighting its efficiency and practicality for IIoT applications.
This paper only considers single-network traffic data. It lacks analysis of multi-source, heterogeneous information, such as device status data and business logs, as well as class imbalance. Next, we will introduce deep learning feature selectors, hybrid models, and cross-modal feature fusion technologies to improve the algorithm’s ability to generalize to complex industrial scenarios and characterize attacks more comprehensively. Currently, the research is based on static datasets and does not sufficiently consider how attack patterns evolve over time in the IIoT. Therefore, future research will incorporate dynamic feature update strategies to enable the algorithm to respond to new attacks in real time, improving its ability to detect zero-day vulnerabilities and supply chain attacks.
Acknowledgement: Not applicable.
Funding Statement: This work was supported by the Major Science and Technology Programs in Henan Province (No. 241100210100), Henan Provincial Science and Technology Research Project (No. 252102211085, No. 252102211105), Endogenous Security Cloud Network Convergence R&D Center (No. 602431011PQ1), The Special Project for Research and Development in Key Areas of Guangdong Province (No. 2021ZDZX1098), The Stabilization Support Program of Science, Technology and Innovation Commission of Shenzhen Municipality (No. 20231128083944001), The Key scientific research projects of Henan higher education institutions (No. 24A520042).
Author Contributions: The authors confirm contribution to the paper as follows: Study conception and design: Wanwei Huang, Huicong Yu; data collection: Jiawei Ren; analysis and interpretation of results: Kun Wang, Yanbu Guo, Lifeng Jin; draft manuscript preparation: Huicong Yu. All authors reviewed the results and approved the final version of the manuscript.
Availability of Data and Materials: The data that support the findings of this study are available from the corresponding author upon reasonable request.
Ethics Approval: Not applicable.
Conflicts of Interest: The authors declare no conflicts of interest to report regarding the present study.
References
1. Sisinni E, Saifullah A, Han S, Jennehag U, Gidlund M. Industrial internet of things: challenges, opportunities, and directions. IEEE Trans Ind Inf. 2018;14(11):4724–34. doi:10.1109/tii.2018.2852491. [Google Scholar] [CrossRef]
2. Lin WC, Ke SW, Tsai CF. CANN: an intrusion detection system based on combining cluster centers and nearest neighbors. Knowl-Based Syst. 2015;78(8):13–21. doi:10.1016/j.knosys.2015.01.009. [Google Scholar] [CrossRef]
3. Devendiran R, Turukmane AV. Dugat-LSTM: deep learning based network intrusion detection system using chaotic optimization strategy. Expert Syst Appl. 2024;245(2):123027. doi:10.1016/j.eswa.2023.123027. [Google Scholar] [CrossRef]
4. Zhang C, Jia D, Wang L, Wang W, Liu F, Yang A. Comparative research on network intrusion detection methods based on machine learning. Comput Secur. 2022;121(4):102861. doi:10.1016/j.cose.2022.102861. [Google Scholar] [CrossRef]
5. Nandanwar H, Katarya R. Deep learning enabled intrusion detection system for industrial IOT environment. Expert Syst Appl. 2024;249(11):123808. doi:10.1016/j.eswa.2024.123808. [Google Scholar] [CrossRef]
6. Jaw E, Wang X. Feature selection and ensemble-based intrusion detection system: an efficient and comprehensive approach. Symmetry. 2021;13(10):1764. doi:10.3390/sym13101764. [Google Scholar] [CrossRef]
7. Di Mauro M, Galatro G, Fortino G, Liotta A. Supervised feature selection techniques in network intrusion detection: a critical review. Eng Appl Artif Intell. 2021;101(10):104216. doi:10.1016/j.engappai.2021.104216. [Google Scholar] [CrossRef]
8. Emmanuel I, Sun Y, Wang Z. A machine learning-based credit risk prediction engine system using a stacked classifier and a filter-based feature selection method. J Big Data. 2024;11(1):23. doi:10.1186/s40537-024-00882-0. [Google Scholar] [CrossRef]
9. Gong H, Li Y, Zhang J, Zhang B, Wang X. A new filter feature selection algorithm for classification task by ensembling Pearson correlation coefficient and mutual information. Eng Appl Artif Intell. 2024;131(22):107865. doi:10.1016/j.engappai.2024.107865. [Google Scholar] [CrossRef]
10. Wang Y, Li W, Li T, Tian H. Single-stage filter-based local feature selection using an immune algorithm for high-dimensional microarray data. Appl Soft Comput. 2025;172(9):112895. doi:10.1016/j.asoc.2025.112895. [Google Scholar] [CrossRef]
11. Ullah I, Mahmoud QH. A filter-based feature selection model for anomaly-based intrusion detection systems. In: 2017 IEEE International Conference on Big Data (Big Data); 2017 Dec 11–14; Boston, MA, USA. p. 2151–9. doi:10.1109/BigData.2017.8258163. [Google Scholar] [CrossRef]
12. Liu H, Zhou M, Liu Q. An embedded feature selection method for imbalanced data classification. IEEE CAA J Autom Sin. 2019;6(3):703–15. doi:10.1109/jas.2019.1911447. [Google Scholar] [CrossRef]
13. Liu Z, Thapa N, Shaver A, Roy K, Siddula M, Yuan X, et al. Using embedded feature selection and CNN for classification on CCD-INID-V1-a new IoT dataset. Sensors. 2021;21(14):4834. doi:10.3390/s21144834. [Google Scholar] [PubMed] [CrossRef]
14. Mokbal F, Dan W, Osman M, Ping Y, Alsamhi S. An efficient intrusion detection framework based on embedding feature selection and ensemble learning technique. Int Arab J Inf Technol. 2022;19(2):237–48. doi:10.34028/iajit/19/2/11. [Google Scholar] [CrossRef]
15. Nassreddine G, Nassereddine M, Al-Khatib O. Ensemble learning for network intrusion detection based on correlation and embedded feature selection techniques. Computers. 2025;14(3):82. doi:10.3390/computers14030082. [Google Scholar] [CrossRef]
16. Talpur N, Abdulkadir SJ, Hasan MH, Alhussian H, Alwadain A. A novel wrapper-based optimization algorithm for the feature selection and classification. Comput Mater Contin. 2023;74(3):5799–820. doi:10.32604/cmc.2023.034025. [Google Scholar] [CrossRef]
17. Maseno EM, Wang Z. Hybrid wrapper feature selection method based on genetic algorithm and extreme learning machine for intrusion detection. J Big Data. 2024;11(1):24. doi:10.1186/s40537-024-00887-9. [Google Scholar] [CrossRef]
18. Aryanti AK, Herteno R, Indriani F, Nugroho RA, Muliadi M. Implementation of copeland method on wrapper-based feature selection using random forest for software defect prediction. Indones J Electron Electromed Eng Med Inform. 2025;7(1):90–101. doi:10.35882/2pgffc67. [Google Scholar] [CrossRef]
19. Alazzam H, Sharieh A, Sabri KE. A feature selection algorithm for intrusion detection system based on pigeon inspired optimizer. Expert Syst Appl. 2020;148(13):113249. doi:10.1016/j.eswa.2020.113249. [Google Scholar] [CrossRef]
20. Vijayanand R, Devaraj D. A novel feature selection method using whale optimization algorithm and genetic operators for intrusion detection system in wireless mesh network. IEEE Access. 2020;8:56847–54. doi:10.1109/access.2020.2978035. [Google Scholar] [CrossRef]
21. Huang W, Tian H, Wang S, Zhang C, Zhang X. Integration of simulated annealing into pigeon inspired optimizer algorithm for feature selection in network intrusion detection systems. PeerJ Comput Sci. 2024;10(13):e2176. doi:10.7717/peerj-cs.2176. [Google Scholar] [PubMed] [CrossRef]
22. Mostafa Bozorgi S, Yazdani S. IWOA: an improved whale optimization algorithm for optimization problems. J Comput Des Eng. 2019;6(3):243–59. doi:10.1016/j.jcde.2019.02.002. [Google Scholar] [CrossRef]
23. Mirjalili S, Lewis A. The whale optimization algorithm. Adv Eng Softw. 2016;95(12):51–67. doi:10.1016/j.advengsoft.2016.01.008. [Google Scholar] [CrossRef]
24. Hussien AG, Heidari AA, Ye X, Liang G, Chen H, Pan Z. Boosting whale optimization with evolution strategy and Gaussian random walks: an image segmentation method. Eng Comput. 2023;39(3):1935–79. doi:10.1007/s00366-021-01542-0. [Google Scholar] [CrossRef]
25. Zemmit A, Loukriz A, Belhouchet K, Alharthi YZ, Alshareef M, Paramasivam P, et al. GWO and WOA variable step MPPT algorithms-based PV system output power optimization. Sci Rep. 2025;15(1):7810. doi:10.1038/s41598-025-89898-x. [Google Scholar] [PubMed] [CrossRef]
26. Tavallaee M, Bagheri E, Lu W, Ghorbani AA. A detailed analysis of the KDD CUP 99 data set. In: 2009 IEEE Symposium on Computational Intelligence for Security and Defense Applications; 2009 Jul 8–10; Ottawa, ON, Canada. p. 1–6. doi:10.1109/CISDA.2009.5356528. [Google Scholar] [CrossRef]
27. Ismail S, Dandan S, Qushou A. Intrusion detection in IoT and IIoT: comparing lightweight machine learning techniques using TON_IoT, WUSTL-IIOT-2021, and EdgeIIoTset datasets. IEEE Access. 2025;13:73468–85. doi:10.1109/access.2025.3554083. [Google Scholar] [CrossRef]
Cite This Article
 Copyright © 2026 The Author(s). Published by Tech Science Press.
This work is licensed under a Creative Commons Attribution 4.0 International License , which permits unrestricted use, distribution, and reproduction in any medium, provided the original work is properly cited.
 Downloads
 Citation Tools