
 Submit a Paper
 Propose a Special lssue
 Open Access
ARTICLE

Multi-Objective Evolutionary Framework for High-Precision Community Detection in Complex Networks
Department of Computer Science, College of Science, University of Baghdad, Al-Jadriya Area, Baghdad, 10070, Iraq
* Corresponding Author: Amenah Dahim Abbood. Email:
# These authors contributed equally to this work
(This article belongs to the Special Issue: Advancements in Evolutionary Optimization Approaches: Theory and Applications)
Computers, Materials & Continua 2026, 86(1), 1-31. https://doi.org/10.32604/cmc.2025.068553
Received 31 May 2025; Accepted 28 August 2025; Issue published 10 November 2025
 View Full Text
 Download PDF
Abstract
Community detection is one of the most fundamental applications in understanding the structure of complicated networks. Furthermore, it is an important approach to identifying closely linked clusters of nodes that may represent underlying patterns and relationships. Networking structures are highly sensitive in social networks, requiring advanced techniques to accurately identify the structure of these communities. Most conventional algorithms for detecting communities perform inadequately with complicated networks. In addition, they miss out on accurately identifying clusters. Since single-objective optimization cannot always generate accurate and comprehensive results, as multi-objective optimization can. Therefore, we utilized two objective functions that enable strong connections between communities and weak connections between them. In this study, we utilized the intra function, which has proven effective in state-of-the-art research studies. We proposed a new inter-function that has demonstrated its effectiveness by making the objective of detecting external connections between communities is to make them more distinct and sparse. Furthermore, we proposed a Multi-Objective community strength enhancement algorithm (MOCSE). The proposed algorithm is based on the framework of the Multi-Objective Evolutionary Algorithm with Decomposition (MOEA/D), integrated with a new heuristic mutation strategy, community strength enhancement (CSE). The results demonstrate that the model is effective in accurately identifying community structures while also being computationally efficient. The performance measures used to evaluate the MOEA/D algorithm in our work are normalized mutual information (NMI) and modularity (Q). It was tested using five state-of-the-art algorithms on social networks, comprising real datasets (Zachary, Dolphin, Football, Krebs, SFI, Jazz, and Netscience), as well as twenty synthetic datasets. These results provide the robustness and practical value of the proposed algorithm in multi-objective community identification.Keywords
Networks represent one of the ways that provide flexibility and robustness in the presentation of various real-world systems, such as social, biological, and informational systems [1,2]. Community detection involves identifying and analyzing hidden structures within a network. It consists of identifying densely connected groups of nodes within the network [3,4]. The partitioning of a network into communities facilitates an understanding of the nature of interactions and connections between its elements [5,6]. In the twenty-first century, social networks have become large-scale data platforms with massive volumes of data, structural complexity, and heterogeneity [7]. Such networks have grown as Internet users actively produce and share information, interact via the virtual world, and build communities based on shared interests, behaviors, or geographic locations [8]. Therefore, monitoring and analyzing large-scale interactions within the resulting network structures becomes very difficult [9]. In a social network, people represent the nodes, and the interactions between them are the connections. The objective of community identification is to analyze and identify the network into clusters or communities where nodes are more densely connected within clusters than to nodes in other clusters [10]. The structural network composition forms the basis for understanding the roles of nodes and their contributions to the community functions [11]. Specifically, analyzing the network structure is an essential way to specify the roles of nodes, connections, and communities within the network [12]. Despite the existence of numerous community detection methods, traditional approaches still have several flaws. Modularity-based approaches are limited by the resolution of their detection, which cannot distinguish between small communities and larger ones. Similarly, methods that use spectrum or cluster analysis typically require prior knowledge of the number of communities present, which is not always met in practice. Additionally, community detection is inherently composed of multiple conflicting goals, including maximizing the number of connections within communities while minimizing connections between communities. These goals often conflict with each other, making it challenging for algorithms that only consider one criterion to achieve a balanced and comprehensive solution. As a result, using a single criterion may lead to misguided or incorrect results. To effectively address these issues, it is crucial to employ multiple-criteria optimization strategies. Multi-criteria evolutionary algorithms (MOEAs) are particularly effective at this task because they are designed to address multiple conflicting goals. By investigating different trade-offs, MOEAs can more effectively capture the intricate structure of real-world networks, thereby enhancing the accuracy and reliability of community detection results. MOEAs can explore the solution space more effectively and are more likely to find high-quality and robust community structures. Therefore, the MOEA is well-suited for detecting communities in complex networks where the structure is not apparent. Several recent studies have incorporated mutation strategies into multi-objective evolutionary algorithms to improve community detection performance. Zhu et al. proposed a two-stage multi-objective evolutionary algorithm (TS-MOEA-CD) for community detection, which divides the evolution process into exploration and exploitation stages [13]. The algorithm optimized two structural objective functions, KKM and RC. They introduced a similarity parameter
1. We formulated the detection of communities as a multi-objective problem. We assess its effectiveness by making the objective detectable external connections between communities more distinct and sparse.
2. We proposed a Multi-Objective Community Strength Enhancement Algorithm (MOCSE). The proposed algorithm is based on the framework of the Multi-Objective Evolutionary Algorithm with Decomposition (MOEA/D), integrated with a new heuristic mutation strategy, Community Strength Enhancement (CSE).
3. We implemented the proposed algorithm on five state-of-the-art models for testing purposes.
The remainder of this paper is organized as follows. Section 2.1 introduces the problem of community detection, while Section 3 introduces the Literature review. Section 4 presents the original framework of the MOEA/D algorithm and the proposed mathematical model for identifying communities. Section 5 shows the results of the experiments on the suggested model and its comparison with other models. Section 6 presents a statistical Evaluation of performance. Section 7 presents the time complexity of algorithms. Section 8 includes the conclusion of the paper.
This section describes the fundamental principles of the proposed methodology. Explores the basic principles of community identification in undirected complex networks and introduces evolutionary algorithms with a component of decomposition, which is implemented to utilize the multi-objective optimization framework used in this study.
2.1 Undirected Community Detection
In complicated networks, communities have a vital substructure, representing a cluster of nodes with significantly higher internal connections than external connections to the rest of the network. A graph (G) is a representation of the network. For static unweighted and undirected network,
You can use the adjacency matrix to calculate the inter- and intra-edges of a community or node.
The primary objective of community detection is to divide the network into subgroups
To determine whether a subset
2.2 Multi-Objective Optimization Problems
In real-world problems, the optimization problem involves multiple objectives that are mutually competitive and must be optimized simultaneously. This type of problem is known as a Multi-Objective Optimization Problem (MOP). Single-objective optimization deals with only one objective and seeks a single best solution to a problem. Still, MOP presents the analyst with a set of trade-off solutions, each indicating a different compromise among the various conflicting objectives. In this study, the community detection problem is formulated as a multi-objective problem. The first objective is to maximize the connections between nodes belonging to the same cluster, and the second objective is to minimize the connections between clusters. Mathematical formulation of the MOP that can be minimized or maximized for
Each decision variable in the solution vector
•
•
Since the decision variables define the node memberships, they directly influence these objective values. There are essential concepts in the MOP that need to be clarified (dominated, non-dominated, Pareto front). Dominance solution between two solutions mathematically defines the minimization problem as follows: Two solutions,
A non-dominated solution is a solution that performs best among all objectives. It represents an efficient compromise between conflicting objectives and forms the basis for the Pareto front. Therefore, the Pareto front comprises non-dominated solutions.
2.3 Evolutionary Algorithm with Decomposition for Multiple Objectives (MOEA/D)
Multi-objective evolutionary algorithms (MOEAs) are used to solve multi-objective optimization problems within a single run, yielding Pareto-optimal solutions. Many investigations have demonstrated that MOEA/D-based methods are highly effective in addressing routing issues with multiple objectives [3,15,16]. Decomposition is the fundamental concept in the MOEA/D structure. Therefore, a multi-objective problem (MOP) with m objective functions may be divided into N subproblems, which consist of N weight vectors, with a maximum number of generations G acting as its input. The following algorithm summarizes the significant phases of MOEA/D. The initial part of the classic MOEA/D algorithm [17] is primarily initialization. External Population (EP): A temporary storage. A neighborhood is defined as the set of the
Advancements have been tremendous in community detection techniques in complex networks, with many traditional, evolutionary, and hybrid algorithms developed to increase accuracy and efficiency. Although the development of the model used in this study was triggered by the existing gap that signified a lack of such progress, more methods are better. Therefore, the following section presents the most relevant related work, providing an in-depth overview of the methodologies and techniques used for community detection. Girvan and Newman proposed the issue of community detection. They used divisive clustering to identify the structure of the community in biological networks by computing the edge betweenness and subsequently removing the edge with the highest value [18]. In 2004, Newman and Girvan improved their approach by introducing maximum modularity (Q), making the partition of networks into effective communities more accurate [19]. This led to an advance, which in turn led to metaheuristic algorithms that optimize single objectives for the improvement of community structure. Building on this, Pizzuti [20] applied a Genetic Algorithm (GA) to overcome the limitations of greedy methods, improving the community score using a single-objective evolutionary approach. Later, Pizzuti [21] introduced a multi-objective formulation that framed community detection as simultaneous maximization of both Community Score (CS) and Community Fitness (CF) using Pareto optimality to balance conflicting objectives.
where
where
For example, in 2020, Li and Shahabi [22,23] incorporated these two objectives into their research as a multi-objective optimization model.
Shi et al. [24] formulated the community identification issue as a multi-objective minimization problem. They divided modularity (Q) into two conflicting objectives regarding the degree of intra-connectivity and inter-connectivity. Therefore, they employ two objectives that should be minimized as follows. The initial evaluation examines the intra-connection.
while the second evaluation degree of inter-connections:
They have demonstrated that optimizing these two objectives simultaneously can yield a wide range of possible community structures, with varying emphases on connections within and between communities. Other researchers have adopted the two objectives. For example, in 2015, Wu and Pan [25].
Gong et al. [26] minimize Kernel K-Means (KKM) [27] and Ratio Cut (RC) [28].
In addition, Zhou and Zhang used KKM and RC [29,30].
Cheng et al. [31] suggested a local information multi-objective evolutionary algorithm (LMOEA). A framework similar to MOEA/D is adopted to simultaneously optimize the two conflicting objectives of negative ratio association (NRA) and ratio cut (RC). In addition, Yu et al. (2024), Ji et al. (2020) and Shang et al. (2020) used the same objectives [14,32,33].
In recent years, advanced multiobjective evolutionary algorithms (MOEAs) such as LSMOEA/D and RVEA have been proposed to better handle many-objective optimization problems. LSMOEA/D uses a latent space decomposition approach to improve diversity and convergence in complex search spaces [17]. RVEA guides the search process with adaptive reference vectors to achieve a well-distributed Pareto front [34]. These methods show a strong potential for community detection by effectively balancing conflicting objectives. However, challenges such as premature convergence and maintaining diversity remain. To address these issues, we propose a new community detection model that incorporates a novel mutation strategy based on community strength, which improves both convergence and diversity. This integrated design leads to more accurate and robust detection of community structures across various types of network Abbood et al. [2] proposed a new model that is based on the Hidden Markov Model (HMM-MODCD), consisting of
This section provides an overview of our model. Provides a brief explanation of the CSE mutation strategy used in this work to enhance the accuracy and efficiency of the algorithm (MOEA/D).
4.1 The Proposed Multi-Objective Community Strength Enhancement (MOCSE) Algorithm
In Fig. 1, the graph is first transformed into an adjacency matrix to represent the relationships between nodes. The next step is the genetic representation. The initialization step involves generating an initial set of potential solutions to ensure a diverse range of solutions and a more comprehensive exploration of the solution space. It will be attained and evaluated against the chosen objective function, which helps identify the solution capable of achieving the most initial balance with the objectives. In the next stage, solutions are selected based on their neighborhood relationships. Then, genetic operations, such as crossover and mutation, are performed to introduce new solutions and increase diversity within the population. The population is updated based on fitness evaluations performed over multiple generations, culminating in the final network partition, which can be visualized as a Pareto front of optimal solutions.
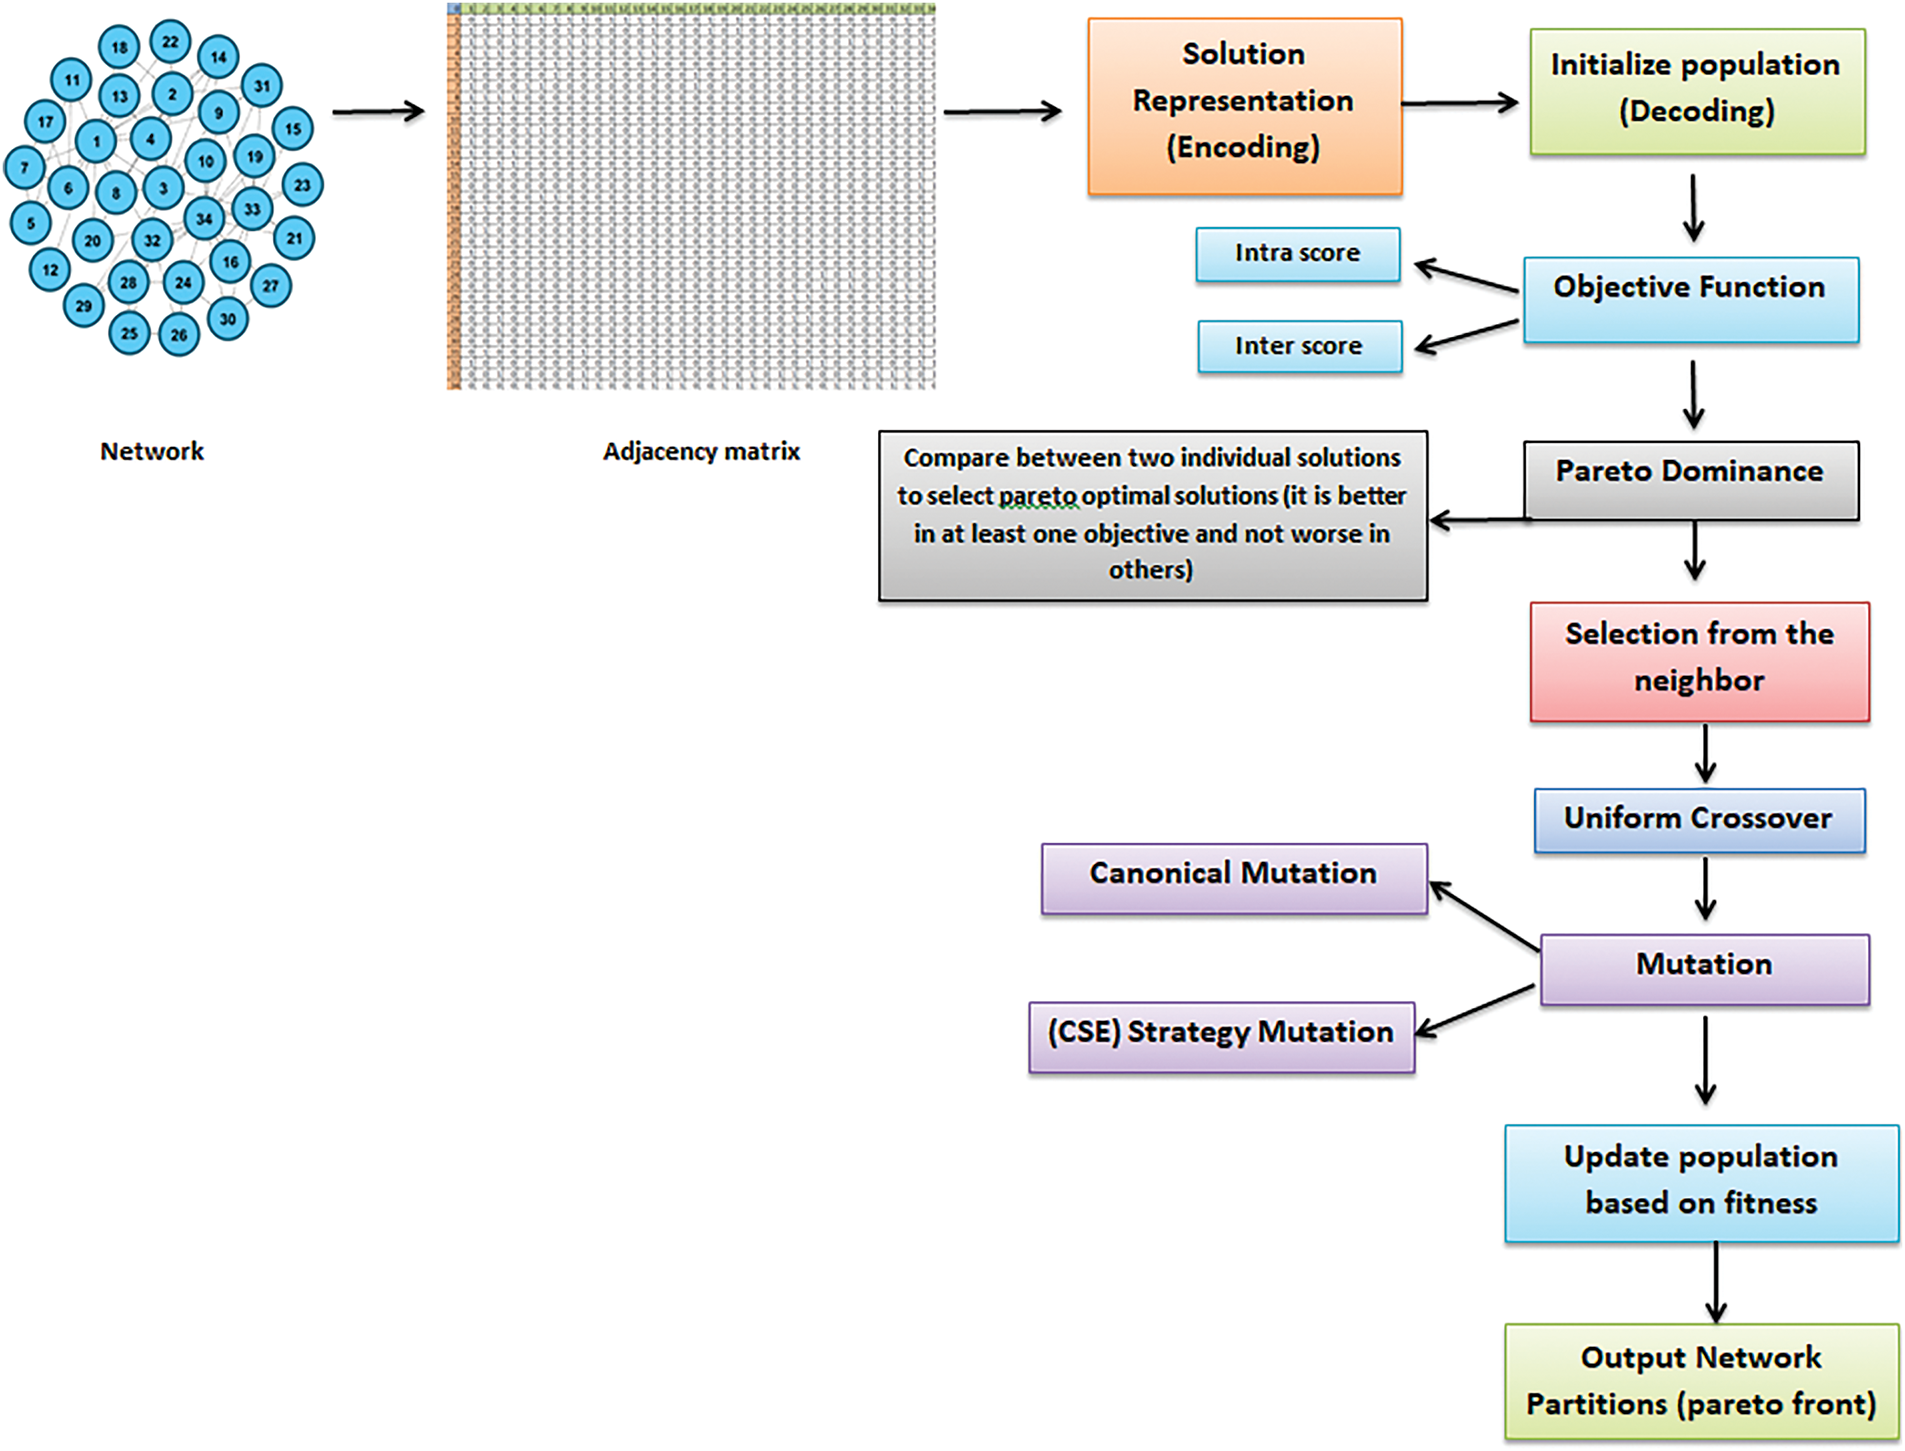
Figure 1: Framework of the proposed Algorithm. The steps are selection, crossover, and mutation
4.1.1 Chromosome Representation (Chromosome Encoding)
The data set is initially presented as a graph with nodes and edges, which is then transformed into an adjacency matrix in which
Subsequently, the representation of chromosomes is crucial to the effectiveness of evolutionary algorithms (EAs). The genotype encoding used here follows a locus-based adjacency representation [21]. It is the most commonly used approach and has been proven to be effective in previous research. In this approach, each individual
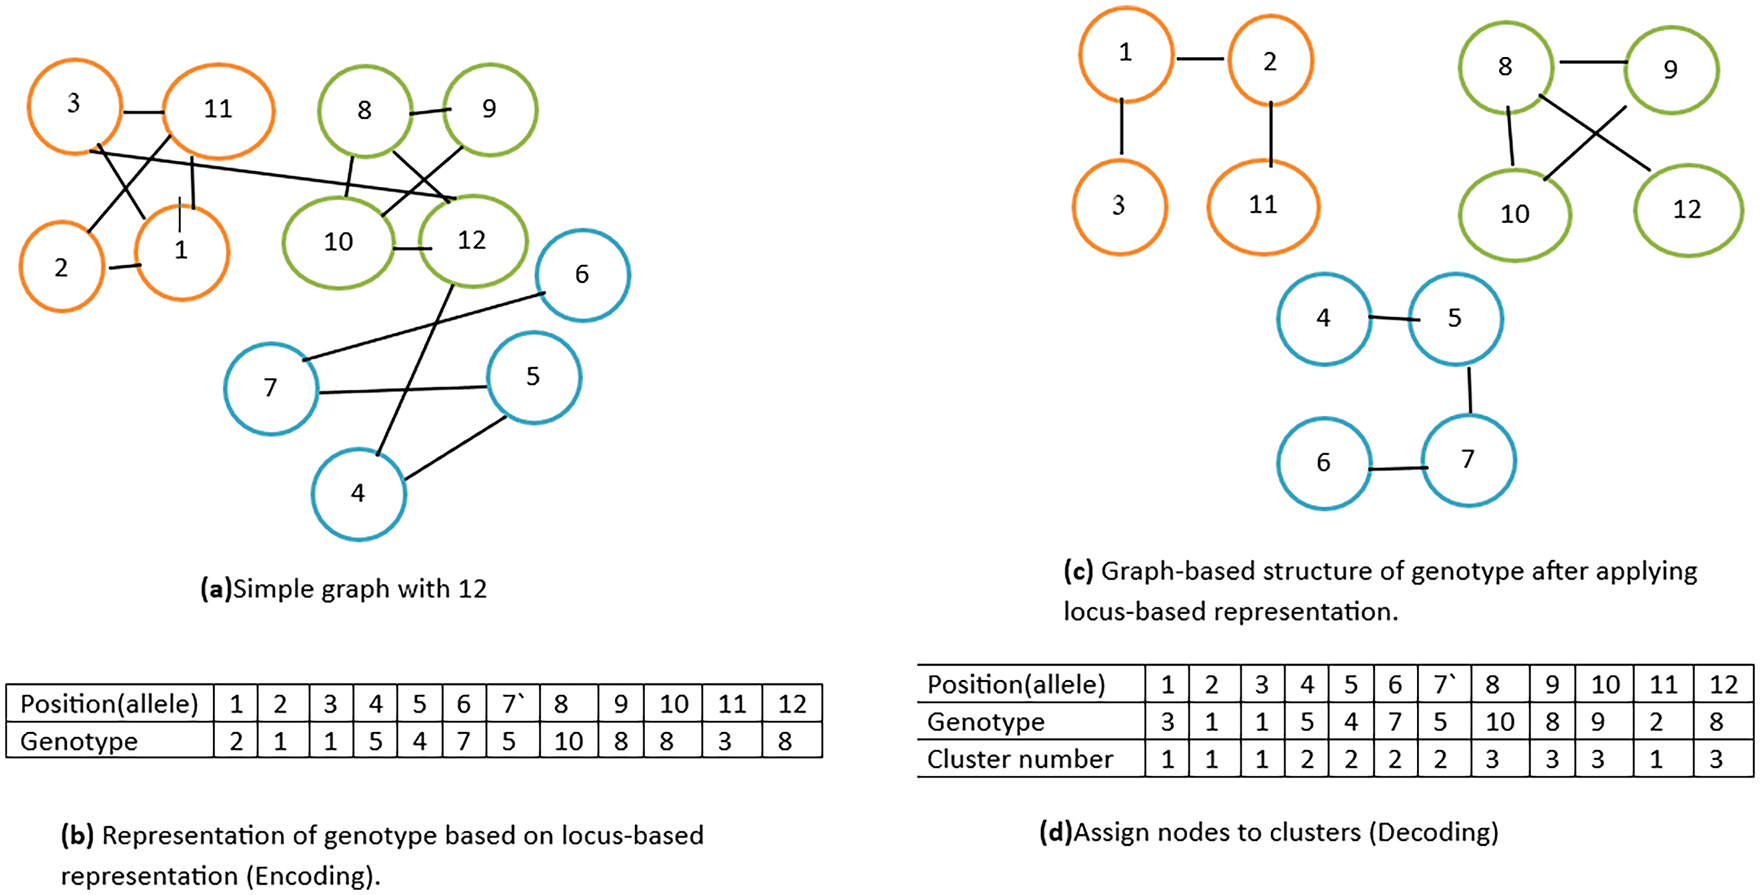
Figure 2: Example with a simple graph consisting of 12 nodes illustrates the process of Encoding and Decoding
4.1.2 Population Initialization (Decoding)
In the first phase of population decoding, the genetic representation of each individual is converted into a community structure. Individual chromosomes represent the relationships between nodes and should be used to assign nodes to different groups. The method iteratively places nodes into various clusters based on their connectivity, ensuring that nodes with common relationships are grouped. The second stage of decoding continues until every node is placed in the cluster where it belongs, thus creating a complete community structure for each individual. This step is significant because it converts the initial genetic information into a meaningful structure, for which fitness will be evaluated in future evolutionary algorithms. Shown in Fig. 2c,d.
4.1.3 Selection from the Neighbour
Assume the MOCSE algorithm solves a bi-objective optimization problem using 300 sub-problems, each associated with a distinct weight vector. For each subproblem, a set of 5 neighbors is predefined based on the similarity of weight vectors. Let us focus on Subproblem 137. Suppose that its neighborhood is defined as:
From this set, two parents are randomly selected to cross over to generate a new offspring. Assume that the following chromosomes represent the current solutions for two of the neighbors:
• Parent 1 (from Subproblem 88)
• Parent 2 (from Subproblem 139)
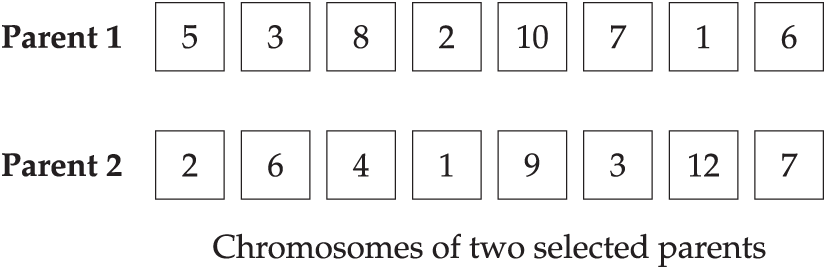
These two parent chromosomes are selected to generate an offspring solution for Subproblem 137. This process exemplifies how neighborhood-based selection works in the MOCSE algorithm, encouraging localized search within specific regions of the objective space.
Uniform crossover is a genetic operator in evolutionary algorithms. Generate offspring by exchanging genes between two parents. In this method, each gene in an offspring chromosome is determined with some given prespecified probability of recombination. This operation is repeated for all genes on the chromosome, where, for each position, a random number between 0 and 1 is generated. If it is less than or equal to
4.1.5 Formulating the Detection Model Mathematically
The initial step to address the community identification problem is to create an appropriate optimization model. The (MOEA/D) algorithm optimizes two objectives, the intra and inter. The intra-community function measures the internal connectivity within a community by counting the number (or density) of edges among its nodes. A higher intra-value shows more internal connectivity, which is good for well-separated communities. On the other hand, the inter-community function counts connections between nodes that are outside the community. A lower inter value indicates better separation from different communities, which is a measure of community separation. The first objective, intra-function, was initially developed by Gong and was utilized in numerous research studies, as mentioned in the previous section. This function is the KKM Eq. (7), which aims to increase intra-connections within communities by quantifying the ratio of intra-connections to the community size, thereby enhancing internal cohesion and strengthening connections between community members. This study presents a new objective function that represents the second objective. This function seeks to reduce the interconnections between communities. To overcome the limitations of the traditional RC, which considers only external connectivity. A modified version of the RC Eq. (8) was presented, known as the Balanced Communication Ratio (BCR), which quantifies the frequency of external communications for each community. This function is expressed as follows:
Here,
This new equation incorporates both the quantity of internal and external communications in its computation, resulting in a more precise and all-encompassing methodology. This change enables the model to significantly enhance the efficiency and cohesion of community networks by reducing the volume of external communications while maintaining the strength of internal communications. This discovery represents a valuable improvement in the area, as it combines enhanced internal unity with reduced obstacles between various communities, resulting in improved stability and overall effectiveness of the networks. The findings gained from implementing this model indicate its efficacy in achieving the targeted objectives and considerably enhancing the analysis of community networks.
4.1.6 Enhanced Mutation Strategy
The standard version of MOEA/D uses the traditional mutation to improve the best current solution [35]. When we swap the locations of the nodes between the communities, we replace every node in the current solution with a randomly selected neighbor node from the other community. Furthermore, we swap when a random number falls below the mutation probability (pm). You can notice a decrease in search speed due to the random pick-up of nodes. Hence, a unique strategy for exchanging node positions between communities is required to alter the conventional mutation. This study introduces a new strategy to enhance the strength of vulnerable nodes in social networks, known as community strength enhancement (CSE). To improve their performance, we moved weak nodes, those with a comparatively small number of internal connections compared to their external ones, to more robust communities. This reassignment was the result of a complex examination that considered the total number of adjacent nodes in each cluster, as well as their aggregate internal connections. We incorporated the procedure into a stated equation as follows:
where denotes the total number of nodes that are connected to the weak node inside cluster k,
represents the sum of internal connections between neighbors (nodes) with the weak node in community k.
Assess the potential augmentation of weak nodes within their communities. Each community performs this calculation, and the community with the highest score determines the node. Fig. 3 illustrates the method by example. If there are many communities with an equal number of connections, we shall use the classic approach (canonical mutation), which randomly applies a mutation rate (pm). Upon evaluating the application, we discovered that the proposed technique produces superior outcomes compared to the conventional method.
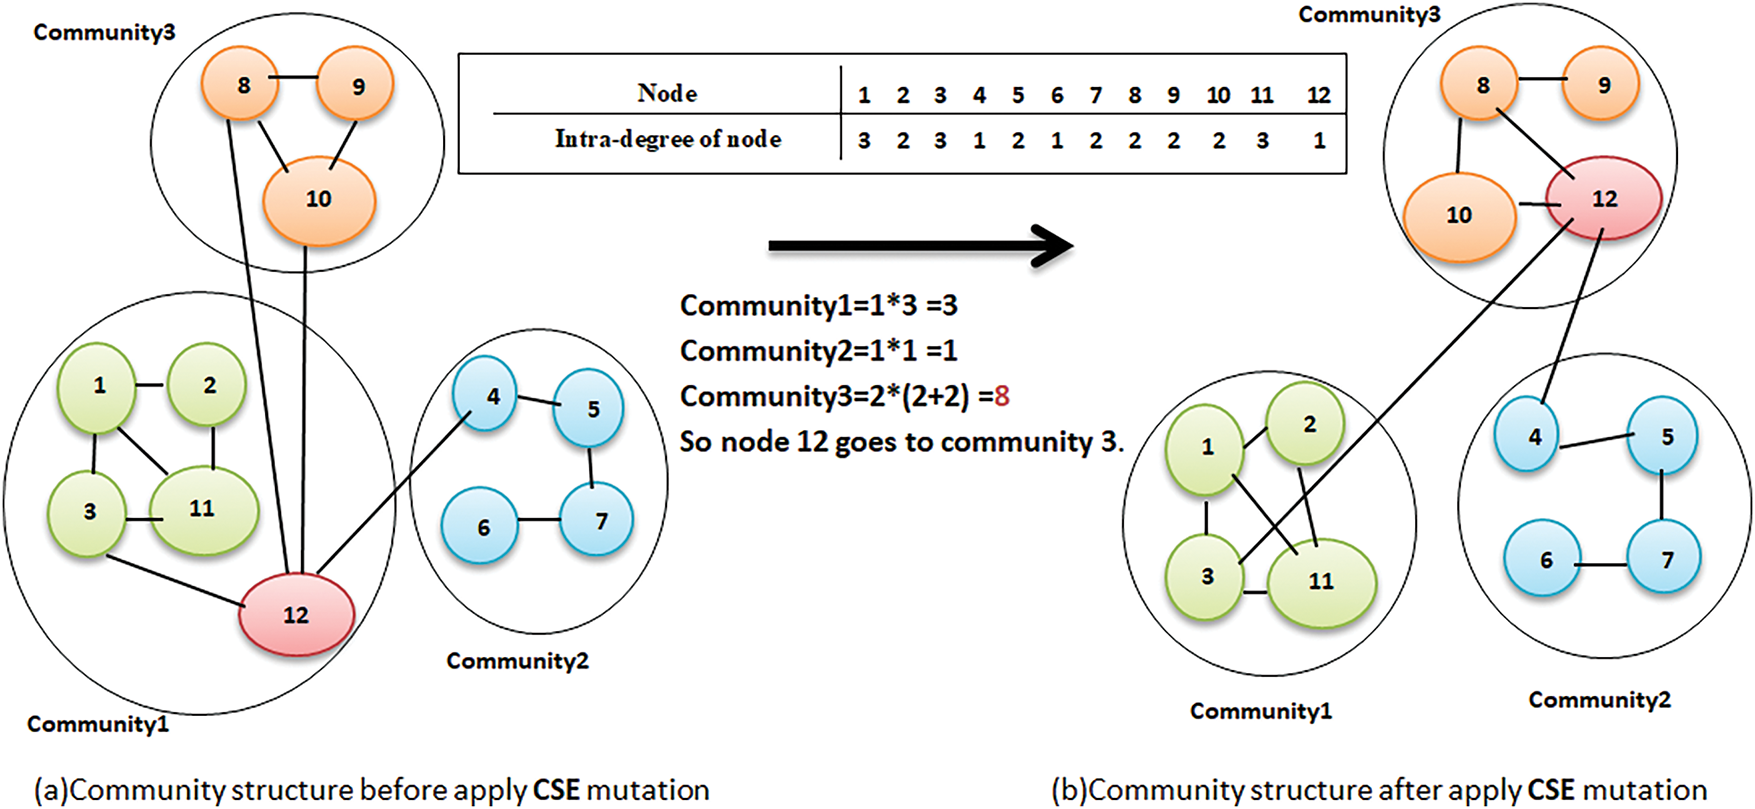
Figure 3: Simple example illustrates the detail of the CSE strategy
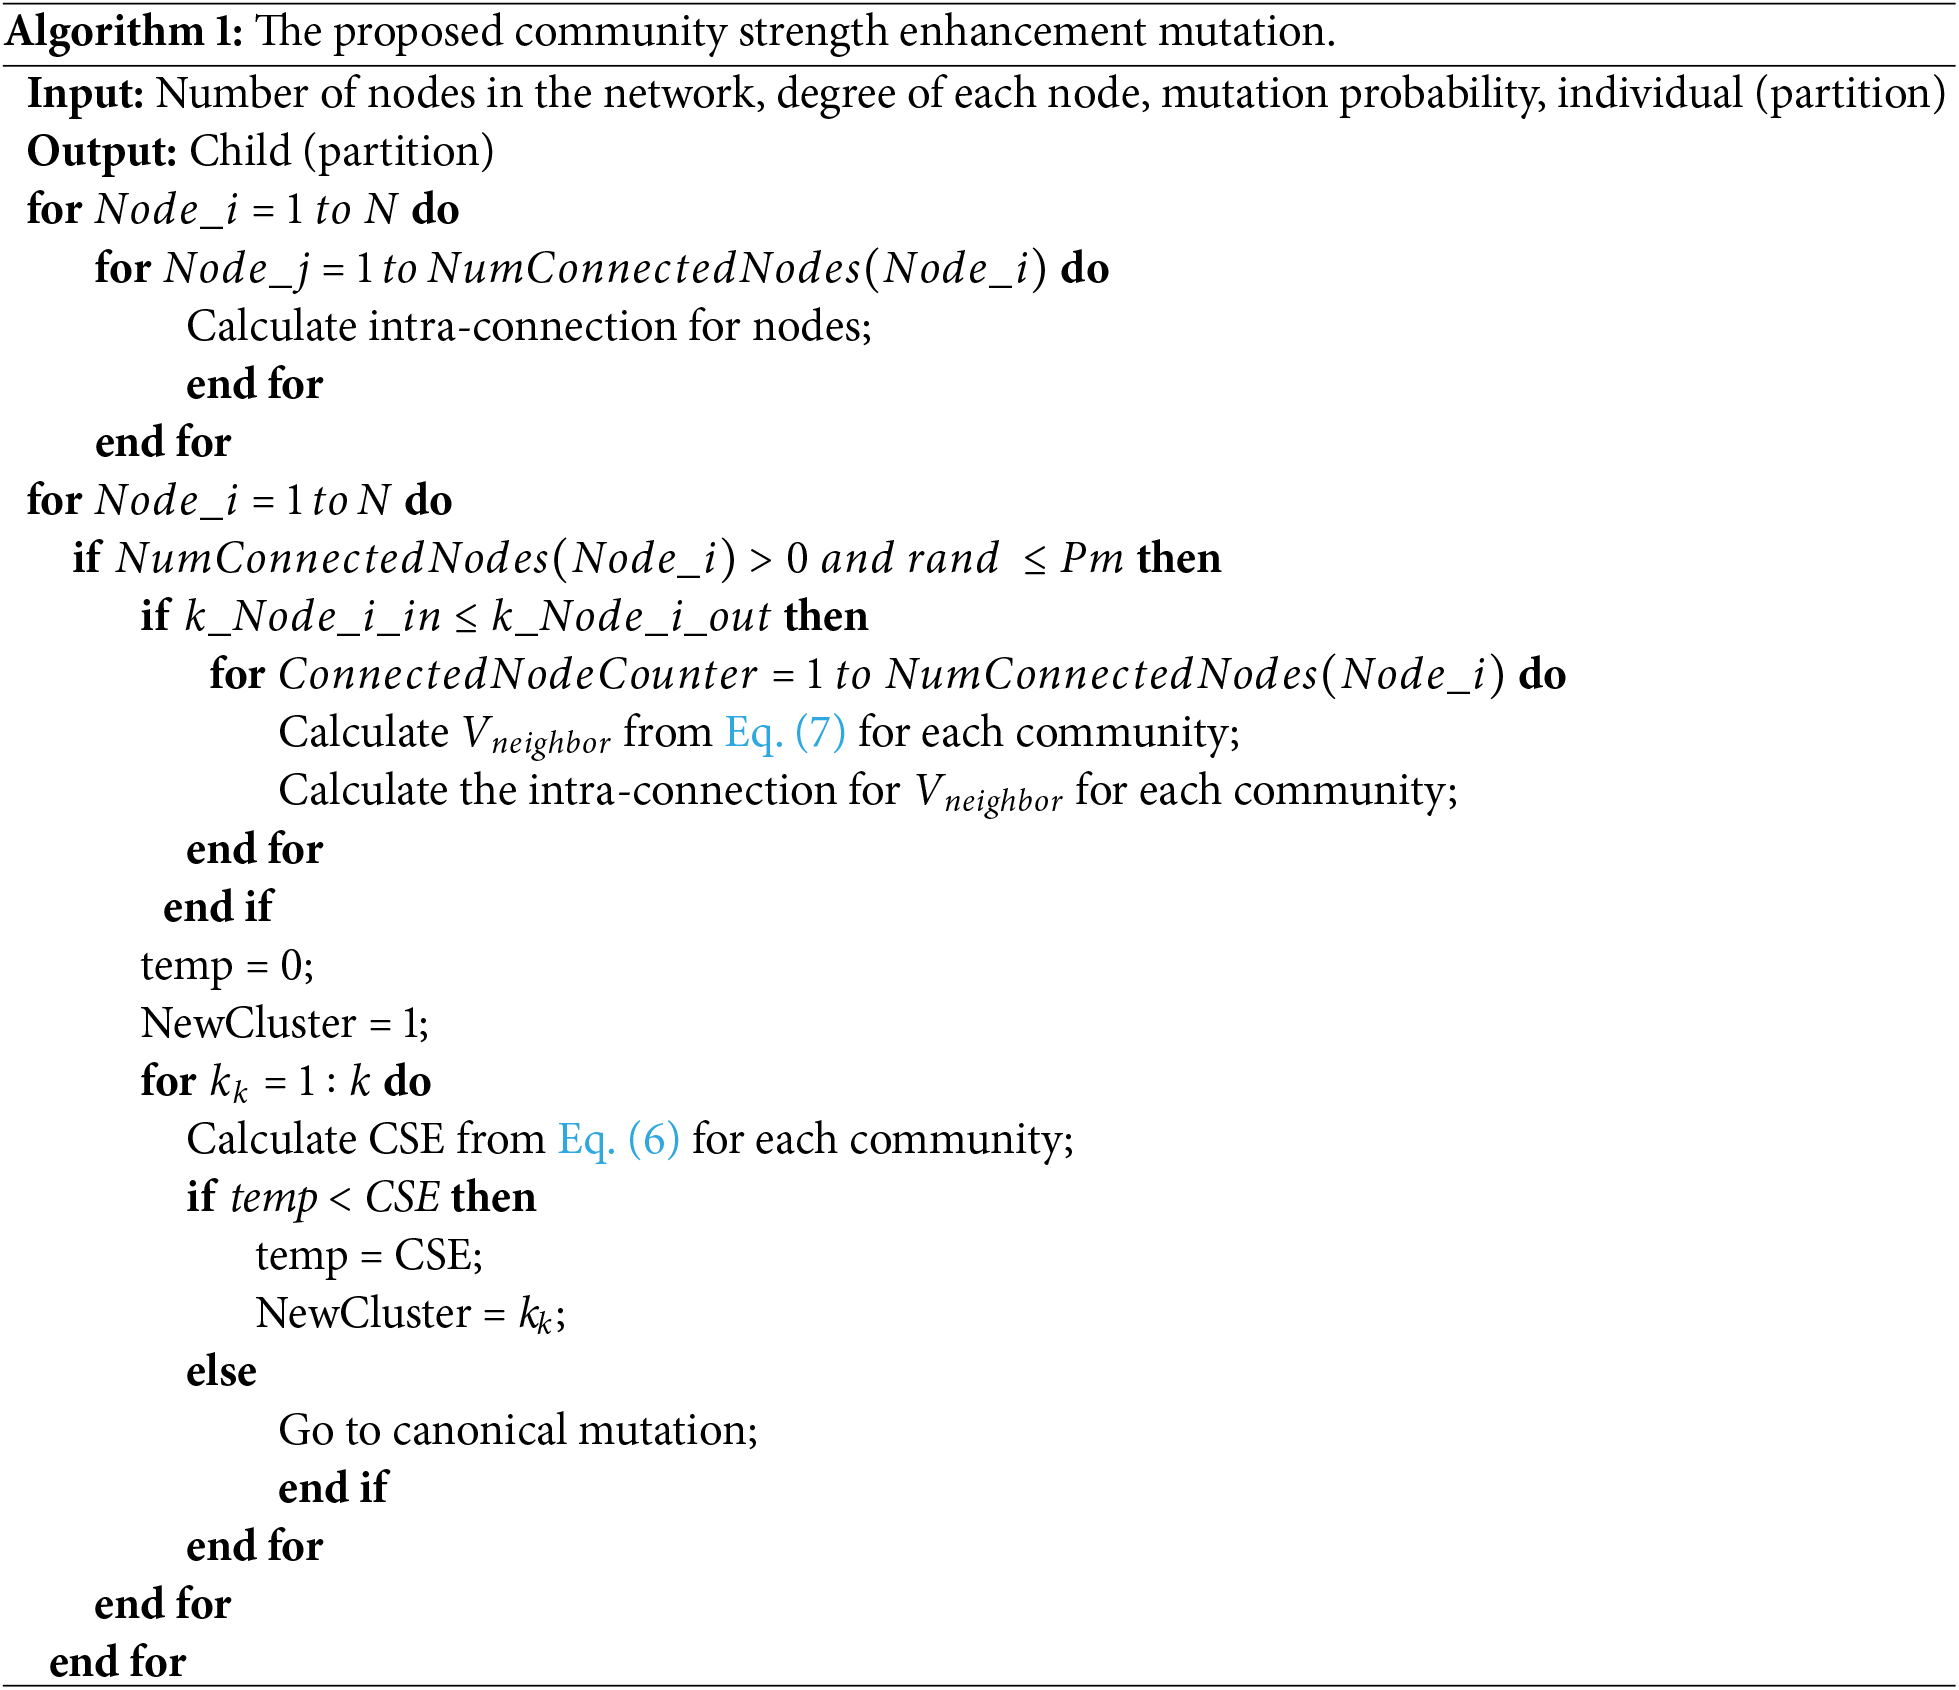
In this study, the proposed mutation strategy differs from the traditional mutation in that it has the probability of moving a particular node to a more suitable cluster, thereby improving the solutions according to specific criteria. In contrast, the traditional mutation moves the node randomly without evaluating the effect of this operation on the solutions. This method lays out the steps for the suggested mutation strategy. The operator for mutations in MOEA/D enhances the current top-performing option, making it suitable for community discovery and other optimization applications. This study could employ the conventional and improved mutation strategies individually by choosing the initialization of the mutation mechanism. As illustrated in Algorithm 1.
This section presents the parameter configuration used in the experimental study and describes the datasets employed. It also reports the observed results and provides an analytical discussion of the proposed model’s performance in comparison to existing models. This will enable a systematic and comparative evaluation of the model’s effectiveness under experimentation.
All experiments were conducted using MATLAB 2019 on a PC equipped with an Intel Core i7-8665U CPU and 32 GB of RAM, running Windows 11. The parameters were chosen to balance the number of solutions and the computational efficiency. The population size and number of generations were each set to 300, allowing for sufficient exploration and ultimate convergence. A mutation rate of 0.6 was selected to maintain the stability of the solution, while a relatively high crossover rate of 0.8 was chosen to promote diversity and avoid early convergence. These configurations align with previous studies and initial tests. For each of the six models—MOCD, MOGA-Net, MODPSO, LMOEA, HMM-MODCD, and the proposed MOCSE—ten runs are performed for each dataset, both with and without the CSE strategy. We used two measurements to evaluate the performance: the NMI and Q.
To maintain a consistent and fair comparison of the five existing models and the proposed model, both were applied using the standard MOEA/D algorithm and the proposed algorithm (MOCSE), which was introduced. In addition, we would like to emphasize that the HMM-MODCD model in the paper [2] was tested by the authors in Section 6 on several standard static networks to assess its effectiveness before being applied to dynamic scenarios. Clarify and remove any possible misinterpretation regarding the domain of applicability and the context of evaluation of the compared algorithms.
To effectively compare a new model with and without the suggested heuristic, it is common practice to employ a diverse range of complex and artificial networks. This study initially examined synthetic networks. Girvan and Newman [18] introduced a computer-generated benchmark that includes graphs of different levels of complexity. This benchmark was further developed by Lancichinetti (2008) [36]. The initial set of LFR benchmarks comprises a network with 128 nodes, designed to accommodate four distinct communities, each comprising 32 nodes. We evaluated the efficacy of the algorithms on networks produced between 0:05 and 0:5. The networks are referred to as LFR128. The next set of LFR benchmarks has been employed to evaluate the six models using large-scale networks that closely match real-world networks. The benchmarks comprise 10 networks, each comprising 1000 nodes. They referred to this set as LFR1000. According to [36], the size of the mixing parameter is between 0.5 and 0.05.
The second group consists of four real networks. Zachary’s network was constructed by examining the friendship connections between 34 individuals who were members of a club. This resulted in the identification of a total of 78 relationships within the network [37]. The second network consists of 62 bottlenose dolphins from New Zealand and is commonly referred to as the Bottlenose Dolphins Network. This network comprises 159 connections, divided into two significant groups [38]. Girvan and Newman [18] rated the game of American football (2000) as the third most famous network. The 115 teams that competed in the Football 2000 championship games make up this network. Teams were divided into 12 groups, each representing a different geographic location. The ultimate network consists of the compilation of Krebs’ publications on American politics, authored by Newman [39]. The 105 books on politics that make up this network from the United States are available for purchase on Amazon.com.
The third collection of complicated networks comprises three well-known real-world networks whose actual partitions are still undisclosed. The SFI network was initially proposed by Girvan and Newman [18]. The Santa Fe Institute, which is located in Santa Fe, New Mexico, USA, had a web of scientific connections between 1999 and 2000. In total, 118 researchers comprise this network, each represented by a vertex. A connection is established between two scientists if they collaborate and publish a paper together. This network contains 200 edges. Second, the digital database known as the Red Hot Jazz Archive serves as the source for 198 bands that comprise the jazz musician network. According to Gleiser et al., the performances of these groups spanned from 1912 to 1940 [40]. Lastly, the Nescience network [39] is a group of writers who collaborate on projects related to network theory and experimentation.
5.3 Experiments on Synthetic Networks
This section presents and analyzes the experimental results obtained by applying the MOCSE algorithm and the traditional MOEA/D algorithm to six models. These algorithms were applied to a twenty-synthetic network. Each Figs. 4 and 5 shows the comparison of six models, where the MOCSE model represents the proposed model that integrates the CSE mutation strategy into the hybrid algorithm framework.
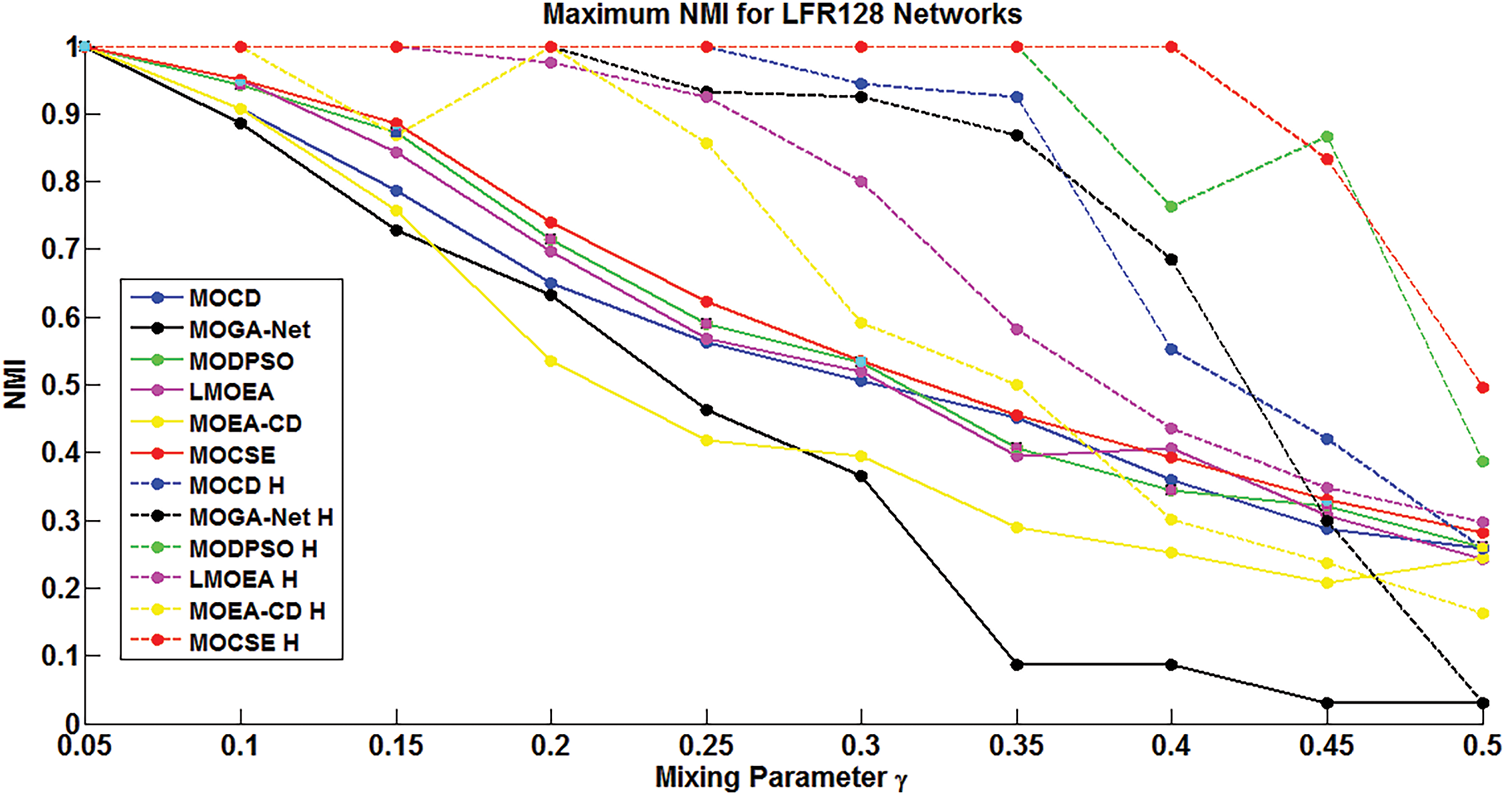
Figure 4: Overall performance of all models based on their maximum NMI for the ten datasets of LFR-128 nodes. Dashed lines show the results with the community strength enhancement (CSE), whereas the results without it are represented by solid lines
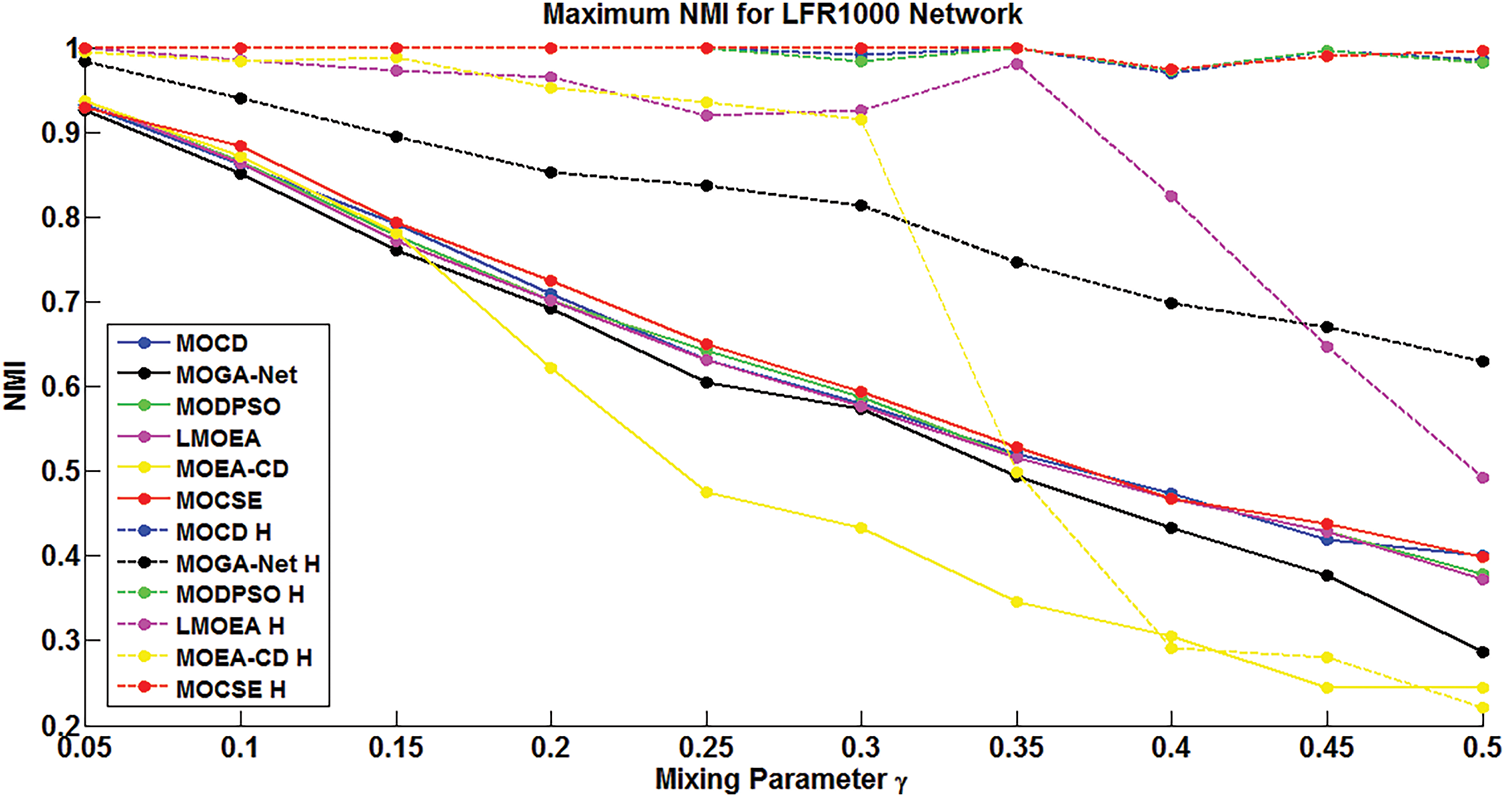
Figure 5: Overall performance of all models based on their maximum NMI for the ten datasets of LFR-1000 nodes. Dashed lines show the results with the community strength enhancement (CSE), whereas the results without it are represented by solid lines
In both figures, dashed lines represent the results obtained with the MOCSE algorithm, while solid lines represent the results obtained with the traditional MOEA/D algorithm.
Figs. 6 and 7 demonstrate a comparative analysis of six community identification models evaluated on synthetic LFR networks, classified into two groups based on network size: 128 nodes and 1000 nodes. For each group, two figures are provided to illustrate the performance of the models before and after applying the proposed mutation strategy. The bars represent the average performance of 10 independent runs, while the error bars represent the difference between the average and maximum scores, indicating the variability or instability of each model. The proposed mutation strategy has a significant impact on most models, particularly the more difficult LFR-1000 networks.
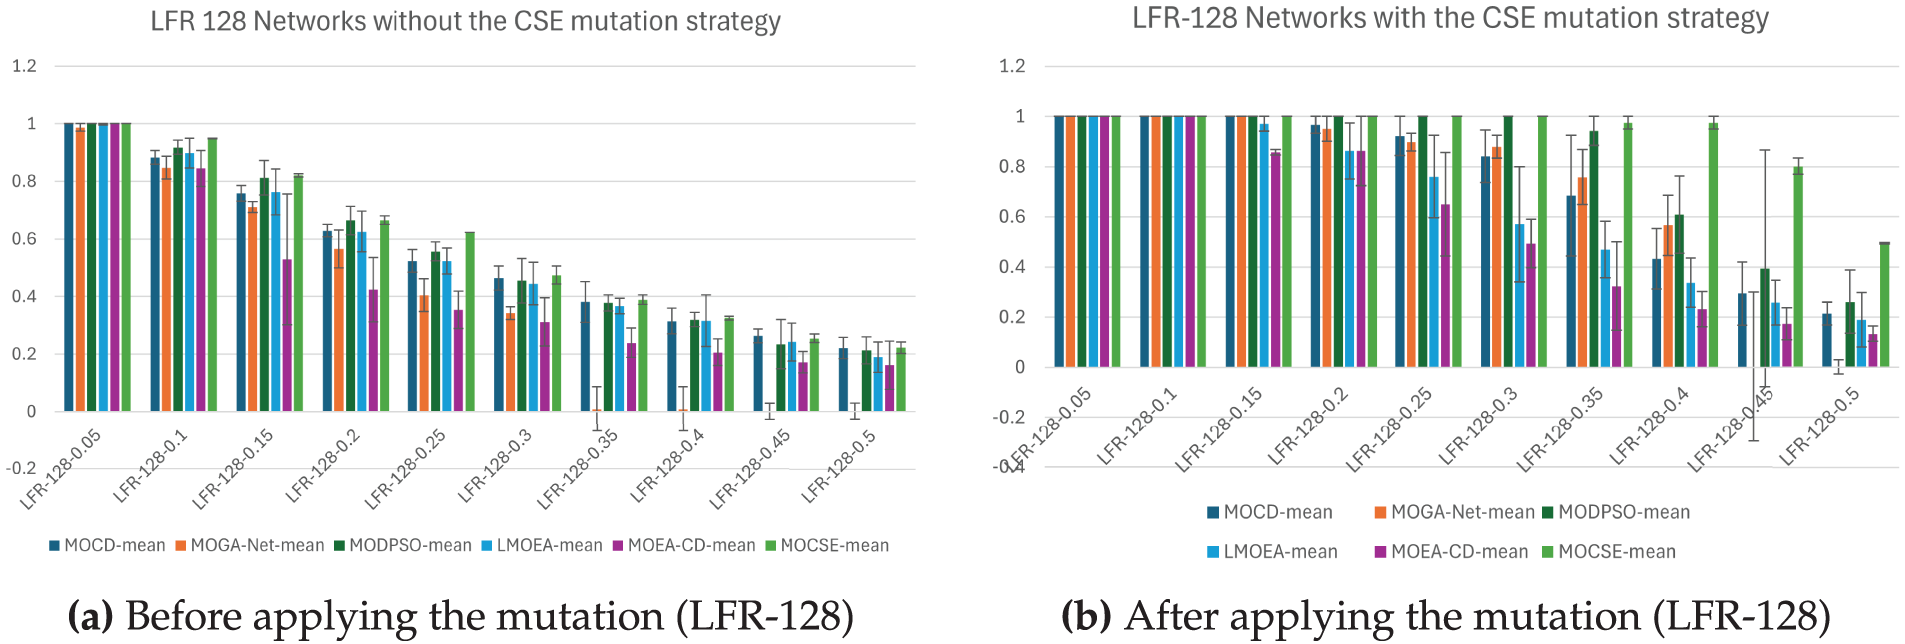
Figure 6: Comparison of model performance on LFR-128 networks before and after mutation
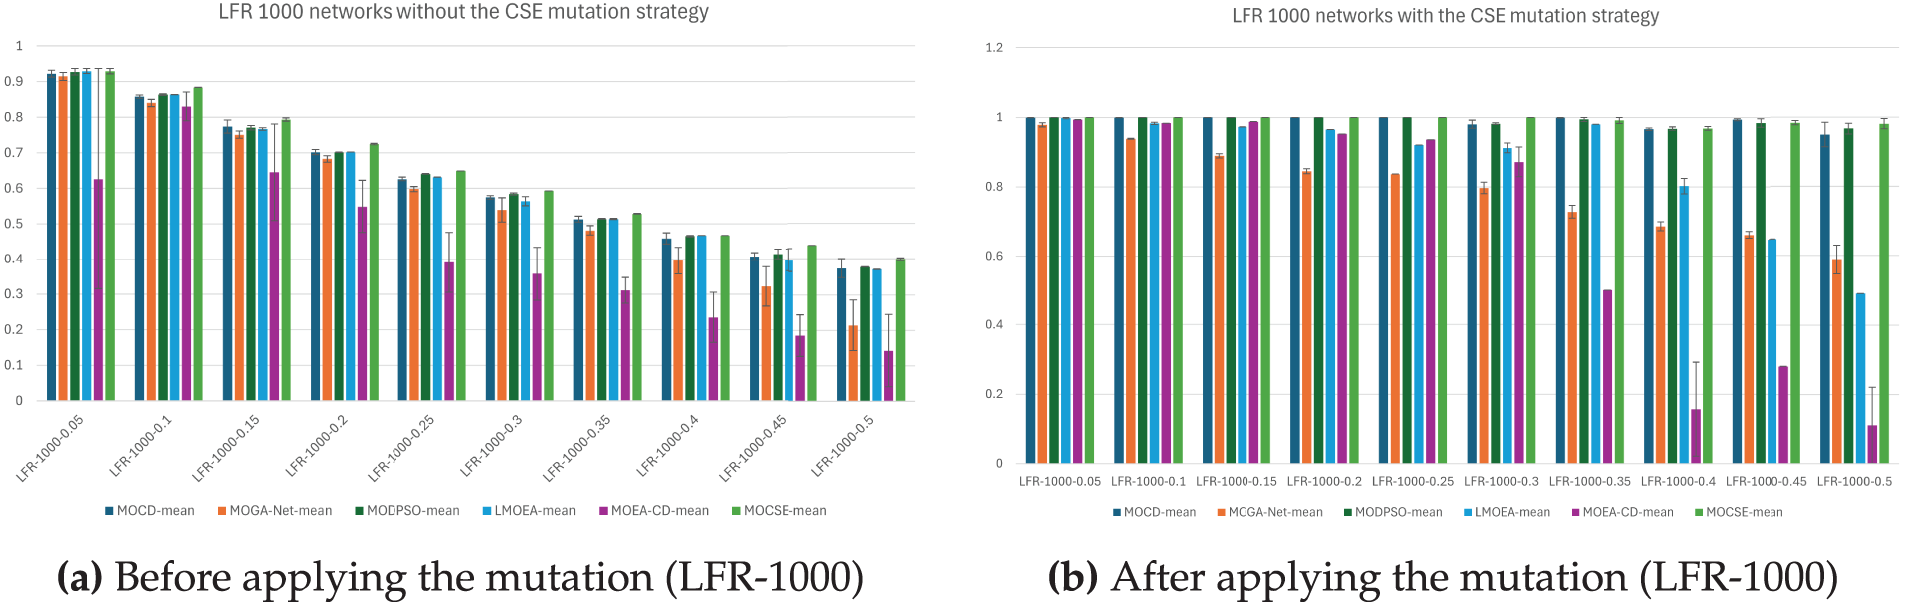
Figure 7: Comparison of model performance on LFR-1000 networks before and after mutation
5.4 Experiments on Actual Networks with a Known Truth Partition
Comprising four actual networks, the actual partitions are known. Performance measures used to compare the results of MOGA-Net, MOCD, MODPSO, LMOEA, HMM-MODCD, and the proposed model on these networks are NMI and Q. Tables 1 and 2 present these comparisons over ten runs. Table 1 shows the results with the MOEA/D algorithm, while Table 2 shows the results with the MOCSE algorithm.
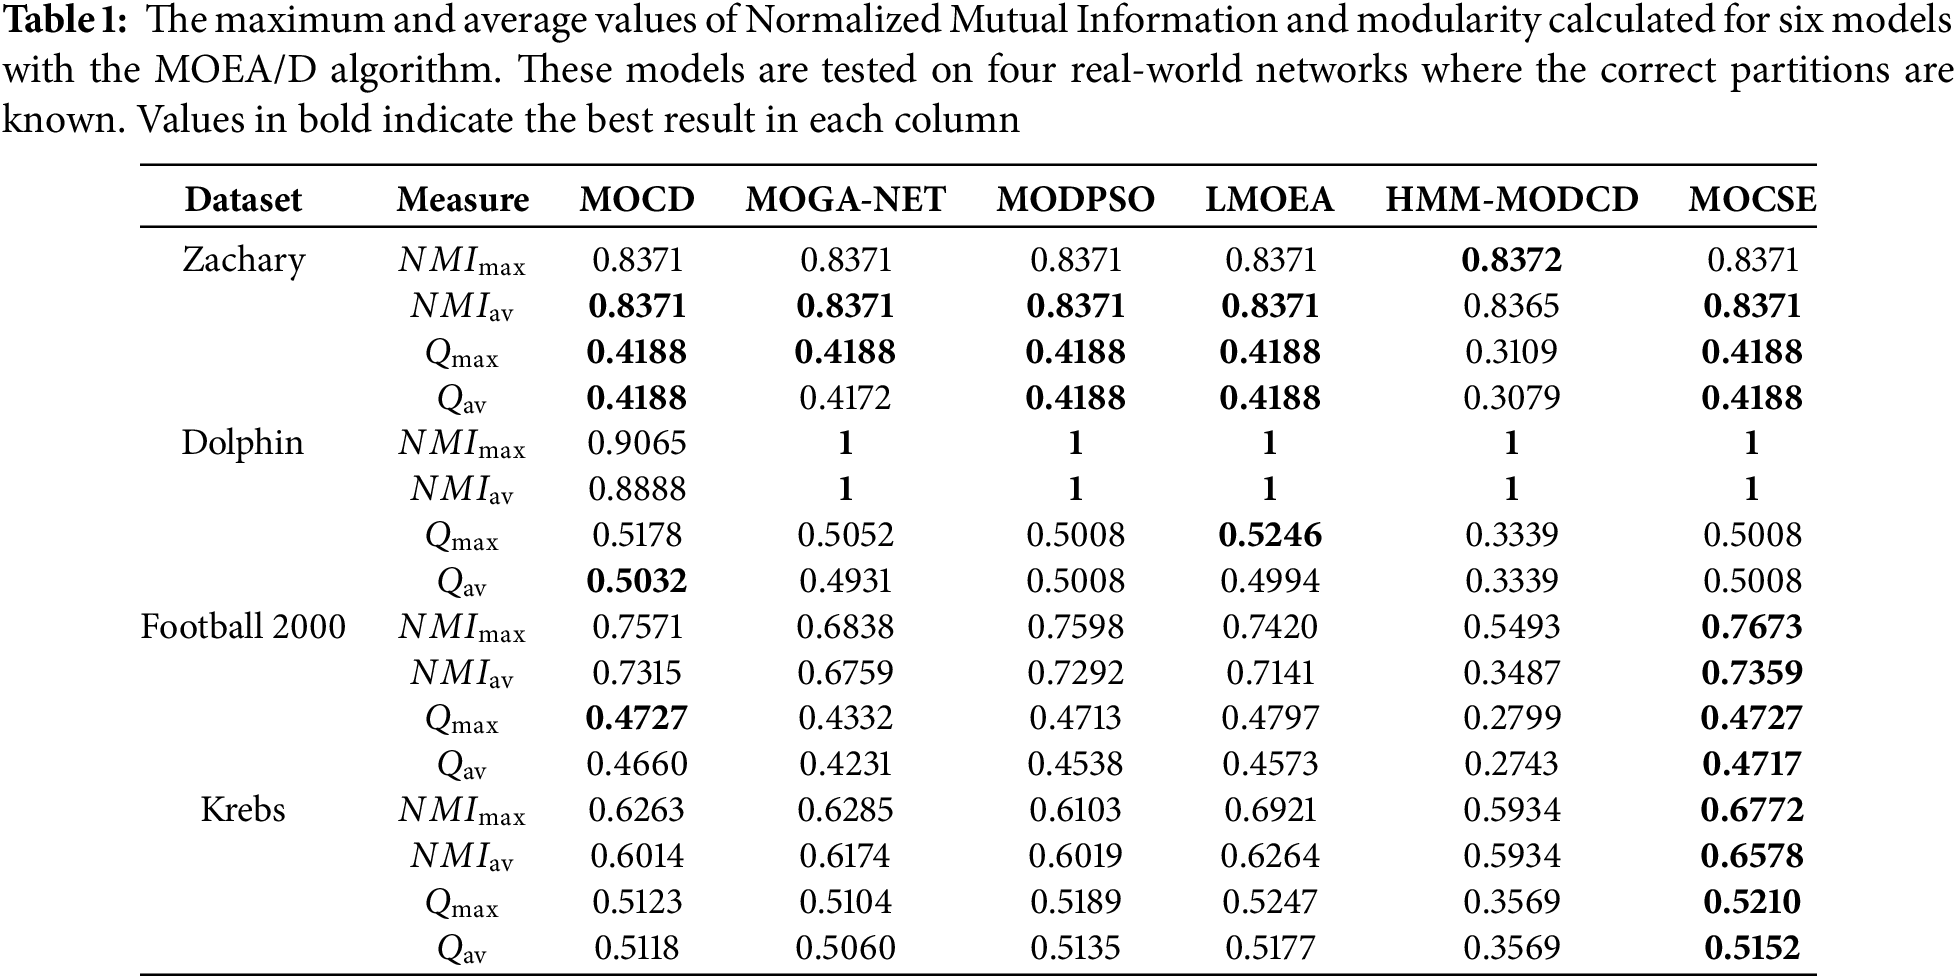
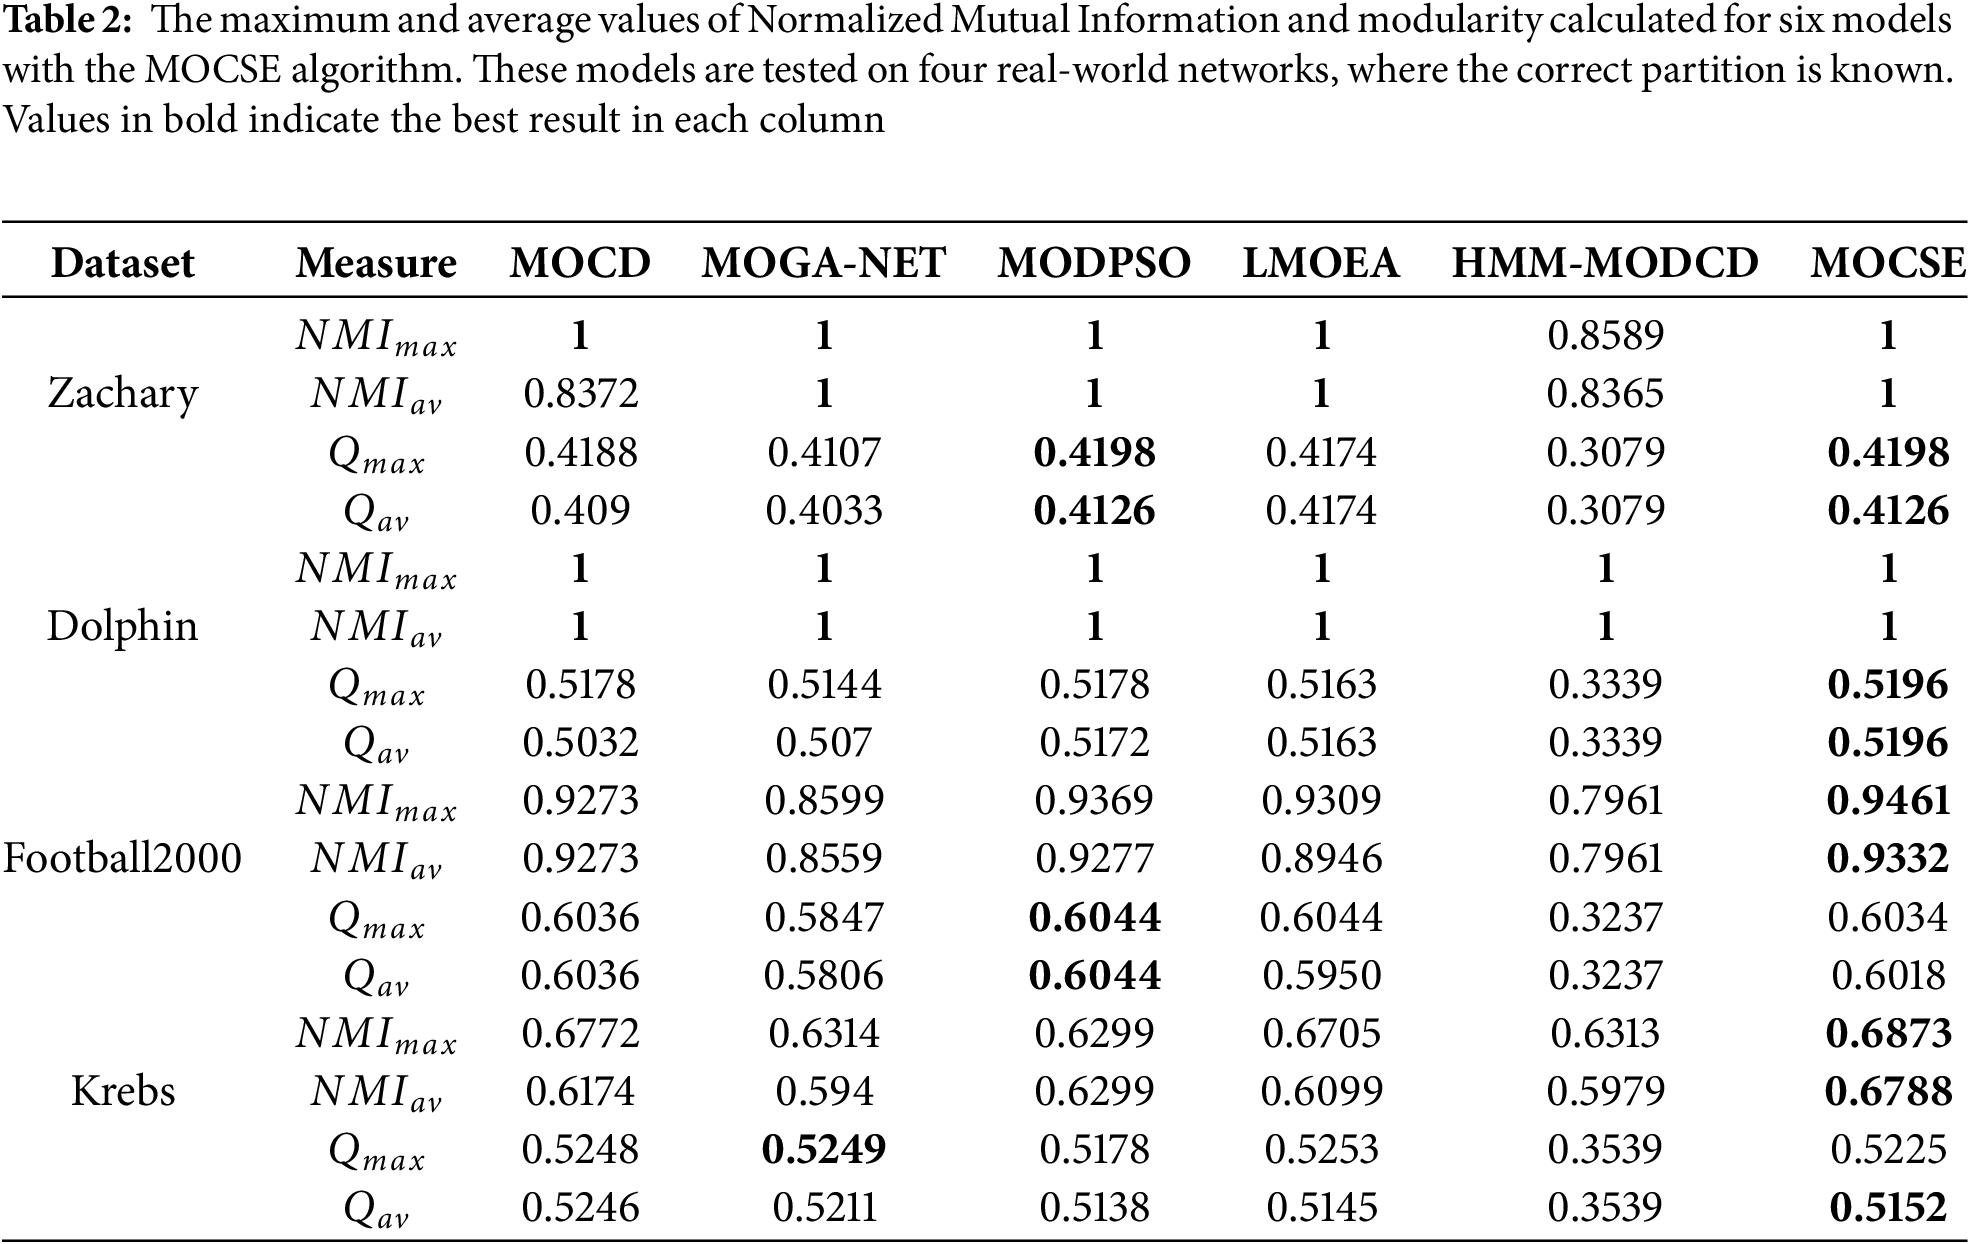
In the Zachary Karate Club network, note that only nodes 3 and 10 have an equal number of internal and external links, with five internal connections for node 3 and one external connection for node 10; all other nodes have more internal connections than external connections. With the MOEA/D algorithm, all models correctly detected the two main communities. However, node 10 was misclassified, resulting in an NMI of 0.8372 and a modularity score of 0.4188. When the MOCSE algorithm is applied, the output of all models shows a match with the ground truth partition, indicating that the MOCSE algorithm significantly improves the accuracy of community identification.
In the Dolphin network, all nodes other than node 40 have more internal connections than external connections. Node 40 poses a particular challenge because it has only one connection within each community and one connection between communities. Therefore, its classification is complicated. In the absence of the CSE strategy, MOGA-Net was unable to accurately classify node 40, but its maximum NMI was 0.9065. Other models achieved perfect results. With the applied MOCSE algorithm, all models found the best partition in a few generations, demonstrating the effectiveness of this strategy in steering the search process away from local optima.
In the Football network, several nodes, including 12, 25, 51, and 59, exhibited more external links than internal links, which were structurally weak within the network. This means that they belong to fewer internal community structures. Nodes 29, 37, 43, 91, 111, and 136 have only external connections. The baseline MOCSE model achieved an NMI of 0.7673, outperforming the others, which were dramatically less accurate. After taking into account all other versions, with the Closen strategy, the NMI had increased to 0.9461, leading even this strongest competitor. These figures demonstrate the CSE strategy’s ability to provide weak nodes with new, enriched communities, where their links outside take on significantly more important roles within the overall network structure.
The Krebs network has many weak nodes structurally, meaning it has more connections either to external nodes or to nodes already within the network, such as nodes 1, 3, 5, and 6. In addition, nodes 47, 49, and 77 are externally connected. The baseline of the MOCSE model was an NMI of 0.6772, which, with the introduction of the CSE strategy, improved to 0.6873. This modest improvement provides some support for the main working hypothesis that increasing community cohesion helps identify weak structural patterns.
In all networks considered, including the CSE strategy, resulted in a significant enhancement of both NMI and modularity (Q) in the majority of cases. It also enabled models to break out of local optima more frequently, particularly in networks with weakly or ambiguously affiliated nodes. These findings highlight the importance of incorporating community strength considerations into the mutation process as a means of enhancing the structural fidelity of recovered communities. Still, HMM-MODCD seemed to be the worst model, giving the lowest NMI and Q values in many networks. However, MOCSE, the model proposed in this work, demonstrated relatively good performance, achieving the highest scores on main networks such as Football and Krebs, and outperforming many other methods.
In addition, apart from what the tables show quantitatively, Fig. 8 displays the bi-objective distribution of solutions from the enhanced model based on two objective functions. This figure displays a single generation selected from one of the experimental runs and is intended to provide a graphical representation of the solution distribution within that generation as the algorithm progresses.
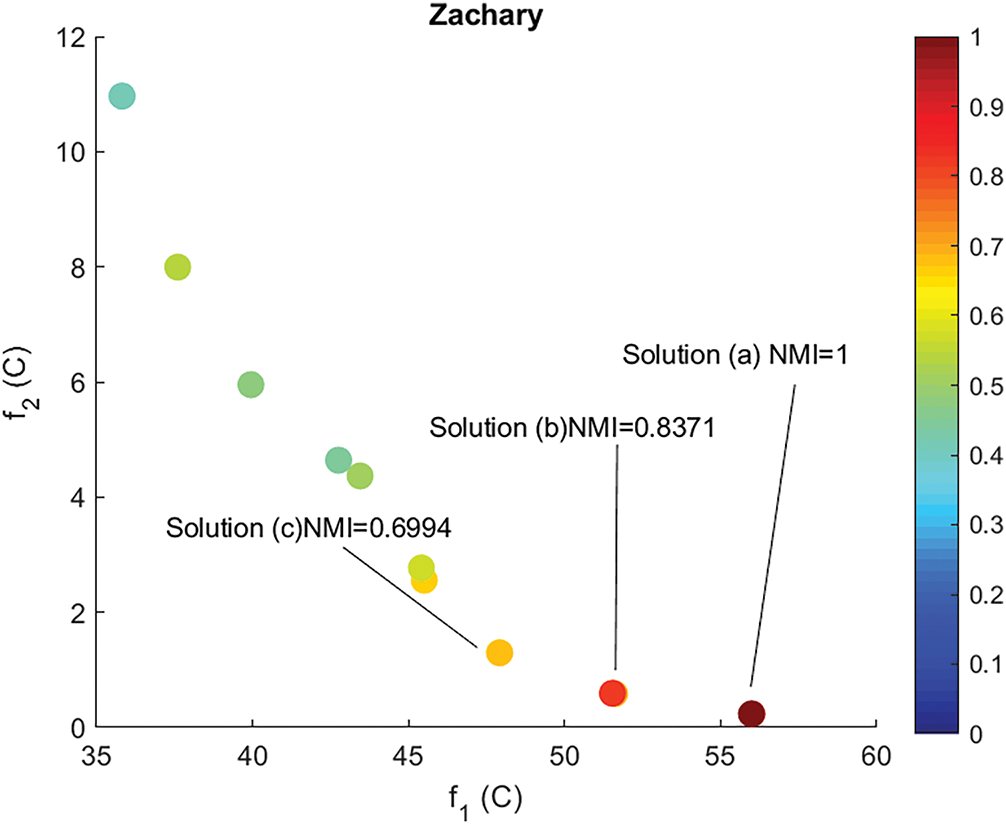
Figure 8: Bi-objective solutions’ distribution got within a single generation, randomly chosen from one of the 10 experimental runs, over the Zachary Karate Club network. The color gradient denotes the NMI value for each solution
Every point in the figure denotes a community partition generated by the algorithm. The values of the two objective functions are placed along the horizontal and vertical axes, with a color gradient illustrating the NMI value corresponding to the level of similarity between each solution and the actual (ground truth) community structure of the given network.
The visualizations demonstrate how the new model can generate a diverse set of non-dominated solutions within a single generation. Some of these solutions have a high similarity to the reference structure (high NMI), while others show different trade-offs between the two objectives. This demonstrates how effectively the model guides the search process toward the top solutions while maintaining genuine diversity in the solution space, a key feature of multi-objective optimization algorithms.
5.5 Experiments on Actual Networks with an Unknown Truth Partition
Evaluate the performance of the MOCSE algorithm and the proposed model on three structures of an unknown community in the real world using Qav to measure the quality of partition. Include six models in the comparison to highlight the impact of the proposed CSE mutation strategy on their performance in Tables 3 and 4.
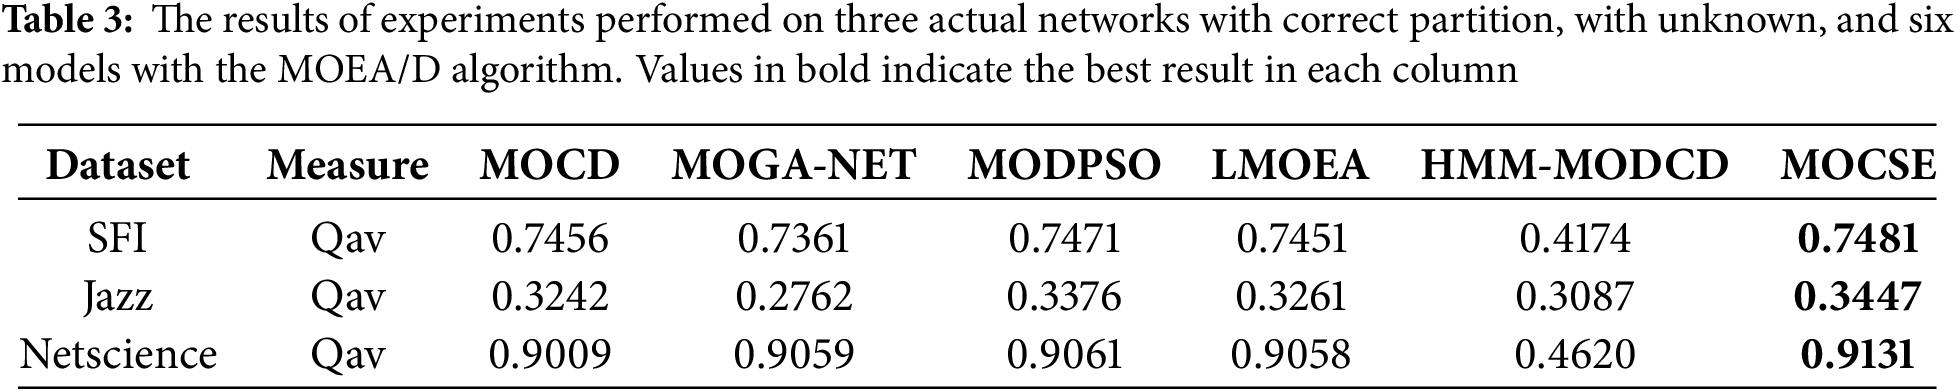
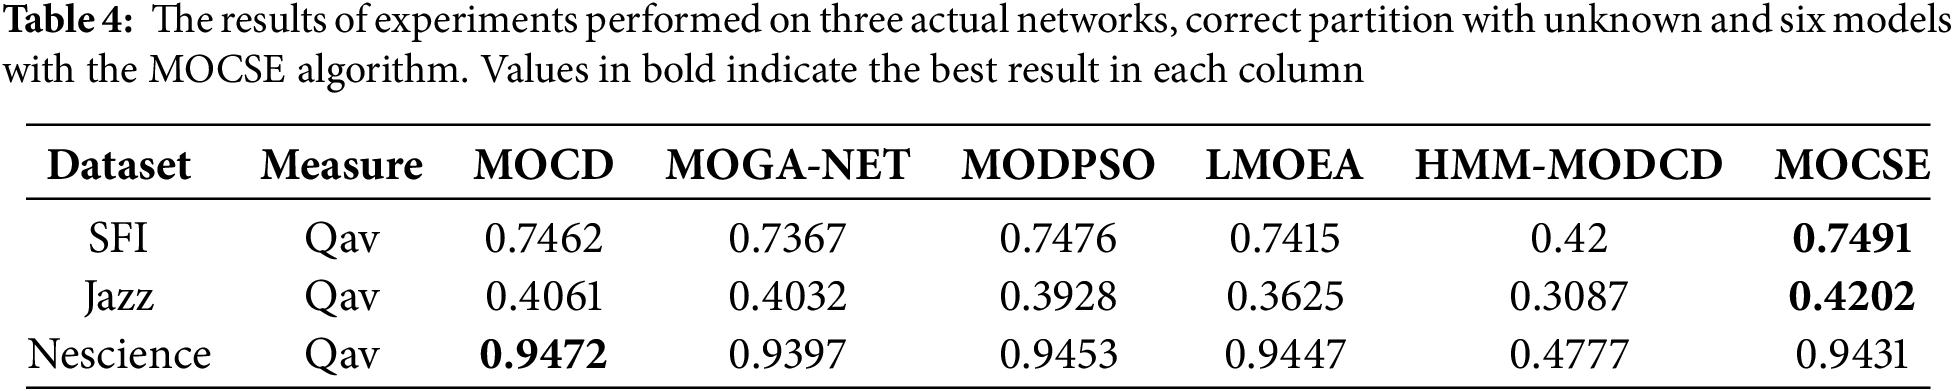
Within the SFI network, the proposed and the MODPSO models have the best performance. The MOCSE model exhibited a visible performance lead over its counterparts in the Jazz network, which has complex relationships among its members, achieving the highest Qav value of 0.4202. In contrast, other models achieved lower values: MODPSO (0.3928) and MOGA-NET (0.4032). This demonstrates the effectiveness of the CSE strategy in enhancing the exploration of networks with complex social structures.
The Netscience network had the highest Qav value of 0.9472 for the MOCD base model, but the differences between models were not very high. MOCSE was second with a Qav value of 0.9431. The overall performance of each model is excellent.
The results show that the MOCSE model, with the integration of the CSE mutation strategy, improves performance between networks than other models, particularly in those networks that require strong exploration capabilities. This validates that the mutation strategy has a significant impact on enhancing the quality of solutions and community partitioning. Furthermore, the model shows varied network convergence performance, which supports the potential generalizability of different types of real-world networks.
5.6 Discussion of Contributing Factors
This section provides a concise summary and interpretation of the performance differences observed among the evaluated algorithms, highlighting the key factors influencing their effectiveness across various network types. In general, the reported performance differences are attributed to the inherent strengths and limitations of each objective function model, the structural characteristics of the networks, and the mutation strategies employed. In the MOGA-Net model, both objective functions focus on improving the internal connectivity of communities but lack attention to external connectivity and boundaries between communities, making them ineffective in networks where community boundaries are unclear. The MOCD model utilized modularity-based objective functions, categorized into inter-objective and intra-objective functions, to enhance understanding of community structure. However, it is limited by the resolution limit problem. This limitation makes it difficult for the model to detect small communities within large networks. The MODPSO model employs the KKM and RC objectives. KKM enhances internal connectivity, while RC reduces boundaries between communities. However, this function overlooks internal connectivity, thereby reducing its effectiveness in specific networks. In the LMOEA model, NRA focuses on maximizing internal connectivity relative to community size, but does not explicitly consider the clarity of community boundaries, which may lead to poor detection of ambiguous communities. The same constraint of the RC is mentioned above. Although HMM-MODCD evaluates communities at the node level, its focus on local connections limits its ability to capture the overall structure of the network, making it less effective in complex networks. Regarding the proposed model, we addressed the issue identified in RC by introducing a new function that considers both internal and external connections. For these reasons, performance variation appears.
6 Statistical Evaluation of Performance across Different Network Types
To evaluate the effectiveness of the proposed model and heuristic mutation strategy, statistical tests were conducted on three types of networks: synthetic networks, real networks with known ground-truth partitions, and real networks with unknown ground-truth. For each network type, the Friedman test [41] was employed to determine if there were significant differences between the models compared, followed by the Nemenyi post hoc test [41], which identified which pairs of models were different. These analyses evaluated the effectiveness of the heuristic strategy on the performance results before and after its implementation in the model’s evaluation and stability.
6.1 Statistical Evaluation on Synthetic Networks
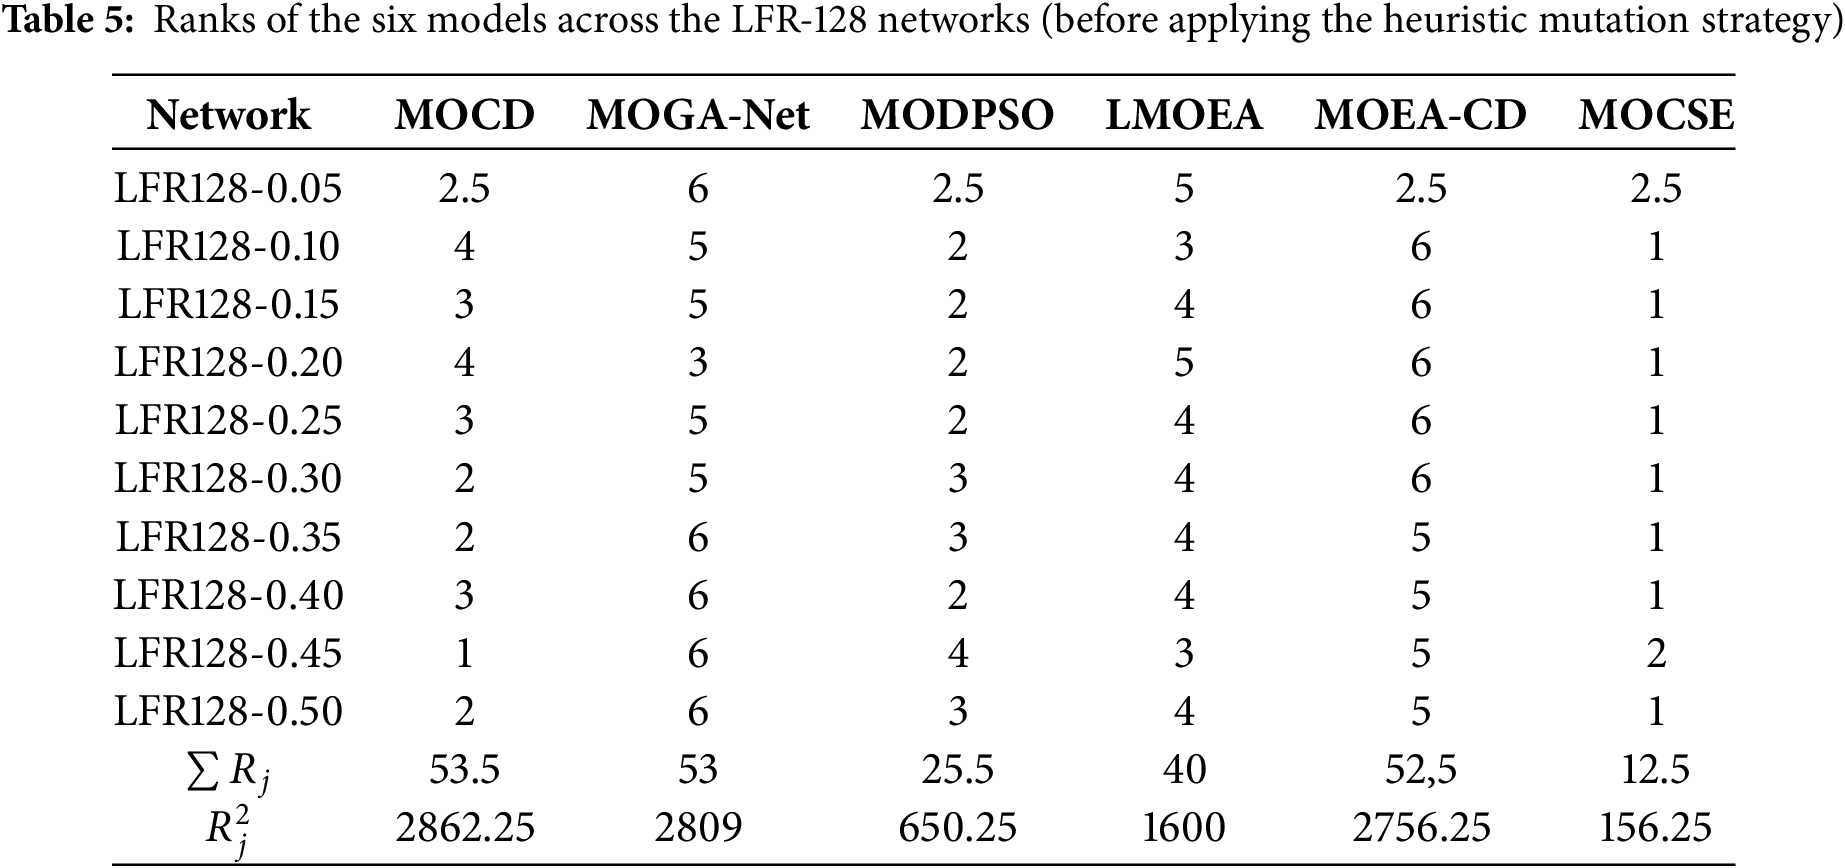
Table 5 shows the rank of each model for each network without the CSE mutation strategy. Lower rankings indicate superior performance. These ranks are then employed in the Friedman test to determine if the differences between models are significant. From Table 5, the Friedman test was calculated. The number of datasets is
The p-value, calculated from the chi-squared distribution with
Since the Friedman test revealed a significant difference between the models, the Nemenyi post-hoc test was employed to assess the differences between them and determine which ones were significantly different from each other. The trial’s results were obtained by averaging the ranks of the models in Table 5.
Table 6 demonstrates the average rank of the models across the 10 synthetic networks. These values were employed to calculate the differences between pairs of means in the Nemenyi post hoc test. Based on the Studentized range distribution table, the critical value for

Accordingly, the critical difference (CD) is computed using the formula:
The calculated critical difference is 2.319, which is used to determine whether or not the average rank of a model is greater than that of another. Any absolute difference between the average rank of the two models that is greater than the CD value is considered significant at the 0.05 level. This facilitates the identification of which specific models have a greater propensity to succeed than others in a statistically significant manner. As demonstrated in Table 7, the model’s name, MOCSE, was superior to all other models with a significant difference. It attained a significantly higher average rank than MOEA-CD, MODPSO, LMOEA, MOCD, and MOGA-Net, all of which were considered to have a critical difference of 2.281. Other models that were tested failed to demonstrate a significant advantage over multiple competitors; MOCSE was the most successful of these in this experimental setting. Table 8 shows the rank of each model for each network with the CSE mutation strategy.
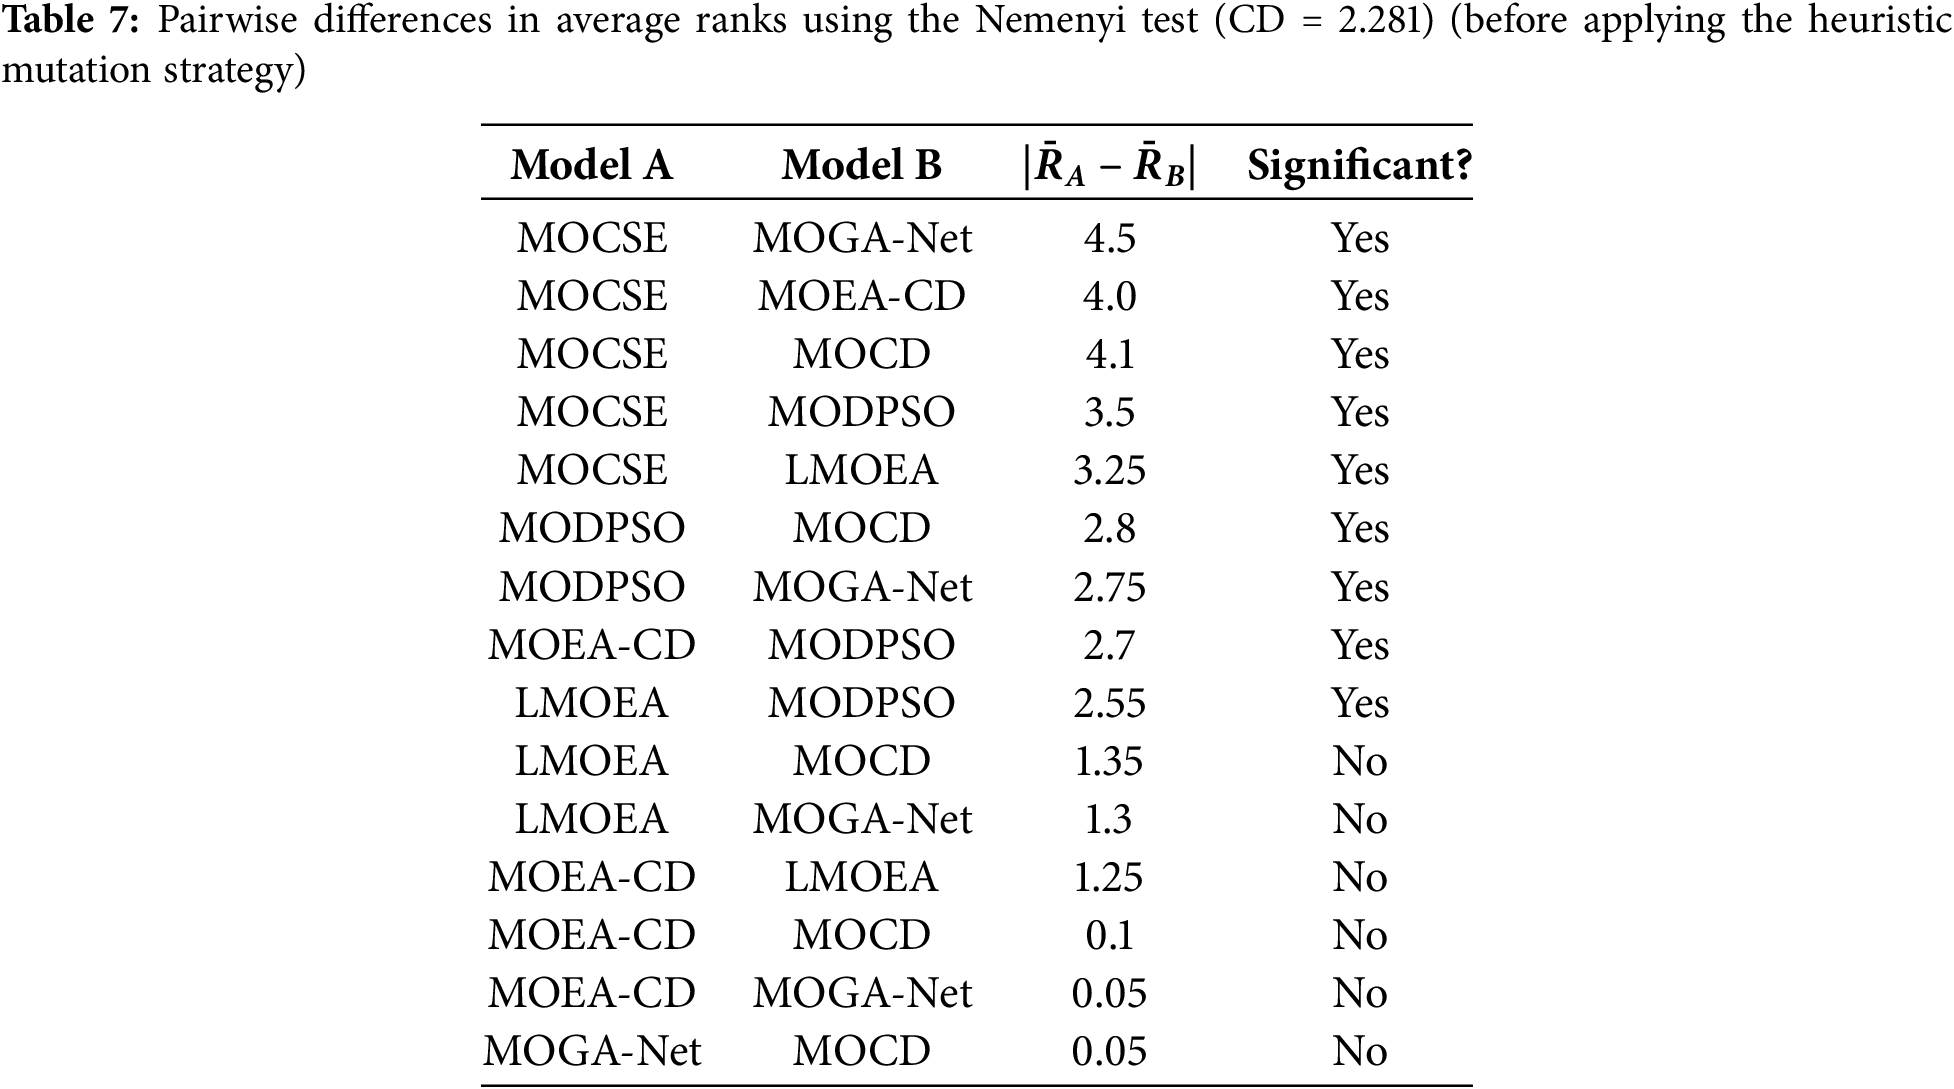

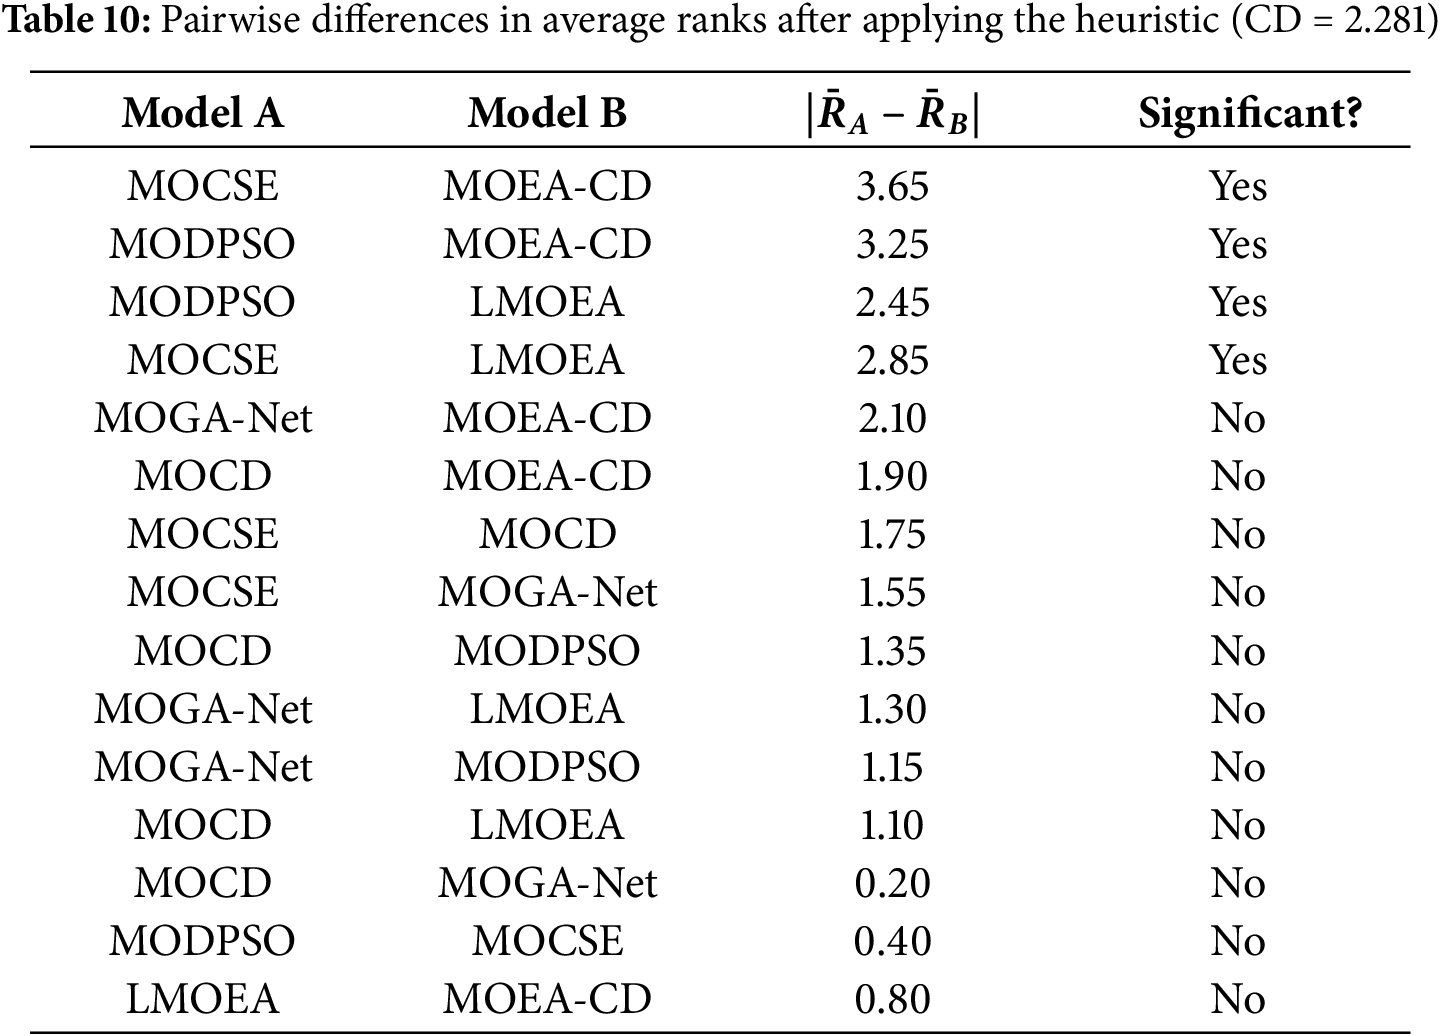
Table 9 shows the average rank of the models with the CSE mutation strategy in the 10 LFR 128 synthetic networks. These values were used to calculate the differences between pairs of means in the Nemenyi post hoc test. As shown in Table 10, after applying the CSE mutation strategy, only four of the fifteen pairwise comparisons showed statistically significant differences. The results obtained after applying the CSE mutation strategy indicate that MOCSE maintains the lowest average rank and continues to statistically outperform MOEA-CD, LMOEA, and MODPSO. Although the number of significant differences decreases, indicating an improvement in the consistency between the models, MOCSE consistently outperforms the other models. This confirms both the effectiveness of the proposed model and the positive impact of the CSE mutation strategy on improving the overall performance of the model.

From Table 11, the resulting Friedman statistic resulted in
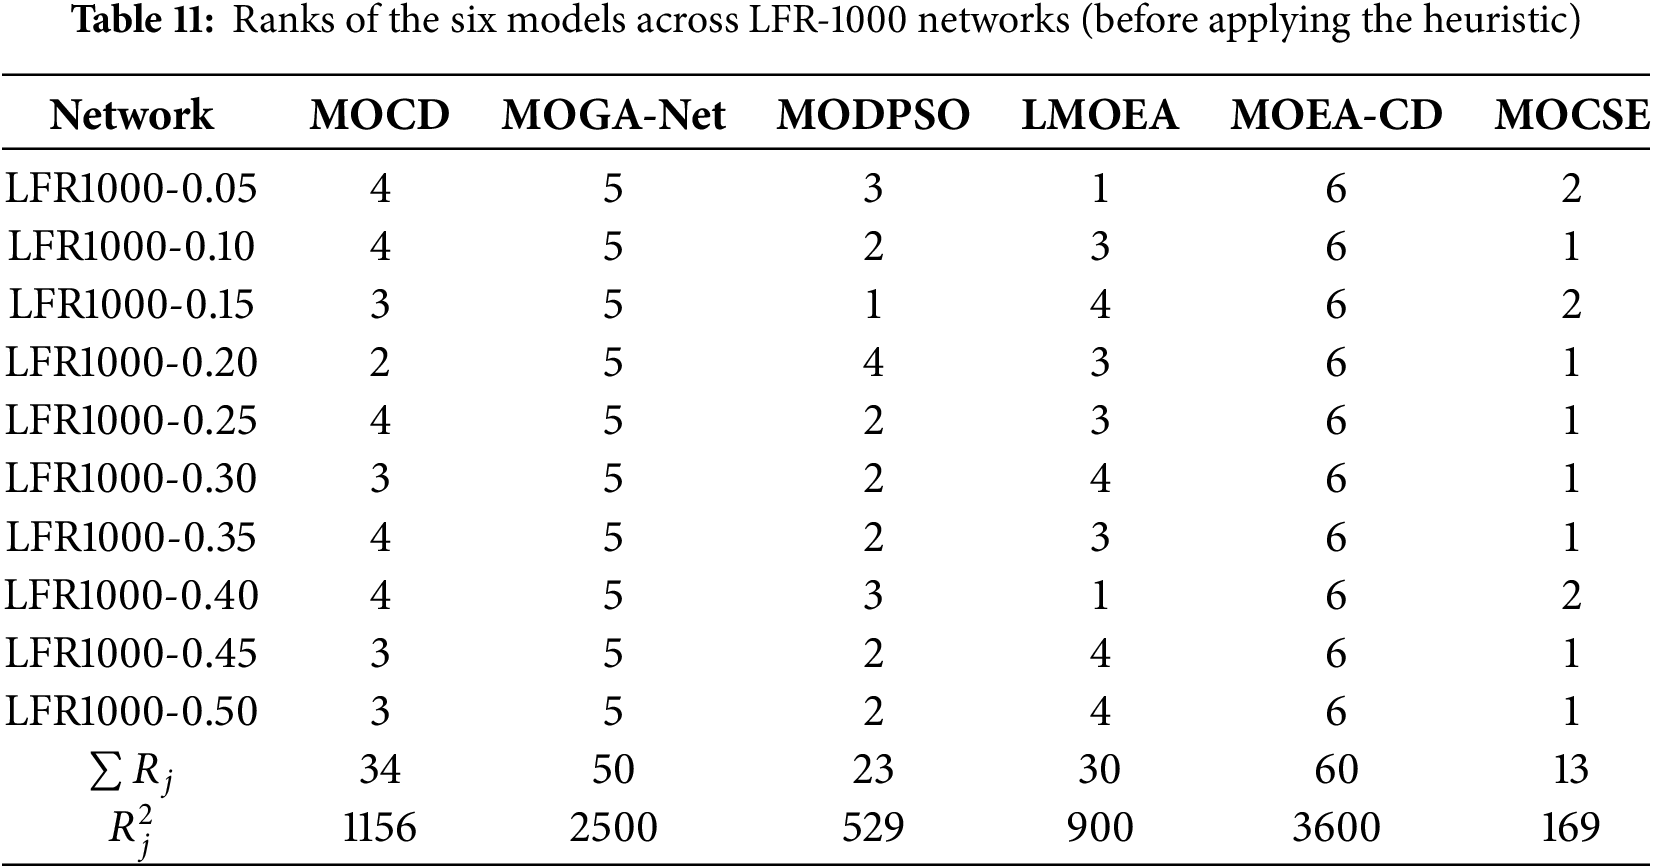
The p-value was
Table 12 demonstrates the average rank of the models without the CSE mutation strategy across the 10 LFR 1000 synthetic networks. These values were employed to calculate the differences between pairs of means in the Nemenyi post hoc test.
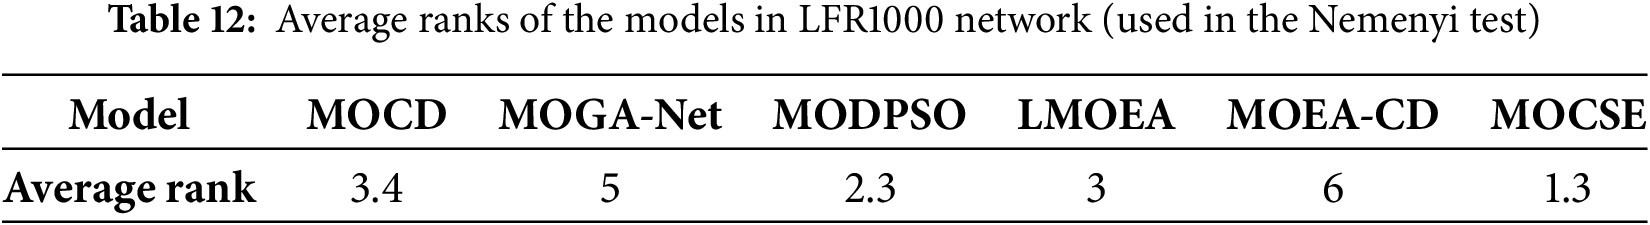
As shown in Table 13, the proposed model (MOCSE) shows a statistically significant advantage over MOEA-CD, MOGA-Net, and LMOEA. These results confirm that MOCSE can achieve robust performance on large-scale synthetic networks even without applying the CSE mutation strategy.

From Table 14, the resulting Friedman statistic resulted in

The p-value was
Table 15 demonstrates the average rank of the models with the CSE mutation strategy across the 10 LFR 1000 synthetic networks. These values were employed to calculate the differences between pairs of means in the Nemenyi post hoc test. See Table 16.


Even after applying the heuristic, MOCSE still statistically outperforms both models (MOGA-Net and LMOEA), demonstrating its continued strong performance. The applied mutation strategy improved the consistency between models without affecting the effectiveness of the proposed model. This highlights the robustness of MOCSE and the added value of the mutation strategy.
6.2 Statistical Evaluation on Real Networks with a Known Actual Partition
This section presents a statistical evaluation of the six models on real-world networks with a known actual partition. The Friedman test starts with Table 17, which shows the rankings of the six models on four real networks before applying the CSE mutation strategy. Lower rankings indicate better performance on a particular dataset.

The MOCSE model has the lowest average rank (2.25) and is therefore the best overall performer. In contrast, MOCD and MOEA-CD perform relatively poorly, with average ranks of 4.25 and 4.00, respectively.
To evaluate the statistical differences between the six models before applying the CSE mutation strategy, a Friedman test was conducted based on the performance evaluation results of four real networks. The results show that the Friedman statistic is
To further investigate the performance advantage, a win count analysis was performed, as shown in Table 18, which counted the number of times each model achieved the top ranking among the four networks.

After applying the CSE mutation strategy, a Friedman test was performed on the four actual networks. The results
To supplement the statistical analysis, we calculated the number of wins according to the rankings shown in Table 19. MOCSE ranks first on all four networks and shows a consistent advantage after applying the CSE strategy, although the difference is not statistically significant.

In summary, although the Friedman test did not reveal statistically significant differences, the ranking results indicate that the proposed model (MOCSE) consistently outperforms other models. In addition, the application of the CSE mutation strategy helps improve the performance of multiple models, reflecting its overall positive impact on the quality of the solution. See Table 20.

6.3 Statistical Evaluation on Real Networks with an Unknown Actual Partition
This section presents the evaluation of the models regarding networks that have no known actual partition. Therefore, the evaluation is conducted solely based on the modularity (Q) value. To determine if there are significant differences among the six models, the Friedman test is used. The ranking of the models according to their modularity scores is provided in Table 21 to perform the Friedman test.

This test is based on modularity values obtained from three real-world networks with unknown actual partitions. The result of the Friedman test was
As presented in Table 22, the average rank of each model is based on its modularity performance across the three networks. To determine which differences between pairs of models are significant, a comparison was conducted between each pair using the Nemenyi post-hoc test.

As shown in Table 23, the pairwise comparison using the Nemenyi test revealed MOCSE significantly outperformed both MOGA-Net and MOEA-CD, as the differences in average ranks exceeded the critical difference (CD = 3.578). The differences among the remaining models were not statistically significant with respect to modularity across the evaluated networks.

The ranks after applying the CSE mutation strategy are summarized in Table 24. The Friedman test produced a numerical value of

This implies that the models’ capabilities were not significantly different following the CSE strategy of mutation. This outcome may be attributed to the models’ consistent performance after the mutation, which decreased the variation in rank and limited the test’s capacity to differentiate significant differences. Table 25 shows the number of times each model achieved the top rank (i.e., rank = 1) across the three networks.

The results indicate that MOCSE achieved the highest number of wins, ranking first in two out of the three networks. This consistent top performance supports the effectiveness of the CSE mutation strategy. It highlights the superiority of the proposed model in terms of modularity, even in the absence of statistically significant differences detected by the Friedman test.
7 Time Complexity of Six Algorithms
Table 26 shows the computational time of six algorithms (MOCD, MOGANet, MOPSO, MOEACD, LMOEA, and MOCSE); all these algorithms are different only in the fitness functions. The differences in running time between the algorithms were related to several factors: the complexity of the algorithm, the number of nodes in each dataset, parameter tuning, and the complexity of fitness.

This paper presents a new multi-objective mathematical model that enhances the identification of communities within social networks. In addition, a proposed multi-objective community strength enhancement (MOCSE) algorithm is presented. The proposed model is accompanied by a multi-objective evolutionary algorithm based on decomposition (MOEA/D), which finds a reasonable trade-off between conflicting objectives and provides a set of Pareto-optimal solutions that represent the community structure. In addition, a new mutation operator (community strength enhancement (CSE) strategy) was proposed to enhance the multi-objective evolutionary algorithm’s robustness and efficiency, as well as speed up the convergence of the algorithm. The MOEA/D algorithm and the MOCSE algorithm have been employed to address the issue of community detection. The results of the experiments demonstrated that the proposed algorithm outperformed in terms of modularity and NMI measures. The two combined contributions illustrate how each is complementary in strength and how together they have the potential to enhance evolutionary algorithms. Finally, Table 27 lists the names of the models, their associated functions, and the studies that used each model.

1. The performance of the MOCSE algorithm, like other evolutionary methods, may be sensitive to parameter settings. Although parameters were empirically tuned in this study, developing adaptive control mechanisms could further improve robustness.
2. Due to the iterative and population-based nature of evolutionary algorithms, the proposed method requires moderate computational resources, especially when applied to large-scale networks. This highlights the importance of considering hardware capabilities in future extensions.
Future Work: Future improvements of the MOCSE algorithm may involve expanding its scope to include dynamic networks, where the structure changes over time. Therefore, mechanisms are needed to maintain temporal order and make small incremental changes to community structures as the network evolves. Another exciting direction is the integration of deep learning methods, particularly graph neural networks (GNNs) or node embedding methods, to enhance the representation of information regarding both structural and attribute properties. This integration would complement the evolutionary process by providing latent features that have the potential to inform optimization. Combining the benefits of MOCSE’s framework for decomposing networks with the ability to learn complex, large, and evolving temporal networks may lead to a hybrid approach that can handle large-scale, complex, and temporal networks with a higher degree of detail.
Acknowledgement: Not applicable.
Funding Statement: The authors received no specific funding for this study.
Author Contributions: The authors confirm the contribution to the paper as follows: Study conception and design: Amenah Dahim Abbood, Asal Jameel Khudhair. Data collection: Asal Jameel Khudhair. Analysis and interpretation of the results: Amenah Dahim Abbood, Asal Jameel Khudhair. Draft manuscript preparation: Asal Jameel Khudhair. All authors reviewed the results and approved the final version of the manuscript.
Availability of Data and Materials: The datasets used in this study are openly available in public repositories. The real-world networks used include:
1. Zachary’s Karate Club: https://networkrepository.com/karate.php (accessed on 27 August 2025).
2. Dolphin social network: https://networkrepository.com/soc-dolphins.php (accessed on 27 August 2025).
3. Football network: https://networkrepository.com/football.php (accessed on 27 August 2025).
4. Krebs (Political Books) network: https://networkrepository.com/polbooks.php (accessed on 27 August 2025).
5. Jazz musicians network: https://networkrepository.com/jazz.php (accessed on 27 August 2025).
6. Netscience collaboration network: http://www-personal.umich.edu/mejn/netdata/ (accessed on 27 August 2025).
7. SFI network: Available through various sources such as https://github.com/gephi/gephi/wiki/Datasets (accessed on 27 August 2025).
8. The synthetic networks with 128 and 1000 nodes were generated using the LFR benchmark generator and are available at: https://www.santofortunato.net/resources (accessed on 27 August 2025) or https://sites.google.com/site/santofortunato/benchmarks (accessed on 27 August 2025).
Ethics Approval: Not applicable. This study did not involve human or animal subjects.
Conflicts of Interest: The author declares no conflicts of interest to report regarding the present study.
References
1. Abdulrahman MM, Abbood AD, Attea BA. The influence of NMI against modularity in community detection problem: a case study for unsigned and signed networks. Iraqi J Sci. 2021;62(6):2064–81. doi:10.24996/ijs.2021.62.6.32. [Google Scholar] [CrossRef]
2. Abbood AD, Attea BA, Hasan AA, Everson RM, Pizzuti C. Community detection model for dynamic networks based on hidden Markov model and evolutionary algorithm. Artif Intell Rev. 2023;56(9):9665–97. doi:10.1007/s10462-022-10383-2. [Google Scholar] [CrossRef]
3. Abduljabbar DA. Community detection in modular complex networks using an improved particle swarm optimization algorithm. Iraqi J Sci. 2023;64(8):4228–43. doi:10.24996/ijs.2023.64.8.41. [Google Scholar] [CrossRef]
4. Ibraheem SF, Al-Sarray B. A review of community detection based on modularity optimization in complex networks. Iraqi J Sci. 2024;65(5):2775–93. doi:10.24996/ijs.2024.65.5.34. [Google Scholar] [CrossRef]
5. Ahmed MW, Faraj K. A review: multi-objective algorithm for community detection in complex social networks. UHD J Sci Technol. 2025;9(1):44–54. doi:10.21928/uhdjst.v9n1y2025.pp44-54. [Google Scholar] [CrossRef]
6. Attea BA, Abbood AD, Hasan AA, Pizzuti C, Al-Ani M, Özdemir S, et al. A review of heuristics and metaheuristics for community detection in complex networks: current usage, emerging development and future directions. Swarm Evol Comput. 2021;63(8):100885. doi:10.1016/j.swevo.2021.100885. [Google Scholar] [CrossRef]
7. Farrokhpour Dizaj Y, Lotfi S, Hajipour J. A multi-objective social-based algorithm for community detection. Multimed Tools Appl. 2025;84(27):33095–124. doi:10.1007/s11042-024-20555-7. [Google Scholar] [CrossRef]
8. Chen L, Zhang J, Wu L, Cai X, Xu Y. Large-scale multi-objective optimization algorithm based on weighted overlapping grouping of decision variables. Comput Model Eng Sci. 2024;140(1):363–83. doi:10.32604/cmes.2024.049044. [Google Scholar] [CrossRef]
9. Bedi P, Sharma C. Community detection in social networks. Wiley Interdiscip Rev Data Min Knowl Discov. 2016;6:115–35. [Google Scholar]
10. Xu Y, Ren T, Sun S. Community detection based on node influence and similarity of nodes. Mathematics. 2022;10(6):970. [Google Scholar]
11. Saeed HS, Abbood AD. Enhanced evolutionary algorithm for dynamic community detection using a vulnerable node reassignment based mutation. Int J Intell Eng Syst. 2025;18(7):388–411. [Google Scholar]
12. Chandrika GN, Alnowibet K, Kautish KS, Reddy ES, Alrasheedi AF, Mohamed AW. Graph transformer for communities detection in social networks. Comput Mater Contin. 2022;70(3):5707–20. doi:10.32604/cmc.2022.021186. [Google Scholar] [CrossRef]
13. Zhu W, Li H, Wei W. A two-stage multi-objective evolutionary algorithm for community detection in complex networks. Mathematics. 2023;11(11):2702. doi:10.3390/math11122702. [Google Scholar] [CrossRef]
14. Yu L, Guo X, Zhou D, Zhang J. A multi-objective pigeon-inspired optimization algorithm for community detection in complex networks. Mathematics. 2024;12(10):1486. doi:10.3390/math12101486. [Google Scholar] [CrossRef]
15. Abbood AD, Hasan AA, Attea BA. Pearson coefficient matrix for studying the correlation of community detection scores in multi objective evolutionary algorithm. Period Eng Nat Sci PEN. 2021;9(3):796–807. doi:10.21533/pen.v9.i3.892. [Google Scholar] [CrossRef]
16. Abdulrahman MM, Abood AD, Attea BA. An enhanced multi-objective evolutionary algorithm with decomposition for signed community detection problem. In: 2020 2nd Annual International Conference on Information and Sciences (AiCIS); 2020 Nov 24–25; Fallujah, Iraq. p. 45–50. [Google Scholar]
17. Zhang Q, Li H. MOEA/D: a multiobjective evolutionary algorithm based on decomposition. IEEE Trans Evol Comput. 2007;11(6):712–31. doi:10.1109/tevc.2007.892759. [Google Scholar] [CrossRef]
18. Girvan M, Newman MEJ. Community structure in social and biological networks. Proc Natl Acad Sci U S A. 2002;99(12):7821–6. doi:10.1073/pnas.122653799. [Google Scholar] [PubMed] [CrossRef]
19. Newman MEJ, Girvan M. Finding and evaluating community structure in networks. Phys Rev E. 2004;69:026113. [Google Scholar]
20. Pizzuti C. GA-net: a genetic algorithm for community detection in social networks. In: International Conference on Parallel Problem Solving from Nature; 2008 Sep 13–17; Dortmund, Germany. p. 1081–90. [Google Scholar]
21. Pizzuti C. A multiobjective genetic algorithm to find communities in complex networks. IEEE Trans Evol Comput. 2011;16(3):418–30. doi:10.1109/tevc.2011.2161090. [Google Scholar] [CrossRef]
22. Li Q, Cao Z, Ding W, Li Q. A multi-objective adaptive evolutionary algorithm to extract communities in networks. Swarm Evol Comput. 2020;52(2):100629. doi:10.1016/j.swevo.2019.100629. [Google Scholar] [CrossRef]
23. Shahabi Sani N, Manthouri M, Farivar F. A multi-objective ant colony optimization algorithm for community detection in complex networks. J Ambient Intell Humaniz Comput. 2020;11(1):5–21. doi:10.1007/s12652-018-1159-7. [Google Scholar] [CrossRef]
24. Shi C, Yan Z, Cai Y, Wu B. Multi-objective community detection in complex networks. Appl Soft Comput. 2012;12(2):850–9. doi:10.1016/j.asoc.2011.10.005. [Google Scholar] [CrossRef]
25. Wu P, Pan L. Multi-objective community detection based on memetic algorithm. PLoS One. 2015;10(5):e0126845. doi:10.1371/journal.pone.0126845. [Google Scholar] [PubMed] [CrossRef]
26. Gong M, Cai Q, Chen X, Ma L. Complex network clustering by multiobjective discrete particle swarm optimization based on decomposition. IEEE Trans Evol Comput. 2013;18(1):82–97. doi:10.1109/tevc.2013.2260862. [Google Scholar] [CrossRef]
27. Angelini L, Boccaletti S, Marinazzo D, Pellicoro M, Stramaglia S. Identification of network modules by optimization of ratio association. Chaos. 2007;17(2):023101. doi:10.1063/1.2732162. [Google Scholar] [PubMed] [CrossRef]
28. Dhillon IS, Guan Y, Kulis B. A unified view of kernel k-means, spectral clustering and graph cuts. Austin, TX, USA: University of Texas at Austin; 2004. Technical Report. No. TR-04-25. [Google Scholar]
29. Zhou H, Chen G. A multiobjective optimization whale optimization based community detection algorithm. In: 2022 3rd International Conference on Computer Vision, Image and Deep Learning & International Conference on Computer Engineering and Applications (CVIDL & ICCEA); 2022 May 20–22; Changchun, China. p. 1–4. [Google Scholar]
30. Zhang X, Zhou K, Pan H, Zhang L, Zeng X, Jin Y. A network reduction-based multiobjective evolutionary algorithm for community detection in large-scale complex networks. IEEE Trans Cybernetics. 2018;50(2):703–16. doi:10.1109/tcyb.2018.2871673. [Google Scholar] [PubMed] [CrossRef]
31. Cheng F, Cui T, Su Y, Niu Y, Zhang X. A local information based multi-objective evolutionary algorithm for community detection in complex networks. Appl Soft Comput. 2018;69(6092):357–67. doi:10.1016/j.asoc.2018.04.037. [Google Scholar] [CrossRef]
32. Shang J, Li Y, Sun Y, Li F, Zhang Y, Liu JX. MOPIO: a multi-objective pigeon-inspired optimization algorithm for community detection. Symmetry. 2021;13(1):49. doi:10.3390/sym13010049. [Google Scholar] [CrossRef]
33. Ji P, Zhang S, Zhou Z. A decomposition-based ant colony optimization algorithm for the multi-objective community detection. J Ambient Intell Humaniz Comput. 2020;11(1):173–88. doi:10.1007/s12652-019-01241-1. [Google Scholar] [CrossRef]
34. Cheng R, Jin Y, Olhofer M, Sendhoff B. A reference vector guided evolutionary algorithm for many-objective optimization. IEEE Trans Evol Comput. 2016;20(5):773–91. doi:10.1109/tevc.2016.2519378. [Google Scholar] [CrossRef]
35. Amelio A, Pizzuti C. An evolutionary and local refinement approach for community detection in signed networks. Int J Artif Intell Tools. 2016;25(6):1650021. doi:10.1142/S0218213016500214. [Google Scholar] [CrossRef]
36. Lancichinetti A, Fortunato S, Radicchi F. Benchmark graphs for testing community detection algorithms. Phys Rev E. 2008;78(4):046110. doi:10.1103/physreve.78.046110. [Google Scholar] [PubMed] [CrossRef]
37. Zachary WW. An information flow model for conflict and fission in small groups. J Anthropol Res. 1977;33(4):452–73. [Google Scholar]
38. Lusseau D. The emergent properties of a dolphin social network. Proc R Soc Lond B Biol Sci. 2003;270(Suppl 2):S186–8. [Google Scholar]
39. Newman MEJ. Modularity and community structure in networks. Proc Natl Acad Sci U S A. 2006;103(23):8577–82. doi:10.1073/pnas.0601602103. [Google Scholar] [PubMed] [CrossRef]
40. Gleiser PM, Danon L. Community structure in jazz. Adv Complex Syst. 2003;6(4):565–73. doi:10.1142/s0219525903001067. [Google Scholar] [CrossRef]
41. Demšar J. Statistical comparisons of classifiers over multiple data sets. J Mach Learn Res. 2006;7:1–30. [Google Scholar]
42. Zhu X, Bi M, Shang J, Sun Y, Li F, Zhang Y, et al. MPSO-CD: a multi-objective particle swarm optimization community detection method for identifying disease modules. IEEE Trans Comput Biol Bioinform. 2025;22(4):1505–16. doi:10.1109/tcbbio.2025.3558805. [Google Scholar] [PubMed] [CrossRef]
Cite This Article
 Copyright © 2026 The Author(s). Published by Tech Science Press.
This work is licensed under a Creative Commons Attribution 4.0 International License , which permits unrestricted use, distribution, and reproduction in any medium, provided the original work is properly cited.
 Downloads
 Citation Tools