
 Submit a Paper
 Propose a Special lssue
 Open Access
ARTICLE

Graph Attention Networks for Skin Lesion Classification with CNN-Driven Node Features
1 Department of Computer Science, College of Computer and Information Sciences, Jouf University, Sakakah, 72341, Saudi Arabia
2 Centre of Excellence-AI (CoE-AI), Bahria University Islamabad Campus, Islamabad, 44000, Pakistan
3 Department of Computing, School of Arts, Humanities, and Social Sciences, University of Roehampton, London, 610101, UK
* Corresponding Authors: Samabia Tehsin. Email: ; Mamoona Humayun. Email:
Computers, Materials & Continua 2026, 86(1), 1-21. https://doi.org/10.32604/cmc.2025.069162
Received 16 June 2025; Accepted 18 September 2025; Issue published 10 November 2025
 View Full Text
 Download PDF
Abstract
Skin diseases affect millions worldwide. Early detection is key to preventing disfigurement, lifelong disability, or death. Dermoscopic images acquired in primary-care settings show high intra-class visual similarity and severe class imbalance, and occasional imaging artifacts can create ambiguity for state-of-the-art convolutional neural networks (CNNs). We frame skin lesion recognition as graph-based reasoning and, to ensure fair evaluation and avoid data leakage, adopt a strict lesion-level partitioning strategy. Each image is first over-segmented using SLIC (Simple Linear Iterative Clustering) to produce perceptually homogeneous superpixels. These superpixels form the nodes of a region-adjacency graph whose edges encode spatial continuity. Node attributes are 1280-dimensional embeddings extracted with a lightweight yet expressive EfficientNet-B0 backbone, providing strong representational power at modest computational cost. The resulting graphs are processed by a five-layer Graph Attention Network (GAT) that learns to weight inter-node relationships dynamically and aggregates multi-hop context before classifying lesions into seven classes with a log-softmax output. Extensive experiments on the DermaMNIST benchmark show the proposed pipeline achieves 88.35% accuracy and 98.04% AUC, outperforming contemporary CNNs, AutoML approaches, and alternative graph neural networks. An ablation study indicates EfficientNet-B0 produces superior node descriptors compared with ResNet-18 and DenseNet, and that roughly five GAT layers strike a good balance between being too shallow and over-deep while avoiding oversmoothing. The method requires no data augmentation or external metadata, making it a drop-in upgrade for clinical computer-aided diagnosis systems.Keywords
The skin, the largest organ of the human body, serves as a vital shield and plays a crucial role in maintaining overall health and well-being. Skin diseases are among the most common medical conditions worldwide. The World Health Organization (WHO) estimates that nearly 84.5 million Americans (approximately 25% of the population) experience one or more skin diseases each year [1]. In Bangladesh, skin cancer alone was estimated to have caused 2794 deaths in 2018 [2]. Factors such as increasing environmental pollution, changing lifestyles, and population ageing are contributing to a rise in the incidence and severity of these conditions. WHO further reported more than 14 million new cancer cases and about 9.6 million cancer deaths globally in 2018, highlighting the urgent need for early detection and effective management of such diseases [3].
Skin conditions can be caused by numerous reasons, including genetic susceptibility, lack of immunity, infections (viral, bacterial, or fungal), and allergic reactions [4]. Practically always appearing on the epidermis—the outermost skin layer—these conditions are normally visible to the naked eye, appear ideal for visual inspection. However, their heterogeneity of presentation and overlapping symptoms often undermine this assumption, creating serious diagnostic challenges. Melanoma (MEL), melanocytic nevus (NV), actinic keratosis (AKIEC), basal cell carcinoma (BCC), benign keratosis (BKL), dermatofibroma (DF), squamous cell carcinoma (SCC), and vascular lesion (VASC) visually appear similar to one another, making manual visual diagnosis more challenging [5]. Additionally, initial symptoms are often asymptomatic or nonspecific, leading to delayed diagnosis.
Among various skin diseases, melanoma is among the deadliest but is highly treatable if detected early. Research estimates that nearly 95% of patients can be cured through early diagnosis and treatment [6]. The dermatologist’s clinical diagnosis of skin lesions is prone to inconsistency, especially where specialist care is limited. This has brought into sharp focus the demand for automated, consistent, and scalable computer-aided diagnostic (CAD) programs that can easily assist dermatologists in identifying skin illnesses.
Recent developments in artificial intelligence (AI), machine learning (ML), and deep learning (DL) have enabled the development of automated systems for skin disease classification. Most existing models rely on convolutional neural networks (CNNs) using pixel-level features or global image descriptors [7,8]. While promising, these approaches can fail to capture the fine-grained relational and spatial patterns present in dermoscopic images—especially in multi-class classification tasks where intra-class similarity is high and inter-class variability is low [9,10].
To address these limitations, graph neural networks have emerged as a formidable alternative [11]. Unlike conventional CNNs, graph models can more effectively capture spatial and contextual relationships between local regions. In this paper, we present a graph-based model that represents each dermoscopic image as a Region Adjacency Graph (RAG), where nodes are perceptually consistent SLIC (Simple Linear Iterative Clustering) superpixels and edges are connected based on spatial distance. This mesoscopic representation bridges the gap between low-level pixel information and high-level semantic understanding. We use a Graph Attention Network (GAT) to learn to dynamically attend to both local and far-away relationships, allowing the model to focus on clinically important structures such as pigment networks and streaks while ignoring pixel noise.
Our method surpasses the conventional single-disease or pixel-level methods in multi-class skin disease classification. Fig. 1 shows exemplary samples from different classes of skin diseases such as Melanoma, Melanocytic Nevus, Actinic Keratoses and Intraepithelial Carcinoma, Basal Cell Carcinoma, Benign Keratosis-Like Lesion, Dermatofibroma, Squamous Cell Carcinoma, and Vascular Lesion.
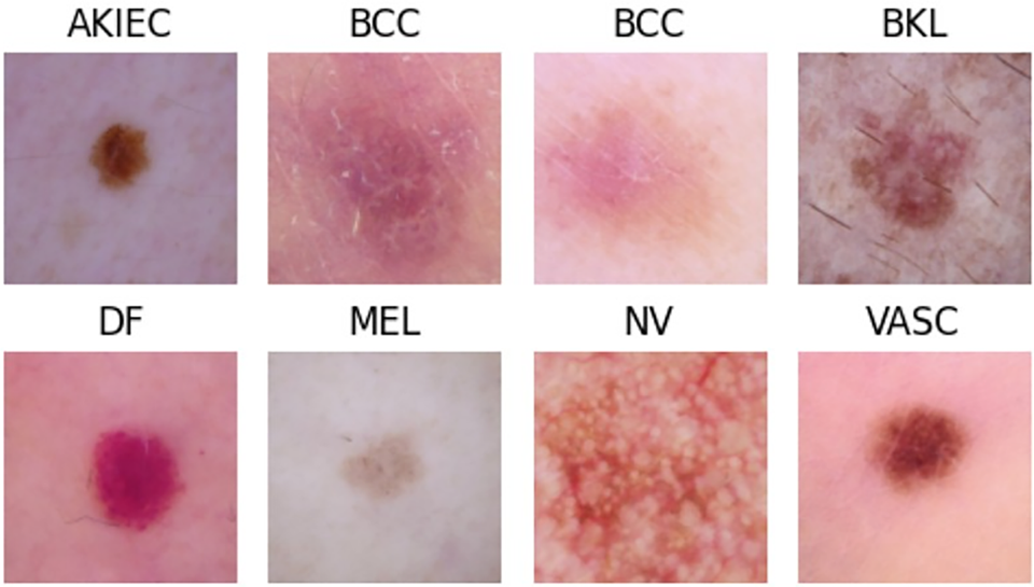
Figure 1: Representative images of common skin diseases used in this study
Despite extensive research over the past three decades, the classification of skin diseases—especially across multiple categories—remains a challenging task due to high inter-class similarity and limited annotated datasets. Our method addresses this gap by integrating lesion morphology with deep semantic features using a principled graph-based approach. This enhances both classification performance and clinical interpretability.
The rest of this paper is structured as follows: Section 2 defines the problem and reviews related literature. Section 3 details the proposed methodology, including preprocessing, segmentation, and classification. Section 4 presents experimental results, evaluation metrics, and performance analysis. Finally, Sections 5 and 6 outline discussion and concluding remarks.
Numerous studies have proposed methods for categorizing skin diseases [12–15]. Related works can be grouped by dataset, feature-extraction approach, feature-selection strategy, and classification model. This section reviews relevant articles to identify research gaps and summarize the techniques used in prior studies.
Jagdish et al. [16] proposed a wavelet-analysis-based approach for skin disease identification using CNN and SVM classifiers. They applied fuzzy clustering to a dataset of 50 images. They concluded that K-Nearest Neighbors achieved 91.2% accuracy and outperformed SVM in their experiments. The method also attempted to identify the underlying disease type. However, the study is limited by a small sample (50 images) and only two classes (squamous and basal).
Naqvi et al. [17] developed an SVM-based image-processing pipeline that predicts potential skin cancer using GLCM features after denoising and image enhancement. The classifier categorized images as “at risk” or “safe.”
Bandyopadhyay et al. [18] proposed a model based on machine learning and deep learning techniques. They used deep neural networks Alexnet, Googlenet, Resnet50, and VGG16 for feature selection and ensemble boosting Adaboost classifier, decision tree, and SVM for classification purposes. The paper includes comparative analyses to identify the best-performing prediction models.
Kalaivani and Karpagavalli [19] proposed a new methodology that incorporated data mining techniques into a single unit and an ensemble approach that combined both data mining techniques in a single unit group. They used the publicly available dataset HAM10000 dataset from ISIC2019, consisting of seven lesion categories from Dermatology applying the ensemble deep learning technique that made it possible to classify skin conditions into seven groups. They observed a case of the ensemble approach that was pretty successful and accurate in predicting the skin conditions.
AlDera and Othman [20] presented a skin disease diagnostic model that classifies images of acne, cherry angioma, melanoma, and psoriasis and constructed a dataset of 377 images collected from DermNet NZ and the Atlas Dermatológico, with class distribution of 80 acne, 37 cherry angioma, 80 melanoma, and 180 psoriasis images. They used Otsu’s method for image segmentation and the Gabor and Entropy algorithms for feature extraction and Sobel for edge detection. In the end, they used K-Nearest Neighbor (K-NN), Random Forest (RF), and Support Vector Machine (SVM) classifiers to obtain 90.7%, 84.2%, and 67.1% accuracy for acne, cherry, angioma, melanoma and psoriasis, respectively, in classification.
Wei et al. [21] explore how AI is transforming skin disease diagnosis, especially through image analysis and gene expression profiling. This paper highlights the ability of AI to help patients, primary care providers, dermatologists and dermatopathologists, while discussing implementation challenges such as algorithmic bias and lack of model robustness.
Farea et al. [22] assess the current status of AI and machine learning application in dermatology, particularly in skin cancers through imaging techniques. It emphasizes significant advances in deep learning models, training data sources, and performance measures. The authors also highlight clinical integration matters such as interpretability, adaptability, compliance with standards, and ethical issues.
Prashanth et al. [23] presented a skin-disease classification system using MobileNetV2 and LSTM, focusing on improving predictive accuracy. They compared the proposed model with conventional approaches (e.g., CNN and FTNN) and reported superior performance in identifying skin conditions and assessing tumor progression using texture-based features.
The study in [24] investigates Extreme Learning Machines (ELM) for biomedical image classification and demonstrates their effectiveness. Single-hidden-layer ELMs with randomly initialized weights offer faster training and lower computational cost. The paper compares four ELM variants (ELM, WELM, RELM, MELM) on dermatoscopic and blood-cell datasets using binary and multi-class experiments. Results show that ELMs have shorter training times and can outperform CNN-based AlexNet in some scenarios, indicating ELMs are a viable, computationally efficient alternative for certain medical-imaging tasks.
Ozdemir et al. [25] assesses an AI model that had been trained on over 47,000 clinical images to diagnose 15 pigmented skin diseases at five hospitals. The model achieved dermatologist-level performance and showed strong generalizability in multi-center evaluations. It illustrates the promise of AI in clinical practice environments and also points out challenges in terms of image quality and ethnic diversity.
Sharma et al. [26] developed the EffSVMNet, which is a light-weight hybrid approach that combines features from an EfficientNet-B3 based CNN with a SVM classifier for skin disease classification. By working on a subset of the DermNet dataset consisting of four classes (acne, atopic dermatitis, bullous disease, and eczema), the developed system achieved better validation accuracy compared to some of the similar CNN-based methods while conserving computational efficiency for early diagnosis.
A dynamic topology analysis framework was developed by Xin et al. [27] for the quantitative analysis of spatial patterns in multifocal lesions observed on MRI in the case of multiple sclerosis. The method combines persistent homology with a Dynamic Hierarchical Network to reflect both global geometry and community-level topology of the lesion distributions. The authors also developed the Decomposed Community Persistence algorithm to quantify multiscale community structures. On diagnostic differentiation and prognostic prediction tasks, the framework scored ROC_AUCs of 0.875 and 0.767, respectively.
In [28], 10 pre-processed medical image datasets are presented. The datasets are standardized to 28
Two widely used dermatological image datasets, Fitzpatrick17k and DermaMNIST, are examined for data quality issues in the study by [29]. The authors discover substantial flaws, including data leakage, mislabeled images, and duplicates, which impact the reliability of models built on these datasets. They create new standards for model evaluation and suggest updated versions—DermaMNIST-C and Fitzpatrick17k-C—by eliminating errors and duplications. This study emphasizes how crucial it is to maintain dataset quality in dermatology research in order to increase the robustness and generalization of models.
Rahman et al. [30] present a deep neural network approach to skin cancer classification based on optimized NASNet architecture is presented in this study. With enhanced data augmentation and transfer learning on a dermoscopic image dataset of 2637 samples, the model attained an accuracy of 86.73%, thereby outperforming quite a number of existing CNN-based methods.
Mahmoud and Soliman [31] study proposes an artificial intelligence-aided automated system for the early detection of skin cancers on dermoscopy images from the PH2 dataset, containing three classes: common nevus, atypical nevus, and melanoma. It develops an Automated System that integrates Adaptive Snake (AS) and Region Growing (RG) algorithms for segmentation, while it employs ANN (Artificial Neural Network) and SVM for classification-ANN performed better, achieving 94% accuracy, 96% precision, and 94% F1-score, and was thus effective in its application to the PH2 dataset. In addition to the above mentioned approaches, several other studies have explored various methodologies for skin disease detection and classification [32–39].
Based on the above mentioned considerations and studies (Table 1), it can be inferred that the research papers concentrates on dataset with a small number of classes or other than dermaMNIST dataset. Few studies have have used DermaMNIST like multi classified datast. Nearly majority of these research employ image-based datasets for categorization and Pixel-level techniques are used in nearly all of the aforementioned studies to categorize various classes in datasets on skin diseases. By observing this we have decided to use a multiclassified skin disease dataset like DermaMNIST, this study uses tiny patch (node)-level techniques to identify these classes. Specifically, it uses Graph Neural Networks (GNNs) to classify seven skin diseases after converting images into graphs.

This section explained and presented a method to classify skin diseases. As shown in Fig. 2, the whole process consists of following stages: first, data preprocessing, followed by image segmentation, then feature extraction, then image to graph conversion, and finally, classification.
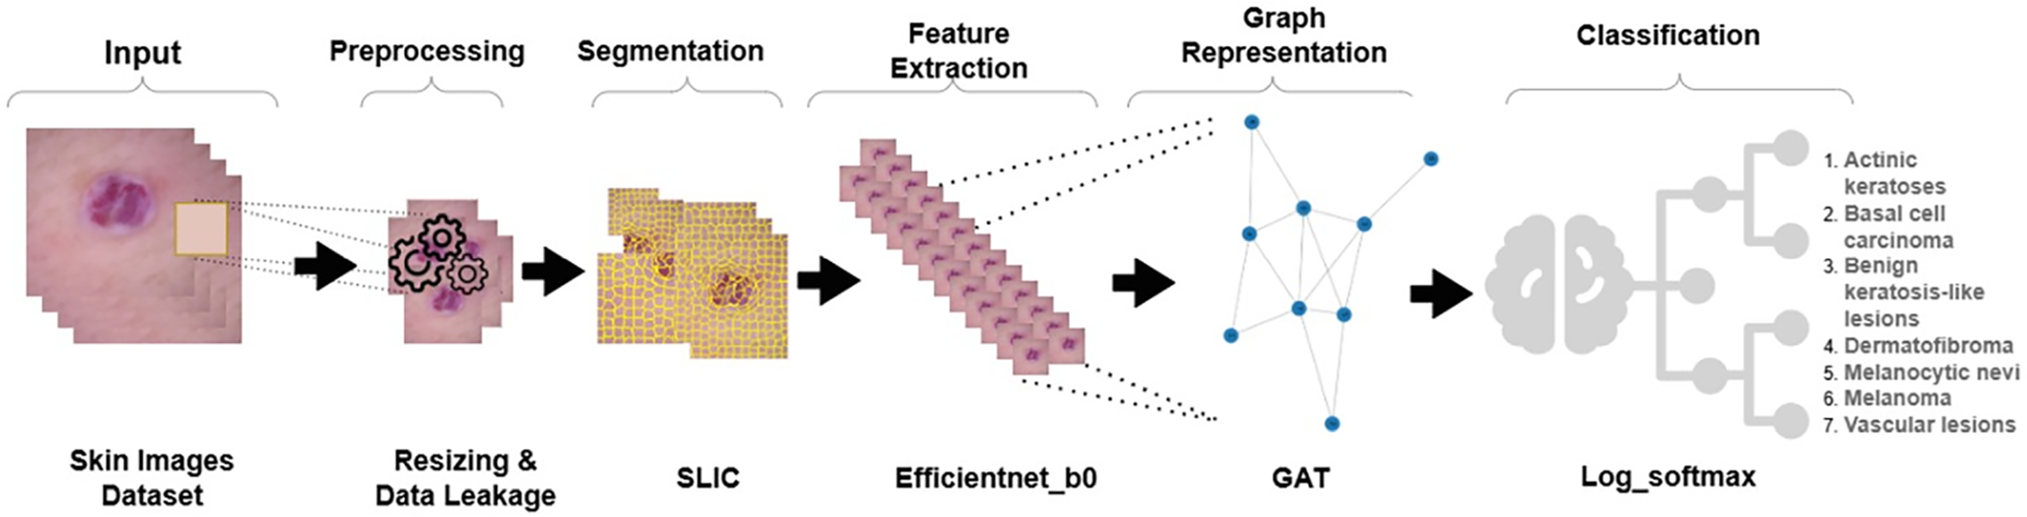
Figure 2: An overview of the proposed pipeline. Preprocessed DermaMNIST-C images are segmented with SLIC to create superpixels that are then processed via EfficientNet-B0 to extract visual features. These are then used to construct a RAG and sent through a multihead GAT for final classification
3.1 Data Preparation and Preprocessing
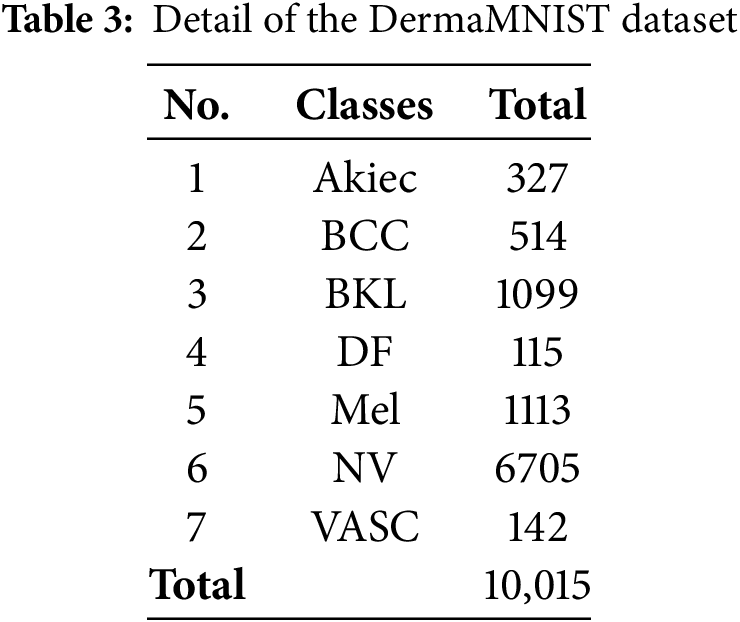
The dataset DermaMNIST utilized here includes seven classes in the classification of skin diseases: actinic keratosis, benign keratosis, vascular lesions, melanoma, melanocytic nevus, basal cell carcinoma, and dermatofibroma. The dataset uses results from multiple tests and mentioned research from [29], as cited in the most recent benchmarking research on the analysis of dermatological photos in many recent works. The DermaMNIST has a huge class imbalance and leakage of data. All these make the performance impossible to judge correctly, particularly for underrepresented categories in the dataset causing inflated results for some models.
As provided by the MedMNIST initiative, the images in the DermaMNIST dataset are low-resolution replicas that were produced by resizing the original HAM10000 images (600
In opposed to dataset that utilizes nearest-neighbor interpolation to upsample 28
Data leakage due to incorrect partitioning is also a problem in the original DermaMNIST dataset. In other words, lesions might appear at the same time in both training and test sets, which results in very optimistic performance metrics. According to Abhishek et al. [29], about 13.47% of data is affected by this. Unlike the original DermaMNIST dataset, the DermaMNIST-Corrected dataset offers a lesion-wise partition in which every image of a lesion is confined to just one split. We have strictly adhered to this as an approach in this study: For every lesion for which an image is included in the training set, images of that lesion are included in training and excluded from validation or test. This avoids any data leakage and therefore leads to an unbiased evaluation of the model.
Then,the input image is segmented using the SLIC algorithm [40]. The image is resized to (224, 224) and processed by SLIC to divide it into a predefined number of superpixel segments. Each segment refers to a group of pixels having similar characteristics, and the compactness parameter is used to control the spatial proximity of the pixels within each segment as shown in Fig. 3.
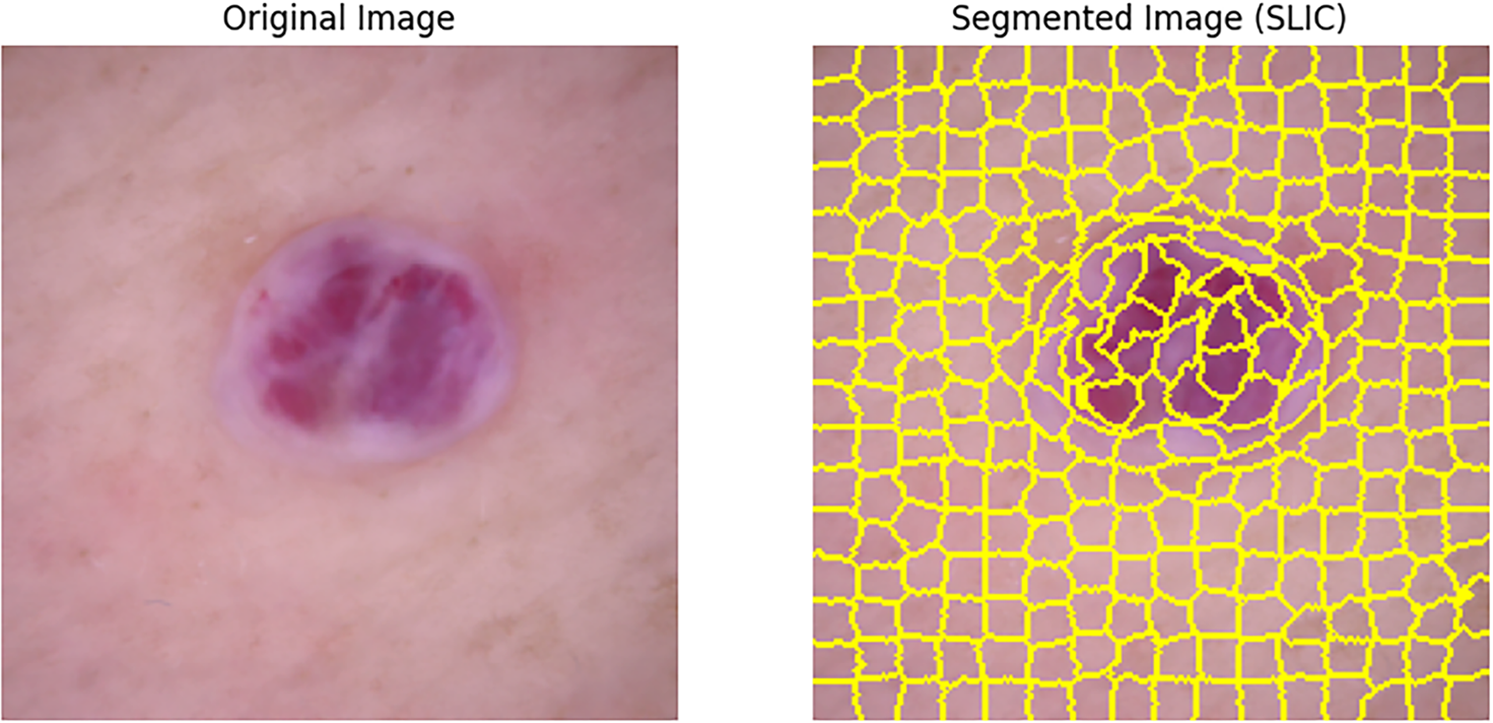
Figure 3: Example of SLIC segmentation (segments = 100, compactness = 10) on a DermaMNIST-C sample: pixels are clustered into 100 spatially compact regions balancing color similarity and spatial proximity; a RAG is then constructed by linking superpixel nodes whenever their regions touch
Also, a mask is applied to every segment so that its corresponding region in the image is extracted. The contour of the segment is detected and the largest contour’s bounding box is used to crop the segment. All such cropped segments are then stored for future feature extraction.
The SLIC algorithm creates superpixels. It does this by grouping pixels. The grouping depends on how close the colors are in CIELAB space. It also considers how near the pixels are to each other.
The mathematical description of the distance measure
Here
Each initial cluster center is denoted as

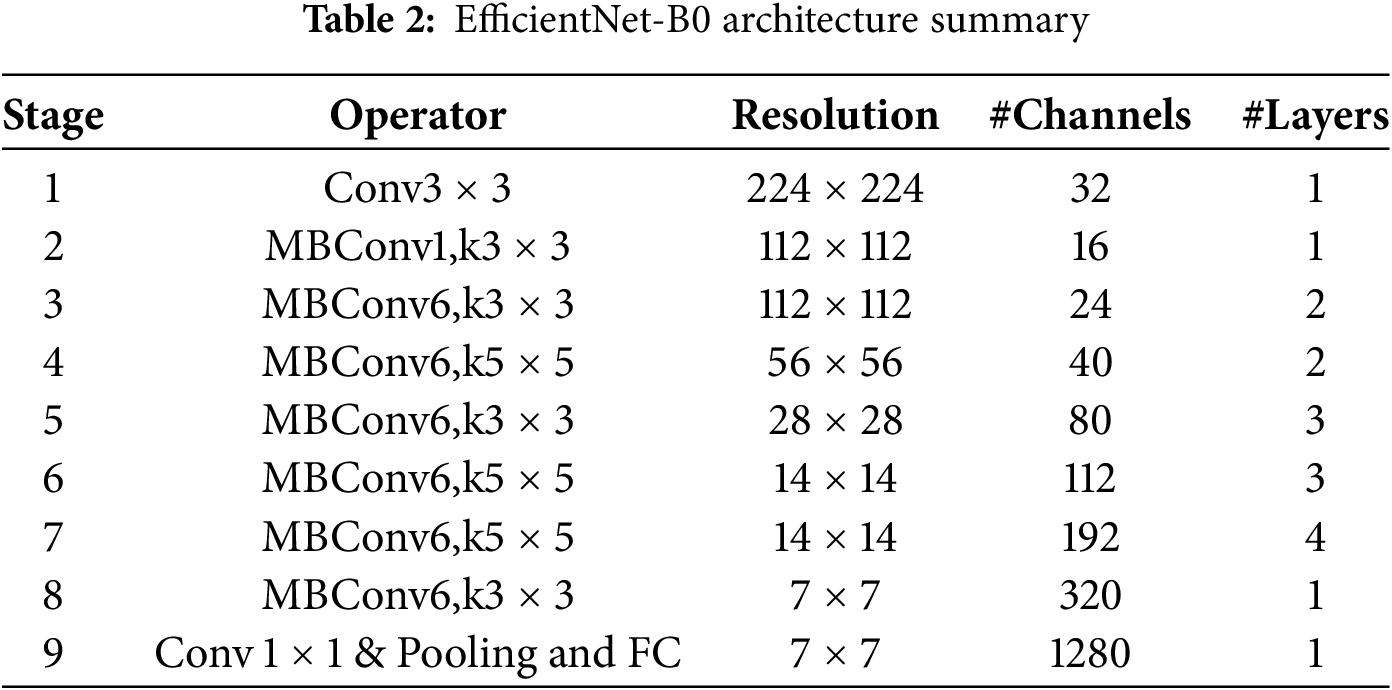
In the third step, we extract features from each segmented region of the image. We pass each segment, which we took from the image during segmentation, through a pre-trained deep learning model to get useful features. We use EfficientNet-B0 for this job. It’s part of a group of convolutional neural networks that work well with less computing power.
The architecture of EfficientNet-B0, summarized in Table 2, begins with a stem layer. This layer has a standard convolution then batch normalization, and a ReLU6 activation function. After that, it has a series of MBConv blocks. Each MBConv block uses depthwise separable convolutions. These make the model more efficient by cutting down on parameters and calculations. The model also uses squeeze-and-excitation (SE) layers to adjust channel-wise feature responses. This makes the feature representation better.
Through normalization, the size and distribution of the input for each segment are ensured uniform. The value for set size is (224, 224) and normalized according to the predefined values of mean and standard deviation from the algorithm Algorithm 2. The deep learning model will then take in the normalized segments individually. In the deep learning model, within this model, there will be a flatten layer that extracts feature representations. These features describe higher level information that describes the visual content of the segments.

After SLIC image segmentation, each segment is handled as a separate node within a RAG. These segments are represented by nodes, and the edges are created according to how close together the segments were in the original image. Edge weights, which are usually determined using the mean color difference, showing how similar adjacent segments are to one another. Using attention mechanisms, GAT [41] enhances node representation in a graph. In a graph
where learnable weight matrix
where neighborhood nodes of
Finally, all the extracted feature vectors are appended as node attributes, and the nodes are connected based on the spatial adjacency to form a graph. This complete graph with spatial relationships combined with visual features essentially forms a basis for other tasks dealing with graphs, such as object detection or classification.
Existing graph-based dermatology studies usually attach raw convolutional neural network (CNN) feature maps to generic graph neural network (GNN) encoders like GCN or GraphSAGE. In contrast, our approach involves attaching a 1280-dimensional descriptor—extracted from the flatten layer of a pre-trained EfficientNet-B0 model—to each node. The resulting graph is then passed through a custom five-layer multi-head Graph Attention Network (GAT). This pairing introduces three key advantages.
First, it provides expressive yet lightweight features. EfficientNet-B0’s compound scaling captures fine-grained color and texture information, all while keeping node attribute sizes manageable. Second, the use of attention-based edge weighting allows the model to learn lesion-specific edge importances. This adaptiveness leads to an improvement in AUC scores by 3–6 percentage points over methods like GraphSAGE, GIN, and basic GCN. Third, the method remains efficient even at scale. By using SLIC to limit each graph to specfic amount nodes (e.g., 300, 400 [42], etc.), the system—despite using five GAT layers—achieves increases in the training speed of patch-based CNN ensemble models that use a similar number of parameters.
After all the above-mentioned steps like conversion of images to graphs and make a dataset which is properly suitable for GAT, the last step came which is classification of the diseases using the log-softmax function. This function is commonly used for multi-class classification in neural networks. It can be expressed as mathematically:
where N is number of total classes and
This section presents the evaluation of the proposed classification model and compares it with existing techniques to check the performance of our model with concerning to others.
It uses the DermaMNIST dataset, which is very common for dermatology images classification. This dataset consists of 10,015 images of dermoscopy of skin lesions across seven classes, including nevus, melanoma, and other cutaneous conditions. This dataset offers different images to help in challenging tasks involving the classification of skin conditions.
DermaMNIST was derived from the famous dataset HAM10000, whose first version was actually used in the ISIC 2018 Skin Lesion Analysis Challenge. The original HAM10000 comprises more than 10,000 images and is one of the largest openly accessible datasets for the task of skin lesion categorization. It can thus be used in high-quality training and testing machine learning models for dermatological diagnosis. Table 3 gives a dataset summary.
We use t-distributed Stochastic Neighbor Embedding (t-SNE) for high-dimensional data visualization in addition to the dataset analysis. It facilitates the understanding of intricate data distributions by illuminating the underlying structure and relationships within the dataset. The DermaMNIST dataset’s t-SNE visualization, which highlights the distribution of different skin lesion classifications, is displayed in Fig. 4.
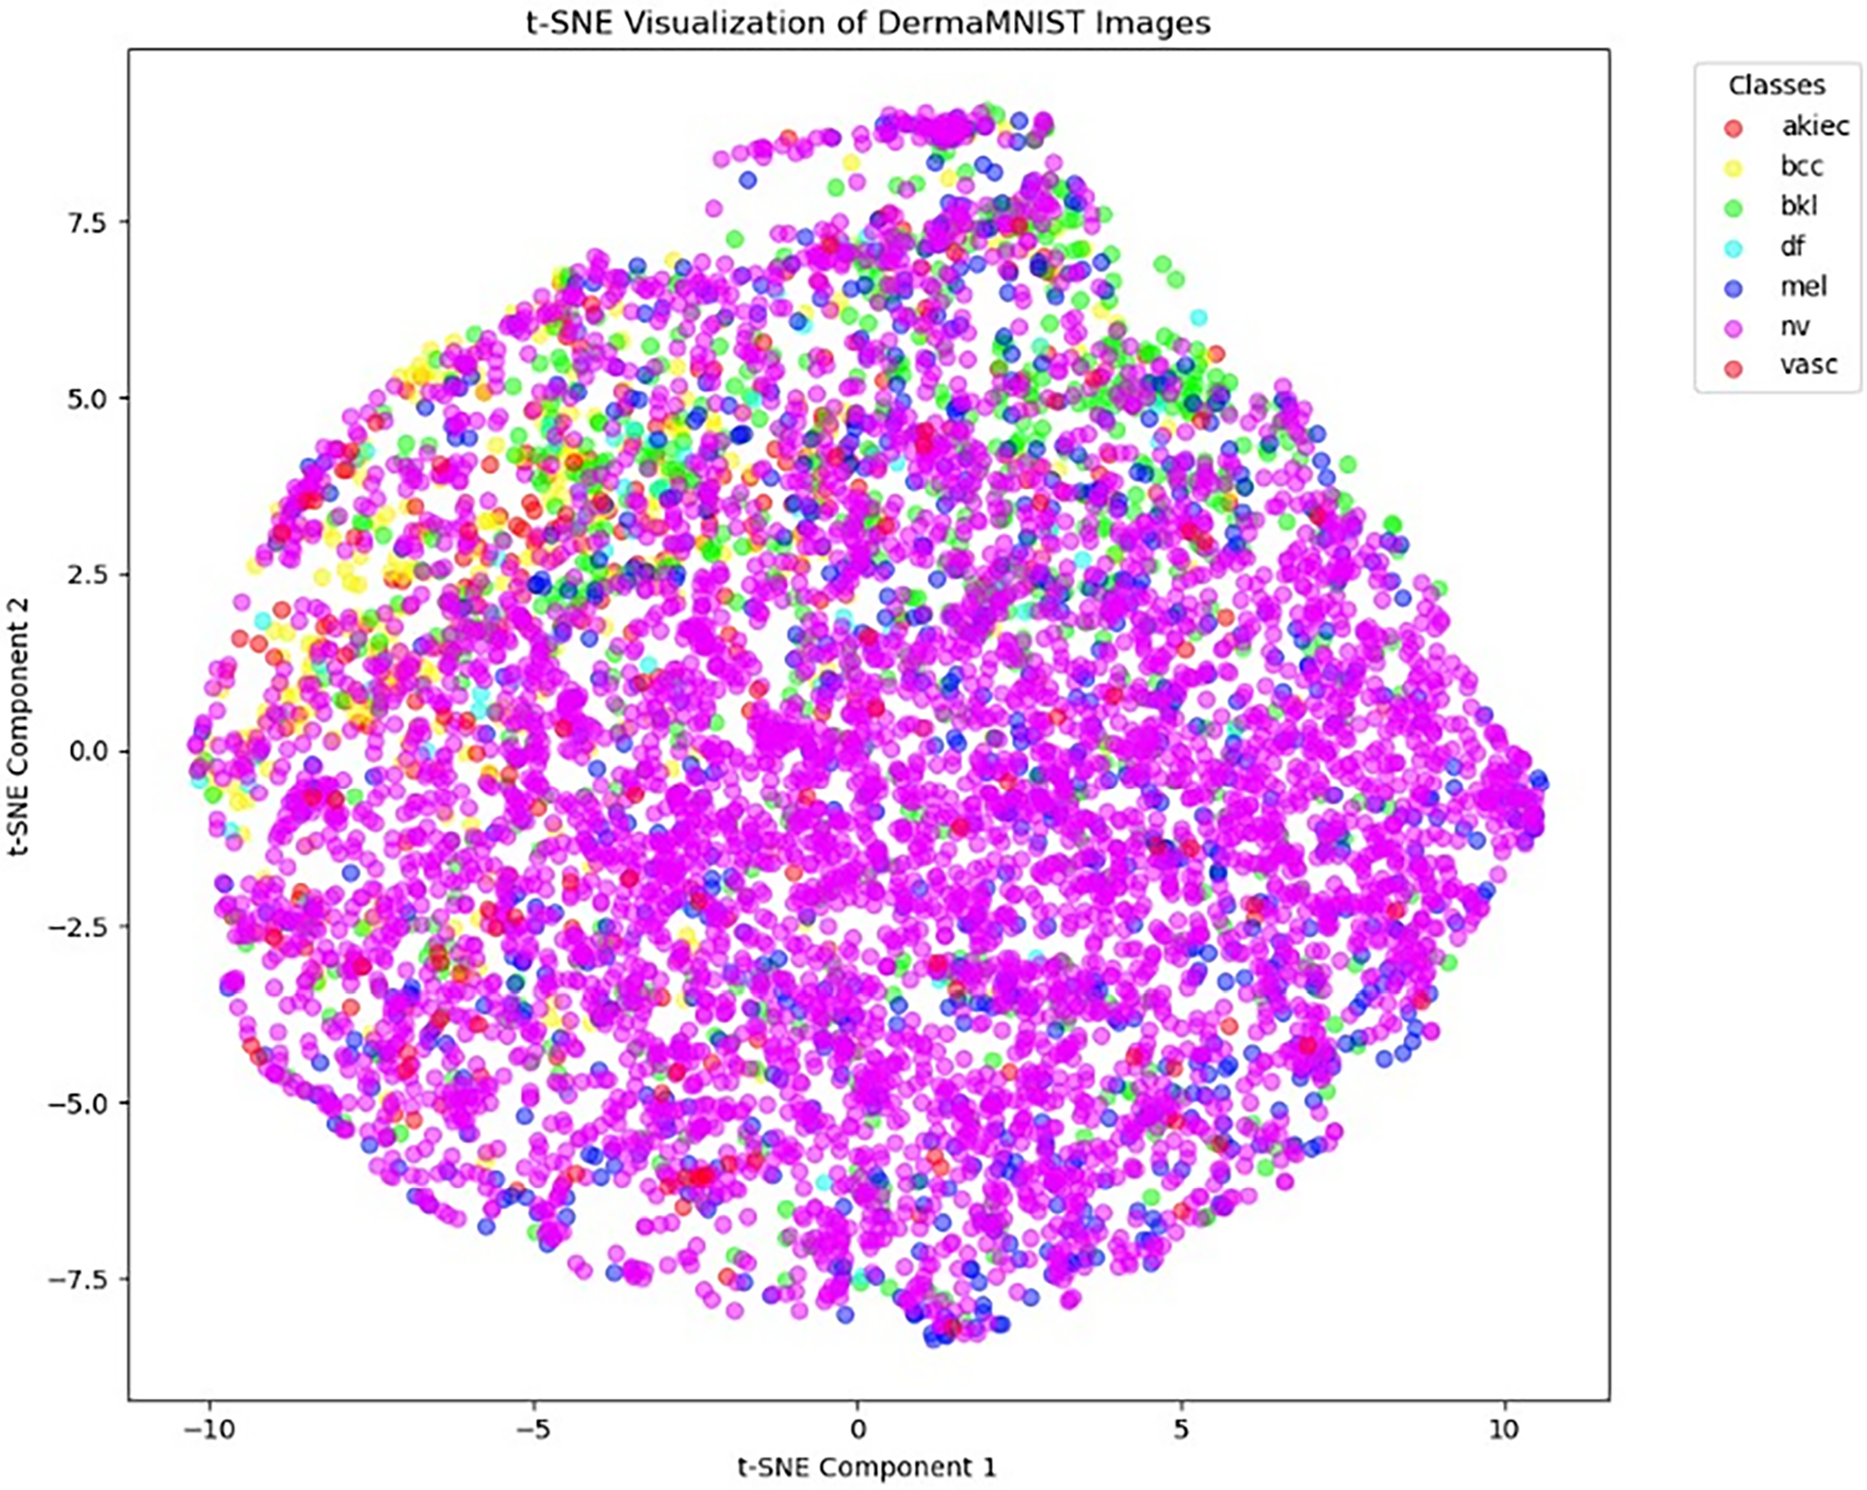
Figure 4: t-SNE visualization of DermaMNIST dataset
We evaluate our model’s performance on the dataset using some crucial evaluation metrics, such as Accuracy, Precision, Recall, F1-Score, Area Under Curve (AUC), and the Confusion Matrix. These indicators provide different insights into different aspects of the model’s forecasting capabilities.
A basic statistic for assessing a classification model’s performance is classification accuracy, which offers a brief overview of the model’s efficiency in producing accurate predictions. The definition of it is the proportion of accurate forecasts to the total number of input samples.
A model’s precision is a performance metric that shows what percentage of positive predicts were truly accurate. The following formula is used to compute it:
where FP stands for false positives and TP for true positives. A high precision score denotes a low false positive rate, or fewer inaccurate positive predictions, made by the model.
Recall measures a model’s accuracy in identifying positive occurrences; it is sometimes referred to as sensitivity or true positive rate. It is defined as:
where false negatives are denoted by FN. In situations where missing a positive case could have major consequences, a high recall score suggests that the model effectively captures positive instances.
Harmonic mean of Precision and Recall is F1-Score, it actually gives the single metric of both. Its mathematical expression is:
Greater F1-Score shows high performance. It is useful specially when classes are not balanced.
One common statistic for assessing binary classification algorithms is the Area Under the Receiver Operating Characteristic Curve (AUC). It shows the likelihood that a classifier will select a positive example at random and rank it higher than a negative example at random. Plotting the True Positive Rate (TPR) vs. the False Positive Rate (FPR) yields the AUC:
AUC values have a range of 0 to 1, where a number nearer 1 denotes superior model performance over a range of classification thresholds.
A helpful technique for determining how well a classification model is performing is the confusion matrix. A
Now we see the performance of our proposed method against a number of other methods that have been used in the past to classify skin diseases using the DermaMNIST dataset. DermaMNIST dataset is used by many studies because this is the famous for dermatological image analysis, as a benchmark for their models. We compared our model with the following studies:
Reference [29] in order to classify skin lesions, assess the DermaMNIST datasets’ quality. This study reports a classification accuracy of 85.1% with an AUC of 95.2%. These outcomes show how robust DermaMNIST’s approach is and shows how well it works for tasks like the classification of skin lesions.
This paper [28] offers a thorough framework for automated medical image analysis and focuses on a number of medical imaging datasets, including DermaMNIST. This paper report AUC of 92.5% and accuracy of 76.6%, show strong model performance.
This study use extreme learning machine for image classification on DermaMNIST, reference [24] research reports 68.7% accuracy, 68.7% recall, and 62.2% precision. Even with its reasonable performance, but unfortunately this method is not able to outperform other state-of-the-art models.
Table 4 compares the outcomes of our proposed method with these techniques, shows the superiority of our method in terms of accuracy, precision, recall, F-measure, and AUC values. Our model got the accuracy of 0.8835% and an AUC of 98.04%,which outperforms existing approaches in a competitive manner.

By seeing the comparative analysis table, it can be said that our methodology achieves greater precision, recall, and accuracy, making it competitive with other methods. The outcomes show that our model performs better than other approaches in several important metrics, indicating its effectiveness to classify the skin diseases.
Additionally, we compare our suggested approach with the [29] this paper used 224

The overall performance of our model during training and validation is illustrated in the learning curves shown in Fig. 5.

Figure 5: Accuracy and loss learning curves
Learning curves track both validation and training loss with time, giving insight into how well the model performance is with new data. By seeing the stable learning in these curves smooth convergence can be guessed. Additionally, Fig. 6 confusion matrix illustrates how well the model performs in classifying data for all classes. The distribution of true positive, false positive, true negative, and false negative predictions is showed in the matrix, providing a thorough understanding of the model’s performance and misclassification. When combined, these visualizations provide evidence for the suggested method’s efficacy in classifying dermatological images.

Figure 6: Confusion matrix
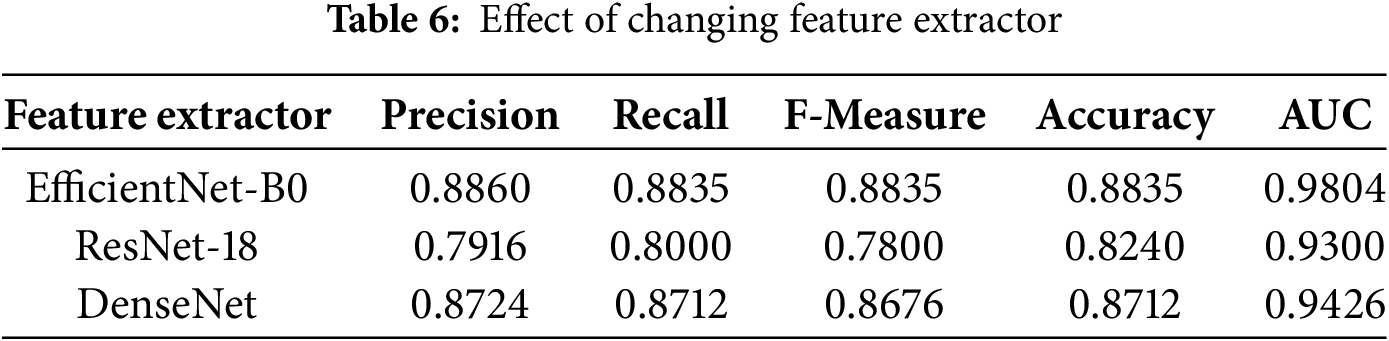
We discuss in the beginning how the performance varies according to changing feature extractors. We have used feature extractors DenseNet, ResNet18, and EfficientNet-B0. Table 6 presents results for the experiment. As can be seen, the best results in respect to all evaluation criteria were obtained with EfficientNet-B0, which resulted in a precision of 0.8860, recall of 0.8835, F-measure of 0.8835, accuracy of 0.8835, and AUC of 0.9804. On the contrary, ResNet18 resulted only in the precision of 0.7916, recall of 0.8000, F-measure of 0.7800, accuracy of 0.824, and AUC of 0.93. DensityNet could reach a higher precision at 0.8724 compared to ResNet18, but its recall is stuck at 0.8712 while the F-measure at 0.8676, accuracy at 0.8712, and AUC at 0.9426, which is still lesser than that of EfficientNet-B0. This evaluation deems the selection of a feature extractor as key to maximise performance in the classification of skin diseases.
Before applying feature extraction from images and then transforming them into graphs, we applied several data augmentation techniques in order to enhance the performance of our model. For enhancing the resistance of the model, we used the training set augmented with translation, rotation, scaling, horizontal flip, as well as alteration of saturation, contrast, and brightness. The impact of augmentation on classification metrics is depicted in Table 7.
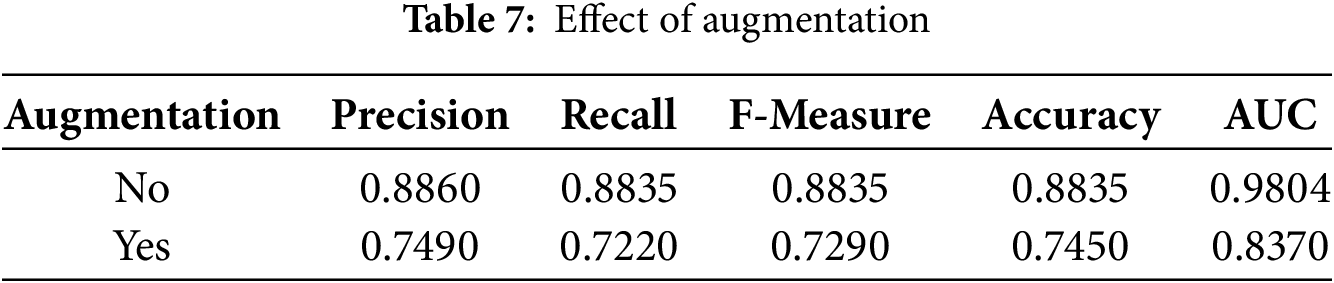
The baseline model achieved a precision of 0.8860, recall of 0.8835, F1 score of 0.8835, accuracy of 0.8835, and an AUC of 0.9804. But with data augmentation, there was decrement in precision up to 0.749, in recall down to 0.722, and F1 score down to 0.729. In addition, accuracy went down to only 0.745, while the value of AUC decreased to 0.837. These results suggest that standard augmentation methods such as random flipping, rotation, and brightness adjustments—negatively affected the integrity of lesion features. Thus, augmentations for skin lesion classification should be considered with caution, and specialized or medically informed augmentation strategies may prove to be more efficacious compared to standard approaches. Besides the differences in feature extractors and the effect of augmentation.
We also discussed the impact of the number of layers of GAT on the model’s performance. We conducted tests for 2, 3, 4, 5, 8, and 16 layers of GAT; results are presented in Table 8.
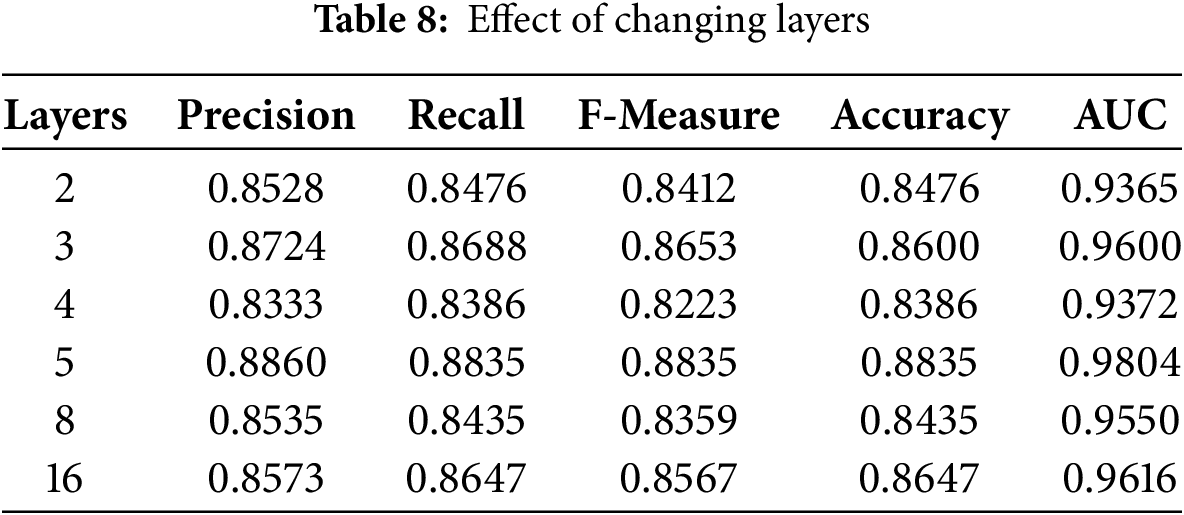
The best model configuration was the 5-layer configuration that achieved the highest precision at 0.8860, recall at 0.8835, F-measure at 0.8835, accuracy at 0.8835, and AUC at 0.9804. This means that the best configuration for this task is the 5-layer model where all of these performance metrics balance best. Furthermore, almost all the layer configurations 2, 3, 4, and 8-layer models also performed pretty well, 3-layer model performed with a precision of 0.8724 and an AUC of 0.96, but outstanding results were obtained only with a 5-layer setup, so it indicates that probably the correct choice of number of layers is indeed the decisive factor for improving the classification quality on the GAT model for the classification of skin disease.
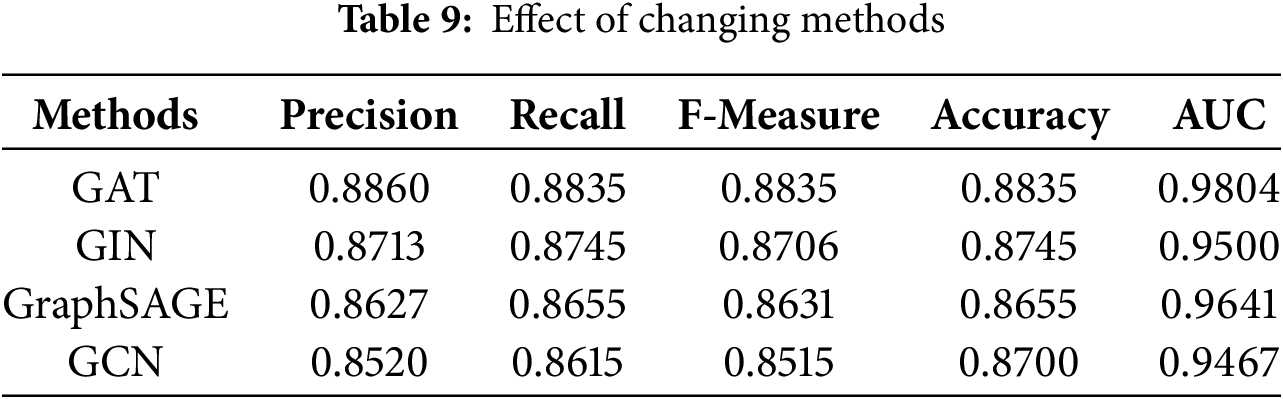
Lastly, we compare different architectures of Graph Attention Network (GAT), Graph Isomorphism Network (GIN) [43], Graph Sample and AggregatE (GraphSAGE) [44], and Graph Convolutional Network (GCN) [45] to know which one works the best for our classification task of skin disease, as indicated in Table 9. The Outcome of this comparison shows, GAT held the highest precision equal to 0.8860, recall = 0.8835, F-measure = 0.8835, accuracy = 0.8835, and AUC = 0.9804. Both the GIN and GraphSAGE worked fine, yielding good results, for GIN the precision is obtained to be 0.8713 and the accuracy achieved is 0.8745, whereas for GraphSAGE the precision is 0.8627 and the accuracy is 0.8655. In contrast, GCN resulted in lesser values of all the values like precision = 0.8520 and accuracy = 0.8700. This comparison generally shows that the performance of the classification model about skin diseases is sensitive to the choice of method, with GAT performing better.
Although the proposed method shows a robust performance based on a general classification metrics, it should be noted that the data is highly imbalanced, which places the challenges on its performance. Medical datasets are usually highly skewed in terms of class examples (e.g., the nv class has many thousands of images and the rare classes such as df or vasc have less than 150 images). In those cases, the accuracy and AUC may be quite high, as the dominant classes may be well-adjusted, but the minority classes merely end up with poor results. This translates into lower performance per-class, in terms of recall and F1-score (both measures being sensitive to class-specific misclassifications). This imbalance biases the learning process of the model to over-represented classes and thus becomes less susceptible to under-represented classes [46,47].
The impact of this class-imbalance was examined more deeply in the Tables 10 and 11. The highest values of precision and recall, as expected, are attained by the nv and vasc classes, which have rich examples. Instead, classes that are less represented such as akiec, mel, and df also exhibit substantially weaker values. This is a direct result of the limited data which causes reduced opportunities of the model to learn significant representations. The overall accuracy greatly surpasses macro-averaged metrics since the latter considers every class as equally important no matter what their proportions are in a dataset.


The DermaMNIST dataset—employed herein—provides a manageable format for experimentation but lacks diversity, real-world variability, and inter-class parity. The extreme class imbalance (e.g., NV with 6705 images and DF with 115) affects generalizability, and subsequent networks could be improved with weighted loss or oversampling. Moreover, while we mitigated the reported resolution and data leakage issues by employing DermaMNIST-Corrected, it still doesn’t capture the full variability of clinical dermatology images. We tried a couple of graph neural networks (GAT, GCN, GraphSAGE, and GIN) and feature extractors (EfficientNet-B0, DenseNet, ResNet18), and the best combination was GAT and EfficientNet-B0. We observed that traditional data augmentation such as rotation or flipping adversely affected class accuracy and AUC. Kebaili et al. [48] present a comprehensive review on this issue, stating that basic data augmentation operations include random rotations, cropping, flipping, or noise injection. However, these simple operations are not sufficient when dealing with complex data such as medical images and Montaha et al. [49], lesion orientation relative to anatomical cues can significantly influence malignancy detection. Operations like flipping and rotation can alter spatial features that are essential for accurate diagnosis, leading to misleading patterns learned by the model. So, these transformations can disrupt lesion orientation and visual boundaries essential for diagnostic reasoning, leading to worse generalization. Augmentation was therefore excluded to maintain anatomical consistency. Also, the high imbalance in classes in DermaMNIST affected the results substantially. Although class-wise accuracy and AUC were high overall, our analysis revealed that low-frequency classes (e.g., akiec, df) were significantly lowered by the model during optimization. Model simply tries fitting the most prevalent classes of dermoscopic images during training. In medical areas this is particularly troublesome because even infrequent misclassifications may have severe clinical repercussions. The future should include the investigation of alternatives such as class-weighted loss functions, data-level resampling, and sophisticated synthetic augmentation (e.g., GANs or lesion-aware transformations) to address this important drawback in more effective ways.
While the results are encouraging, our method relies heavily on graph construction based on the quality of SLIC segmentations, missegmentation can introduce misleading node relationships, which negatively effect the performance of the GAT. Investigating more robust graph generation pipelines and incorporating uncertainty modeling would be beneficial.
Skin disease is a problem of global health concern involving diverse populations. In this paper, we validate the applicability of Graph Attention Networks (GAT) for multi-class classification of skin diseases using the DermaMNIST dataset. The model achieved an accuracy of 88.35% by converting images into region adjacency graphs, considering SLIC superpixels as nodes and EfficientNet-B0 for node feature extraction. This graph-based approach utilizes the spatial relationship between segments of an image and allows the GAT to capture the structural information that is usually neglected by traditional CNN classifiers. The results show that modeling complex inter-segment dependencies significantly improves performance on medical image classification.
Depending on how well segmentation and graph construction strategies are developed to capture dermatological image subtleties, future work will explore the applicability of this approach to larger and more diverse datasets to study the generalizability of skin condition diagnoses. Additional improvements to overall accuracy and efficiency can also be gained by using advanced feature extractors and more recent Graph Neural Networks (GNNs).
Future studies will focus on evaluating the model on high-resolution, clinically relevant datasets. We plan to add features for explainable AI to the GAT framework, such as node-level attention heatmaps or graph saliency proxies, to provide crucial interpretability from a clinical perspective. More complex hybrid GNN architectures, ensemble models, and uncertainty-aware predictions will also assist in achieving the robustness and trustworthiness necessary for clinically viable automated skin lesion characterization systems.
Acknowledgement: This work was funded by the Deanship of Graduate Studies and Scientific Research at Jouf University under grant No. (DGSSR-2025-02-01296).
Funding Statement: We are thankful to the Deanship of Graduate Studies and Scientific Research at Jouf University for funding this work.
Author Contributions: Ghadah Naif Alwakid: Conceptualization, funding acquisition, project administration; Samabia Tehsin: Writing—original draft, visualization; Mamoona Humayun: Project supervision, writing, review & editing; Asad Farooq: Experimentation, data collection and analysis; Ibrahim Alrashdi: experimentation, review & editing; Amjad Alsirhani: Project administration, data collection, experimentation. All authors reviewed the results and approved the final version of the manuscript.
Availability of Data and Materials: The data that support the findings of this study are openly available from the following sources:
- The DermaMNIST-Corrected dataset is available via the study by Abhishek et al. [29], accessible at https://arxiv.org/abs/2401.14497 (accessed on 17 September 2025).
- The image-to-graph conversion pipeline using SLIC superpixels was adapted from the open-source repository by Singh et al. [40], available at https://github.com/aryan-at-ul/imgraph (accessed on 17 September 2025).
Ethics Approval: No ethical approval is required for this study.
Conflicts of Interest: The authors declare no conflicts of interest to report regarding the present study.
References
1. American Academy of Dermatology Association. Burden of Skin Disease; 2016 [Internet]. [cited 2025 Jul 18]. Available from: https://www.aad.org/member/clinical-quality/clinical-care/bsd. [Google Scholar]
2. World Life Expectancy. Bangladesh: Skin disease; 2018 [Internet]. [cited 2024 Sep 25]. Available from: https://www.worldlifeexpectancy.com/bangladesh-skin-disease. [Google Scholar]
3. World Health Organization. Cancer; 2021 [Internet]. [cited 2020 Mar 20]. Available from: https://www.who.int/news-room/fact-sheets/detail/cancer. [Google Scholar]
4. Pattnayak P, Mohanty A, Patnaik S, Mohanty D. A comprehensive study on detecting skin diseases using deep learning techniques. In: 2024 IEEE 1st International Conference on Green Industrial Electronics and Sustainable Technologies (GIEST); 2024 Oct 25–26; Imphal, India. p. 1–5. doi:10.1109/GIEST62955.2024.10960070. [Google Scholar] [CrossRef]
5. Hay R, Augustin M, Griffiths C, Sterry W, Abuabara K, Airoldi M, et al. The global challenge for skin health. Oxford, UK: Blackwell Publishing Ltd.; 2015. doi:10.1111/bjd.13854. [Google Scholar] [CrossRef]
6. American Cancer Society. Survival rates for melanoma skin cancer; 2025 [Internet]. [cited 2025 Jul 19]. Available from: https://www.cancer.org/cancer/types/melanoma-skin-cancer/detection-diagnosis-staging/survival-rates-for-melanoma-skin-cancer-by-stage.html. [Google Scholar]
7. Zeng G, Peng H, Li A, Liu Z, Liu C, Yu PS, et al. Unsupervised skin lesion segmentation via structural entropy minimization on multi-scale superpixel graphs. arXiv:2309.01899. 2023. [Google Scholar]
8. Santoso KP, Ginardi RVH, Sastrowardoyo RA, Madany FA. Leveraging spatial and semantic feature extraction for skin cancer diagnosis with capsule networks and graph neural networks. arXiv:2403.12009. 2024. [Google Scholar]
9. Vasconcelos CN, Vasconcelos BN. Experiments using deep learning for dermoscopy image analysis. Pattern Recognit Lett. 2020;139(11):95–103. doi:10.1016/j.patrec.2017.11.005. [Google Scholar] [CrossRef]
10. Dorj UO, Lee KK, Choi JY, Lee M. The skin cancer classification using deep convolutional neural network. Multimed Tools Appl. 2018;77(8):9909–24. doi:10.1007/s11042-018-5714-1. [Google Scholar] [CrossRef]
11. Velickovic P, Cucurull G, Casanova A, Romero A, Lio P, Bengio Y. Graph attention networks. arXiv:1710.10903. 2018. [Google Scholar]
12. Noor MN, Haneef F, Ashraf I, Masud M. Enhanced skin disease classification via dataset refinement and attention-based vision approach. Bioengineering. 2025;12(3):275. doi:10.3390/bioengineering12030275. [Google Scholar] [PubMed] [CrossRef]
13. Gupta P, Nirmal J, Mehendale N. A survey on computer vision approaches for automated classification of skin diseases. Multimed Tools Appl. 2025;84(11):8673–705. doi:10.1007/s11042-024-19301-w. [Google Scholar] [CrossRef]
14. Chen J, Jiang Q, Ai Z, Wei Q, Xu S, Hao B, et al. Pigmented skin disease classification via deep learning with an attention mechanism. Appl Soft Comput. 2025;170:112571. doi:10.1016/j.asoc.2024.112571. [Google Scholar] [CrossRef]
15. Abbas S, Ahmed F, Khan WA, Ahmad M, Khan MA, Ghazal TM. Intelligent skin disease prediction system using transfer learning and explainable artificial intelligence. Sci Rep. 2025;15(1):1746. doi:10.1038/s41598-024-83966-4. [Google Scholar] [PubMed] [CrossRef]
16. Jagdish M, Guamangate SPG, López MAG, De La Cruz-Vargas JA, Camacho MER. Advance study of skin diseases detection using image processing methods. Nat Volatiles Essent Oils. 2022;9(1):997–1007. [Google Scholar]
17. Naqvi M, Gilani SQ, Syed T, Marques O, Kim HC. Skin cancer detection using deep learning-a review. Diagnostics. 2023;13(11):1911. doi:10.3390/diagnostics13111911. [Google Scholar] [PubMed] [CrossRef]
18. Bandyopadhyay S, Bose P, Bhaumik A, Poddar S. Machine learning and deep learning integration for skin diseases prediction. Int J Eng Trends Technol. 2022;70(2):11–8. doi:10.14445/22315381/IJETT-V70I2P202. [Google Scholar] [CrossRef]
19. Kalaivani A, Karpagavalli S. Detection and classification of skin diseases with ensembles of deep learning networks in medical imaging. Int J Health Sci. 2022;6(S1):13624–37. doi:10.53730/ijhs.v6nS1.8402. [Google Scholar] [CrossRef]
20. AlDera SA, Othman MTB. A model for classification and diagnosis of skin disease using machine learning and image processing techniques. Int J Adv Comput Sci Appl. 2022;13(5):31. doi:10.14569/IJACSA.2022.0130531. [Google Scholar] [CrossRef]
21. Wei ML, Tada M, So A, Torres R. Artificial intelligence and skin cancer. Front Med. 2024;11:1331895. doi:10.3389/fmed.2024.1331895. [Google Scholar] [PubMed] [CrossRef]
22. Farea E, Saleh RAA, AbuAlkebash H, Farea AAR, Al-antari MA. A hybrid deep learning skin cancer prediction framework. Eng Sci Technol Int J. 2024;57(4):101818. doi:10.1016/j.jestch.2024.101818. [Google Scholar] [CrossRef]
23. Prashanth BS, Puneeth BH, Manoj Kumar MV, Bhavana RK, Arshitha K, Santhosh S, et al. Deep learning approach for automated skin disease diagnosis. In: 2024 First International Conference on Innovations in Communications, Electrical and Computer Engineering (ICICEC); 2024 Oct 24–25; Davangere, India. p. 1–6. doi:10.1109/ICICEC62498.2024.10808369. [Google Scholar] [CrossRef]
24. Mercaldo F, Brunese L, Martinelli F, Santone A, Cesarelli M. Experimenting with extreme learning machine for biomedical image classification. Appl Sci. 2023;13(14):8558. doi:10.3390/app13148558. [Google Scholar] [CrossRef]
25. Ozdemir B, Pacal I. An innovative deep learning framework for skin cancer detection employing ConvNeXtV2 and focal self-attention mechanisms. Res Eng. 2025;25:103692. doi:10.1016/j.rineng.2024.103692. [Google Scholar] [CrossRef]
26. Sharma Y, Tiwari NK, Upaddhyay VK. EffSVMNet: an efficient hybrid neural network for improved skin disease classification. Smart Health. 2024;34(1):100520. doi:10.1016/j.smhl.2024.100520. [Google Scholar] [CrossRef]
27. Xin B, Huang J, Zhang L, Zheng C, Zhou Y, Lu J, et al. Dynamic topology analysis for spatial patterns of multifocal lesions on MRI. Med Image Anal. 2022;76(1):102267. doi:10.1016/j.media.2021.102267. [Google Scholar] [PubMed] [CrossRef]
28. Yang J, Shi R, Wei D, Liu Z, Zhao L, Ke B, et al. MedMNIST v2–a large-scale lightweight benchmark for 2D and 3D biomedical image classification. Sci Data. 2023;10(1):41. doi:10.1038/s41597-022-01721-8. [Google Scholar] [PubMed] [CrossRef]
29. Abhishek K, Jain A, Hamarneh G. Investigating the quality of DermaMNIST and Fitzpatrick17k dermatological image datasets. arXiv:2401.14497. 2024. [Google Scholar]
30. Rahman M, Bazgir E, Hossain SMS, Maniruzzaman M. Skin cancer classification using NASNet. Int J Sci Res Arch. 2024;11(1):775–85. doi:10.30574/ijsra.2024.11.1.0106. [Google Scholar] [CrossRef]
31. Mahmoud NM, Soliman AM. Early automated detection system for skin cancer diagnosis using artificial intelligent techniques. Sci Rep. 2024;14(1):9749. doi:10.1038/s41598-024-59783-0. [Google Scholar] [PubMed] [CrossRef]
32. Muhaba KA, Dese K, Aga TM, Zewdu FT, Simegn GL. Automatic skin disease diagnosis using deep learning from clinical image and patient information. Skin Health Dis. 2022;2(1):e81. doi:10.1002/ski2.81. [Google Scholar] [PubMed] [CrossRef]
33. Gajera HK, Nayak DR, Zaveri MA. A comprehensive analysis of dermoscopy images for melanoma detection via deep CNN features. Biomed Signal Process Control. 2023;79(2):104186. doi:10.1016/j.bspc.2022.104186. [Google Scholar] [CrossRef]
34. Yu H, He G, Wang W, Qin S, Wang Y, Bai M, et al. A graph neural network approach for accurate prediction of pathogenicity in multi-type variants. Brief Bioinform. 2025;26(2):bbaf151. doi:10.1093/bib/bbaf151. [Google Scholar] [PubMed] [CrossRef]
35. Yasir S, Kim H. Attention-based deep feature aggregation network for skin lesion classification. Electronics. 2025;14(12):2364. doi:10.3390/electronics14122364. [Google Scholar] [CrossRef]
36. Kadric N, Akagic A, Kapo M. Improving diagnostic accuracy of pigmented skin lesions with CNNs: a case study with DermaMNIST dataset. arXiv:2507.12961. 2025. [Google Scholar]
37. Halder A, Dalal A, Gharami S, Wozniak M, Ijaz MF, Singh PK. A fuzzy rank-based deep ensemble methodology for multi-class skin cancer classification. Sci Rep. 2025;15(1):6268. doi:10.1038/s41598-025-90423-3. [Google Scholar] [PubMed] [CrossRef]
38. Amangeldi A, Taigonyrov A, Jawad M, Mbonu C. CNN and ViT efficiency study on tiny ImageNet and DermaMNIST datasets. arXiv:2505.08259. 2025. [Google Scholar]
39. Salvo F, Doerrich S, Ledig C. MedMNIST-C: comprehensive benchmark and improved classifier robustness by simulating realistic image corruptions. arXiv:2406.17536. 2024. [Google Scholar]
40. Singh A. Imgraph: graph neural networks for image processing; 2023 [Internet]. [cited 2025 Sep 17]. Available from: https://github.com/aryan-at-ul/imgraph. [Google Scholar]
41. Liu Z, Zhou J. Graph attention networks. In: Introduction to graph neural networks. Cham, Switzerland: Springer International Publishing; 2020. p. 39–41. doi:10.1007/978-3-031-01587-8_7. [Google Scholar] [CrossRef]
42. Patiño D, Avendaño J, Branch JW. Automatic skin lesion segmentation on dermoscopic images by the means of superpixel merging. In: Frangi AF, Schnabel JA, Davatzikos C, Alberola-López C, Fichtinger G, editors. Medical image computing and computer assisted intervention—MICCAI 2018. Cham, Switzerland: Springer International Publishing; 2018. p. 728–36. doi:10.1007/978-3-030-00937-3_83. [Google Scholar] [CrossRef]
43. Xu K, Hu W, Leskovec J, Jegelka S. How powerful are graph neural networks?. In: Proceedings of the 35th International Conference on Machine Learning (ICML); 2018 Jul 10–15; Stockholm, Sweden. p. 3513–22. [Google Scholar]
44. Hamilton WL, Ying R, Leskovec J. Inductive representation learning on large graphs. In: Advances in neural information processing systems (NeurIPS); 2017 [Internet]. [cited 2025 Sep 17]. Available from: https://cs.stanford.edu/people/jure/pubs/graphsage-nips17.pdf. [Google Scholar]
45. Kipf TN, Welling M. Semi-supervised classification with graph convolutional networks. arXiv:1609.02907. 2016. [Google Scholar]
46. Shetty B, Fernandes R, Rodrigues AP, Chengoden R, Bhattacharya S, Lakshmanna K. Skin lesion classification of dermoscopic images using machine learning and convolutional neural network. Sci Rep. 2022;12(1):18134. doi:10.1038/s41598-022-22644-9. [Google Scholar] [PubMed] [CrossRef]
47. Behara K, Bhero E, Agee JT. An improved skin lesion classification using a hybrid approach with active contour snake model and lightweight attention-guided capsule networks. Diagnostics. 2024;14(6):636. doi:10.3390/diagnostics14060636. [Google Scholar] [PubMed] [CrossRef]
48. Kebaili A, Lapuyade-Lahorgue J, Ruan S. Deep learning approaches for data augmentation in medical imaging: a review. J Imaging. 2023;9(4):81. doi:10.3390/jimaging9040081. [Google Scholar] [PubMed] [CrossRef]
49. Montaha S, Azam S, Rafid AKMRH, Islam S, Ghosh P, Jonkman M. A shallow deep learning approach to classify skin cancer using down-scaling method to minimize time and space complexity. PLoS One. 2022;17(8):e0269826. doi:10.1371/journal.pone.0269826. [Google Scholar] [PubMed] [CrossRef]
Cite This Article
 Copyright © 2026 The Author(s). Published by Tech Science Press.
This work is licensed under a Creative Commons Attribution 4.0 International License , which permits unrestricted use, distribution, and reproduction in any medium, provided the original work is properly cited.
 Downloads
 Citation Tools