
 Submit a Paper
 Propose a Special lssue
 Open Access
ARTICLE

An Optimal Right-Turn Coordination System for Connected and Automated Vehicles at Urban Intersections
1 Department of Mechanical Science and Technology, Graduate School of Science and Technology, Gunma University, Kiryu, 376-8515, Japan
2 Department of Systems and Control Engineering, School of Engineering, Institute of Science Tokyo, Tokyo, 152-8552, Japan
* Corresponding Author: Md Abdus Samad Kamal. Email:
(This article belongs to the Special Issue: Advances in Vehicular Ad-Hoc Networks (VANETs) for Intelligent Transportation Systems)
Computers, Materials & Continua 2026, 86(1), 1-17. https://doi.org/10.32604/cmc.2025.070222
Received 10 July 2025; Accepted 10 October 2025; Issue published 10 November 2025
 View Full Text
 Download PDF
Abstract
Traffic at urban intersections frequently encounters unexpected obstructions, resulting in congestion due to uncooperative and priority-based driving behavior. This paper presents an optimal right-turn coordination system for Connected and Automated Vehicles (CAVs) at single-lane intersections, particularly in the context of left-hand side driving on roads. The goal is to facilitate smooth right turns for certain vehicles without creating bottlenecks. We consider that all approaching vehicles share relevant information through vehicular communications. The Intersection Coordination Unit (ICU) processes this information and communicates the optimal crossing or turning times to the vehicles. The primary objective of this coordination is to minimize overall traffic delays, which also helps improve the fuel consumption of vehicles. By considering information from upcoming vehicles at the intersection, the coordination system solves an optimization problem to determine the best timing for executing right turns, ultimately minimizing the total delay for all vehicles. The proposed coordination system is evaluated at a typical urban intersection, and its performance is compared to traditional traffic systems. Numerical simulation results indicate that the proposed coordination system significantly enhances the average traffic speed and fuel consumption compared to the traditional traffic system in various scenarios.Keywords
In the past few decades, widespread traffic congestion has affected many major cities in developed nations. Key factors contributing to traffic congestion include increasing urbanization, unplanned transport infrastructure, inadequate public transport systems, heavy traffic flow in single lanes with short-distance crossings, and the rising number of personal vehicles [1]. Moreover, a vehicle’s right turn on a single-lane road, considering left-hand side driving (equivalently, left turn in the context of right-hand side driving of the roads), often causes congestion and consequently delays the movement of following vehicles. This congestion disrupts the smooth flow of traffic because oncoming vehicles usually do not yield to the right-of-way until the traffic signal changes from green to red, causing significantly increased delays, fuel consumption, and emissions during traffic congestion [2]. Studies show that vehicle energy consumption increases considerably due to frequent stopping, starting, and idling at intersections [3]. Moreover, turning-related accidents account for a large portion of intersection crashes. Therefore, developing control systems to enhance the coordination of turning vehicles at intersections is crucial for reducing accidents, delays, and fuel consumption.
In the emerging paradigm of connected and automated transportation, Vehicle-to-Everything (V2X) communication is expected to play a crucial role in enhancing road safety, improving traffic efficiency, and enhancing passenger infotainment [4]. Existing Dedicated Short-Range Communications (DSRC)-based V2X technology and emerging cellular-based V2X technologies, when combined with cloud-based fast computing facilities, can be utilized to create efficient traffic coordination systems. These V2X technologies can establish a cyber-physical framework that facilitates effective coordination between vehicles and traffic lights at intersections [5]. Numerous studies have proposed systems for the optimal coordination of connected and automated vehicles [6]. Miculescu and Karaman [7] proposed an algorithm for coordinated control of autonomous vehicles at intersections without signals. They demonstrate how a polling system can be utilized to coordinate communication and behavior among vehicles, thereby achieving safe and efficient traffic flow at intersections. The framework aims to coordinate and optimize vehicle traffic on multi-lane highways, leveraging advanced sensor technology and real-time data analysis. There are also extensive works on adaptive signal control and traffic coordination in connected vehicle environments. For example, Li et al. [8] reviewed adaptive signal control and its effects on urban traffic. It described how connected vehicles can dynamically adjust traffic signals to reduce traffic congestion.
Additionally, studies are being conducted on the application of communication technologies at smart intersections. Namazi and Taghavipour [9] investigated the use of Vehicle-to-Vehicle (V2V) and Vehicle-to-Infrastructure (V2I) communication systems to enhance traffic flow and reduce emissions. This research demonstrates how real-time communication between vehicles and infrastructure can be utilized to efficiently manage traffic and reduce emissions at intersections. Galvão et al. [10] proposed a method to optimize the management of urban intersections using visible light communications. This approach aimed to enhance traffic flow and minimize delays at intersections by coordinating the control of vehicles and traffic signals. Other studies proposed distributed routing systems in urban areas using Vehicular Ad-hoc Networks (VANETs) [11]. Particularly, they presented an innovative approach to optimizing urban traffic flow in real-time at signalized intersections, and Wang et al. [12] proposed an augmented vehicle-following model at unsignalized intersections. The models aimed to achieve safe and efficient traffic flow by coordinating vehicle movements based on V2V communication.
Some studies analyzed the intersection control of autonomous vehicles using Model Predictive Control (MPC). Farkas et al. proposed algorithms that allow autonomous vehicles to operate safely and efficiently at intersections [13]. Xu et al. [14] proposed a method for coordinating signal optimization and speed control at isolated intersections. The method aims to optimize traffic flow by enabling connected vehicles to control signals and speeds at intersections cooperatively. Yang et al. [15] designed human-machine interfaces that provide right-turn timing at intersections. They evaluated the effectiveness of the interface in providing drivers with appropriate right-turn timing. Sun et al. [16] studied interactive left turns by automated vehicles at uncontrolled intersections. This research investigated how automated vehicles can safely interact with other vehicles during left turns. Mahler and Vahidi [17] proposed a method for probabilistically predicting traffic signal timings and optimizing vehicle velocity based on these predictions. These studies contribute to energy efficiency and emphasize the importance of eco-driving, taking into account traffic signals and road conditions. Bento et al. [18] study the environmental impact of intelligent vehicle control at intersections via V2V and V2I communication. This study examines the environmental implications of intelligent vehicle control at intersections and demonstrates how efficient traffic management can mitigate environmental impacts. Existing works on intersections mainly focused on signal control or trajectory control of approaching vehicles (partially or fully connected) at the intersection. However, the right-turn coordination of CAVs at intersections did not receive much attention.
In this study, we developed an optimal right-turn coordination system for CAVs at single-lane intersections. It is assumed that under a Level 3 autonomous driving system, or Conditional Driving Automation [19], enabling a vehicle to drive itself under specific conditions and within limited areas, provided the driver is ready to retake control when the system requests it. Such a driving system can automatically adjust the speed according to the target crossing time given by the ICU, using the V2V communication system. The right-turn vehicle and the vehicles in the opposite lane are optimized to follow a target trajectory for a smooth right turn. In this study, the number of right-turning vehicles is considered insignificant, and therefore, no right-turn lanes or right-turn signal phases are installed. The right-turning vehicle and oncoming vehicles measure the time from their current position to reach the intersection and share that time, allowing the oncoming vehicle to decide whether to yield to the right-turning vehicle. We set a time interval to ensure a safe right turn, thereby avoiding a collision between the right-turning vehicle and the oncoming vehicle. It is found that the system minimizes the objective function in terms of overall delay time due to right turns, thereby improving traffic flow and fuel consumption.
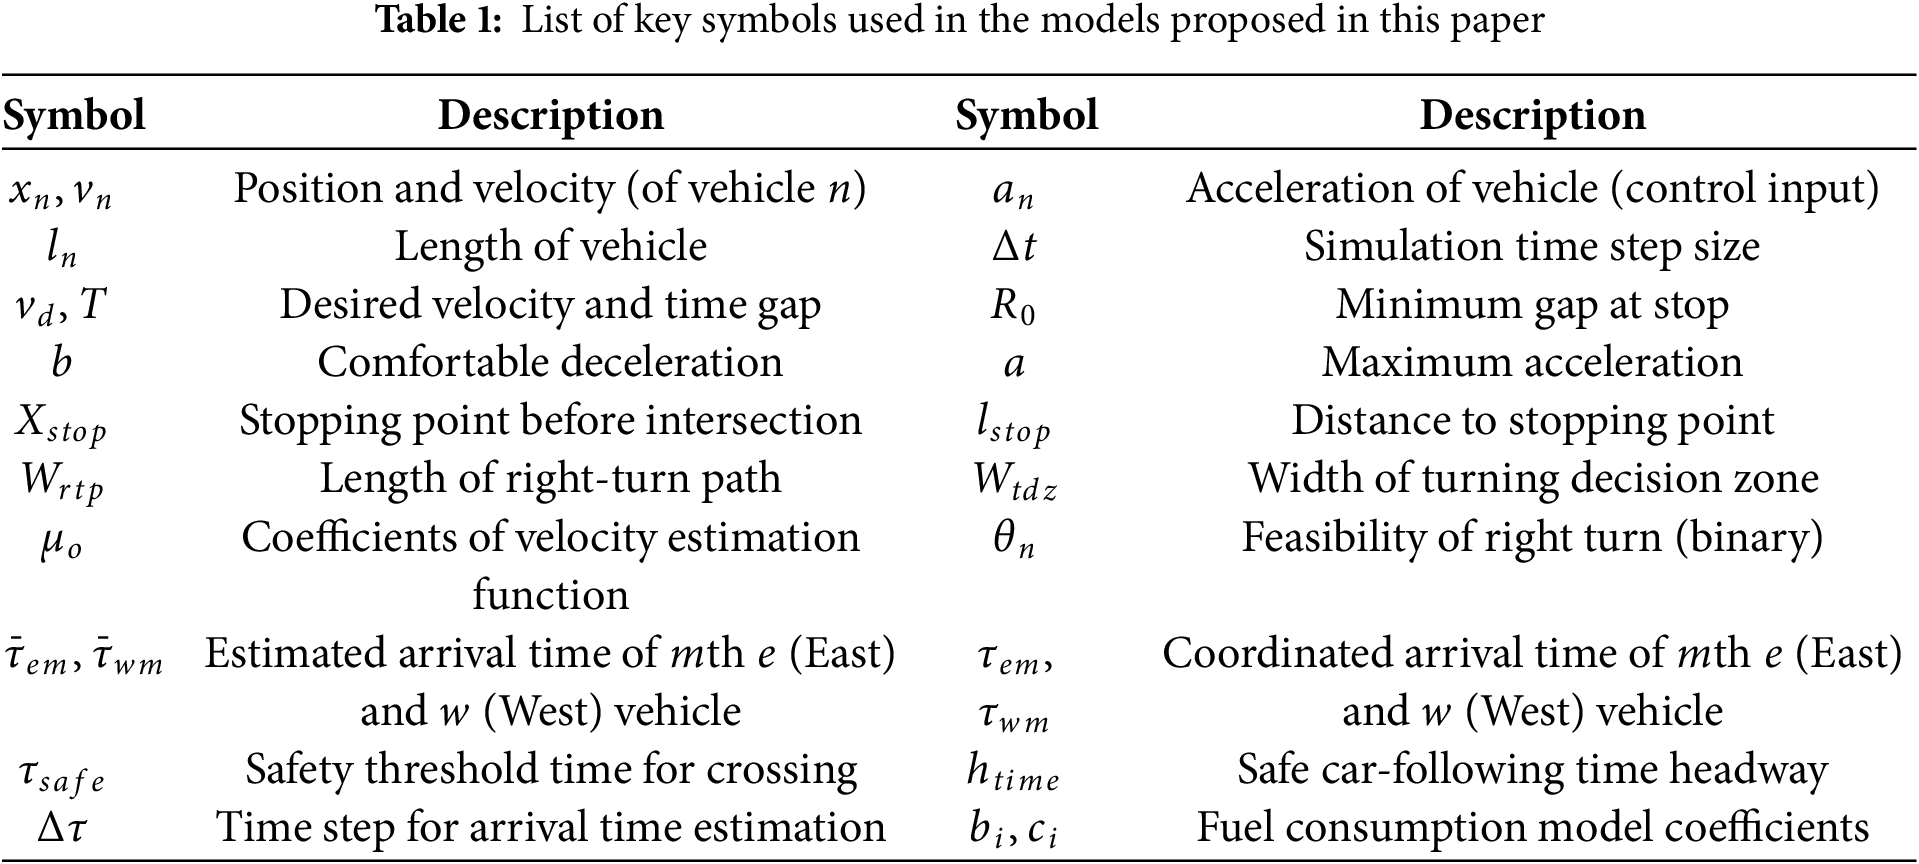
This section presents a comprehensive methodology for the proposed system. It begins with the problem statement, vehicle dynamics, and models of traditional driving. The typical decision-making process for right turns is analyzed, followed by the design of a cyber-physical optimal coordination framework where vehicles communicate with an Intersection Coordination Unit (ICU) via V2X technologies. For convenience, the key variables and parameters are summarized in Table 1.
In the context of road traffic systems in Japan, let us consider a typical single-lane urban intersection without an auxiliary short right-turning lane or a dedicated turning signal phase, due to a small volume of turning traffic. In a green phase, a vehicle can turn right only if there is a safe gap between a pair of vehicles in the opposite lane or wait until the end of the red phase (i.e., turn in the inter-phase time). When a vehicle fails to turn smoothly at such intersections in relatively dense traffic, it often blocks many straight-going vehicles behind it, leading to severe congestion, as illustrated in Fig. 1. Coordinating a large number of vehicles from a distance optimally is not feasible in such critical scenarios due to the complexity of the required computations and communication, as well as the necessary safety concerns. Therefore, a limited centralized coordination followed by fully distributed local control is the best solution, as considered in this paper. In this study, we assume an upcoming scenario in which all vehicles communicate their states and turning intentions to the ICU upon arrival within the communication range. It is also assumed that the communication is ideal, with no significant delay, and the ICU has a proper sensing method to detect any pedestrian crossing, thereby constraining the turning time in the optimization to avoid a potential accident. The problem considered for the ICU is to optimally determine the safe turning and crossing times of all vehicles, thereby minimizing the overall traffic delay and coordinating vehicles efficiently.
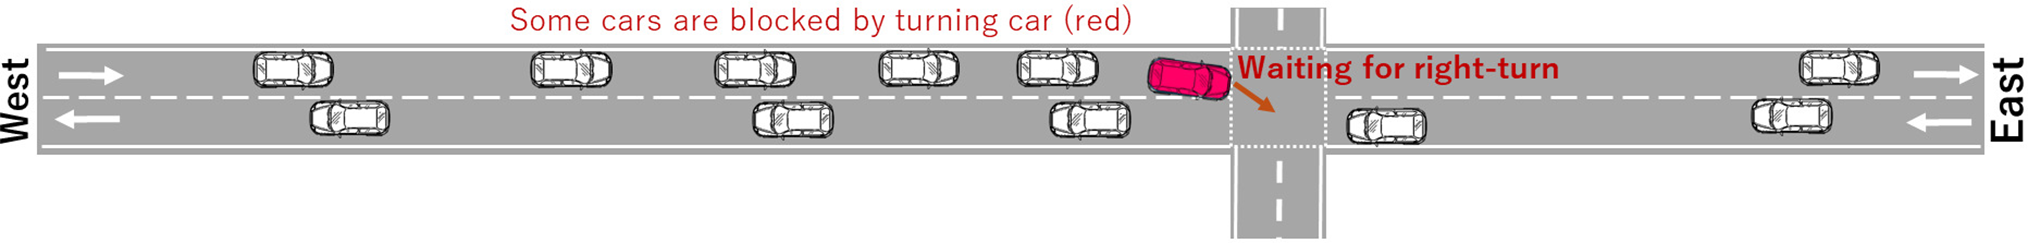
Figure 1: Typical traffic congestion created by right-turn delays as a car (red) from the West waits to turn, causing many cars behind to wait for a longer period
2.2 Vehicle Dynamics and Motion Control
For the development of a new traffic coordination system, the traditional vehicle control with turning decisions at the intersection is modeled first. The dynamic behavior related to the longitudinal motion of a vehicle is the basis of this study, where the position
The primary driving task is determining the control input
Using the IDM, the car-following function
where variables
The IDM can regulate the acceleration of a vehicle based on its position and velocity; however, it cannot directly incorporate the effects of traffic signals or turning points where a car must stop first. Therefore, for any target stopping point
where, based on experimental driving data fittings, the order of polynomial fittings is
Using
Since the model is valid only for a limited distance
In (7), for the case
which ensures collision-free stopping behavior of vehicle
2.3 Typical Right-Turning Decision
Here we explain a vehicle’s typical right-turning decision process using the illustration in Fig. 2, where vehicle
where
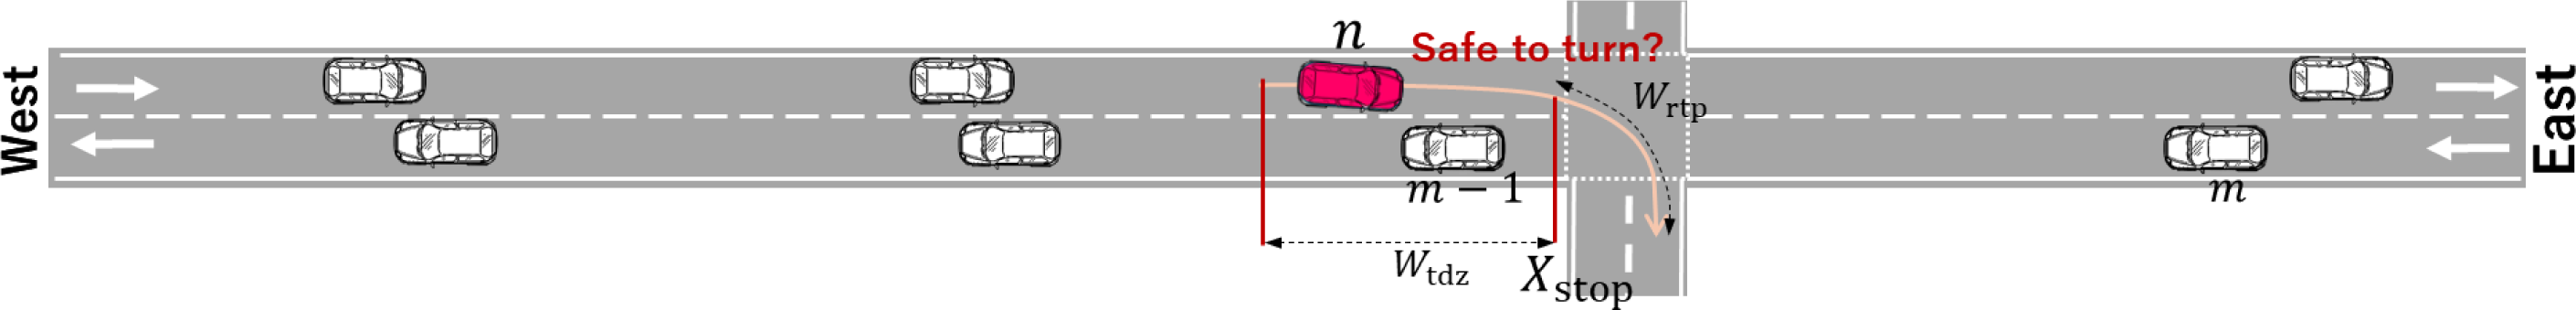
Figure 2: Typical right-turn decision process by a vehicle (red) in the decision zone that evaluates expected safe gaps with conflicting vehicles
2.4 Proposed Intersection Coordination System
Fig. 3 illustrates the schematic diagram of the proposed optimal coordination system under a cyber-physical framework. We assume a connected vehicle environment under a VANET around the intersection with a communication zone of range
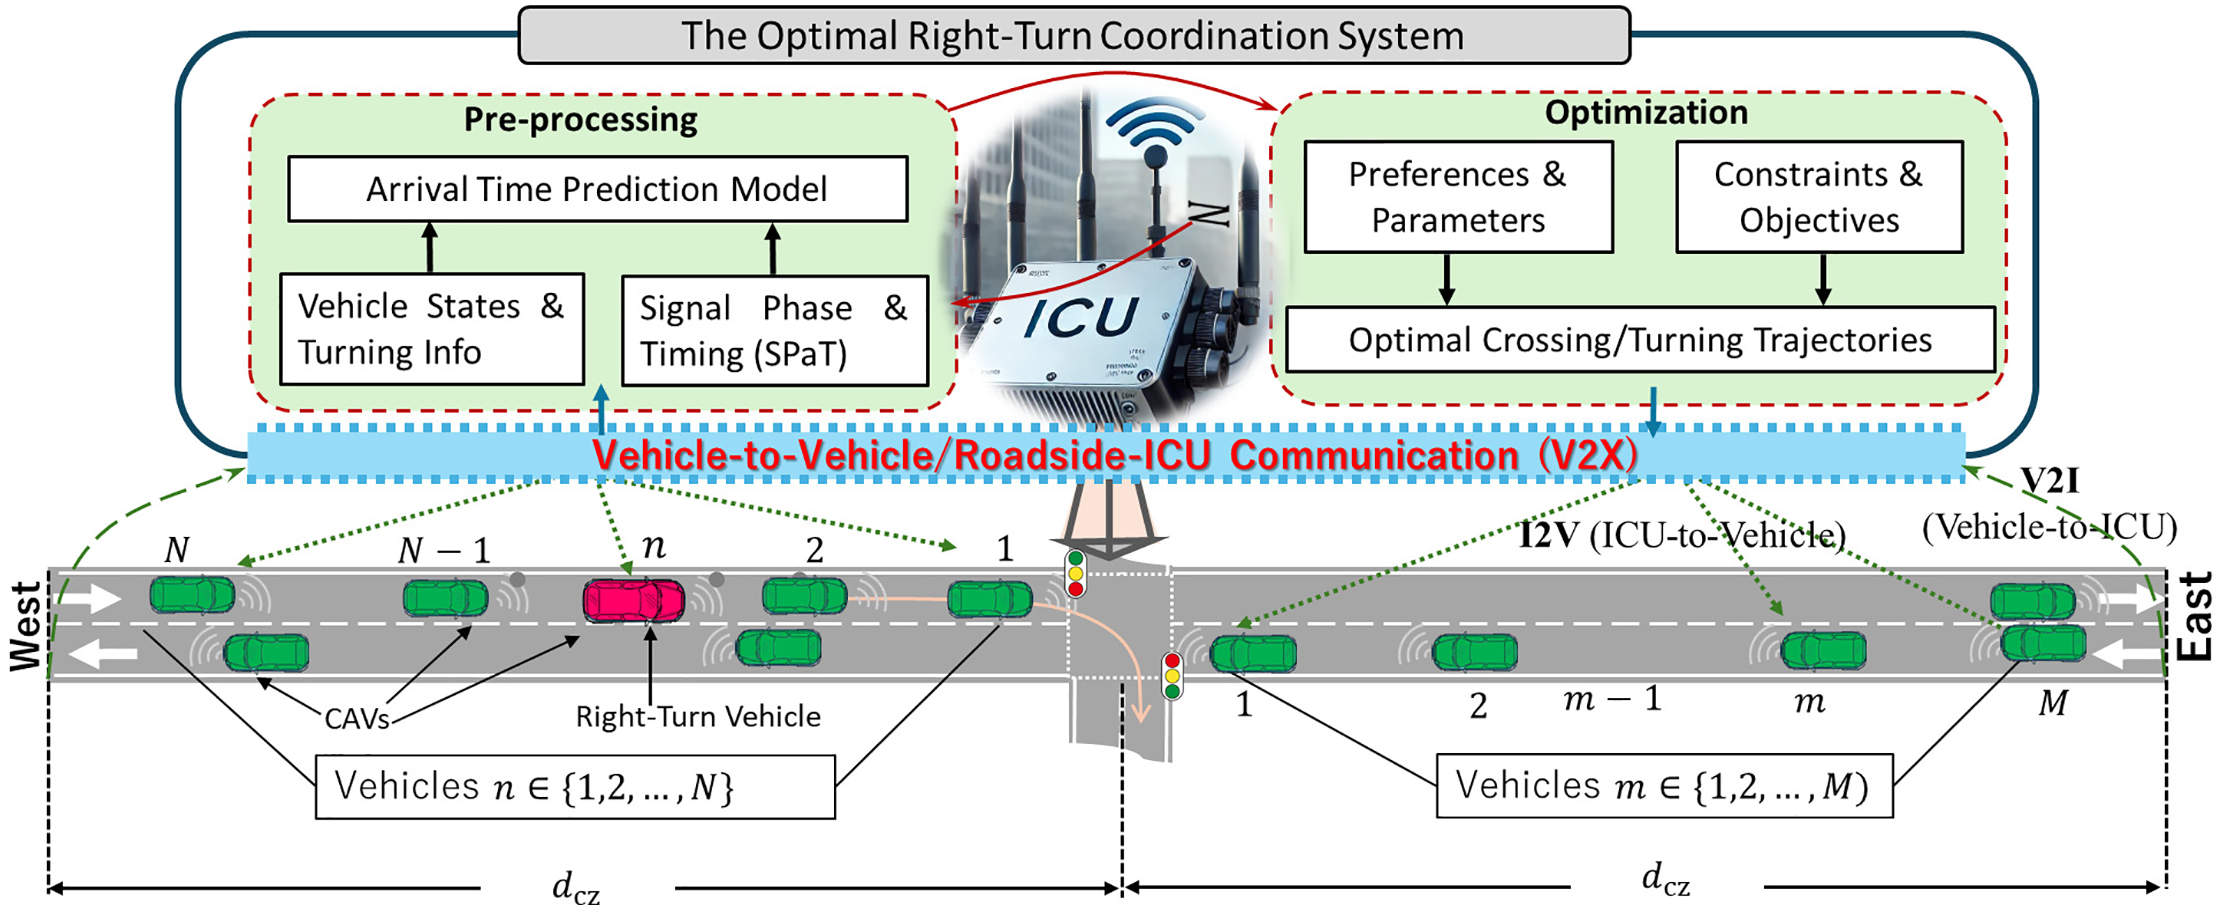
Figure 3: Schematic diagram of the cyber-physical optimal right-turn coordination system at an intersection, which includes all CAVs sharing information with ICU
2.5 Optimal Right-Turn Coordination Decision
To reduce total delay time for all vehicles at an intersection, right-turning vehicles and incoming traffic from opposite directions should adjust their spacing and velocity efficiently. The optimal right-turn coordination system receives necessary information from vehicles approaching the intersection, computes the best driving strategy considering the right-turn vehicles, and communicates this strategy to individual vehicles. Then, the local controller of each automated vehicle executes this driving strategy, ensuring it satisfies safety constraints on the road. The optimal right-turn coordination system plans when to execute the right turn.
We assume that among vehicles
where
subject to
where
2.6 Estimation of Arrival Time
In the above optimization problem, the free flow arrival times,
where K is the final step in the iterative process, with the relationship given as
subject to, with
for
Finally, the overall functional flowchart is shown in Fig. 4, including the safe driving process of individual vehicles and the cooperating process with the ICU.
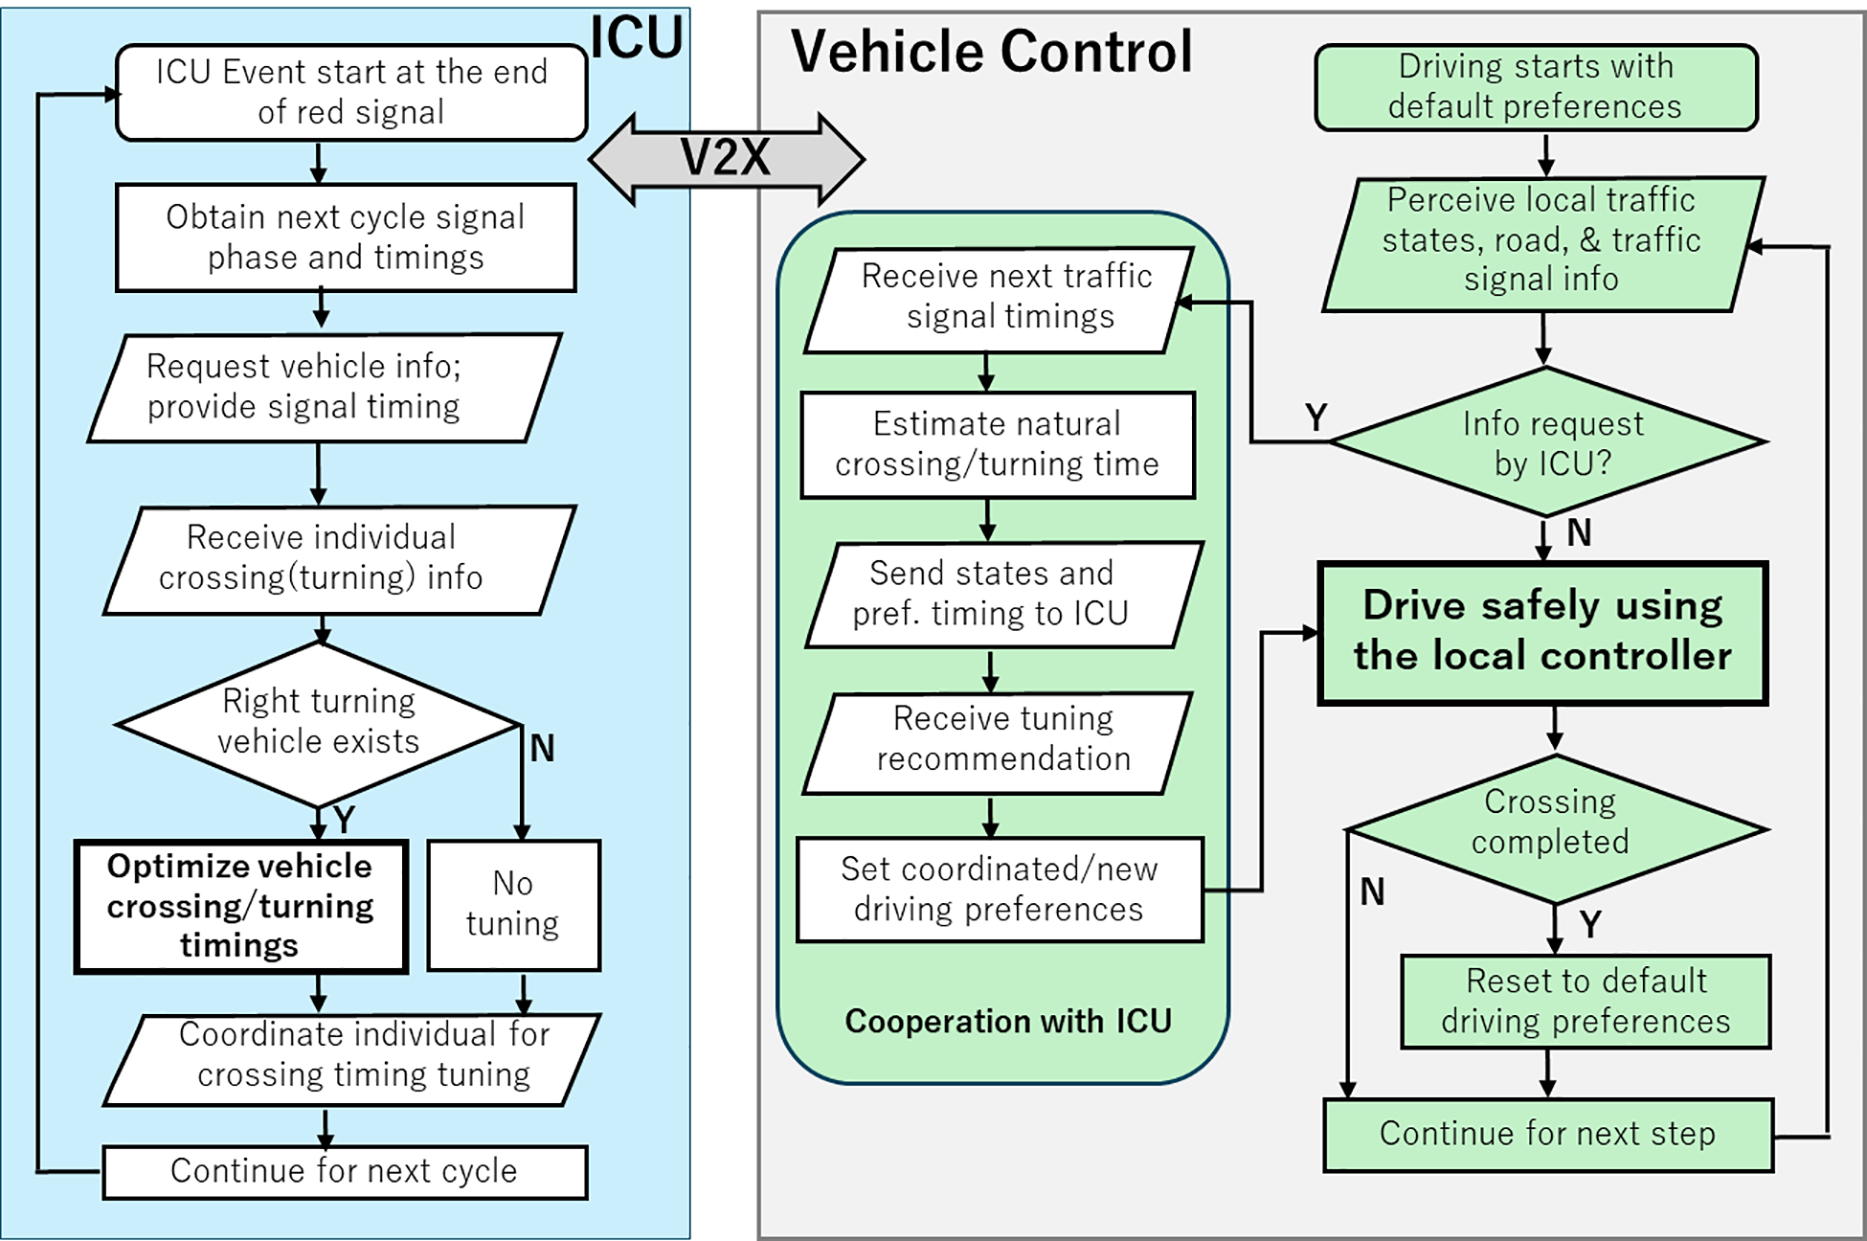
Figure 4: Functional flowchart showing ICU coordination process, basic driving decision of individual vehicles, including cooperation process with ICU
The proposed right-turn coordination system is assessed using microscopic simulation methods. The evaluation includes the proposed arrival prediction model, followed by an assessment of the proposed system under typical implemented scenarios that incorporate microscopic trajectories and individual driving behaviors. Finally, the impact of traffic variation is compared to the overall average traffic performance. The discussion surrounding the proposed system, including its limitations, computational complexity, implementation challenges, and potential for future enhancements, is described.
To evaluate the proposed right turn coordination system, a microscopic traffic simulation framework is built in MATLAB, as in Fig. 2, where a 1 km road features an intersection at 500 m, and has a speed limit of 50 km/h. The route is single-lane and allows vehicles to turn right at the intersection. Traffic lights are set at 40 s each for red and green signals, with an 80 s cycle. The traffic flow volume is set at a moderate level, and the parameters of the car-following model are chosen typically to reflect typical human driving behavior. The safe car-following time gap
The fuel consumption rate
where
First, we demonstrate the estimation of arrival/crossing times of vehicles at the intersection using (16), to show that for any initial velocity and distance (to the crossing point of the non-turning vehicle), it can estimate the required arrival time (in the absence of a nearby preceding vehicle). Particularly, we choose arbitrary distances to the intersection and velocity (represented by a black circle) to estimate a vehicle’s predicted natural arrival time and associated velocity patterns. Fig. 5a depicts the sample velocity profiles with estimated arrival/crossing times of vehicles at the intersection for freely traveling in a green signal, and Fig. 5b depicts the same in the case of slowing or stopping (due to turning or a red signal). Specifically, the time is calculated in seconds using the velocity curves from the black circle to the intersection crossing point at 500 m, and the corresponding velocity profile is displayed for each case. It is found that the estimated arrival times mostly closely match the measured arrival times for uncontrolled cases. These estimated values in
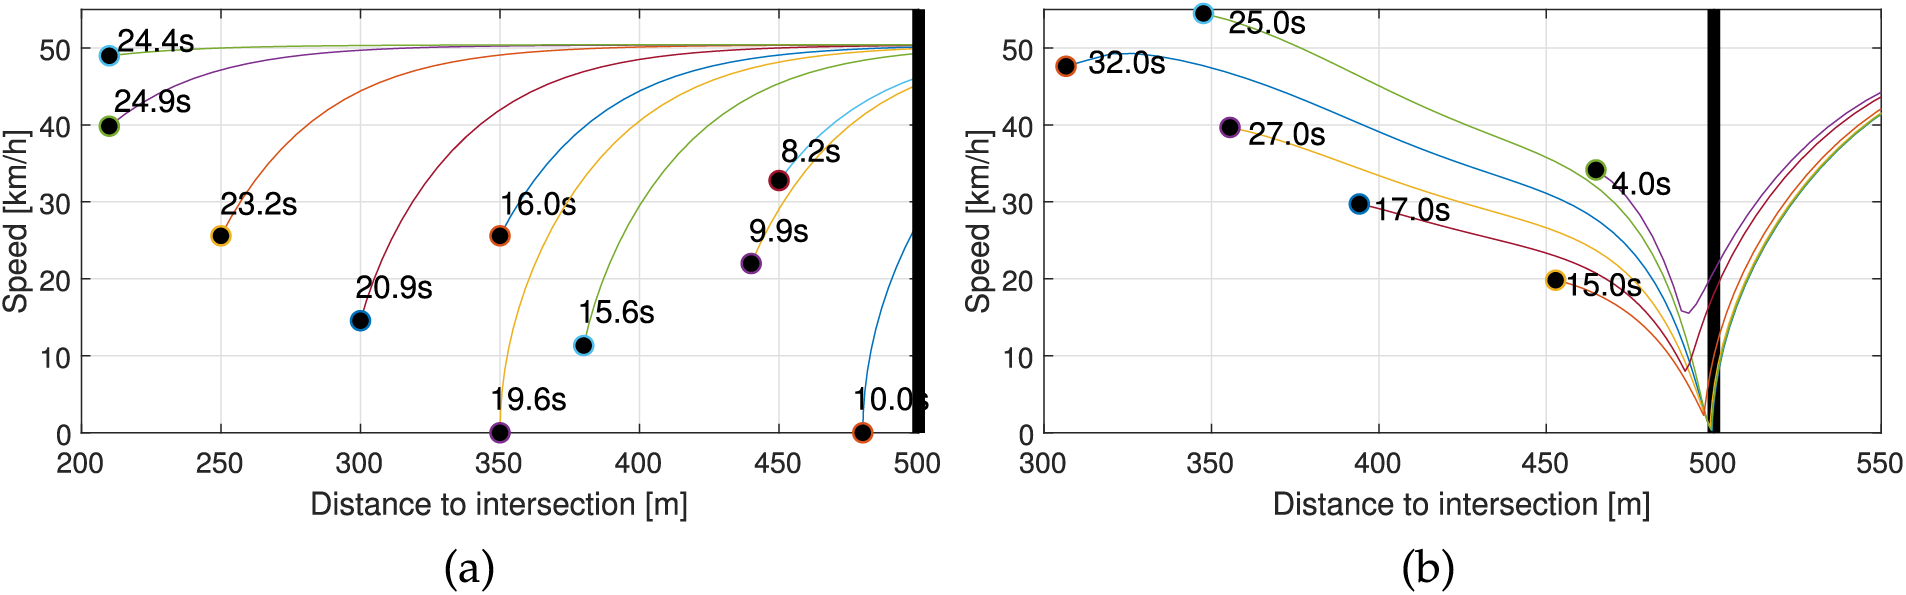
Figure 5: Example of predicted arrival times estimated for different speeds and distances shown by black circles based on speed profiles along the road (the thick vertical line shows the intersection position): (a) when vehicles travel freely during a green signal and (b) when vehicles must slow down or stop for a red signal
3.2 Evaluation of the Proposed Method
For simplicity, we consider that the signal becomes green at simulation time 0. Eleven vehicles from the West and eight vehicles from the East approach the intersection from some random positions. The fifth one from the West is set as a turning vehicle. In this case, the uncoordinated traditional traffic is first simulated, and the trajectories of the East and the West cars are displayed in Fig. 6a,b, respectively. For clarity, the traffic light is depicted with a white dashed line on each side, indicating the precise center of the intersection, and the vehicles are numbered in order of arrival. In Fig. 6, the 5th vehicle, indicated in red, slows down when approaching the intersection and eventually stops while looking for a safe gap. The vehicles from the East (represented in blue solid lines) do not create a gap for the turning vehicle from the West because they have a greater presence or priority. Finally, it executes the turning maneuver when all eight vehicles from the East cross the intersection. The 6th to 11th vehicles from the West take extra time to cross afterward. The trajectory of the West vehicles (Fig. 6b) shows that the 7th to 11th vehicles have to stop at the red signal for about 40 to 80 s.
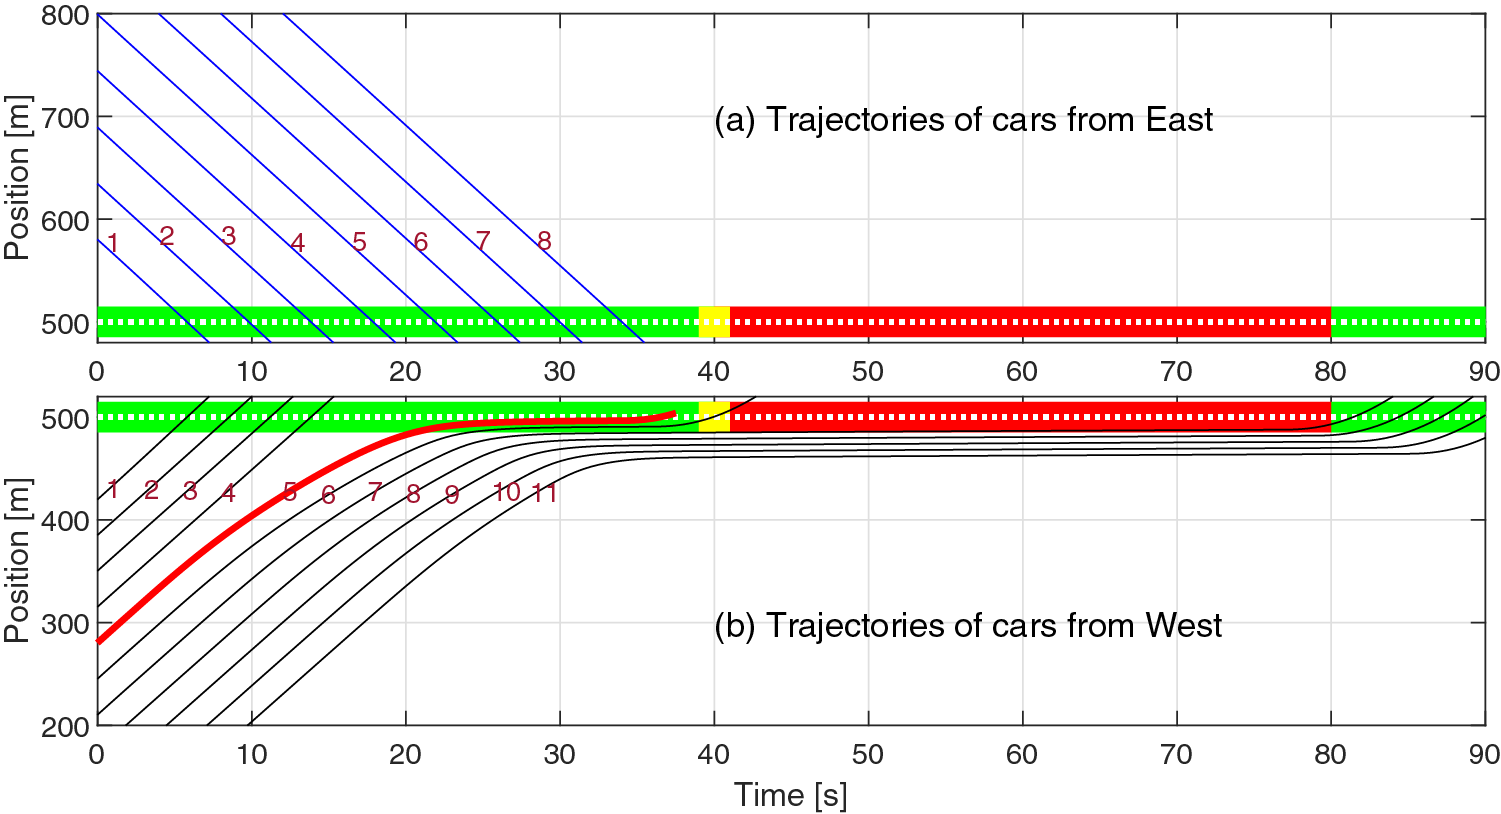
Figure 6: Traffic signals at intersection at 500 m, and trajectories of vehicles from both sides: (a) the East and (b) the West, with the Human Driving Model. East vehicles (blue) cross straightaway while the turning vehicle (5th, with thick-red) forces others behind to idle until the next green
This is because the vehicles to the East (Fig. 6a) do not consider the right-turning vehicle and pass through the intersection without slowing down. This extra delay of some vehicles may create spill-back congestion with the same green duration. To avoid such a delay, the signal cycle is typically made longer in the traditional system, resulting in extra idling of other phase vehicles during the red phase.
In contrast, Fig. 7 shows the trajectory of the vehicles under the proposed coordination scheme. Based on optimal coordination at the beginning of green time, each vehicle is assigned its desired optimal crossing or turning time, which reduces the total delay in a quadratic sense, as defined by the objective function. The optimal
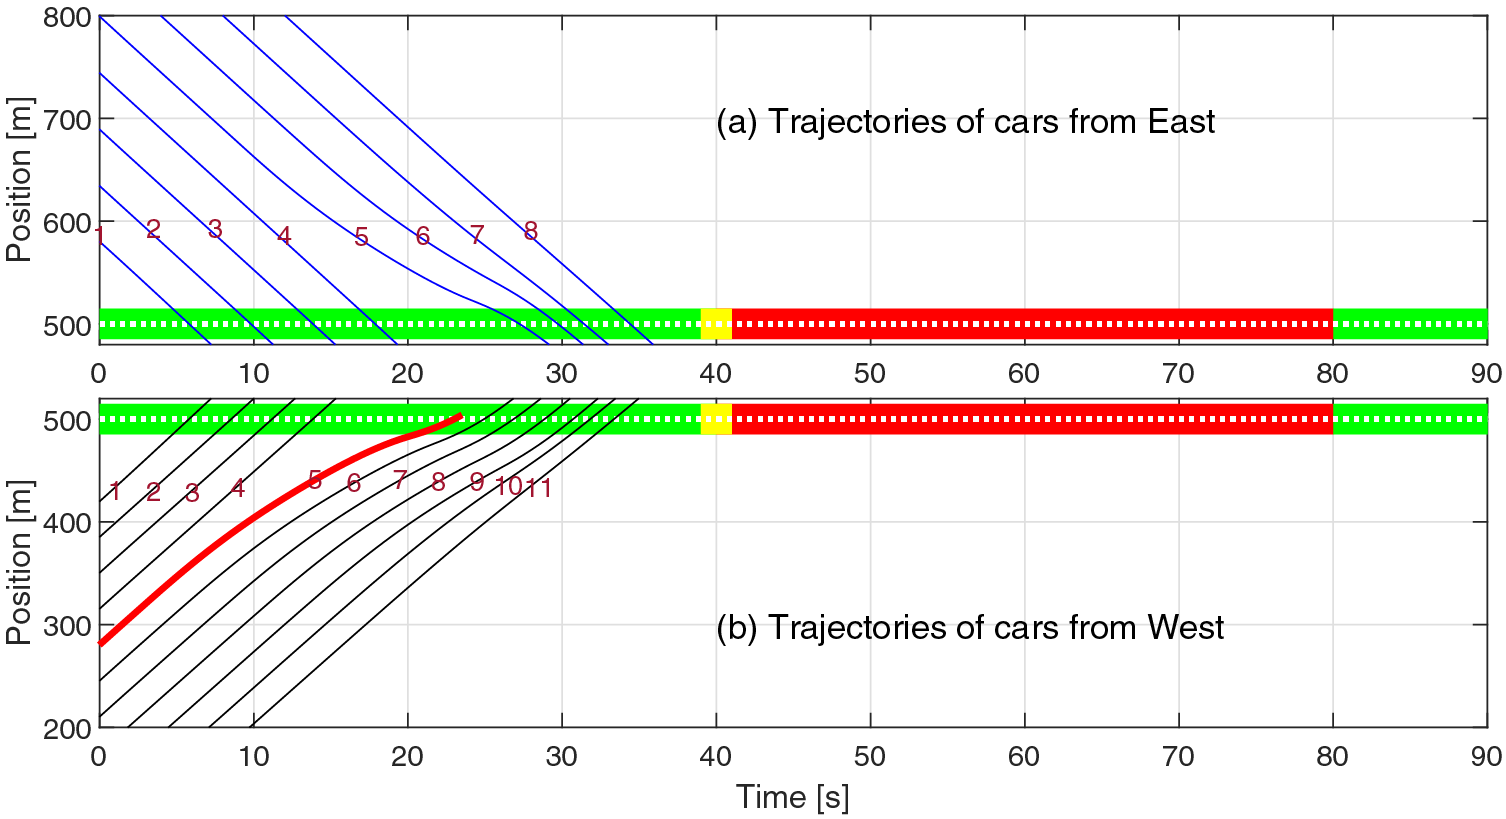
Figure 7: Traffic signals at intersection at 500 m, and trajectories of vehicles from both sides: (a) the East and (b) the West, the proposed optimized driving system. Trajectories show all vehicles from both sides passing before the red signal
Fig. 8a shows the average speed of these vehicles for both sides, and the corresponding mean speed using solid lines. The 5th and its follower from the East side slightly reduce their speed under coordination to facilitate the smooth turning of the 5th vehicle from the West side. Such a slight drop in velocity significantly increases the speed of many vehicles in the West. Considering only the affected vehicles from both sides (i.e., the 5th–8th from the East and 5th–11th from the West), the average speed for the proposed coordinated system is 35.62 km/h, significantly higher than that of traditional systems, which average 24.76 km/h.
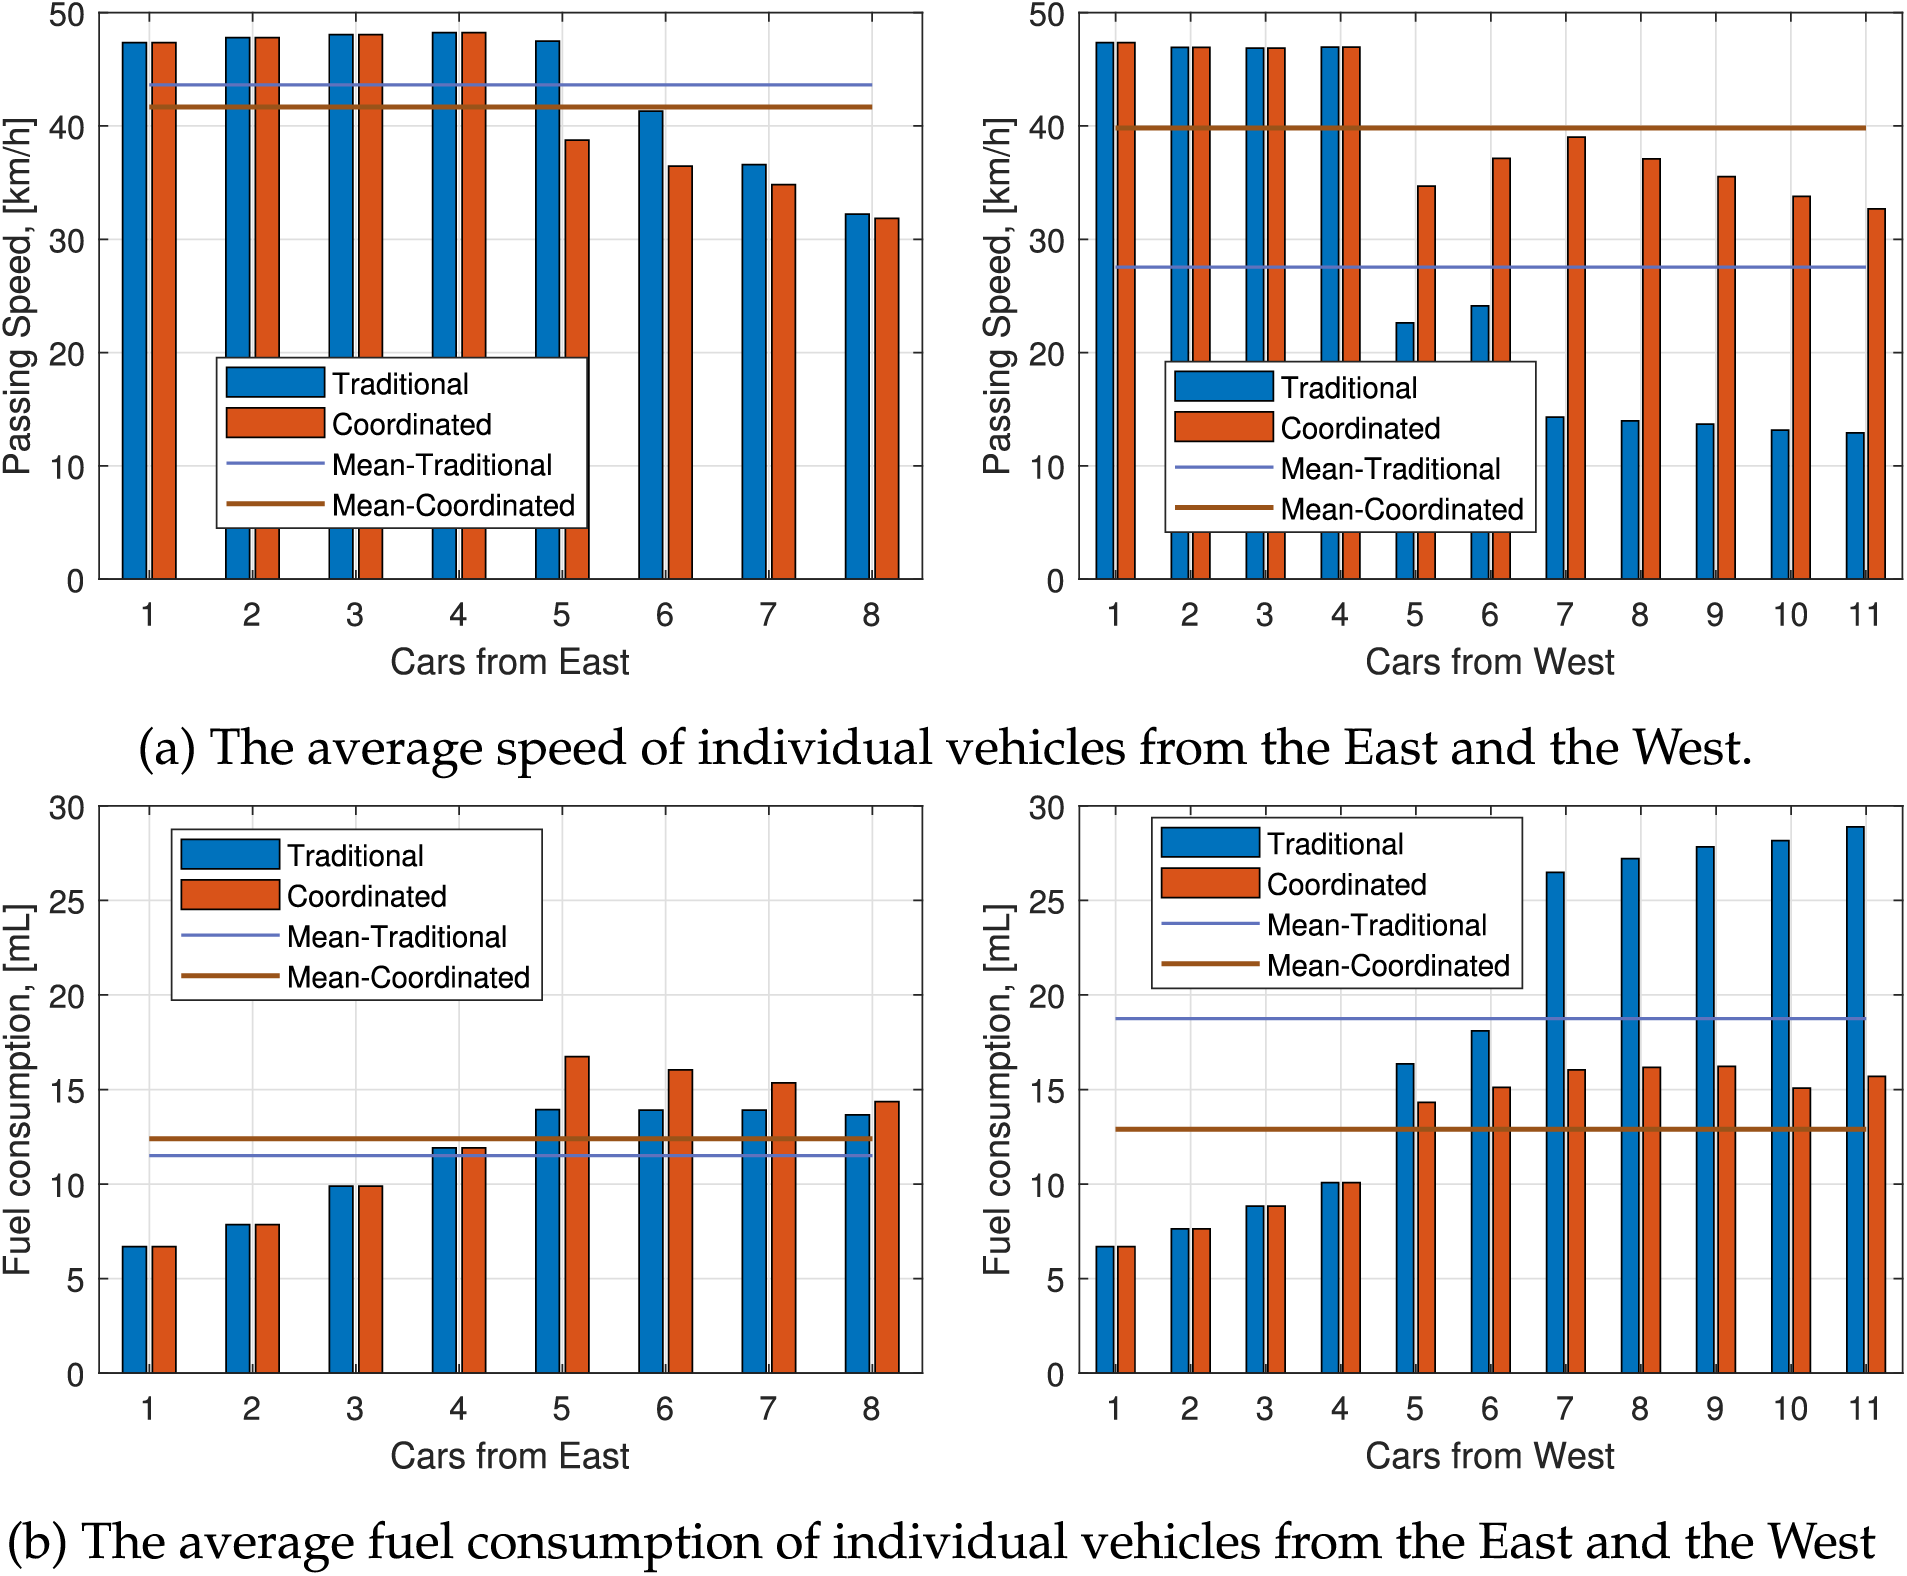
Figure 8: Comparison of average speed and fuel consumption of individual vehicles under traditional and coordinated systems. The dashed lines show the respective averages of all vehicles
Fig. 8b shows the corresponding fuel consumption of the vehicles and the average values for each side under both schemes. The fuel consumption of the 5th and its followers from the East under the coordinated scheme tends to increase compared to the traditional case because they adjust their acceleration to allow more space for the right turn, which increases fuel consumption, albeit only slightly. However, the fuel consumption of the vehicles in the West (Fig. 8 right side) is significantly reduced compared to the East vehicles. The total fuel consumption of the vehicles in both lanes affected by the right-turning vehicles was 228.5 mL for the traditional driving system and 171.1 mL for the proposed coordinated driving system, resulting in a 25.12% reduction in overall fuel consumption.
Fig. 8 shows the velocity and fuel consumption of the first four vehicles from the West, and four from the East are unchanged in both cases, as they are not affected by the right turning of the 5th vehicle. Therefore, the overall performance is investigated as it varies depending on the position of the turning vehicle from the West. Fig. 9 shows the average traffic velocity and fuel consumption of all vehicles from both sides using markers under the schemes for the position of the turning vehicle in the queue. When it is in the 1st position, the impact is very high, whereas when the turning vehicle is after the 9th position, the impact is low or negligible. Considering equally likely positions from 1 to 11 for the turning vehicle in the same case, the expected performances are shown using solid lines. This reflects the long-term performance of a vehicle when it makes a right turn per cycle. In this case, the expected fuel consumption per vehicle is 12.29 mL under the coordinated system, a significantly lower value than the traditional system, which consumes 15.10 mL, resulting in an 18.56% reduction by the proposed scheme. Furthermore, the expected speed increases to 41.75 km/h under the proposed coordination scheme, which is significantly higher than the traditional one, yielding 35.82 km/h, resulting in a 16.55% speed improvement.
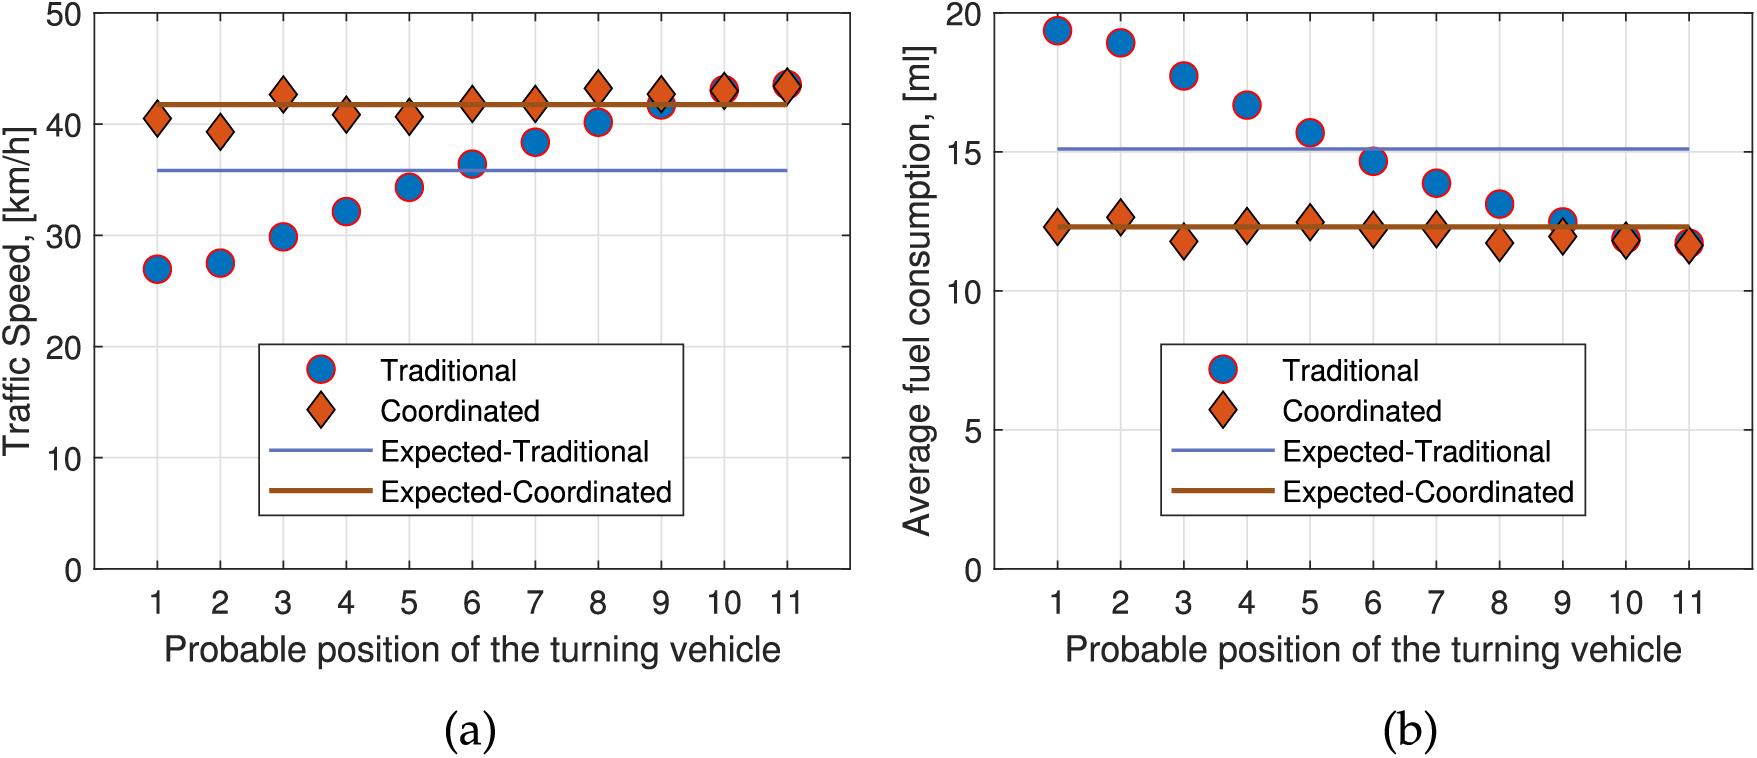
Figure 9: The position of the turning vehicle in a queue of size 11 from the West, and the corresponding all vehicle performances: (a) Speed, and (b) Fuel consumption. Corresponding expected values are shown using solid lines
Finally, the performance of vehicles under various traffic flow conditions (moderate to high volume, without exceeding capacity) from both sides with asymmetric flows is investigated. In this case, the probabilistic position of a turning vehicle, along with its corresponding expected velocity and fuel consumption, is considered. Fig. 10 compares the average velocity for different West traffic volumes while keeping a fixed East traffic volume at 315 and 405 veh/h, respectively. In each, fixing the traffic volume on one side and varying it on the other side is an easy way to better understand the influences of traffic demand from each side. As the traffic flow volume increases, the traditional scheme shows a worsening trend, whereas the proposed scheme shows a similar velocity profile. Even for the highly asymmetric flow cases, e.g., 315 veh/h from the East with 540 veh/h from the West, a similar pattern is observed. Overall, as shown by the solid line, the performance improvement varies from approximately 8% to 15% for low to high traffic volumes.
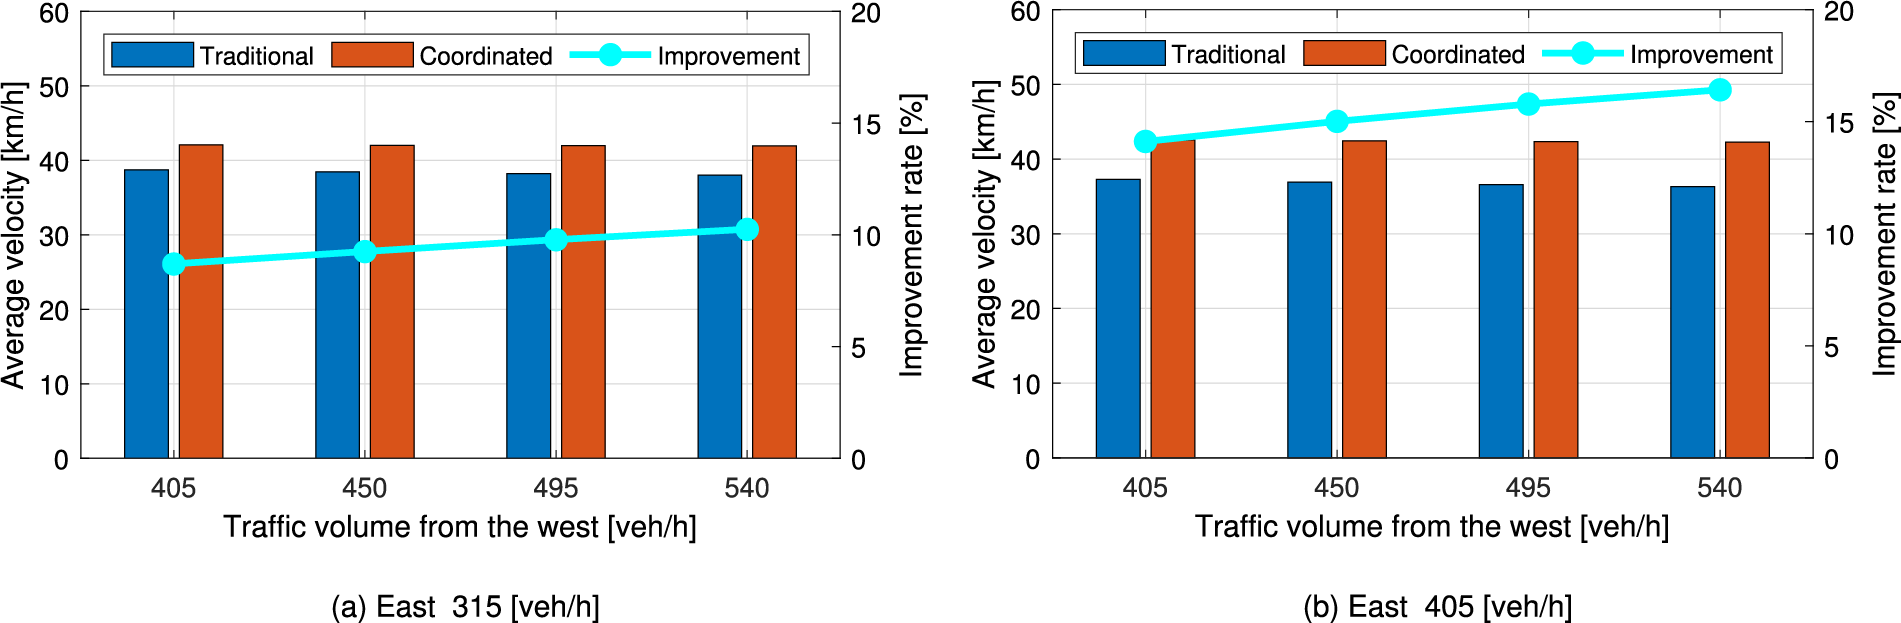
Figure 10: Comparison of average velocity with asymmetric traffic flow variations from the West and the East, with improvements given by solid lines
Fig. 11 shows similar trends for fuel consumption improvement. Although the difference in average fuel consumption is low at low traffic volumes between the traditional and coordinated traffic, it becomes significant at higher traffic volumes. Specifically, higher traffic from the East increases the likelihood of blocking many vehicles from the West, thereby worsening the fuel consumption performance. In such a high East traffic scenario, coordination improves fuel consumption by 9%–12%.
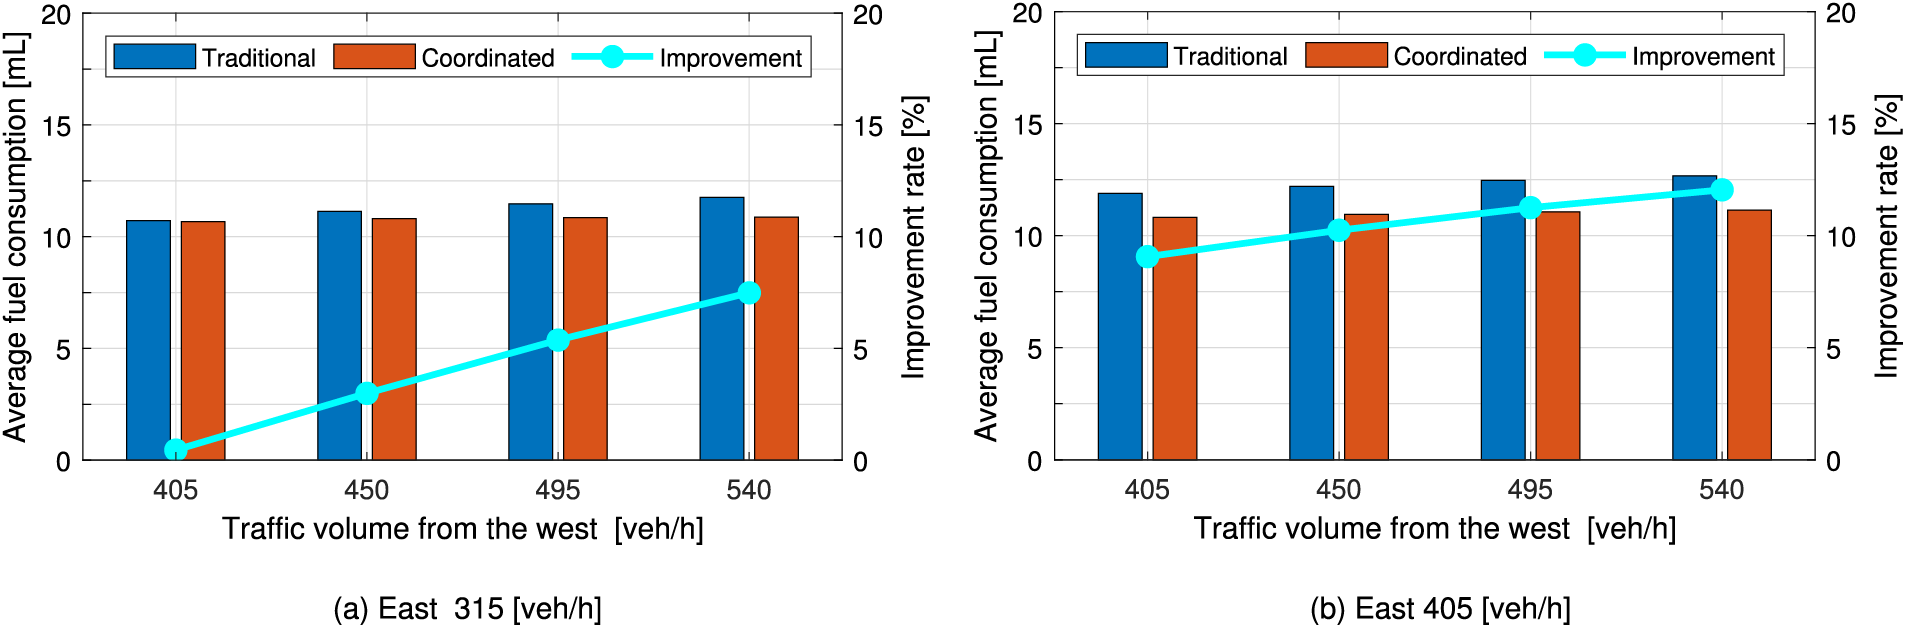
Figure 11: Comparison of average fuel consumption with asymmetric traffic flow variations from the West and the East, with improvements given by solid lines
The computation time of any optimization scheme is crucial. In a brute-force approach, all possible distinct candidate solutions are evaluated to determine the best one without repetitions. However, since the number of constraints depends on the relative positions of the turning vehicles, the computation time primarily depends on the number of affected vehicles, i.e., those that arrive at the same time or later. For the core optimization, which requires the estimated arrival times of all cars, the computation takes only about 4 to 8 ms for the problems considered in this study. In practical applications, vehicles transmit their estimated arrival times directly to the Intersection Control Unit (ICU). Considering a latency of about 50 to 300 ms (based on our Local 5G V2X communication experiments) and an optimization computation time of less than 10 ms, the entire decision-making process can be completed within 500 ms, and feedback to the vehicles can be completed within one second.
Another notable advantage of the proposed scheme is that it requires coordination only once per cycle. After this initial coordination, the vehicles operate independently using their local controllers to ensure safety. Each vehicle is controlled in a distributed manner, allowing for safe operation. Since coordination occurs only once, in unavoidable situations, such as lane blockages, pedestrian crossings, or the need to prioritize emergency vehicles, the system defaults to uncoordinated local driving regulations.
Finally, the limitations of this work should be acknowledged, as we primarily focus on developing an optimal coordination mechanism under ideal traffic and communication conditions, i.e., with minimal driving uncertainty and no communication delay or packet losses. For a human-driven vehicle with connectivity, it may be possible to provide a speed advisory to adjust the arrival at the intersection. Still, such a system may provide better performance than an uncoordinated system, as the vehicle may slow down early instead of going fast and idling. Therefore, such a study is left for future work in this paper.
In this paper, we have developed an optimal driving coordination system for CAVs to mitigate traffic congestion resulting from right-turning vehicles on single-lane intersections. Operating within a connected vehicle framework, the system enables the real-time exchange of critical information with an ICU that uses this data to recommend optimal crossing or turning times directly to vehicles. The proposed vehicle coordination system is evaluated at a typical urban intersection, and the performance of vehicles is compared to that of traditional, priority-based, uncoordinated traffic systems. Microscopic traffic simulation results show that the proposed coordination system significantly improves the average traffic speed and fuel consumption compared to the traditional traffic system in various scenarios. Specifically, by precisely optimizing right-turn timing to minimize a quadratic objective function, the ICU effectively reduces waiting times for right-turning vehicles, resulting in lower overall traffic delays and improved fuel efficiency. Further analysis of vehicle positioning under various conditions and expected outcomes supports these benefits.
Future work will focus on refining the optimization algorithms by addressing communication challenges, such as latency, missing data, and partial connectivity. Additionally, integrating various traffic factors can enhance the applicability of the proposed scheme in different urban environments and driving scenarios, particularly in managing multiple turning vehicles approaching from both directions and their priority. Moreover, Artificial Intelligence-based algorithms can be an interesting future work to handle more complex scenarios that are difficult to model as an optimization problem.
Acknowledgement: The authors would like to thank the Center for Research on Adoption of NextGen Transportation Systems, Mabashi, Gunma, for their support.
Funding Statement: This research is supported by the Japan Society for the Promotion of Science (JSPS) Grants-in-Aid for Scientific Research (C) 23K03898.
Author Contributions: The authors confirm their contribution to the paper as follows: Conceptualization, Mahmudul Hasan, Shuji Doman, and Md Abdus Samad Kamal; methodology, Mahmudul Hasan and Md Abdus Samad Kamal; software, Shuji Doman; formal analysis, Mahmudul Hasan, A. S. M. Bakibillah; data curation, Shuji Doman and Mahmudul Hasan; writing—original draft preparation, Mahmudul Hasan and Shuji Doman; writing—review and editing, A. S. M. Bakibillah, Md Abdus Samad Kamal, and Kou Yamada; supervision, A. S. M. Bakibillah, Md Abdus Samad Kamal, and Kou Yamada; project administration, Md Abdus Samad Kamal and Kou Yamada; funding acquisition, Md Abdus Samad Kamal. All authors reviewed the results and approved the final version of the manuscript.
Availability of Data and Materials: Not applicable.
Ethics Approval: Not applicable.
Conflicts of Interest: The authors declare no conflicts of interest to report regarding the present study.
References
1. Rahman MM, Najaf P, Fields MG, Thill JC. Traffic congestion and its urban scale factors: empirical evidence from American urban areas. Int J Sustainable Transp. 2022;16(5):406–21. doi:10.1080/15568318.2021.1885085. [Google Scholar] [CrossRef]
2. Guo Y, Liu P, Wu Y, Chen J. Evaluating how right-turn treatments affect right-turn-on-red conflicts at signalized intersections. J Transp Saf Secur. 2020;12(3):419–40. doi:10.1080/19439962.2018.1490368. [Google Scholar] [CrossRef]
3. Jayson T, Bakibillah ASM, Tan CP, Kamal MAS, Monn V, Imura J. Electric vehicle eco-driving strategy at signalized intersections based on optimal energy consumption. J Environ Manage. 2024;368:122245. doi:10.1016/j.jenvman.2024.122245. [Google Scholar] [PubMed] [CrossRef]
4. Garcia MHC, Molina-Galan A, Boban M, Gozalvez J, Coll-Perales B, Şahin T, et al. A tutorial on 5G NR V2X communications. IEEE Commun Surv Tutor. 2021;23(3):1972–2026. [Google Scholar]
5. Kamal MAS, Tan CP, Hayakawa T, Azuma SI, Imura JI. Control of vehicular traffic at an intersection using a cyber-physical multiagent framework. IEEE Trans Ind Inform. 2021;17(9):6230–40. doi:10.1109/tii.2021.3051961. [Google Scholar] [CrossRef]
6. Mahbub AI, Malikopoulos AA, Zhao L. Decentralized optimal coordination of connected and automated vehicles for multiple traffic scenarios. Automatica. 2020;117:108958. doi:10.1016/j.automatica.2020.108958. [Google Scholar] [CrossRef]
7. Miculescu D, Karaman S. Polling-systems-based autonomous vehicle coordination in traffic intersections with no traffic signals. IEEE Trans Automatic Control. 2019;65(2):680–94. doi:10.1109/tac.2019.2921659. [Google Scholar] [CrossRef]
8. Li J, Peng L, Hou K, Tian Y, Ma Y, Xu S, et al. Adaptive signal control and coordination for urban traffic control in a connected vehicle environment: a review. Digital Transp Saf. 2023;2(2):89–111. [Google Scholar]
9. Namazi H, Taghavipour A. Traffic flow and emissions improvement via vehicle-to-vehicle and vehicle-to-infrastructure communication for an intelligent intersection. Asian J Control. 2021;23(5):2328–42. doi:10.1002/asjc.2508. [Google Scholar] [CrossRef]
10. Galvão G, Vieira M, Vieira M, Vestias M, Vieira P, Louro P. Optimizing urban intersection management: a visible light communication approach for cooperative trajectories and traffic signals. In: Real-time processing of image, depth, and video information 2024. Bellingham, WA, USA: SPIE; 2024. Vol. 13000, p. 63–80. doi:10.1117/12.3016816. [Google Scholar] [CrossRef]
11. Sun G, Zhang Y, Yu H, Du X, Guizani M. Intersection fog-based distributed routing for V2V communication in urban vehicular ad hoc networks. IEEE Trans Intell Transp Syst. 2019;21(6):2409–26. doi:10.1109/tits.2019.2918255. [Google Scholar] [CrossRef]
12. Wang T, Zhao J, Li P. An extended car-following model at un-signalized intersections under V2V communication environment. PLoS One. 2018;13(2):e0192787. doi:10.1371/journal.pone.0192787. [Google Scholar] [PubMed] [CrossRef]
13. Farkas Z, Mihály A, Gáspár P. Analysis of model predictive intersection control for autonomous vehicles. Periodica Polytechnica Transp Eng. 2023;51(3):209–15. doi:10.3311/pptr.22082. [Google Scholar] [CrossRef]
14. Xu B, Ban XJ, Bian Y, Li W, Wang J, Li SE, et al. Cooperative method of traffic signal optimization and speed control of connected vehicles at isolated intersections. IEEE Trans Intell Transp Syst. 2018;20(4):1390–403. doi:10.1109/tits.2018.2849029. [Google Scholar] [CrossRef]
15. Yang B, Obana T, Wang Z, Kaizuka T, Sugimachi T, Sakurai T, et al. Evaluations of different human machine interfaces for presenting right-turn timing at intersections. Int J Intell Transp Syst Res. 2021;19:71–82. doi:10.1007/s13177-020-00223-4. [Google Scholar] [CrossRef]
16. Sun C, Leng J, Lu B. Interactive left-turning of autonomous vehicles at uncontrolled intersections. IEEE Trans Autom Sci Eng. 2022;21(1):204–14. doi:10.1109/tase.2022.3227964. [Google Scholar] [CrossRef]
17. Mahler G, Vahidi A. An optimal velocity-planning scheme for vehicle energy efficiency through probabilistic prediction of traffic-signal timing. IEEE Trans Intell Transp Syst. 2014;15(6):2516–23. doi:10.1109/tits.2014.2319306. [Google Scholar] [CrossRef]
18. Bento LC, Parafita R, Rakha HA, Nunes UJ. A study of the environmental impacts of intelligent automated vehicle control at intersections via V2V and V2I communications. J Intell Transp Syst. 2019;23(1):41–59. doi:10.1080/15472450.2018.1501272. [Google Scholar] [CrossRef]
19. Committee ORADO. Taxonomy and definitions for terms related to driving automation systems for on-road motor vehicles. Warrendale, PA, USA: SAE International; 2021. J3016_202104. [Google Scholar]
20. Treiber M, Hennecke A, Helbing D. Congested traffic states in empirical observations and microscopic simulations. Phys Rev E. 2000;62(2):1805. doi:10.1103/physreve.62.1805. [Google Scholar] [PubMed] [CrossRef]
21. Kamal MAS, Mukai M, Murata J, Kawabe T. Ecological driving based on preceding vehicle prediction using MPC. IFAC Proc Volumes. 2011;44(1):3843–8. doi:10.3182/20110828-6-it-1002.02748. [Google Scholar] [CrossRef]
22. Kamal MAS, Mukai M, Murata J, Kawabe T. Ecological vehicle control on roads with up-down slopes. IEEE Trans Intell Transp Syst. 2011;12(3):783–94. doi:10.1109/tits.2011.2112648. [Google Scholar] [CrossRef]
Cite This Article
 Copyright © 2026 The Author(s). Published by Tech Science Press.
This work is licensed under a Creative Commons Attribution 4.0 International License , which permits unrestricted use, distribution, and reproduction in any medium, provided the original work is properly cited.
 Downloads
 Citation Tools