
 Submit a Paper
 Propose a Special lssue
 Open Access
ARTICLE

Log-Based Anomaly Detection of System Logs Using Graph Neural Network
Department of Computer Science, Faculty of Computing and Information Technology, King Abdulaziz University, Jeddah, 21589, Saudi Arabia
* Corresponding Author: Abeer Alhuzali. Email:
(This article belongs to the Special Issue: Advances in Deep Learning and Neural Networks: Architectures, Applications, and Challenges)
Computers, Materials & Continua 2026, 86(2), 1-20. https://doi.org/10.32604/cmc.2025.071012
Received 29 July 2025; Accepted 29 September 2025; Issue published 09 December 2025
 View Full Text
 Download PDF
Abstract
Log anomaly detection is essential for maintaining the reliability and security of large-scale networked systems. Most traditional techniques rely on log parsing in the reprocessing stage and utilize handcrafted features that limit their adaptability across various systems. In this study, we propose a hybrid model, BertGCN, that integrates BERT-based contextual embedding with Graph Convolutional Networks (GCNs) to identify anomalies in raw system logs, thereby eliminating the need for log parsing. The BERT module captures semantic representations of log messages, while the GCN models the structural relationships among log entries through a text-based graph. This combination enables BertGCN to capture both the contextual and semantic characteristics of log data. BertGCN showed excellent performance on the HDFS and BGL datasets, demonstrating its effectiveness and resilience in detecting anomalies. Compared to multiple baselines, our proposed BertGCN showed improved precision, recall, and F1 scores.Keywords
Recent decades have witnessed the rapid growth of modern computer network systems, which can deliver a diverse range of services. This evolution has necessitated the scaling of data centers, networks, and connected devices to meet the increasing demand [1]. As these systems grow in complexity and scale, maintaining continuous operational efficiency is crucial, particularly in the context of large-scale, distributed systems designed to accommodate the needs of millions of users concurrently.
As a result, new challenges to security and reliability have emerged, including identifying system faults, predicting potential failures, and proactively mitigating security risks. In this context, anomaly detection, the process that aims to identify abnormalities in log data, has become a vital component of modern security practices and Artificial Intelligence for IT Operations (AIOps) [2]. The primary role of anomaly detection is to support the early identification of abnormal behavior that may signal failures or cyber threats, thereby safeguarding the operational integrity of large-scale digital infrastructures. Anomalies, such as system failures or network intrusions, are often hidden within the massive volumes of event logs generated by networked computing systems. Detecting such irregularities effectively enables organizations to respond to incidents promptly and minimize disruptions to their services. These systems often generate a massive number of log lines, up to millions daily; approximately 30–50 gigabytes of tracing logs are generated every hour [3]. For example, Google systems generate billions of log entries daily, amounting to petabytes of data per month. These data are analyzed to monitor performance, detect anomalies, and optimize services.
Log-based Anomaly Detection (LAD) involves identifying abnormalities within execution logs that capture both the normal and abnormal activities of a system [4]. Therefore, as the scale and complexity of systems increase, detecting log anomalies using traditional manual methods becomes increasingly challenging. Such methods depend on explicit keyword searches (e.g., “error”, “exception,” or “fail”) or operate via regular expression matching [5], a time-consuming and error-prone process that is not scalable for handling massive, unstructured log data streams. Therefore, implementing automated techniques for detecting anomalies in log data holds significant importance. Consequently, many studies have employed statistical and machine learning (ML) algorithms to automate this process. These algorithms include Support Vector Machine (SVM), Principal Component Analysis (PCA), and Logistic Regression (LR). These techniques rely on quantitative log event counts as inputs, which are then projected onto vector spaces using ML techniques. Anomalies are identified by detecting vectors that significantly deviate from the norm—a method referred to as the quantitative-based approach. However, several obstacles remain, including insufficient interpretability, limited adaptability, and the reliance on handcrafted features.
In contrast, due to its remarkable ability to model complex relationships, Deep Learning (DL) has achieved high accuracy in detecting log anomalies [6–8]. These approaches typically take a sequence of log events as input and employ models such as LSTM, CNN, or Transformer architectures to detect anomalies by identifying violations in sequential patterns—a method referred to as the sequence-based approach. Despite their success, sequence-based methods often fail to capture comprehensive structural relationships among log events, thereby missing more informative insights. Graph-based methods constitute a distinct research direction in log anomaly detection [5,9]. These methods typically convert logs into graphs that capture the semantic, contextual, and structural information of log events, thereby improving both the performance and interpretability of anomaly detection—particularly in scenarios where understanding contextual dependencies and complex event interactions is essential.
Row log messages are unstructured by nature and comprise various text formats. As a result, identifying multiple anomalies through unstructured logs presents a challenging task. To address this issue, many researchers have employed log parsing as a first step in anomaly detection, which involves extracting structured information from unstructured log data to construct a set of event templates that make them machine-readable. While log parsing facilitates the structured representation of logs for downstream anomaly detection tasks, it introduces several limitations. Parsers are highly sensitive to changes in log format, lack generalizability, and often result in the loss of important semantic information. Additionally, maintaining parsers is labor-intensive, and parsing errors can propagate through the detection pipeline, reducing accuracy. These challenges highlight the need for more robust, parsing-free approaches that can directly handle raw, unstructured log data.
The following points summarize the limitations of current approaches to log anomaly detection and the contributions of this study.
1. Current sequence-based techniques are limited in their ability to capture the structural relationships among log events. This can lead to false alarms and unstable detection performance. This issue is addressed by incorporating a Graph Convolutional Network (GCN) framework that explicitly models the dependencies between log events, thereby enabling more accurate and robust anomaly detection.
2. Conventional log parsers often produce a significant amount of extraneous data during the identification of log anomalies, leading to ambiguous parsing outcomes. Furthermore, these log parsers generate a large number of out-of-vocabulary (OOV) tokens that negatively impact the performance of the anomaly detection process. This issue is addressed by utilizing the token-level embeddings generated by pre-trained language models, as this can effectively capture semantic meaning and reduce the sensitivity of the system to OOV tokens.
3. Most existing methods fail to capture the semantic correlations between log messages, which are critical for understanding contextual dependencies and accurately identifying subtle or context-dependent anomalies. In this research, we address this limitation by leveraging contextual embeddings from pre-trained language models to model the semantic relationships between log events, enhancing the model’s ability to detect nuanced anomalies across diverse log patterns.
Therefore, to address the above challenges, we propose a log-based anomaly detection framework that integrates Transformer-based models with Graph Convolutional Networks (GCNs). In contrast to the traditional approaches, our approach eliminates the need for log parsing by directly processing raw log messages, thereby avoiding the noise and ambiguity introduced during the parsing process. The module leverages a pre-trained Transformer model to generate contextualized embeddings that capture the deep semantic meanings of log messages. These embeddings are then used to construct a graph structure, where the relationships between log events are modeled using a GCN. This enables the framework to capture both semantic and structural dependencies among log messages. Finally, a computationally efficient unsupervised clustering algorithm is employed to detect anomalies based on the learned graph-enhanced feature representations of log sequences.
The remainder of this paper is organized as follows. Section 2 provides background information about the problem. Section 3 reviews existing work on log-based anomaly detection, including sequence-based and graph-based approaches. Section 4 presents the proposed framework, detailing the integration of Transformer-based embeddings with Graph Convolutional Networks (GCNs) for capturing semantic and structural relationships among log events. Sections 5 and 6 describe the experimental setup, evaluation metrics, implementation details, report the results, and compare the model’s performance against baseline methods. Finally, Section 7 concludes the paper and outlines several directions for future research.
Before diving into the log anomaly detection process, it is necessary to establish notation and definitions related to event logs and graphs.
Event logs are crucial components in the monitoring of system status. The logs are designed to capture significant occurrences, which are centrally aggregated and preserved as log files [10]. Log files are computer-generated files that contain a collection of messages. They contain a wealth of information, storing chronological records of various events, activities, or operations within computer systems or applications in response to external stimuli. Each log entry represents a specific event or occurrence that is being recorded, such as a user log-in, a system error, or an established network connection.
A log event is an incident or activity that generates one or more messages. In other words, multiple log messages may be associated with a single event, capturing different aspects or details of the event. Log parsers are used to extract log events from log messages. A log message represents the recorded observation of a real-world occurrence or action that is captured in the log file. Fig. 1 presents the relationship between the log file, messages, and events. A group of log events indicates the dynamic workflows of the underlying program/system logic, whereas a single log event explains (a part of) the system state at a specific time. Logs are generally unstructured free-text messages with different types and formats.
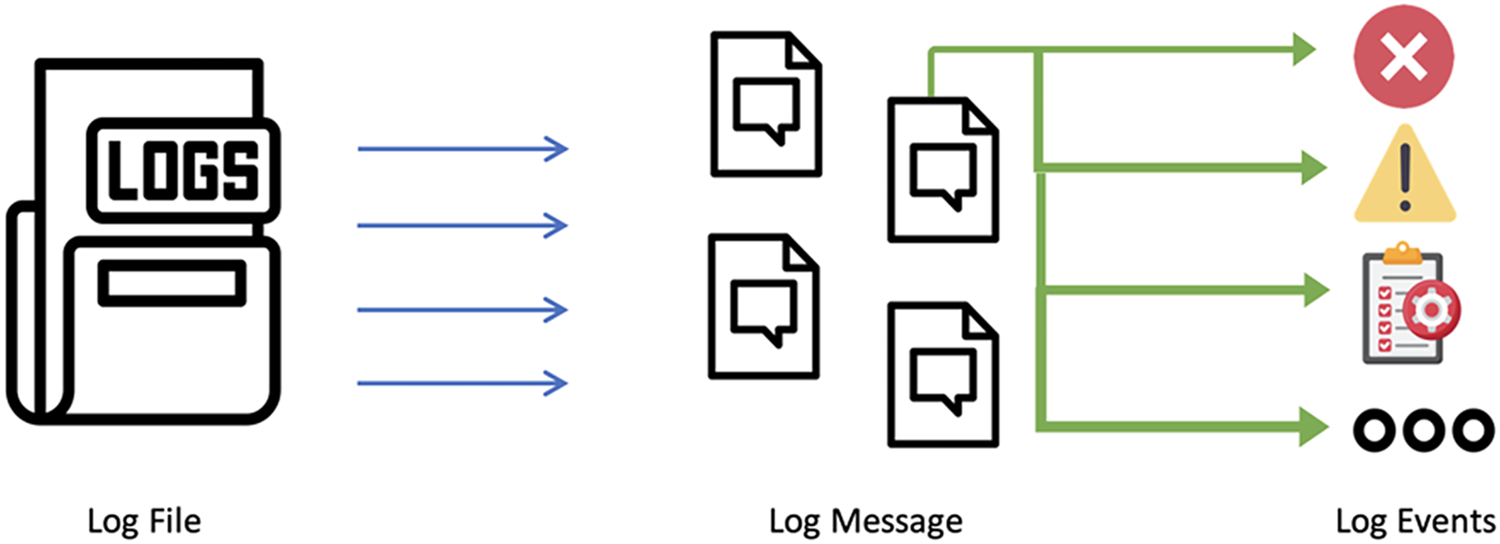
Figure 1: Illustration of the relationship between log files, log messages, and log events
Groups of log events represent the dynamic workflow of the underlying program logic, whereas a single log event reflects a snapshot of the system state at a specific point in time. Logs are typically unstructured, free-text messages that vary in type and format across various systems. Although there is no universally unified log structure, log messages are commonly divided into two main components: the header and the message body. The header contains fields such as timestamps (which indicate the chronological order of messages), process IDs (PIDs), which identify the process that generated the message, and additional metadata, including line numbers, logging levels (e.g., INFO, ERROR), and security indicators. The message body, in contrast, includes both constant tokens—such as “received block”, “size of”, and “from”—and dynamic tokens that represent variable or context-specific values. Fig. 2 illustrates the core structure of a typical log message.
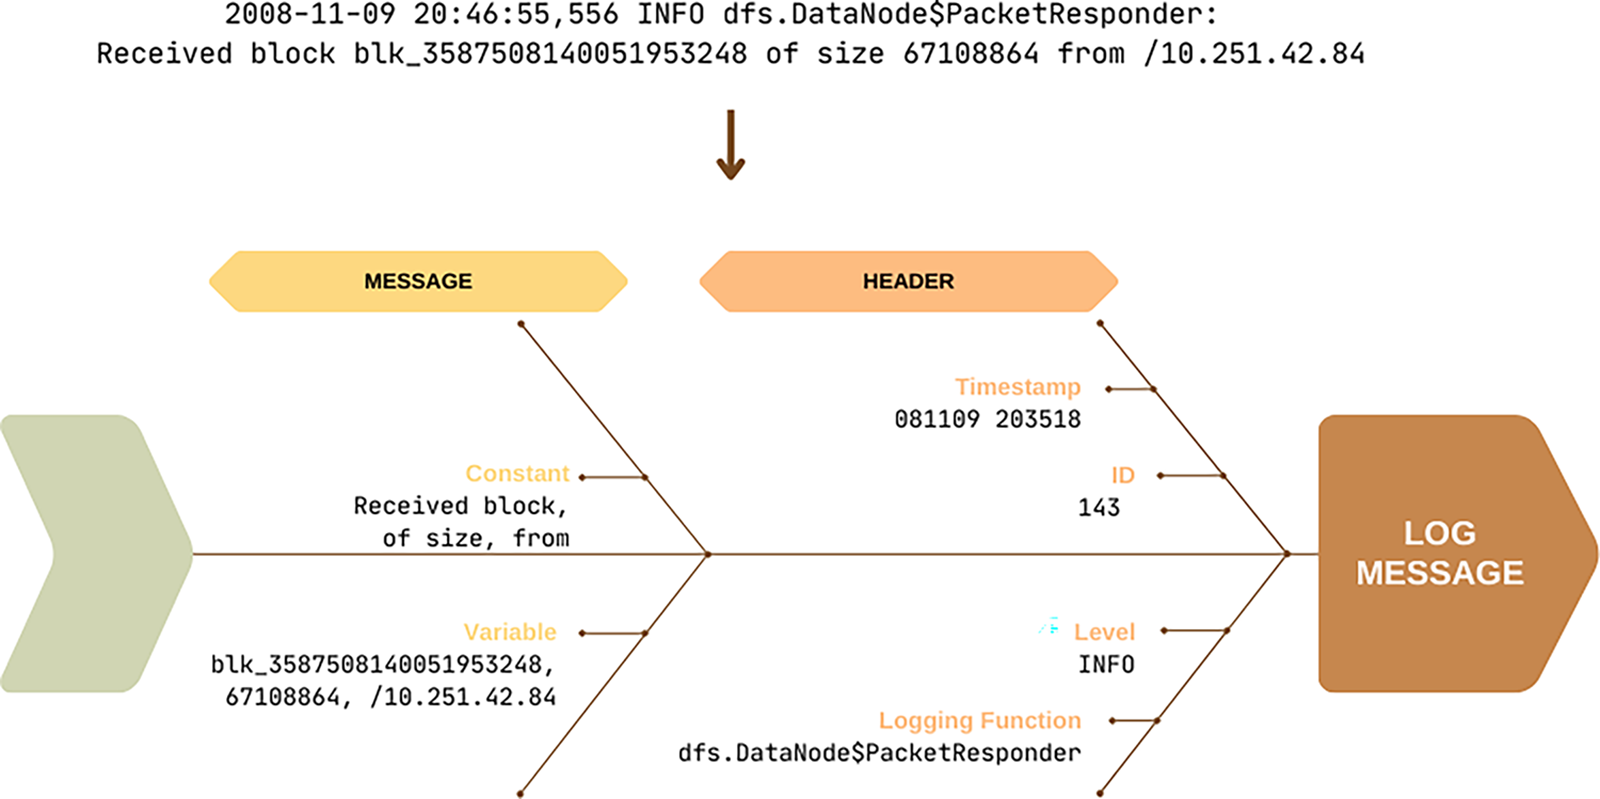
Figure 2: Structure of a log message showing the header and message components
2.2 Common Log Anomaly Detection Framework
The general framework used in log-based anomaly detection typically consists of four main stages: log parsing, log grouping, feature extraction, and anomaly detection.
In this standard pipeline, systems generate logs to record their internal states and operational processes. These logs are then preprocessed for various downstream tasks, such as anomaly detection [11]. Log parsing serves as the initial step, aiming to extract structured log templates from raw log data (Section 4.2). These templates are subsequently encoded into feature vectors, which can be used as input to machine learning models for anomaly detection.
The primary purpose of the log parsing process is to handle unstructured log data and convert it into a structured format. This operation relies on removing variable parts (parameters) and retaining constant tokens (keywords). For example, Fig. 3 shows an example of a raw log message alongside its parsed version.
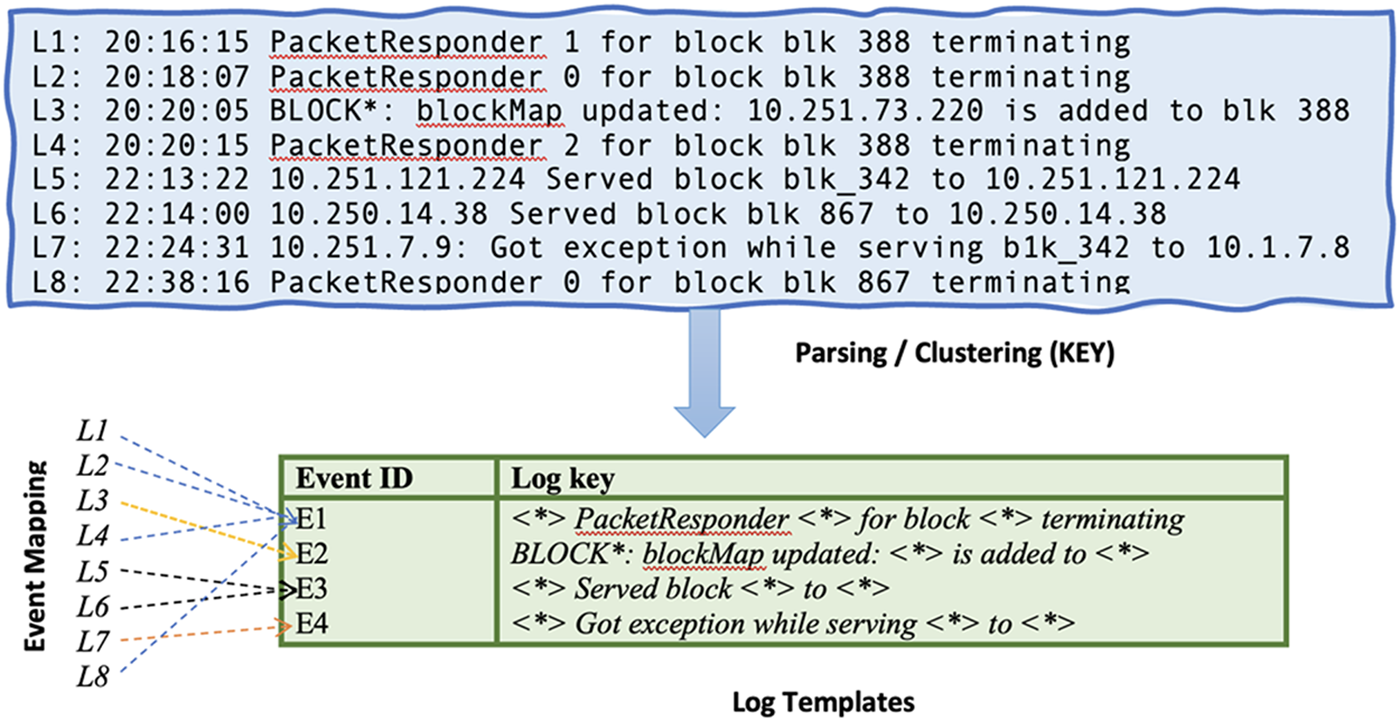
Figure 3: An illustration of the log parsing process, where raw log messages are transformed into structured log templates through parsing and clustering
As systems evolve, log statements may be modified or updated during development and maintenance, and the corresponding log files are continually populated with new messages. As a result, many previously unseen words—i.e., out-of-vocabulary (OOV) tokens—frequently appear. These OOV tokens introduce parsing errors that can negatively affect the accuracy of anomaly detection [12].
Log grouping, also known as session or window identification, organizes parsed logs into meaningful units based on temporal or contextual boundaries. This step is crucial for preserving the semantic relationships among log events, which often occur in sequences. Grouping strategies typically follow one of two approaches: sliding windows or session-based windows. Sliding window techniques divide the log stream into overlapping or non-overlapping time-based or count-based windows. Session-based grouping relies on identifiers such as session IDs, thread IDs, or request IDs to associate log entries that belong to the same transaction or execution context. Effective grouping ensures that downstream models can learn patterns from sequences of related events rather than isolated log lines, which may lack sufficient context for accurate anomaly detection [13].
Feature extraction transforms grouped logs into numerical representations that can be fed into machine learning or deep learning models. The most common approaches use Template-based encoding, Frequency-based encoding, or Semantic embedding. Template-based encoding maps the log templates to discrete IDs or counts, creating sequences or vectors for each group. Frequency-based encoding uses term frequency (TF), term frequency-inverse document frequency (TF-IDF), or n-gram statistics to capture the distributions of tokens within log groups. Semantic embedding, in contrast, converts log messages into dense vectors using techniques such as Word2Vec, Doc2Vec, or transformer-based models to capture contextual semantics. The choice of feature representation significantly influences the performance of anomaly detection models, as it determines how well the temporal and semantic relationships in the logs are captured [6,14].
In the final stage, anomaly detection models analyze the extracted features to identify deviations from normal system behavior. These models can generally be categorized into three main types: unsupervised, supervised, and semi-supervised approaches. Unsupervised methods assume most data is normal and detect anomalies as deviations using clustering, PCA, isolation forests, or autoencoders. Supervised methods train classifiers, such as Support Vector Machines (SVMs), Random Forests, or deep neural networks, using labeled anomaly data. Semi-supervised methods train models solely on normal data and identify anomalies as instances that diverge significantly from the learned normal patterns. Advanced models, such as LSTMs and graph neural networks (GNNs), have demonstrated strong performance in capturing sequential or structural dependencies in log data. The outputs from anomaly detection are often further processed to rank or explain the anomalies, aiding human operators in root-cause analysis and response [6,8].
In recent years, studies have been conducted concerning how to detect anomalies in log files. This field has encouraged the research community to develop models for effectively detecting anomalies, therefore improving security and providing reliable service. The most recent studies in log anomaly detection can be categorized into three types: sequence-based, quantitative-based, and graph-based methods. The following summarizes key research studies in each category.
3.1 Sequence-Based Log Anomaly Detection
Several works are proposed that focus on utilizing deep learning for sequential pattern analysis in log files [15]. Du et al. [14] proposed Deeplog, a model utilizing a neural network for log anomaly detection. This model employs an LSTM model to analyze system logs by forecasting a log event based on the previous event to learn the normal execution of the system. Analyzing incoming log events for anomalies is done by determining if they violate the LSTM model’s prediction results. However, DeepLog’s analysis does not account for the semantic information contained in logs. To overcome the limitation of using indexes that tend to generate false positives, Meng et al. [16] proposed LogAnomaly, which uses log count vectors as inputs for LSTM model training. The log template is then represented as a semantic vector via template2vec.
Zhang et al. [6] established the LogRobust which integrates pre-trained fastText with TF-IDF weights to capture the semantics between log messages. The inferred semantics are used to learn log template representation vectors. Then, the model feeds these vectors into an attention-based Bi-LSTM model to identify the anomalies. While their approach captures the semantics of log messages, for extensive log data, the training speed is slow due to the intensive calculations required. The work by Brown et al. [17] proposed anomaly detection using an attention-based recurrent neural network (RNN). Their approach, however, does examine the contextual relationship in the log sequence. Guo et al. [18] proposed LogBERT, a framework to detect anomalies based on Bidirectional Encoder Representations from Transformers (BERT). Similar to Deeplog, LogBERT predicts a log template and successfully captures the context embedding information of each log message. The log entries are converted into a format suitable for BERT’s advanced contextual learning abilities. This study outlines the specific adjustments made to the conventional BERT architecture to adapt it for effective handling of the sparse nature and unique semantic characteristics of log messages.
Nedelkoski et al. [19] proposed Logsy, a technique based on the Transformer encoder with self-attention. The model employs a tokenizer for preprocessing log information. This eliminates the need for a log parser during anomaly identification. In addition, the learned log representations can differentiate between normal and anomalous data from auxiliary log datasets. Le & Zhang’s paper addresses the problem of log parsing and the semantic meaning between log messages. They developed NeuralLog [8], an anomaly detection tool that does not require log parsing. NeuralLog represents row log messages as a semantic vector through the BERT Encoder. These vectors are then used as input to a Transformer-based classification model to detect anomalies. Wittkopp et al. [20] proposed A2log, an approach designed to mitigate the limitation of existing unsupervised methods that rely on the presence of anomalous instances to define a decision boundary for identification. This requirement causes practical constraints. Therefore, the authors used a self-attention neural network in their unsupervised anomaly detection method that comprises two stages: anomaly scoring and anomaly decision Li et al. [21] developed MDFULog, a BERT-based approach for extracting semantic features from log messages, capturing their contextual meaning, and converting them into structured log vectors. Additionally, an informer-based anomaly detection model was introduced to capture global patterns in the data.
3.2 Quantitative-Based Log Anomaly Detection
Quantitative-based methods rely on a matrix to count log events for anomaly detection. Therefore, these approaches do not include the necessary semantic and sequential information between log events during anomaly detection.
Principal Component Analysis (PCA) [22] is an example of the quantitative approach. PCA constructs a matrix based on the log key sequence counts. Then, the original counting matrix is transformed into a low-dimensional space for detecting anomalous sequences. Another well-known model, called One-Class SVM (OCSVM) [23], can be utilized for log anomaly detection by constructing a feature matrix based on normal log data. Li et al. [5] highlighted some drawbacks related to the quantitative and sequence-based approaches. The existing approaches cannot effectively utilize the more revealing structural relationships presented among log events, leading to the possibility of generating false alarms and exhibiting inconsistent performance, which our work aims to avoid.
3.3 Graph-Based Log Anomaly Detection
With the increasing complexity and volume of log data, traditional sequence-based models often struggle to capture the dependencies among events. To address this challenge, recent research has turned to graph-based approaches, where logs are represented as graphs and are analyzed using Graph Neural Networks (GNNs). GNNs are particularly suited for modeling structured and unstructured data by capturing interactions between log events through message passing. Variants such as Graph Convolutional Networks (GCNs), Graph Attention Networks (GATs), and Graph Recurrent Networks (GRNs) have demonstrated strong performance across a wide range of tasks, including log anomaly detection [24–26].
LogGD [27] is an early notable graph-based model that represents logs as event dependency graphs and applies GCNs to detect anomalies. This model provided foundational work by showing that capturing topological relationships among log events could improve anomaly detection performance. Similarly, HiGraph [28] extended this idea by introducing a hierarchical graph structure that captures multi-granular relationships across logs. These approaches have established graph representation as a strong alternative to sequential modeling in log analysis.
Building on these concepts, several GNN-based models have been proposed to perform graph-level anomaly detection. For instance, GLAM [29] is an unsupervised model that analyzes session-level graphs and learns to distinguish anomalous patterns based on graph structure. GLocalKD [30] introduced a knowledge distillation framework that learns both node-level and graph-level embeddings to capture normal patterns at multiple levels. OCGTL [9] combined one-class classification with neural graph representations to enhance detection in settings where only normal data are available. While these models achieve good results, they generally use undirected and unweighted graphs that may fail to fully capture the directional or sequential dependencies in logs.
To address these limitations, later models began to include enriched graph structures. GLAD-PAW [31] constructs session graphs and applies a weighted graph attention layer and global readout function to highlight salient events. Its successor, GLAD [5], introduces temporal-attentive transformers alongside GNNs to jointly capture semantic, structural, and temporal dependencies. While GLAD’s graph design—where nodes represent events and edges encode relationships—is similar to our proposed BertGCN model, it still relies on undirected graphs, and thus may limit its ability to capture the temporal order of events. A more recent advancement is Log2Graphs [32], which constructs directed and weighted graphs from raw logs and performs anomaly detection using GNNs in a fully unsupervised manner. Its directed design enables the model to preserve causal and temporal dynamics. Our proposed BertGCN model adopts a similar philosophy but introduces additional optimizations in graph representation and learning. As shown in our evaluation (Section 6), BertGCN achieves better performance on benchmark datasets such as HDFS and BGL.
We propose BertGCN, a graph-based approach for log anomaly detection. The overall pipeline consists of four steps: preprocessing, graph construction, graph representation learning, and classification (anomaly detection). As illustrated in Fig. 4.
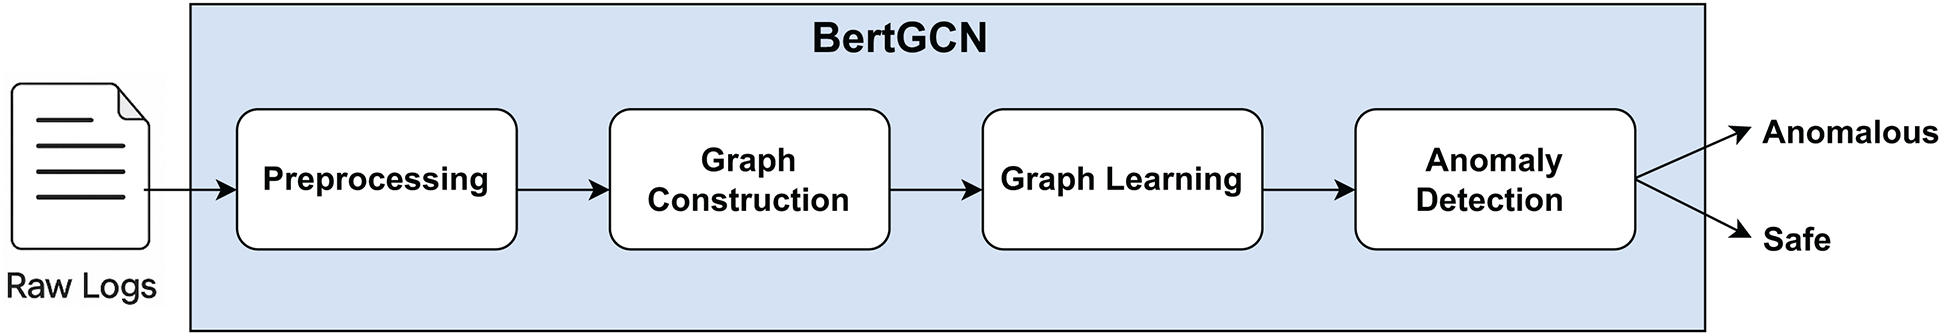
Figure 4: BertGCN framework overview
BertGCN takes raw log data as input and produces a classification output indicating whether a log sequence is anomalous or not. The method begins by converting the raw log data into a graph structure. In this graph, nodes represent log events and are enriched with semantic information, while edges capture the relationships and weights between node pairs. This graph is then processed by a Graph Neural Network (GNN) model, which learns to distinguish between normal and abnormal graph patterns during the training phase. During testing, the GNN generates a representation of the input graph, which is then classified as anomalous or benign. We base our approach on the following assumptions regarding the log files:
• The log files are written in English.
• Each log message includes, at a minimum, the following details: date, time, operation details, and a log identifier, as shown in Section 2.1.
• The logs contain sufficient events to ensure that the extracted relationships, whether quantitative, sequential, or structural, are statistically significant. In other words, the logs must provide enough data to identify what constitutes the system’s normal behavior.
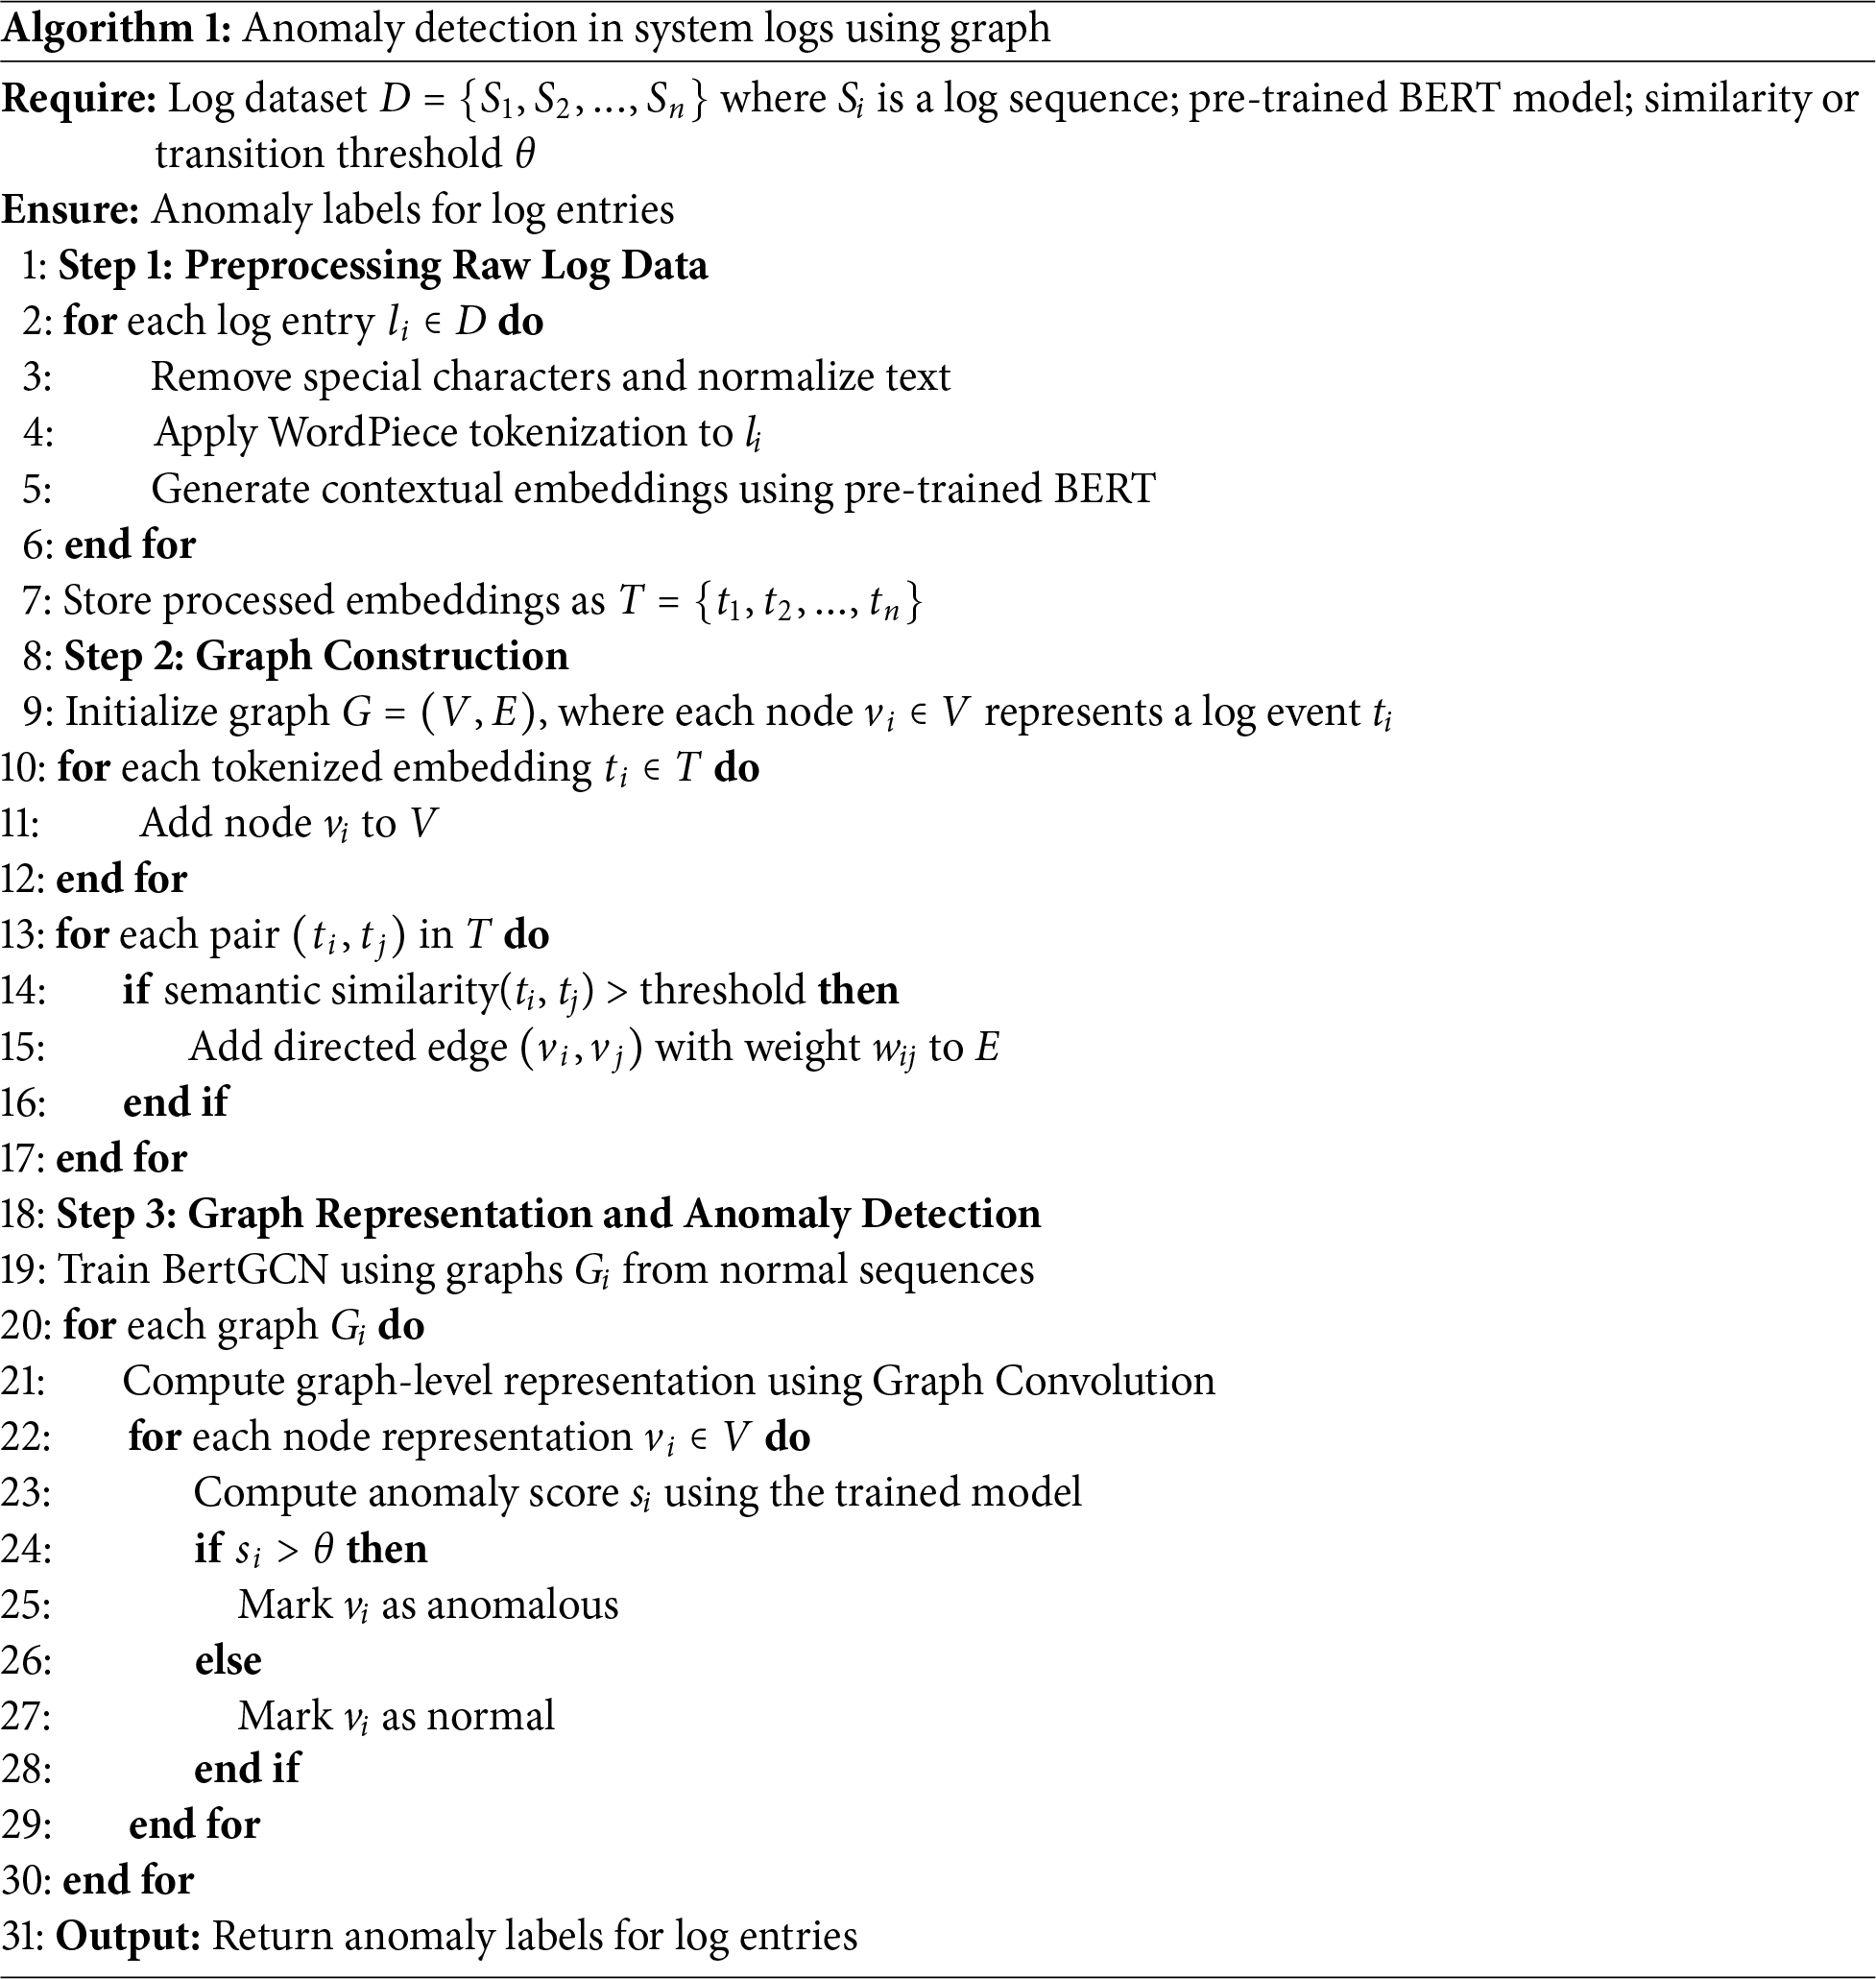
Algorithm 1 outlines the key computational steps of our proposed approach. A critical component in this process is the use of a threshold [33], which defines the decision boundary for classifying log events. This threshold determines whether the model’s output—typically a probability score—indicates an anomaly or a normal event. By comparing the model’s output to this predefined value, the algorithm can make informed decisions between different classes. Thresholds play a particularly important role in scenarios involving uncertainty or probabilistic predictions, as they directly influence performance metrics such as precision and recall. Therefore, selecting an appropriate threshold is essential for balancing false positives and false negatives, and it is typically determined through empirical testing or tailored to the specific requirements of the task.
As log data are naturally unstructured, it is crucial to preprocess them before feeding them into deep learning systems. The accuracy of the subsequent steps depends on the quality of the data preprocessing step. In this step, the emphasis is on standardizing the data and removing any inconsistencies and irrelevant information to ensure the data’s quality and reliability. Due to the drawbacks associated with log parsing discussed in Section 2.3, our framework will use the raw log data directly rather than performing log parsing. Fig. 5 illustrates an example of the preprocessing step for converting raw log entries into refined and organized target formats.
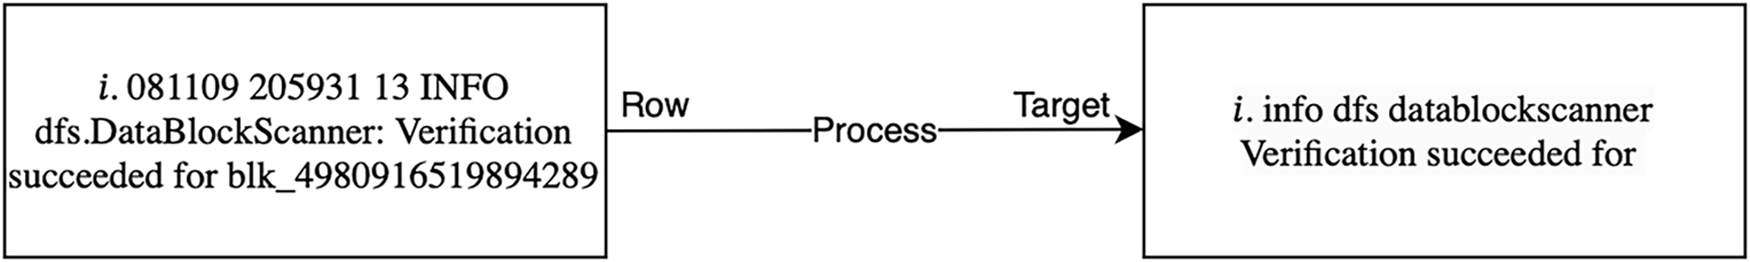
Figure 5: Preprocessing step example of a raw log entry
The preprocessing stage consists of three main substeps. First, the raw log data is automatically cleaned by removing non-character tokens, punctuation, and numerical values to reduce noise and ensure consistency. In this step, all remaining tokens are also converted to lowercase to eliminate case sensitivity issues. The second substep is tokenization, which prepares the data for deeper analysis. Each log message is split into word tokens using standard delimiters common in logging formats, such as whitespace, colons, and commas. This segmentation facilitates semantic analysis by accurately isolating meaningful units within the log messages, enabling more nuanced and precise interpretation in subsequent stages.
Neural Representation
Instead of parsing logs to extract structured components, the entire raw log message is directly used. This approach keeps the original semantic context of the logs. Our framework uses WordPiece Tokenization to split log messages into subword units
Each log sequence is transformed into a directed graph, denoted as
The node feature matrix
where
To account for the absence of a preceding event in the first position of each sequence, a self-loop edge
This graph-based construction captures both the semantic content and the sequential dependencies between log events. Compared to linear representations, it offers a richer structural context for downstream analysis, particularly in tasks such as anomaly detection, where both temporal order and frequency of event transitions are crucial.
4.4 Graph Representation Learning
Graph representation learning aims to generate meaningful low-dimensional embeddings that capture both the node attributes and the structural structure of a graph. This process is essential for the downstream graph-level classification task for anomaly detection. To enhance the model’s ability to distinguish between normal and anomalous patterns, it is crucial to thoughtfully design and select the input features and utilize the relational information encoded in the graph topology.
Semantic-Aware Node Embedding: In the constructed graph, each node corresponds to a distinct log event obtained from the preprocessing stage. Previous research has highlighted the importance of semantic information in log messages, as it significantly influences the effectiveness of anomaly detection. To extract such semantic features from text, various natural language processing models can be employed, including Word2Vec, GloVe, FastText, and BERT.
In this work, we employ the BERT model due to its proven ability to capture nuanced similarities and contextual relationships in log messages. Given a log event
where
These embeddings serve as the input to the graph convolution layers.
Graph Convolution: To capture structural dependencies among log events, we employ a Graph Convolutional Network (GCN). The GCN aggregates information from each node’s neighbors to generate contextualized node representations. The graph convolution operation at the
where:
•
•
•
•
•
This operation enables each node to refine its representation by incorporating information from its neighbors while respecting the graph structure.
Graph Readout and Classification: After passing through multiple GCN layers, the final node embeddings are aggregated into a single graph-level vector using a readout function
where
After constructing and representing the graph, we apply a Graph Convolutional Network (GCN) to perform anomaly detection. The GCN learns high-order representations by aggregating information from each node’s local neighborhood across multiple layers. These learned node and graph embeddings capture how log events interact within normal and abnormal contexts.
Once the final graph representation
where:
•
•
•
•
The model is trained using the cross-entropy loss function, defined as:
where
To assess the performance of our model, we employ three widely used evaluation metrics: Precision, Recall, and F1-Score.
4.6 Hyperparameter Optimization
To ensure optimal performance of our model, we conduct extensive hyperparameter tuning using the validation data. The goal is to identify a set of hyperparameters that strikes a balance between learning capacity, convergence speed, and generalization ability. Table 1 summarizes the key hyperparameters involved in training the model, along with the range of values explored during the tuning process. The values selected for final experiments are highlighted in bold.
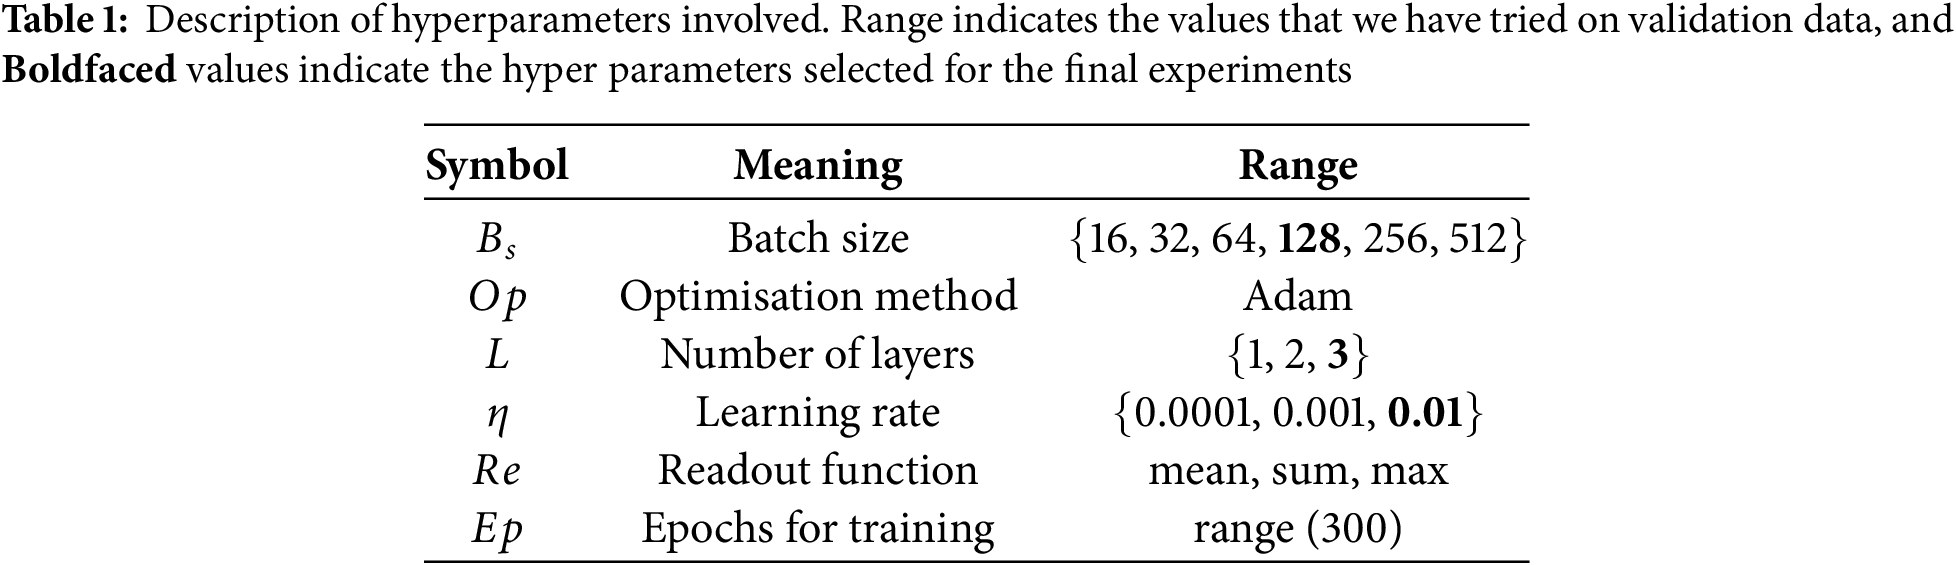
We evaluate the model’s performance on the validation set across combinations of batch size, learning rate, number of GCN layers, and readout functions. For the optimization algorithm, we adopt Adam due to its effectiveness and stability in training deep neural networks. The learning rate is carefully tuned, as it significantly affects convergence behavior. A small range of GCN layers is considered to avoid overfitting and excessive smoothing in deep graph models. We also experiment with different readout functions (mean, sum, and max pooling) to aggregate node embeddings into a graph-level representation. The selected configuration, shown in bold in the table, provides a good trade-off between performance and computational efficiency.
This section presents the experimental results and a comprehensive analysis of the performance of our proposed model, BertGCN, for log anomaly detection. We evaluate the model on the HDFS and BGL datasets, which are widely used benchmarks in this domain. The following subsections present the dataset, experimental setup, evaluation metrics, comparison of embedding techniques, and a discussion of results, including benchmarking against recent state-of-the-art models.
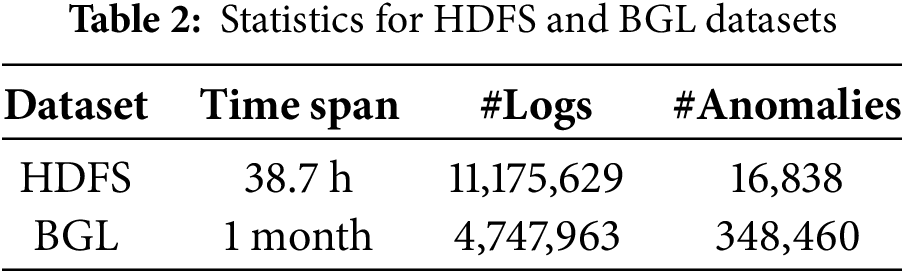
We evaluate our proposed BertGCN model on two publicly available datasets: HDFS (Hadoop Distributed File System) log dataset [22,35] and BGL [35,36], which are widely used in log anomaly detection research. HDFS comprises system logs collected over a 38.7-h period from a Hadoop-based distributed computing environment. Each log sequence corresponds to a block ID and is labeled as either normal or anomalous based on whether a system failure occurred. The raw dataset contains over 11 million log messages, which are preprocessed and mapped to [Y] unique templates. The BGL (Blue Gene/L) dataset is a system log collection from the supercomputing infrastructure at Lawrence Livermore National Laboratory. It comprises 4,747,963 log entries manually labeled as either normal or anomalous. Among them, 348,460 messages (7.34%) are identified as anomalous. Table 2 provides the statistics for the datasets.
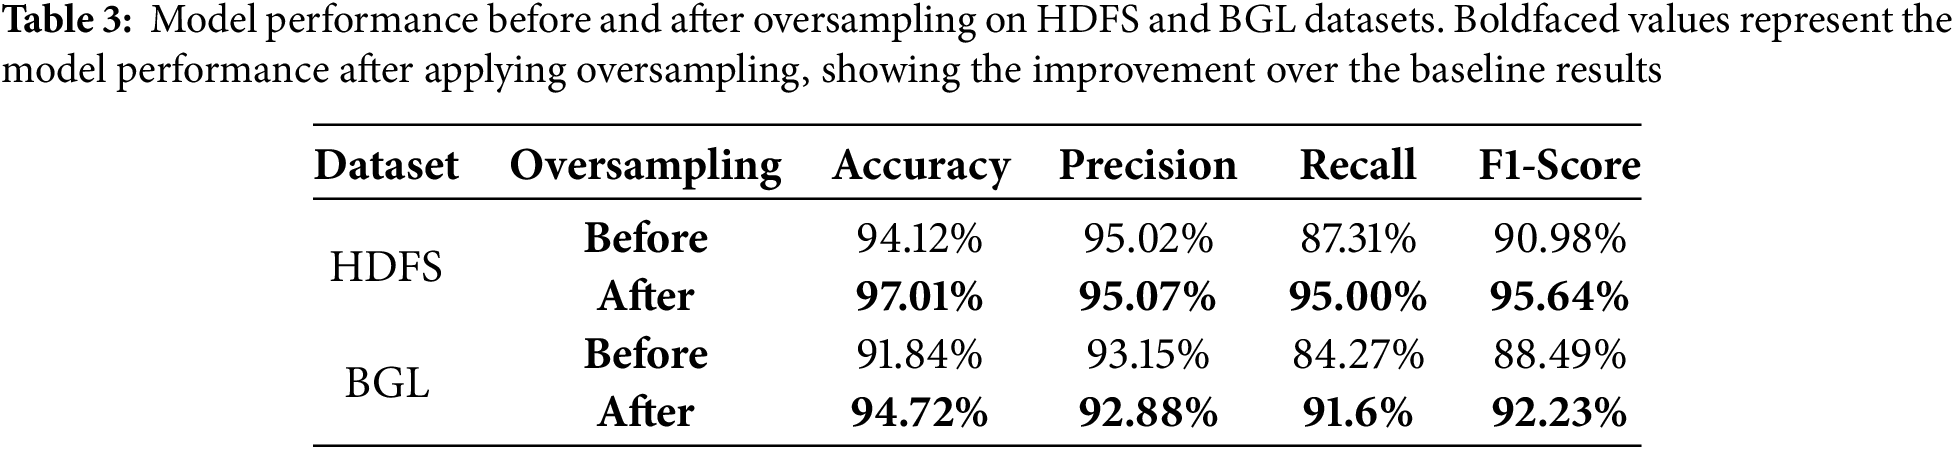
To address the severe class imbalance in both datasets, we employed an oversampling technique to replicate instances of the minority class and enhance model learning. Fig. 6 shows the distribution of log classes before and after oversampling in the HDFS dataset. To illustrate the effectiveness of this strategy, we evaluated the model’s performance before and after oversampling, employing essential measures such as Accuracy, Precision, Recall, and F1-score. The results indicate that oversampling significantly improves recall and F1-score, highlighting its advantageous impact on detecting rare anomalous events while maintaining high precision. Invalid input detected. Although alternative methods, such as SMOTE, anomaly-aware loss functions, and data augmentation, were evaluated, we determined that random duplication was successful for our log datasets and incurred minimal computational overhead. The performance of the model is evaluated before and after oversampling, as outlined in Table 3.
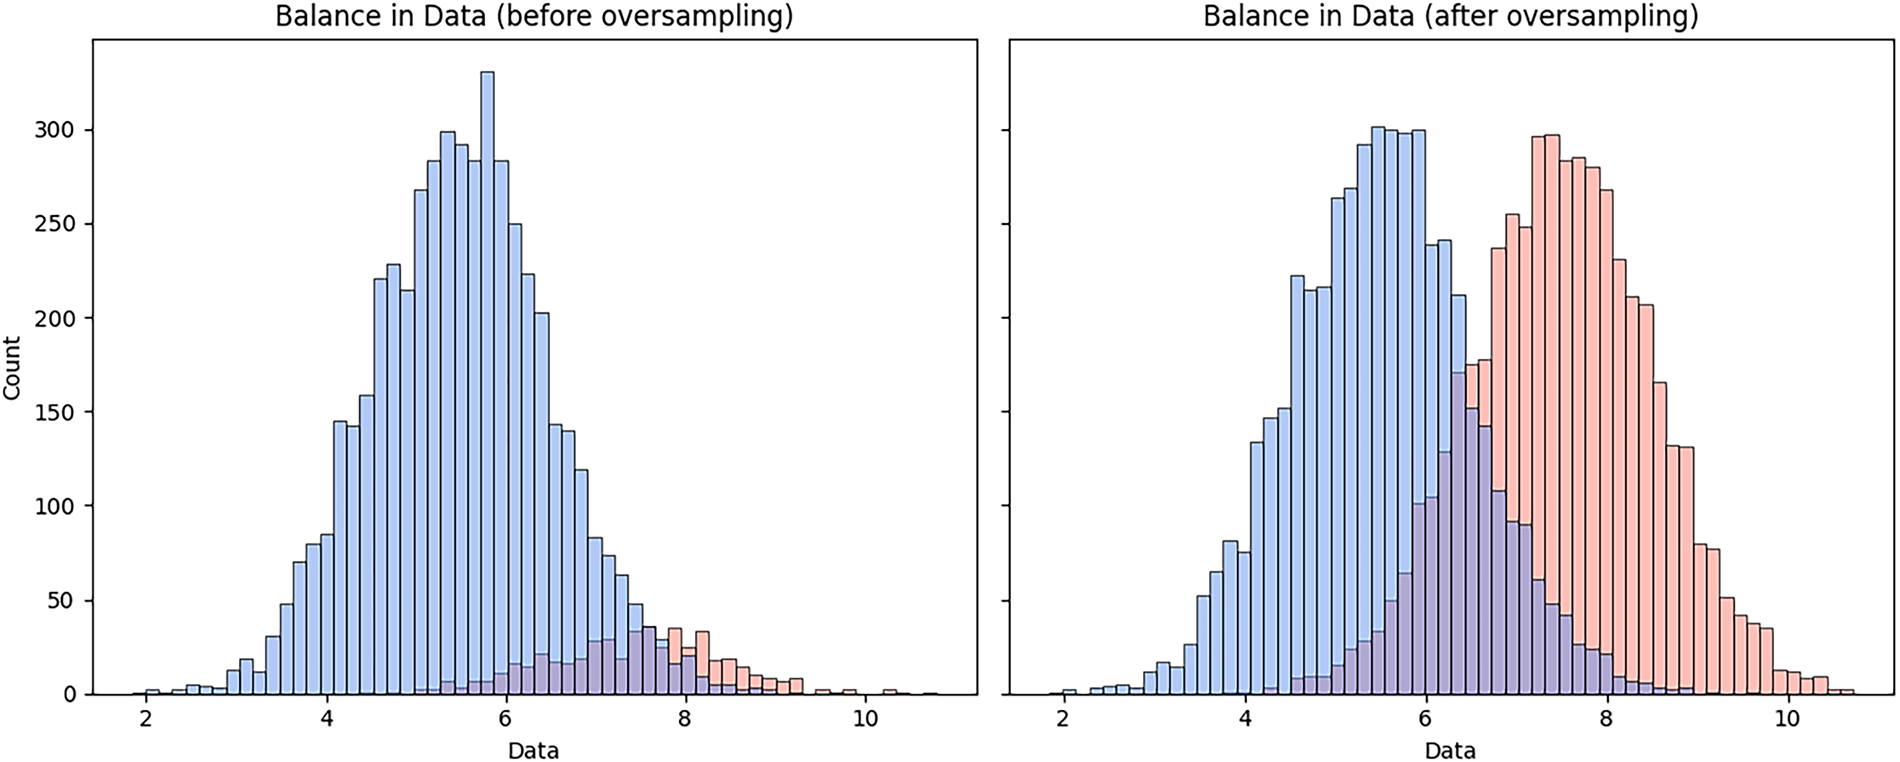
Figure 6: Class distribution before and after applying the oversampling in HDFS dataset
All experiments were conducted on the Aziz supercomputer at King Abdulaziz University. Aziz is equipped with 496 compute nodes, totaling 11,904 CPU cores, 20 GPU nodes with NVIDIA A100 GPUs (40 GB VRAM, 32 CPU cores, 512 GB RAM), Additional Tesla K20 GPU nodes with 2496 CUDA cores, 2 Intel Xeon Phi 5110P coprocessor nodes, and LINPACK performance of 211.3 TFLOPS and peak theoretical throughput of 228.5 TFLOPS. We used the HDFS and BGL datasets with the above preprocessing pipeline and implemented BertGCN with PyTorch Geometric. A 70:30 train-test split is used throughout our experiments. The model was trained using a cross-entropy loss and optimized with the Adam optimizer. Hyperparameter tuning was performed using a validation set, as described in Section 4.6.
To evaluate the anomaly detection performance of BertGCN, we use standard classification metrics: Precision, Recall, and F1-Score. Precision is defined as the proportion of correctly predicted anomalies among all predicted anomaly cases. Recall measures the proportion of true anomalies that were correctly identified by the model. The F1-Score is the harmonic mean of Precision and Recall, providing a balanced measure that accounts for both false positives and false negatives.
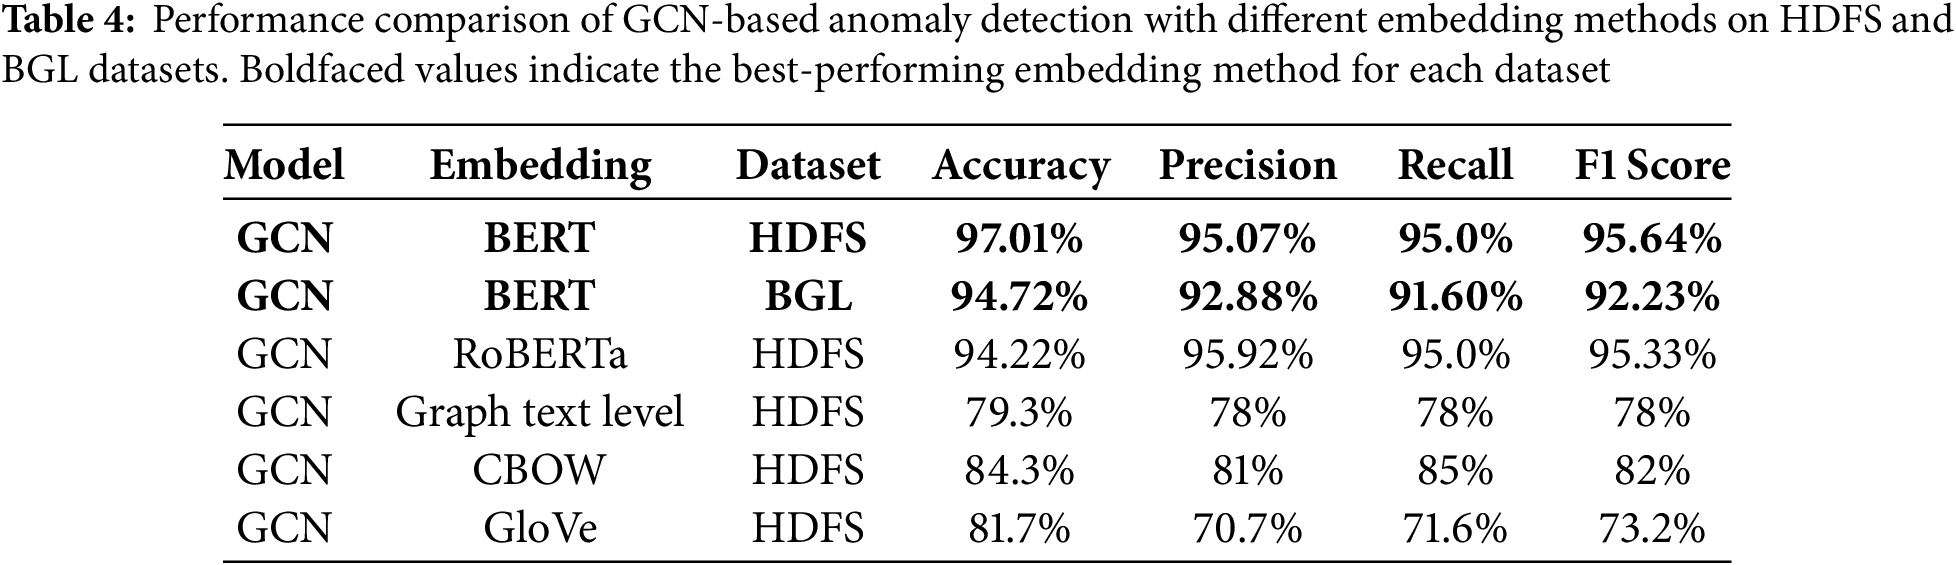
Table 4 presents the performance of BertGCN using different word embedding techniques. Our model achieved its highest performance using BERT embeddings, with an accuracy of 97.01%, precision of 95.07%, recall of 95.0%, and F1-Score of 95.64% on HDFS. Among the compared methods, RoBERTa achieved a similar performance, followed by CBOW and GloVe. Graph-level textual embeddings performed the worst, highlighting the importance of context-aware representations in log anomaly detection. Alongside the HDFS dataset, we assessed BertGCN on the BGL dataset to illustrate the model’s generalizability across several log sources. As shown in Table 4, BertGCN achieved an accuracy of 94.72%, precision of 92.88%, recall of 91.60%, and F1-Score of 92.23% on the BGL dataset. Although slightly lower than the HDFS results, these measurements nonetheless validate the efficacy of BertGCN across different environments. The decline in performance can be attributed to the complexity of BGL logs, which are more intricate and less structured than HDFS logs.
5.5 Computational Complexity and Scalability
To evaluate the scalability and computational complexity of the proposed BertGCN framework, we present both a theoretical complexity analysis and an empirical performance evaluation on the HDFS and BGL datasets.
Theoretical Complexity. The graph is constructed utilizing a sliding window of size
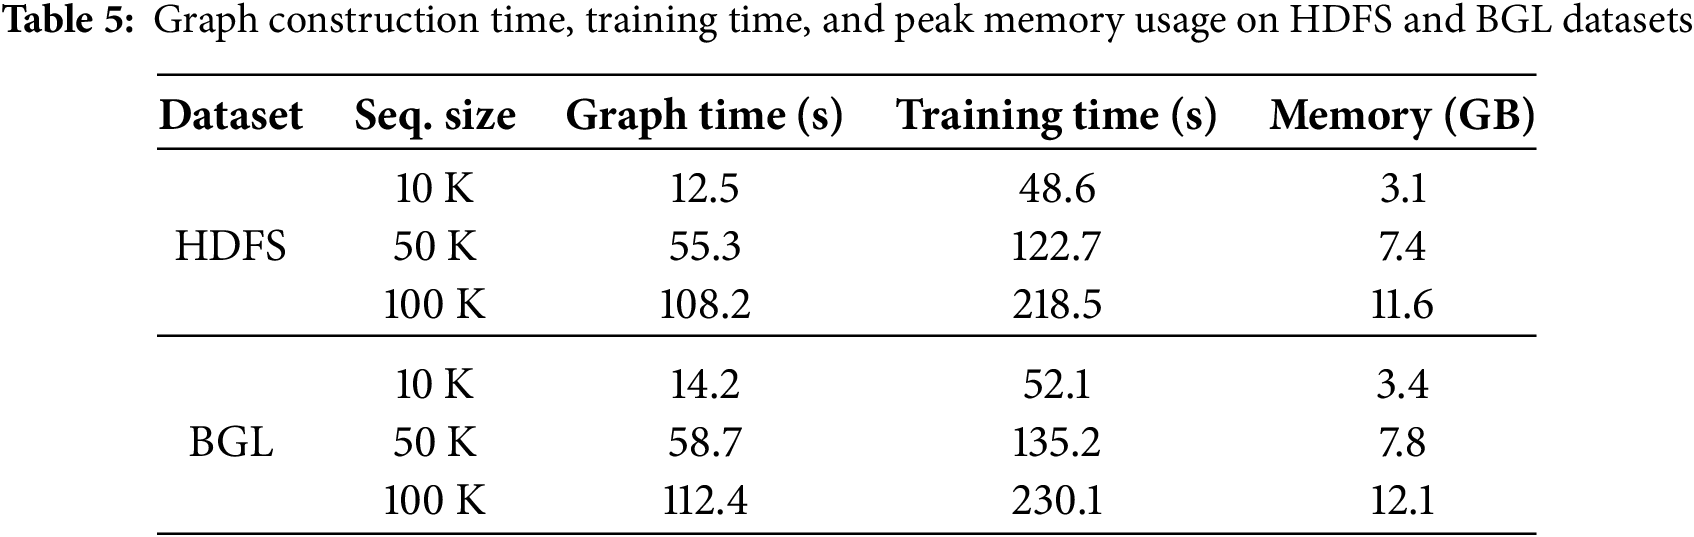
Empirical Evaluation. To evaluate runtime and memory efficiency, we measured graph construction time, GCN training time, and peak memory usage on subsets of HDFS and BGL containing 10 K, 50 K, and 100 K log sequences. Experiments were conducted on a MacBook Pro with an Apple M1 chip, used for small-scale development and testing, and the Aziz Supercomputer at King Abdulaziz University, which was used for full-scale experiments. The results confirm that BertGCN scales linearly with increasing dataset size, as summarized in Table 5.
5.6 Explainability and Interpretation via GNNExplainer
To improve the interpretability of our proposed BertGCN model and facilitate root cause investigation, we incorporated the GNNExplainer framework [37] into our anomaly detection process. This method enables us to identify the most significant nodes and edges in the created graph that influence the final classification decision made by the GCN. We utilized GNNExplainer on a representative sample of 100 anomalous log sessions from both the HDFS and BGL datasets. The results demonstrate a significant level of explanation fidelity, reflecting a robust correspondence between the emphasized subgraphs and the actual model predictions. In particular, in the HDFS dataset, the mean fidelity score was 0.95, with prevalent influential pathways such as the transition from “Block verification failed” to “Disk problem identified”. In the BGL dataset, the fidelity score averaged 0.92, with significant transitions, such as “Fan Warning”
These explanations offer valuable insights into the components of the log graph that trigger anomaly flags, enabling clearer model behavior and facilitating system engineers’ identification of root causes. Fig. 7a,b visualizes the explanation subgraphs in HDFS and BGL.
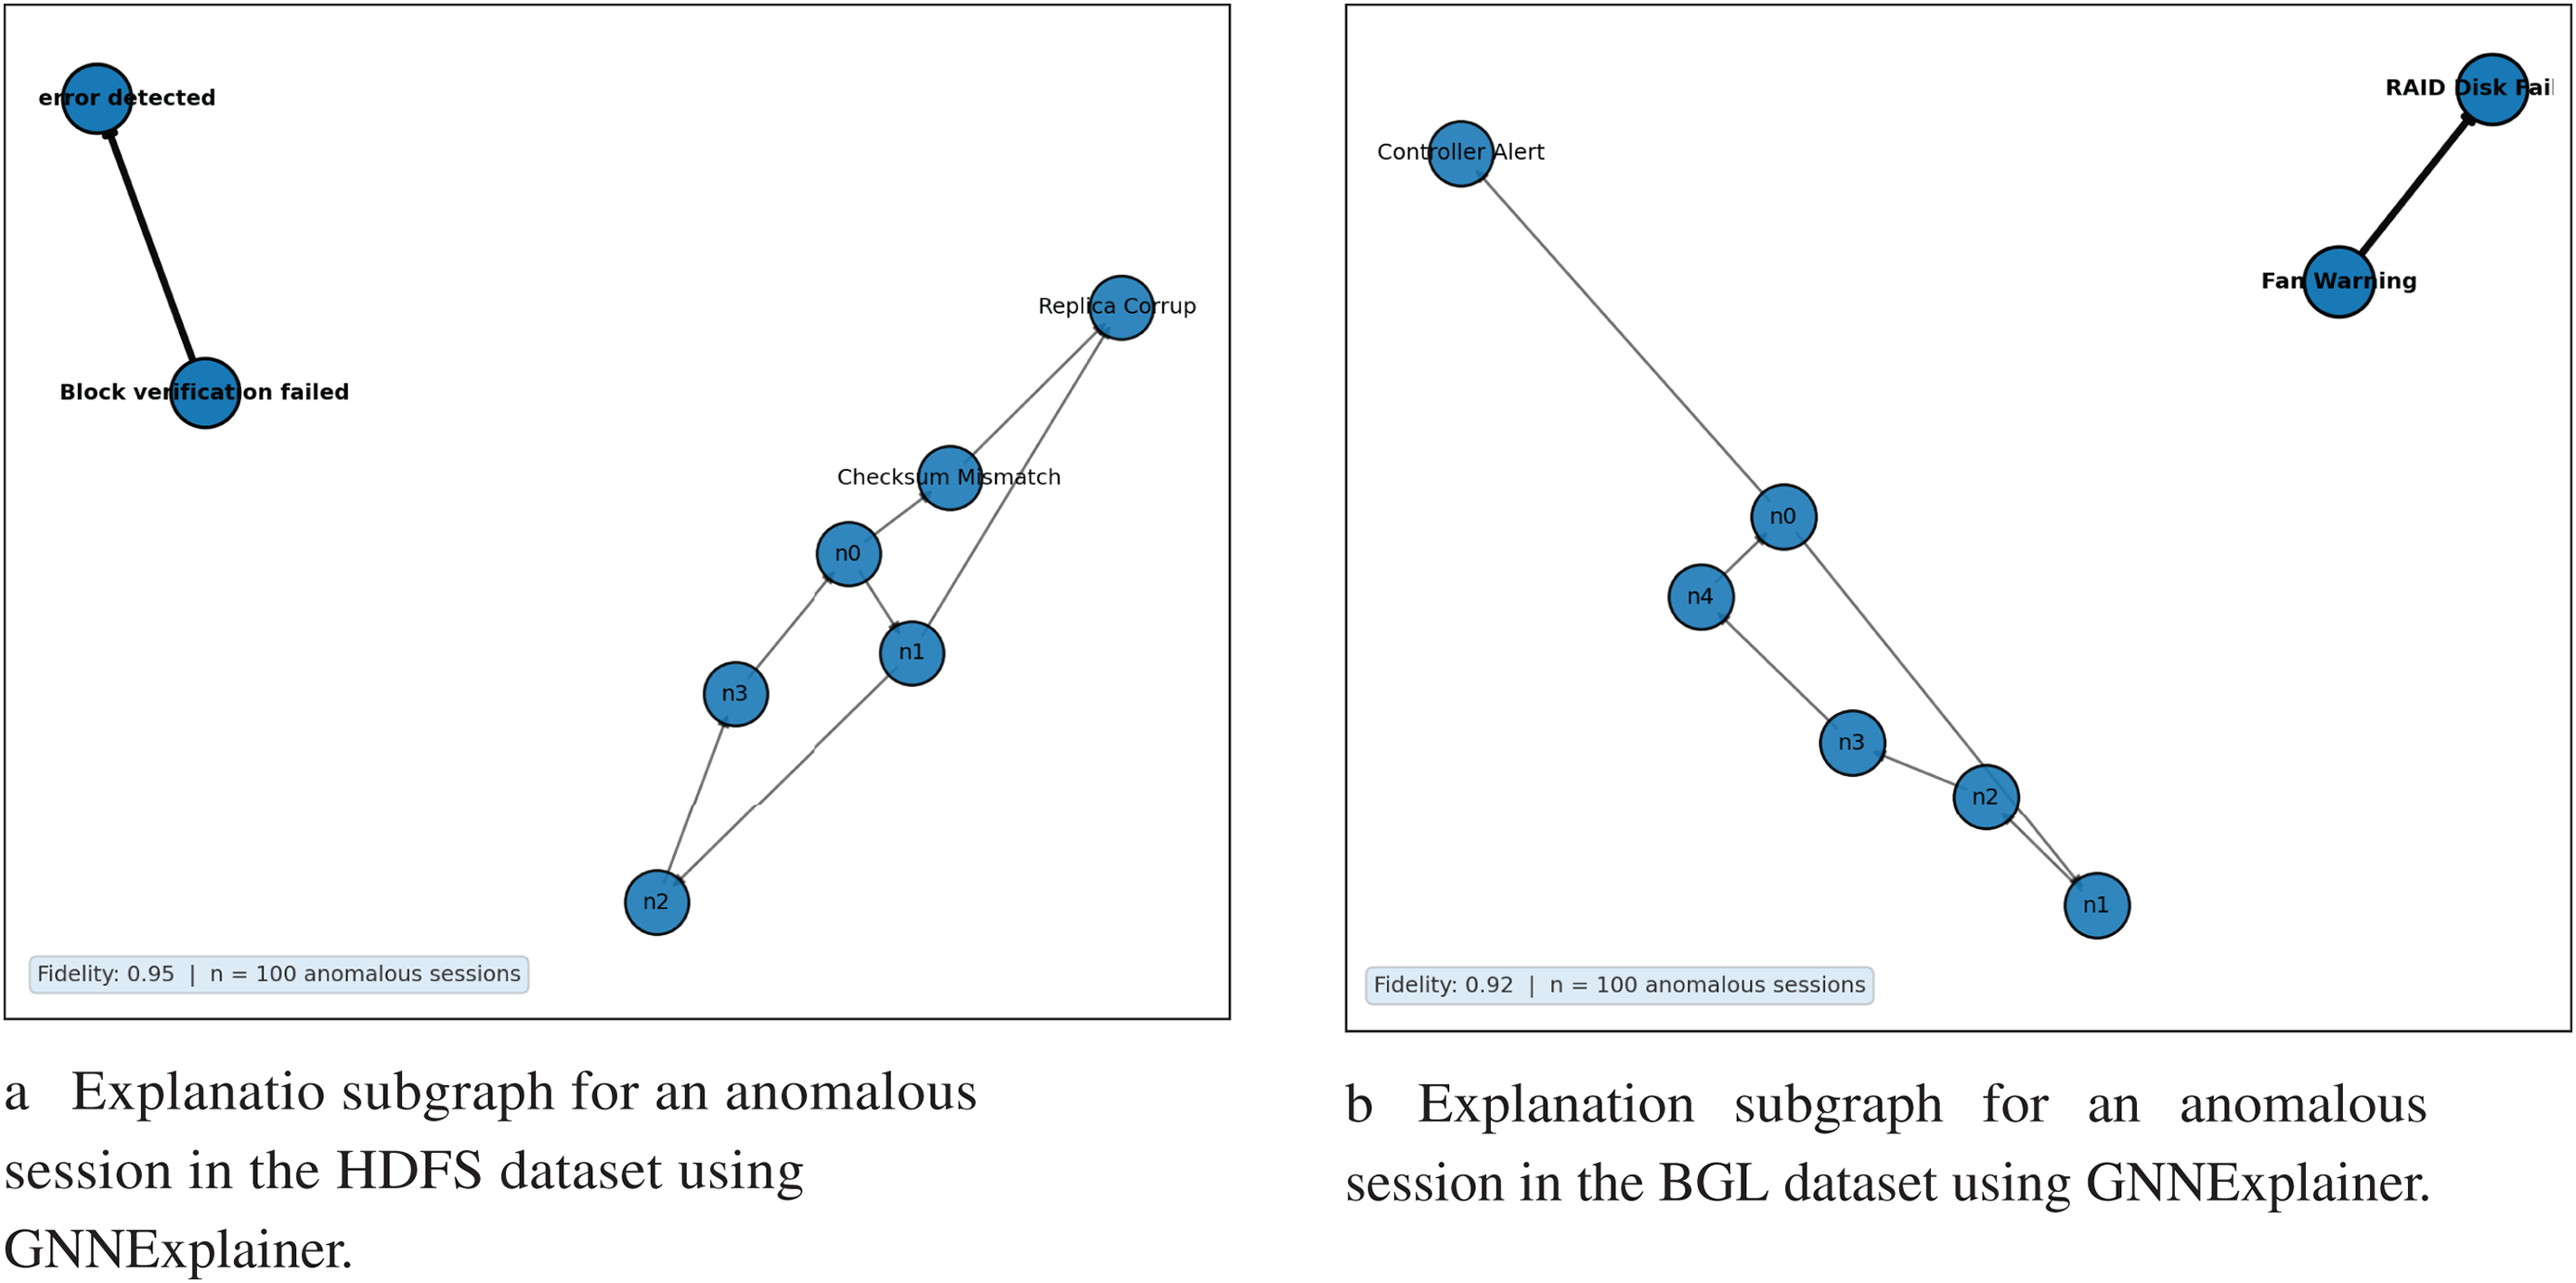
Figure 7: Explanation subgraphs for an anomalous session in HDFS and BGL datasets using GNNExplainer
The experimental results demonstrate that BertGCN is effective in detecting log anomalies by integrating semantic and structural information. Unlike traditional approaches that rely on log templates or handcrafted rules, our method operates directly on raw log messages and leverages BERT embeddings for semantic richness, as well as GCN for structural learning. This design enables the model to detect both syntactic and contextual anomalies, particularly those that do not conform to common patterns. Notably, BertGCN performed well in scenarios involving subtle anomalies, where small deviations in token sequences may indicate failure. However, the graph construction step can become computationally expensive for extremely large datasets. Additionally, while BERT provides robust embeddings, domain-specific logs may benefit from further fine-tuning of the language model. Exploring scalable graph construction and domain adaptation strategies remains a promising direction for future work. Log-driven anomaly detection has been extensively investigated across various sectors, including Industrial IoT (IIoT) environments, manufacturing systems, automotive applications, smart homes, and energy management systems [38]. The gains suggest that the proposed BertGCN architecture may be applicable beyond traditional log analysis, presenting opportunities for broader applications where system reliability, operational safety, and resource efficiency are paramount.
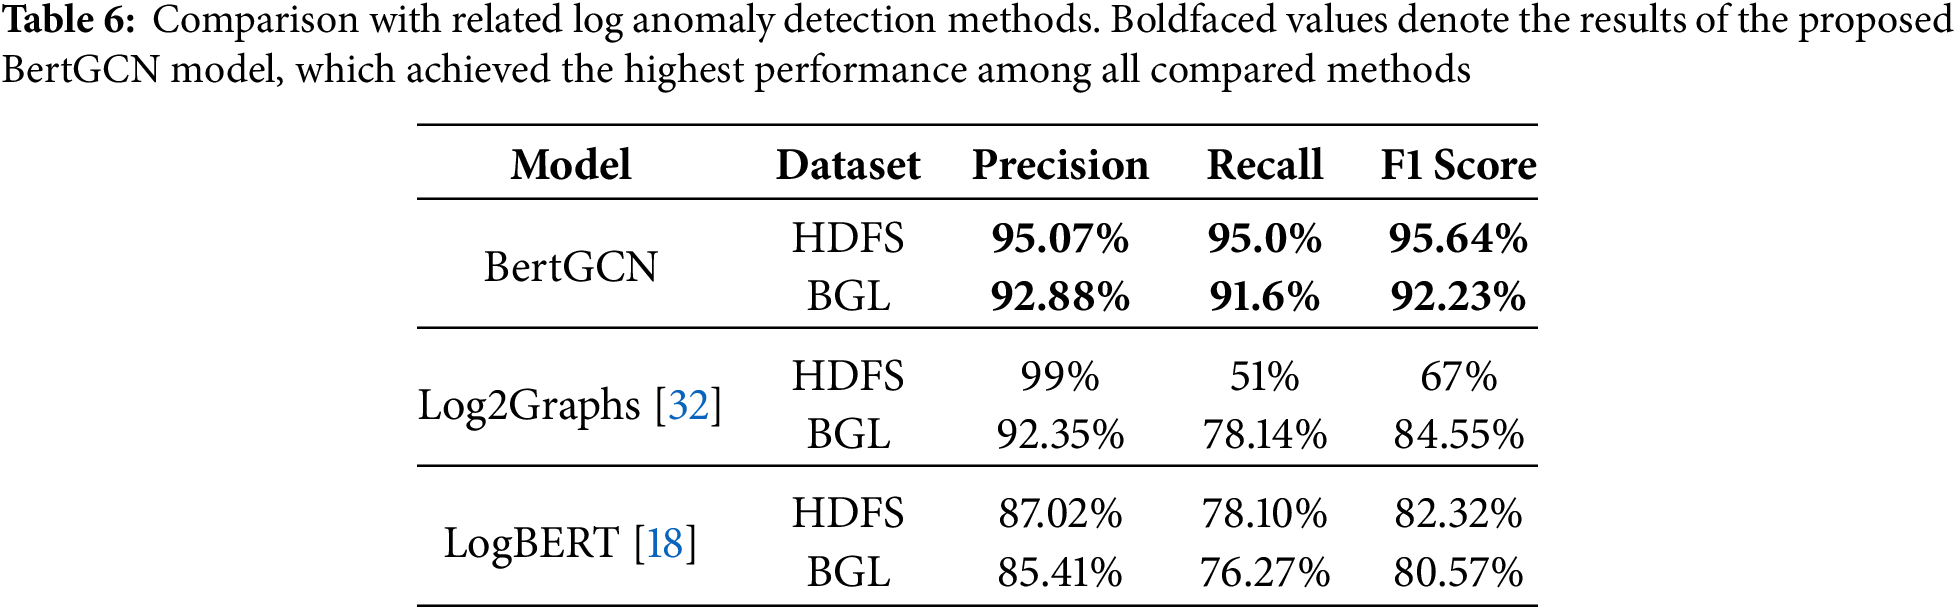
Comparison with Related Models
To benchmark the performance of BertGCN, we compare it with two recent and representative log anomaly detection models: LogBERT [18] and Log2Graphs [32]. These models represent different paradigms: deep learning-based and graph-based, respectively. Both were implemented using their official GitHub repositories [39,40] and evaluated under their default configurations on the same dataset. As shown in Table 6, BertGCN achieved the most balanced and highest performance across all three metrics on both datasets. In contrast, Log2Graphs achieved high precision (99% on HDFS, 92.35% on BGL) but significantly low recall (51% on HDFS, 78.14% on BGL), indicating many missed anomalies. LogBERT showed relatively lower precision and recall compared to both models on both datasets. These results confirm the effectiveness of combining BERT’s semantic modeling with GCN’s structural reasoning in log anomaly detection.
In this work, we proposed a novel log anomaly detection approach that utilizing the BertGCN framework, which uniquely integrates semantic structural and contextual analysis of raw log data without relying on traditional log-parsing techniques. By constructing semantically leverages graphs, the proposed methodology enables a more robust and comprehensive analysis of log messages, significantly improving anomaly detection capabilities. Experimental results demonstrate that BertGCN achieves state-of-the-art performance on the HDFS dataset, validating its effectiveness in accurately identifying anomalies. In future work, we intend to assess the robustness of our model by simulating adversarial situations, including log injection, suppression, and shuffling, and evaluate their impact on anomaly detection accuracy. Our current approach is designed for offline batch processing; in future work, we plan to extend it to support streaming log scenarios.
Acknowledgement: The authors gratefully acknowledge the technical and financial support provided by DSR.
Funding Statement: This project was funded by the Deanship of Scientific Research (DSR) at King Abdulaziz University, Jeddah, under grant no. (GPIP: 1074-612-2024).
Author Contributions: Conceptualization, Abeer Alhuzali, Areej Alhothali and Eman Alsalmi; methodology, Abeer Alhuzali, Areej Alhothali and Eman Alsalmi; software, Eman Alsalmi; validation, Eman Alsalmi and Abeer Alhuzali; formal analysis, Eman Alsalmi and Areej Alhothali; investigation, Eman Alsalmi, Abeer Alhuzali; writing—original draft preparation, Eman Alsalmi, Abeer Alhuzali and Areej Alhothali; writing—review and editing, Areej Alhothali and Abeer Alhuzali; visualization, Eman Alsalmi and Abeer Alhuzali; supervision, Abeer Alhuzali and Areej Alhothali; project administration, Abeer Alhuzali and Areej Alhothali; funding acquisition, Abeer Alhuzali. All authors reviewed the results and approved the final version of the manuscript.
Ethics Approval: This study used only publicly available system log datasets and did not involve human participants, animals, or sensitive personal data. Therefore, institutional review board (IRB) approval was not required. All methods complied with relevant guidelines and regulations, and no ethical concerns are associated with this work.
Availability of Data and Materials: The datasets used in this study are publicly available.
Conflicts of Interest: The authors declare no conflicts of interest to report regarding the present study.
References
1. Yu B, Yao J, Fu Q, Zhong Z, Xie H, Wu Y, et al. Deep learning or classical machine learning? An empirical study on log-based anomaly detection. In: Proceedings of The 46th IEEE/ACM International Conference on Software Engineering; 2024 Apr 14–20; Lisbon Portugal. p. 1–13. [Google Scholar]
2. Cheng Q, Sahoo D, Saha A, Yang W, Liu C, Woo G, et al. AI for IT operations (AIOps) on cloud platforms: reviews, opportunities and challenges. arXiv:2304.04661. 2023. [Google Scholar]
3. Cheng H. Interpretable and robust deep anomaly detection [dissertation]. Logan, UT, USA: Utah State University; 2023. [Google Scholar]
4. Fu Y, Yan M, Xu Z, Xia X, Zhang X, Yang D. An empirical study of the impact of log parsers on the performance of log-based anomaly detection. Empirical Softw Eng. 2023;28:6. [Google Scholar]
5. Li Y, Liu Y, Wang H, Chen Z, Cheng W, Chen Y, et al. Content-aware dynamic graphs for log anomaly detection. In: 2023 IEEE International Conference On Knowledge Graph (ICKG); 2023 Dec 1–2; Shanghai, China. p. 9–18. [Google Scholar]
6. Zhang X, Xu Y, Lin Q, Qiao B, Zhang H, Dang Y, et al. Robust log-based anomaly detection on unstable log data. In: Proceedings of The 2019 27th ACM Joint Meeting on European Software Engineering Conference and Symposium on the Foundations of Software Engineering; 2019 Aug 26–30; Tallinn, Estonia. p. 807–17. [Google Scholar]
7. Zhang C, Fu H. LogDA: dual attention-based log anomaly detection addressing data imbalance. Comput Mater Contin. 2025;83(1):1291–1306. doi:10.32604/cmc.2025.060740. [Google Scholar] [CrossRef]
8. Le V, Zhang H. Log-based anomaly detection without log parsing. In: 2021 36th IEEE/ACM International Conference on Automated Software Engineering (ASE); 2021 Nov 15–19; Melbourne, VIC, Australia. p. 492–504. [Google Scholar]
9. Qiu C, Kloft M, Mandt S, Rudolph M. Raising the bar in graph-level anomaly detection. arXiv:2205.13845. 2022. [Google Scholar]
10. Li J, Pang M, Dong Y, Jia J, Wang B. Graph neural network explanations are fragile. In: Proceedings of the 41st International Conference on Machine Learning; 2024. Vol. 235, p.28551–67. [Google Scholar]
11. Wang J, Zhao C, He S, Gu Y, Alfarraj O, Abugabah A. LogUAD: log unsupervised anomaly detection based on Word2Vec. Comput Syst Sci Eng. 2022;41(3):1207–22. doi:10.32604/csse.2022.022365. [Google Scholar] [CrossRef]
12. Le V, Zhang H. Log-based anomaly detection with deep learning: how far are we? In: Proceedings of the 44th International Conference on Software Engineering (ICSE); 2022 May 25–27; Pittsburgh, PA, USA. p. 293–305. [Google Scholar]
13. He S, Zhu J, He P, Lyu M. Experience report: system log analysis for anomaly detection. In: 2016 IEEE 27th International Symposium on Software Reliability Engineering (ISSRE); 2016 Oct 23–27; Ottawa, ON, Canada. p. 207–18. [Google Scholar]
14. Du M, Li F, Zheng G, Srikumar V. DeepLog: anomaly detection and diagnosis from system logs through deep learning. In: Proceedings of the 2017 ACM SIGSAC Conference on Computer and Communications Security (CCS); 2017 Oct 30–Nov 3; Dallas, TX, USA. p. 1285–98. doi:10.1145/3133956.3134015. [Google Scholar] [CrossRef]
15. Lin Y, Deng H, Li X. FastLogAD: log anomaly detection with mask-guided pseudo anomaly generation and discrimination. arXiv:2404.08750. 2024. [Google Scholar]
16. Meng W, Liu Y, Zhang Y, Wang Z, Chen Y, Liu P. LogAnomaly: unsupervised detection of sequential and quantitative anomalies in unstructured logs. In: Proceedings of the 28th International Joint Conference on Artificial Intelligence (IJCAI); 2019 Aug 10–16; Macao, China. p. 4739–45. [Google Scholar]
17. Brown A, Tuor A, Hutchinson B, Nichols N. Recurrent neural network attention mechanisms for interpretable system log anomaly detection. In: Proceedings of the First Workshop on Machine Learning for Computing Systems; 2018 Jun 12; Tempe, AZ, USA. p. 1–8. [Google Scholar]
18. Guo H, Yuan S, Wu X. Logbert: log anomaly detection via bert. In: 2021 International Joint Conference on Neural Networks (IJCNN); 2021 Jul 18–22; Shenzhen, China. p. 1–8. [Google Scholar]
19. Nedelkoski S, Bogatinovski J, Acker A, Cardoso J, Kao O. Self-attentive classification-based anomaly detection in unstructured logs. In: 2020 IEEE International Conference on Data Mining (ICDM); 2020 Nov 17–20; Sorrento, Italy. p. 1196–201. [Google Scholar]
20. Wittkopp T, Acker A, Nedelkoski S, Bogatinovski J, Scheinert D, Fan W, et al. Attentive augmented log anomaly detection. arXiv:2109.09537. 2021. [Google Scholar]
21. Li M, Sun M, Li G, Han D, Zhou M. Mdfulog: multi-feature deep fusion of unstable log anomaly detection model. Appl Sci. 2023;13:2237. [Google Scholar]
22. Xu W, Huang L, Fox A, Patterson D, Jordan M. Detecting large-scale system problems by mining console logs. In: Proceedings of the ACM SIGOPS 22nd Symposium on Operating Systems Principles; 2009 Oct 11–14; Big Sky, MT, USA. p. 117–32. [Google Scholar]
23. Schölkopf B, Platt J, Shawe-Taylor J, Smola A, Williamson R. Estimating the support of a high-dimensional distribution. Neural Computat. 2001;13:1443–71. [Google Scholar]
24. Nguyen H, Liang P, Akoglu L. Detecting anomalous graphs in labeled multi-graph databases. ACM Trans Knowl Discov Data. 2023;17:1–25. [Google Scholar]
25. Zhang G, Yang Z, Wu J, Yang J, Xue S, Peng H, et al. Dual-discriminative graph neural network for imbalanced graph-level anomaly detection. Adv Neural Inf Processing Syst. 2022;35:24144–57. [Google Scholar]
26. Xu K, Hu W, Leskovec J, Jegelka S. How powerful are graph neural networks? arXiv:1810.00826. 2018. [Google Scholar]
27. Xie Y, Zhang H, Babar M. Loggd: detecting anomalies from system logs with graph neural networks. In: IEEE 22nd International Conference on Software Quality, Reliability and Security (QRS); 2022 Dec 5–9; Guangzhou, China. p. 299–310. [Google Scholar]
28. Liang S, Guo Y, Chen Y, Cao Z, Li Y, Zhang R. HiGraph: learning hierarchical graph for multivariate time series anomaly detection in microservice systems. In: 2025 8th World Conference on Computing and Communication Technologies (WCCCT); 2025 Apr 11–13; Shenzhen, China. p. 302–8. doi:10.1109/WCCCT65447.2025.11028023. [Google Scholar] [CrossRef]
29. Zhao L, Sawlani S, Srinivasan A, Akoglu L. Graph anomaly detection with unsupervised GNNs. arXiv:2210.09535. 2022. [Google Scholar]
30. Ma R, Pang G, Chen L, Hengel A. Deep graph-level anomaly detection by glocal knowledge distillation. In: Proceedings of the Fifteenth ACM International Conference on Web Search and Data Mining; 2022 Feb 21–25; Online. p. 704–14. [Google Scholar]
31. Wan Y, Liu Y, Wang D, Wen Y. Glad-paw: Graph-based log anomaly detection by position aware weighted graph attention network. In: The 25th Pacific-Asia Conference on Knowledge Discovery and Data Mining; 2021 May 11–14; Delhi, India. p. 66–77. [Google Scholar]
32. Li Z, Shi J, Van Leeuwen M. Graph neural networks based log anomaly detection and explanation. In: Proceedings of the 2024 IEEE/ACM 46th International Conference on Software Engineering: Companion Proceedings; 2024 Apr 14–20; Lisbon, Portugal. p. 306–7. [Google Scholar]
33. Sokolova M, Lapalme G. Systematic review of performance measures for classification tasks. Inf Process Manag. 2006;44:190–203. [Google Scholar]
34. Devlin J, Chang M, Lee K, Toutanova K. BERT: pre-training of deep bidirectional transformers for language understanding. In: Proceedings of NAACL-HLT; 2019 Jun 2–7; Minneapolis, MN, USA. p. 4171–86. [Google Scholar]
35. Zhu J, He S, He P, Liu J, Lyu M. Loghub: a large collection of system log datasets for AI-driven log analytics. In: IEEE 34th International Symposium on Software Reliability Engineering (ISSRE); 2023 Oct 9–12; Florence, Italy. p. 355–66. [Google Scholar]
36. Liang Y, Zhang Y, Sivasubramaniam A, Jette M, Sahoo R. BlueGene/L failure analysis and prediction models. In: International Conference on Dependable Systems and Networks (DSN’06); 2006 Jun 25–28; Philadelphia, PA, USA. p. 425–34. doi:10.1109/DSN.2006.18. [Google Scholar] [CrossRef]
37. Ying Z, Bourgeois D, You J, Zitnik M, Leskovec J. Gnnexplainer: generating explanations for graph neural networks. Adv Neural Inf Process Syst. 2019;32:9240–51. [Google Scholar] [PubMed]
38. Papaioannou A, Dimara A, Kouzinopoulos C, Krinidis S, Anagnostopoulos C, Ioannidis D, et al. LP-OPTIMA: a framework for prescriptive maintenance and optimization of IoT resources for low-power embedded systems. Sensors. 2024;24(7):2125. doi:10.3390/s24072125. [Google Scholar] [PubMed] [CrossRef]
39. Guo H, Yuan S, Wu X. LogBERT: log anomaly detection via BERT. GitHub Repository. 2021 [Internet]. [cited 2025 Jul 13]. Available from: https://github.com/HelenGuohx/logbert. [Google Scholar]
40. Li Z, Shi J, Van Leeuwen M. Logs2Graph: log anomaly detection via graph neural networks. GitHub Repository. 2022 [Internet]. [cited 2025 Jul 13]. Available from: https://github.com/ZhongLIFR/Logs2Graph. [Google Scholar]
Cite This Article
 Copyright © 2026 The Author(s). Published by Tech Science Press.
This work is licensed under a Creative Commons Attribution 4.0 International License , which permits unrestricted use, distribution, and reproduction in any medium, provided the original work is properly cited.
 Downloads
 Citation Tools