
 Submit a Paper
 Propose a Special lssue
 Open Access
ARTICLE

A Micromechanics-Based Softening Hyperelastic Model for Granular Materials: Multiscale Insights into Strain Localization and Softening
1 School of Civil Engineering, Chongqing Jiaotong University, Chongqing, 400074, China
2 School of Civil Engineering, Wuhan University, Wuhan, 430072, China
* Corresponding Author: Chenxi Xiu. Email:
Computers, Materials & Continua 2026, 86(2), 1-39. https://doi.org/10.32604/cmc.2025.073193
Received 12 September 2025; Accepted 29 October 2025; Issue published 09 December 2025
 View Full Text
 Download PDF
Abstract
Granular materials exhibit complex macroscopic mechanical behaviors closely related to their micro-scale microstructural features. Traditional macroscopic phenomenological elasto-plastic models, however, usually have complex formulations and lack explicit relations to these microstructural features. To avoid these limitations, this study proposes a micromechanics-based softening hyperelastic model for granular materials, integrating softening hyperelasticity with microstructural insights to capture strain softening, critical state, and strain localization behaviors. The model has two key advantages: (1) a clear conceptualization, straightforward formulation, and ease of numerical implementation (via Abaqus UMAT subroutine in this study); (2) explicit incorporation of micro-scale features (e.g., contact stiffness, particle size, porosity) to reveal their influences on macroscopic responses. An isotropic directional distribution density of contacts and three specific microstructures are considered, and their softening hyperelastic constitutive modulus tensors are explicitly derived. By introducing a softening factor and critical failure energy density, the model can describe geomaterial behaviors, simulating residual strength, X-shaped shear bands, and strain localization evolution. Numerical validations in comparison with the macro-scale hyperelastic model, Abaqus Drucker-Prager model, and the experiment confirm its accuracy. Parametric studies reveal critical dependencies: a normal to tangential contact stiffness ratio of 2–8 (depending on stiffness magnitude), an internal length of 2–4 mm to ensure shear band formation, and a critical failure energy density (≤10 kJ/m3) to trigger strain softening and localization. Influences of the specific microstructures on strain localization and softening are investigated. The model also shows mesh independence due to the introduction of an internal length. The model’s applicability is further demonstrated by slope stability analysis, capturing slip surface evolution, and load-displacement characteristics. This study develops a robust microstructure-aware hyperelastic framework to describe the mechanical behaviors of granular materials, providing multiscale insights for geotechnical engineering applications.Keywords
Granular materials, such as sands, soils, and rocks, consist of discrete solid particles and interstitial voids, exhibiting significant heterogeneity, nonlinearity, and complex microscopic contact behaviors. These characteristics typically lead to intricate mechanical responses, including phenomena like strain localization and strain softening [1–3]. Such behaviors are closely related to the localized failure of granular materials, which is one of the primary causes of civil engineering structural failures and natural disasters like landslides and mudslides. Therefore, a thorough investigation and understanding of complex mechanical behaviors of granular materials remain critical tasks in the field of granular material mechanics.
To characterize the mechanical behaviors of granular materials, the elasto-plastic models [4–7] based on continuum mechanics have been developed, such as the Mohr-Coulomb, Drucker-Prager, and Lade-Duncan models. These models typically require some fundamental components, including the yield function, ultimate failure (plastic limit) surface, flow rule, and hardening/softening law. However, determining these components accurately often poses significant challenges. Therefore, in recent years, hyperelastic models [8–12] have also been employed to characterize the mechanical behaviors of granular materials. For instance, Houlsby et al. [8] developed a hyperelastic model that satisfies thermodynamic requirements by assuming the elastic modulus as a power function of the mean stress. Jiang and Liu [9] derived a generalized granular elastic model that accounts for yielding and dilatancy via thermodynamic instability and pressure-dependent elastic modulus. Xiao et al. [12] presented an anisotropic hyperelastic model for granular materials, predicting nonlinear elasticity and strength criterion through a unified thermodynamic approach. For the localized failure characteristics of granular materials, it is a critical challenge to accurately describe their strain localization and strain softening. Volokh [13,14] proposed a concept based on a hyperelastic model with softening, offering a novel approach based on the following principles: (1) there is a limit to the strain energy for real materials; (2) the strain energy of real materials is a function of the ideal material’s strain energy. As the strain increases (assuming it tends towards infinity), the strain energy of real materials will approach the limit value, and their stress-strain relationship will exhibit softening. Volokh’s model implements damage concepts through the energy threshold mechanism, eliminating the need for complex damage variables and evolution equations. It is noted that the Volokh softening hyperelastic model is specifically proposed for brittle materials or biological materials. Furthermore, considering that granular materials primarily have shear deformation and localized failure, Chang et al. [10] also proposed a softening hyperelastic model for granular materials based on Volokh’s model to simulate strain localization and strain softening. The softening hyperelastic models offer distinct advantages due to their clear conceptual framework, straightforward formulation, and ease of numerical implementation.
It is noted that the aforementioned models are predominantly macroscopic and phenomenological, and their parameters are typically calibrated to fit macroscopic stress-strain curves, lacking a direct, explicit connection to the underlying microstructure of granular materials. However, studies have proven that the mechanical behaviors of granular materials are profoundly influenced by their microstructural characteristics. For instance, the width of shear bands in granular materials is a function of the particle size [15]. Owing to the randomness and variety of the microstructure, it causes complex inter-particle interactions in the granular system, which give rise to complex macroscopic mechanical behaviors in turn, such as strain localization and strain softening. Therefore, to obtain a deeper understanding of macroscopic mechanical behaviors, it is essential to accurately characterize the influences of microstructural features at the micro scale.
To bridge the micro-macro scale, current strategies can be broadly categorized into three approaches: (1) the purely discrete approach, like the discrete element method (DEM) [16,17], (2) concurrent multiscale coupling, like FEM/DEM [18–20], and (3) microstructure-informed continuum models [6,21–23]. The DEM provides the most direct simulation of granular mechanics by explicitly describing particle interactions. However, its high computational cost severely limits its application to engineering-scale boundary value problems [15,18]. The coupled FEM/DEM approach aims to balance accuracy and cost by introducing DEM in critical regions into a continuum framework. Despite its potential, this technique requires complex operations like domain partitioning and cross-scale data exchange, limiting its practical application in engineering design. The microstructure-informed continuum model offers a distinct multiscale approach. It avoids the need to explicitly describe countless particles or manage complex concurrent coupling. Instead, it introduces key micromechanical characteristics directly into a computationally efficient continuum constitutive framework. This strategy achieves a balance, retaining a direct connection to granular micromechanics while enabling the simulation of large-scale geotechnical structures.
This paper considers a microstructure-informed approach by integrating macro-scale softening hyperelasticity with micromechanical characteristics, and first proposes a micromechanics-based softening hyperelastic model of granular materials. This model offers two key advantages: (1) within the hyperelastic framework, it has a clear conceptualization, straightforward formulation, and ease of numerical implementation; (2) it explicitly incorporates microstructural information at the micro scale to reveal its influences on macroscopic mechanical behaviors of granular materials. The formulation of the proposed model is derived by considering an isotropic directional contact distribution density and three specific microstructures of granular materials, with hyperelastic constitutive modulus tensors explicitly developed. Given the complexity of granular materials, this study establishes a foundational model by focusing on dry sands. This choice is strategic because dry sands exhibit a well-defined critical state. This aspect is central to their mechanical behavior, and the proposed model explicitly incorporates to describe the residual strength after softening. This focused scope needs deliberate simplifications, ignoring pore fluid, chemical bonding, or complex particle shapes, etc. Concentrating on dry, cohesionless sands, this study can more clearly investigate how basic microstructural parameters influence the critical state, including strain softening and localization, thus providing a benchmark for future extensions.
It should be noted that this study adopts a microstructure-informed method to construct a macroscopic constitutive model, which is fundamentally different from a strictly bottom-up, concurrent multiscale simulation. As noted by Talebi et al. [24], achieving fully consistent scale-bridging during localized failure is challenging. The proposed model offers a practical and complementary approach. It does not attempt to resolve this challenge in real-time but incorporates key microstructural information, such as the internal length and contact stiffness, into the model parameters. This strategy ensures high computational efficiency and engineering practicality, and retains its transparent connection between macroscopic responses and micro-parameters. However, its limitations also result from the idealized assumptions. The highly idealized microstructures limit the model’s capability to capture the complex fabric, particle shape distribution, and force chain evolution in natural soils or sands. Specifically, this simplification makes it challenging to spontaneously simulate the asymmetric initiation and propagation of shear bands often observed in natural materials due to initial fabric heterogeneity. Therefore, these limitations constitute the necessary compromise for achieving the model’s advantages in conceptual clarity and computational performance.
Furthermore, the machine learning alternatives [25] point to a promising paradigm for fracture modeling. These data-driven techniques offer distinct advantages in handling experimental noise, solving inverse problems, and naturally accounting for uncertainties. The physics-based path taken in this study and the data-driven approaches are not mutually exclusive but rather complementary. The proposed model provides transparent physical insights and microstructural relevance, while machine learning methods hold great potential for managing complexity and uncertainty. Integrating the key physical framework of the proposed model with machine learning techniques presents an important direction for future study.
Besides, the numerical implementation of this study is achieved by the User Material (UMAT) subroutine in the Abaqus framework. Numerical simulations are conducted to evaluate the model’s capability to capture strain localization and strain softening, as well as to investigate the influences of microstructural information on these phenomena.
2 The Micromechanics-Based Softening Hyperelastic Model
Volokh [13,14] presented a softening hyperelasticity approach for modeling brittle and soft material failure. In this approach, a strain energy density of hyperelastic materials with softening is defined by
where
In previous studies [10,13,14], the strain energy density
where
where
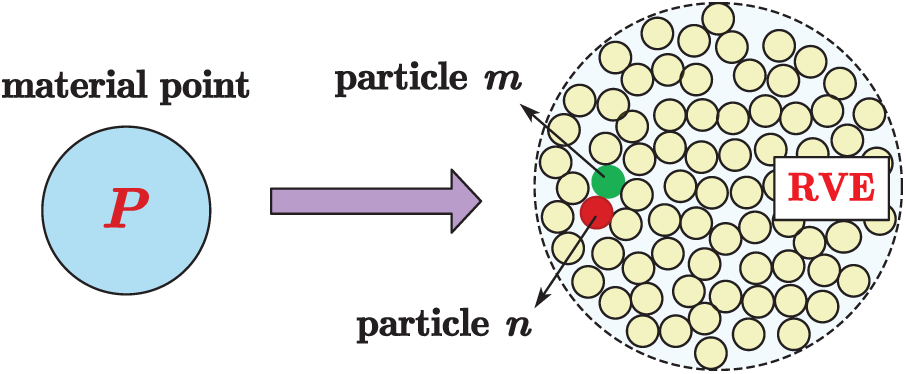
Figure 1: Schematic diagram for a material point P and its microstructural representative volume element V
In previous studies [6,23], a microscopic strain energy in the RVE is defined by
where
The macroscopic strain energy density
where
Then, the constitutive modulus tensor of the micromechanics-based softening hyperelastic model are obtained by
where
where
It is noted that
In the same way,
And for the spherical particle,
And the micromechanics-based softening hyperelastic constitutive relationship is obtained by
3 Identification of Constitutive Modulus Tensor
3.1 Isotropic Directional Density Distribution Function of Contacts
For an RVE
where
where
To incorporate more comprehensive microstructural details, this study considers three distinct three-dimensional microstructures characterized by different ordered particle arrangements, as shown in the previous study [29]. Each microstructure unit cell consists of a reference particle and a first ring of neighbors in contact. Fig. 2 shows the differences in particle arrangements, void ratios, and coordination numbers across these microstructures. Consequently, the three microstructures are categorized into one medium-dense and two dense configurations. It is noteworthy that this study initially considered a loose microstructure represented by a simple cubic arrangement; however, this configuration is deemed unrealistic due to its negligible resistance to shear deformation. Therefore, the loose microstructure is excluded from further analysis in this study. The medium-dense microstructure exhibits a hexagonal close-packed arrangement in the x-y plane and a cubic arrangement in x-z and y-z planes. The monodisperse dense microstructure is a hexagonal close-packed arrangement throughout. To construct the bidisperse dense microstructure, smaller particles are introduced to fill the voids in a simple cubic arrangement. These smaller particles, with a radius of
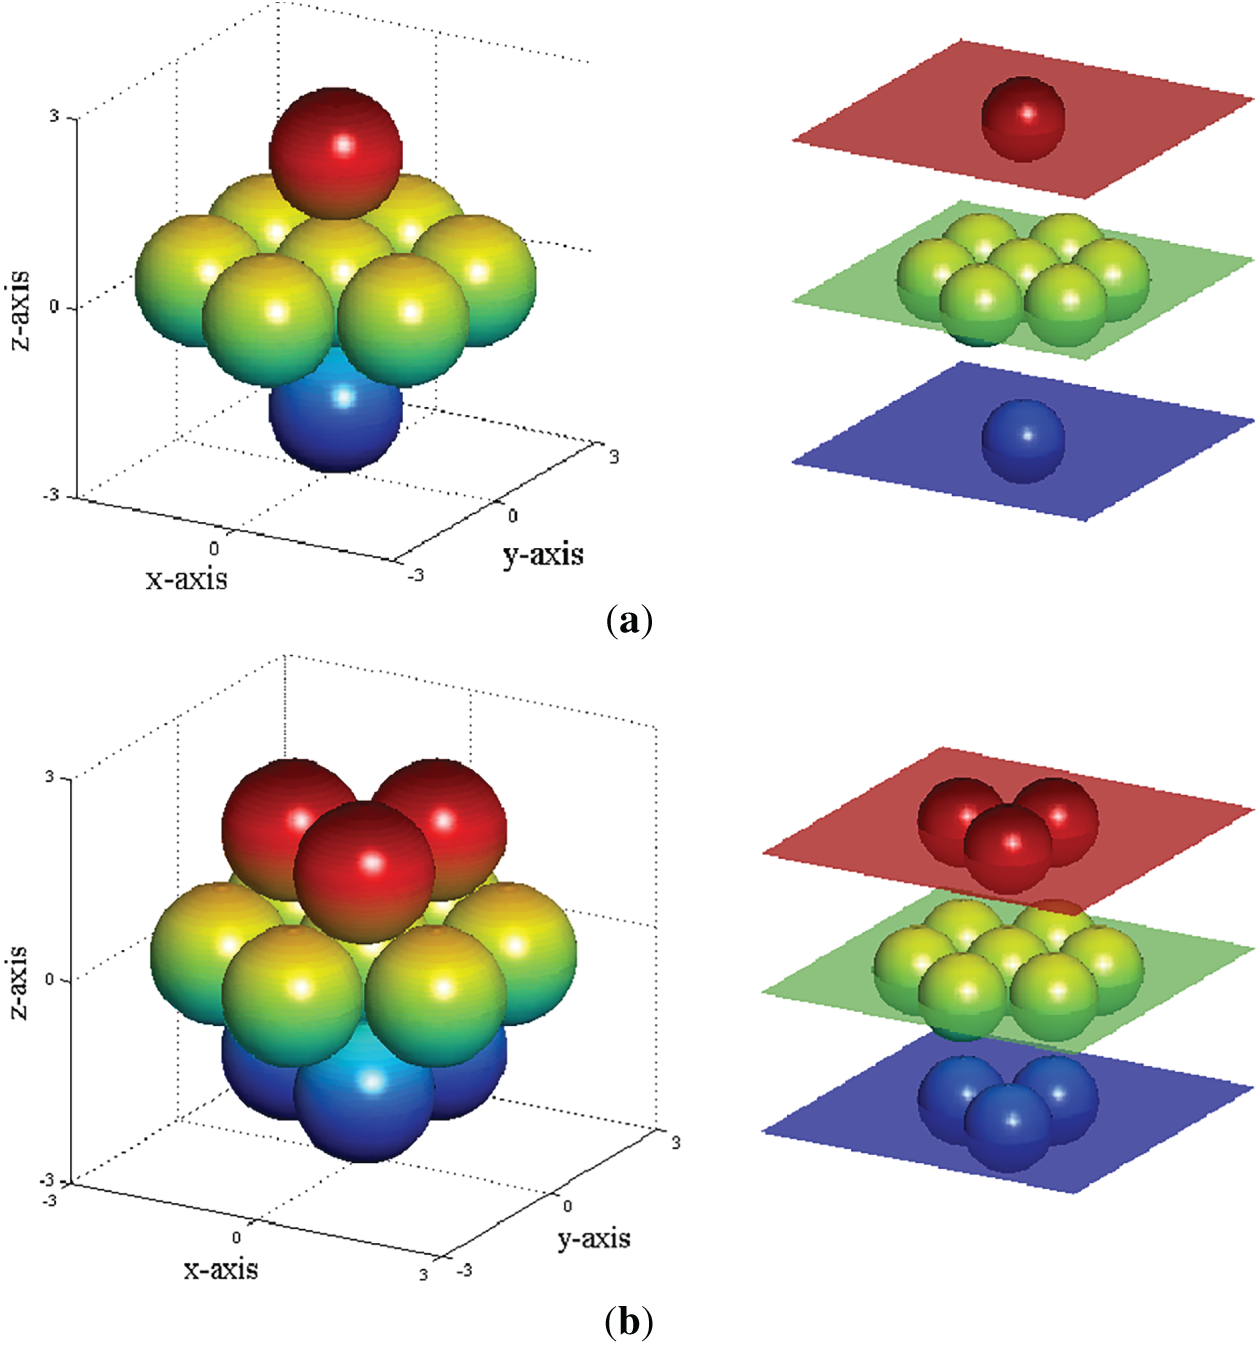
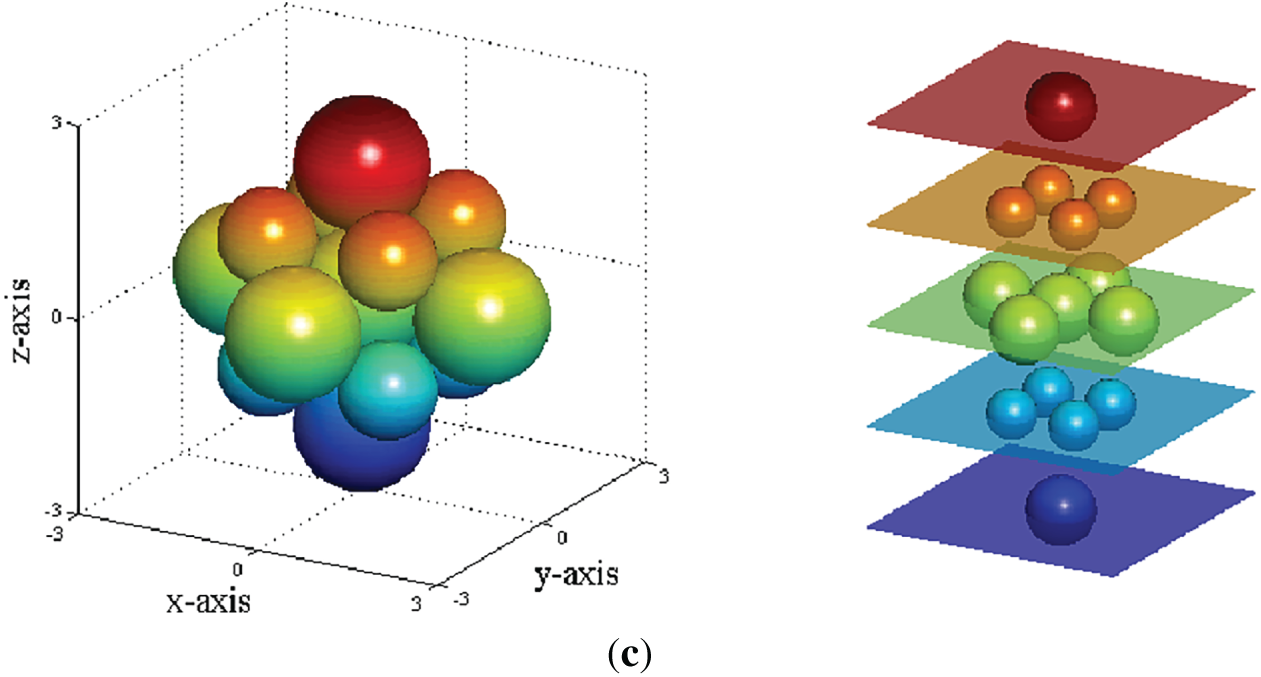
Figure 2: Schematic diagram for cells of three microstructures (a) cell of medium dense microstructure (b) cell of monodisperse dense microstructure (c) cell of bidisperse dense microstructure

Then, the constitutive modulus tensors of these granular materials with different microstructures can be obtained by directly solving the discrete summations as shown in Eq. (17), and the derivation process is provided in Appendix A. The constitutive modulus tensors are derived and presented as follows.
(1) Medium dense microstructure
(2) Monodisperse dense microstructure
(3) Bidisperse dense microstructure
4 Critical State for the Micromechanics-Based Softening Hyperelastic Model
The micromechanics-based softening hyperelastic model derived above is based on the softening mechanism introduced by Volokh in Eq. (1); however, this softening mechanism is more applicable to brittle materials. Actually, it has been proven that granular materials like sands and soils have a critical state and residual strength [30]. Therefore, the mechanism that can describe the critical state and residual strength should be incorporated into the micromechanics-based softening hyperelastic model for granular materials. Then, a stress decomposition mechanism is proposed in Eq. (21), which states that the total stress is the sum of the stresses from the micromechanics-based linear and softening hyperelastic models.
where
in which
The micromechanics-based softening hyperelastic model is performed on Abaqus, and a user-defined material program is coded by the UMAT subroutine interface, and the numerical implementation process is given in Appendix B. The numerical simulations focus on the following issues: (1) capacity of modeling strain localization and strain softening for granular materials by the micromechanics-based softening hyperelastic model; (2) influences of softening factor, microstructures, and micro-/macroscopic parameters; (3) mesh sensitivity analysis; (4) simulation of slope instability.
5.1 Strain Localization and Strain Softening of Granular Materials Based on Isotropic Directional Density Distribution of Contacts
The numerical simulations concern a rectangular plate with a size of 0.6 m × 0.8 m (Fig. 3a), and an eight-node iso-parametric element with four integration points is used for the plane strain problem (Fig. 3b). The plate is subjected to compression under displacement-controlled loading with 30 mm displacement on the top. Nodes on the bottom boundaries are fixed, and those on the left and right boundaries are free. The material and microstructural parameters of the presented model are set in Table 2. And the plate is meshed by 24 × 32 in this example.
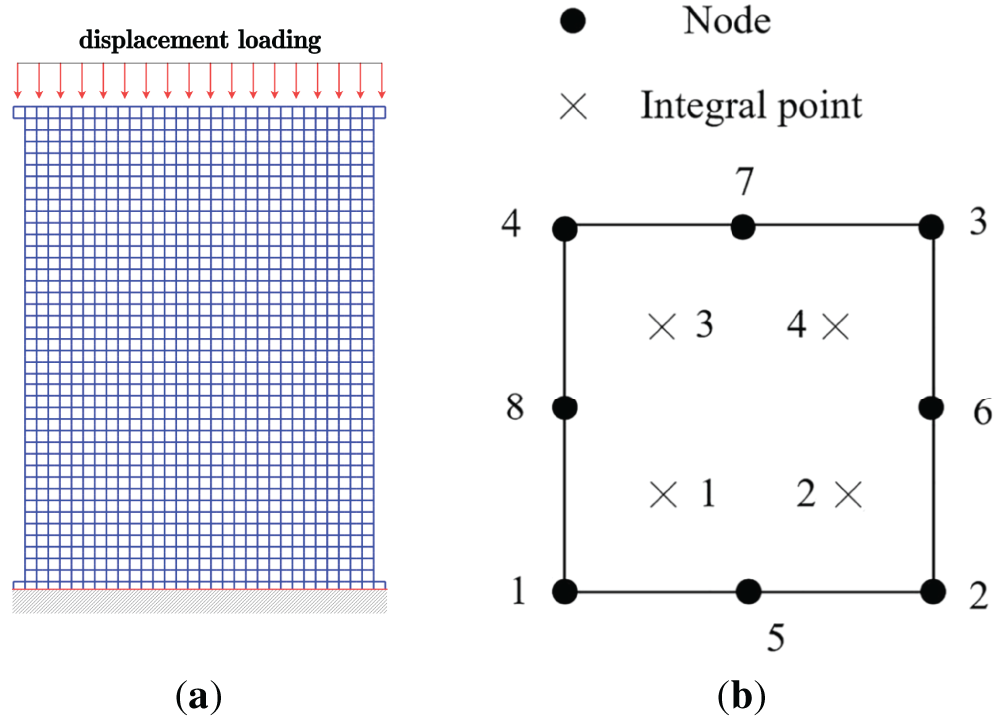
Figure 3: (a) Finite element mesh (b) plane strain element for the plate model
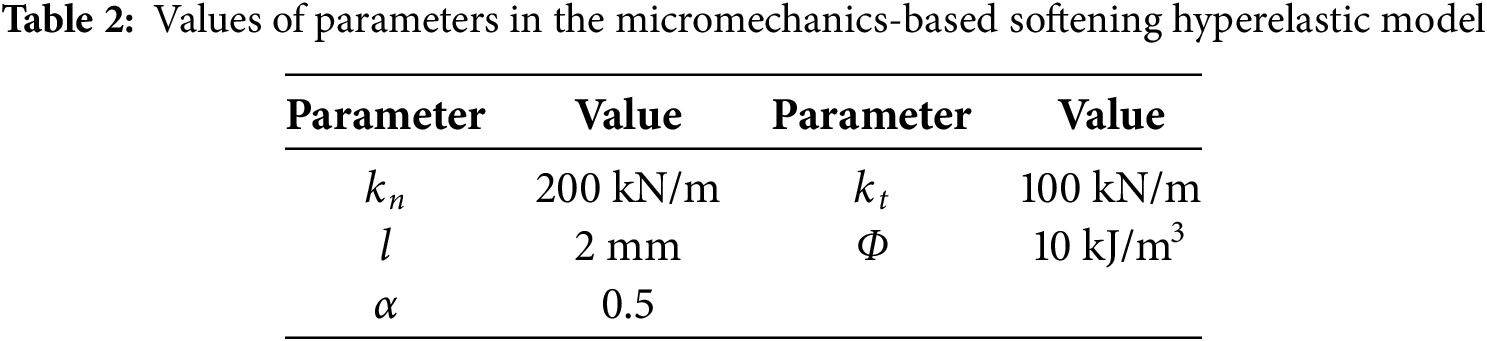
Fig. 4 illustrates the evolution process of the force-displacement curve strain localization of granular materials with isotropic directional contact density distribution simulated by the micromechanics-based softening hyperelastic model. The force-displacement curve shows a linear elastic stage, a hardening stage, a softening stage, and a critical state with the residual strength of approximately 661 kPa. This indicates that the critical state situation corresponds to geomaterials like dense sands and soils. The strain localization occurs during the hardening stage, prior to the ultimate strength, at a loading displacement of approximately 7.2 mm, corresponding to an axial strain of 0.9% (see Phase A in Fig. 4). It initiates at the four corners of the plate. As the displacement loading increases, it gradually spreads from the corners towards the center of the plate, ultimately forming a continuous X-shaped shear band with an inclination angle of approximately
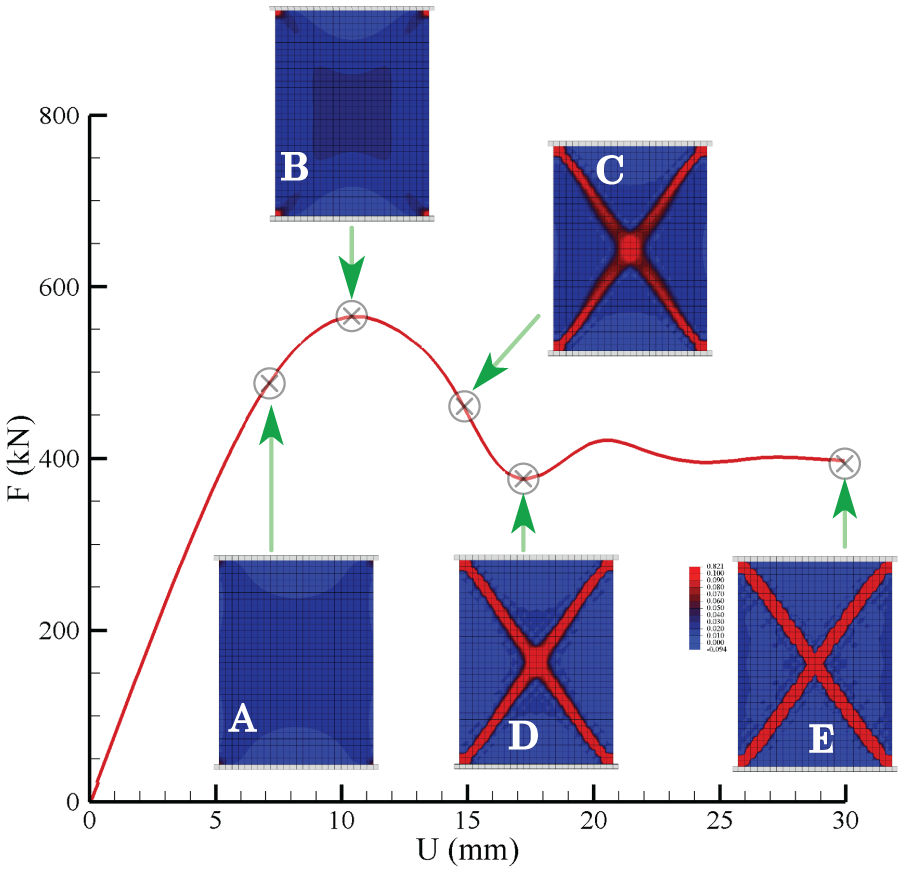
Figure 4: Evolution process of the force-displacement curve strain localization
Furthermore, to ascertain the validity of the proposed model, a comparative analysis is conducted with the results of the micromechanics-based softening hyperelastic model, the macro-scale models, and the experiment.
(1) Comparison with macro-scale Volokh softening hyperelastic model and Abaqus Drucker-Prager (DP) model
The comprehensive comparison ensures the model’s reliability in accurately representing the relevant mechanical behaviors. It is noteworthy that microscopic parameters used in this study can be identified as reported by Xiu and Chu [31]. Therefore, this study can obtain bulk modulus and shear modulus for the macro-scale Volokh softening hyperelastic model and the elastic modulus and Poisson’s ratio for the Abaqus DP model, as given in Table 3 below. However, the remaining elasto-plastic DP parameters cannot be directly identified from the microscopic ones. Consequently, these additional elasto-plastic parameters for the DP model, including the friction angle, dilatancy angle, initial yield stress, and subsequent yield stress, are also provided in Table 3 for the sake of completeness and clarity.
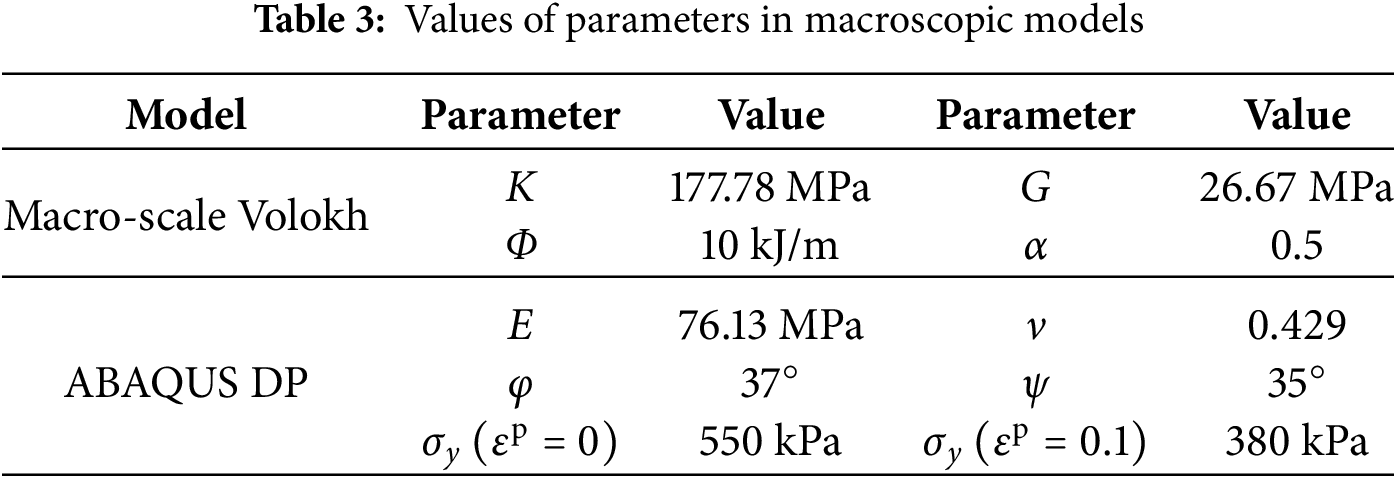
Figs. 5 and 6 respectively depict force-displacement curves and equivalent strain distributions simulated by the aforementioned models. It is evident from the comparison that the equivalent strain distributions and force-displacement curves simulated by the micromechanics-based softening hyperelastic model are nearly identical to those simulated by the macro-scale Volokh softening hyperelastic one. This similarity stems from the direct correlation between the macroscopic and microscopic parameters in both models. It is noted that the microscopic parameters are not related to the elasto-plastic DP parameters. Consequently, the appropriate values of the elasto-plastic DP parameters are obtained, as listed in Table 3, to achieve a force-displacement curve that closely approximates the one simulated by the micromechanics-based softening hyperelastic model. The DP force-displacement curve has identical elastic stage and ultimate strength, although the in-elastic hardening stage and the post-peak softening behavior do not align perfectly; however, it achieves the same residual strength. As a result, the equivalent strain distribution within the Abaqus DP model has a different mode, characterized by a 10% wider shear band and a higher degree of strain localization. Therefore, the presented micromechanics-based softening hyperelastic model is capable of simulating strain localization and strain softening of granular materials, with reliable results. Compared with complex elasto-plastic models, its numerical implementation is notably simpler. The most significant advantage of this model lies in its ability to consider the influences of microstructural information on macroscopic mechanical behaviors of granular materials, which will be discussed in detail in the subsequent section.
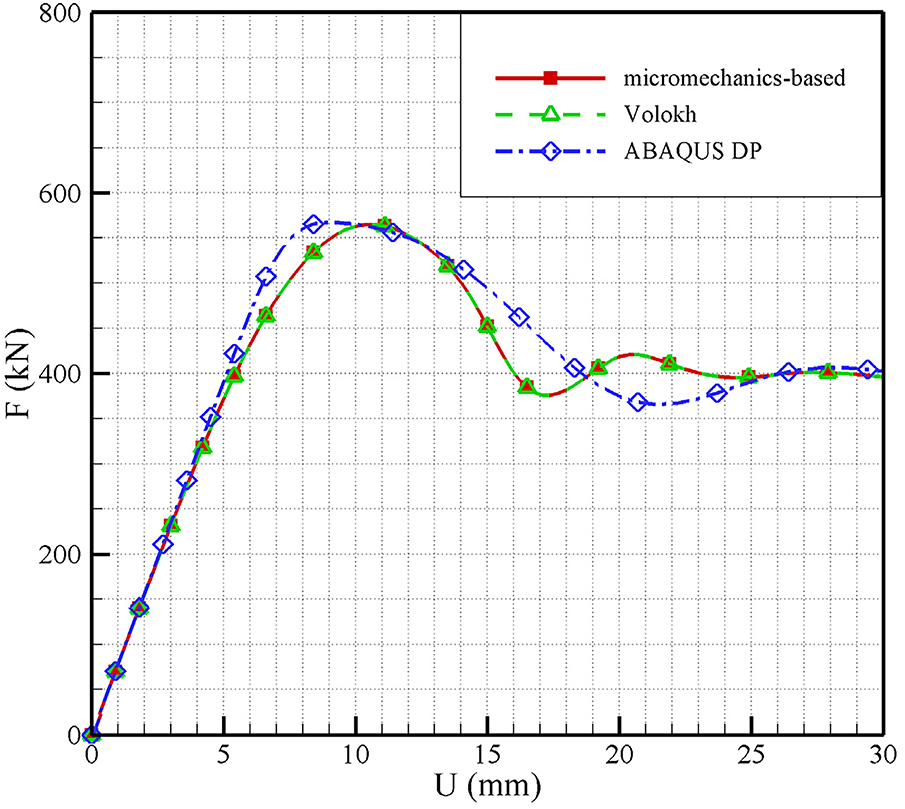
Figure 5: Force-displacement curves simulated by different models

Figure 6: Equivalent strain distributions simulated by (a) micromechanics-based softening hyperelastic model (b) macro-scale Volokh softening hyperelastic model (c) Abaqus Drucker-Prager model
(2) Comparison with the experiment
To further validate the reliability of the presented model, its results are compared with those of a biaxial test. The experimental granular system comprised glass beads with a diameter of 0.3 mm in a membrane of dimensions 85 mm height, 55 mm width, and 25 mm depth, as shown in Fig. 7a [32]. The confining pressure is fixed at 30 kPa. The stiffness of the entire system has been tested in a Hertz contact configuration and is found to be 730 kN/m. Therefore, the normal contact stiffness parameter in the numerical simulation should be valued as
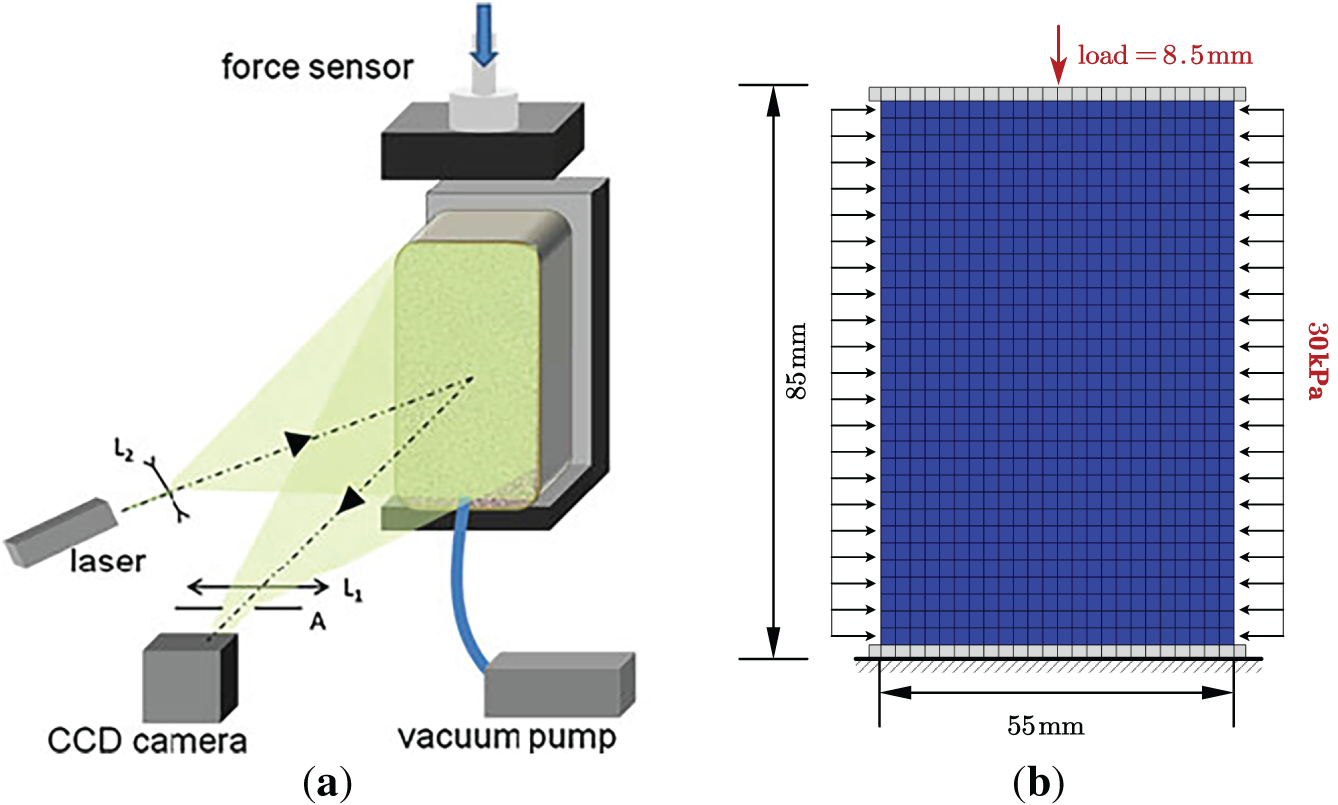
Figure 7: Schematics for a biaxial test by (a) experiment (b) numerical simulation
Figs. 8 and 9 present a direct comparison of stress-strain relationship curves and equivalent strain distributions between the model’s numerical predictions and the physical experimental results. It is important to note that, after using the micro-parameters directly derived from the experimental setup, the model required the specific macroscopic softening parameters, namely
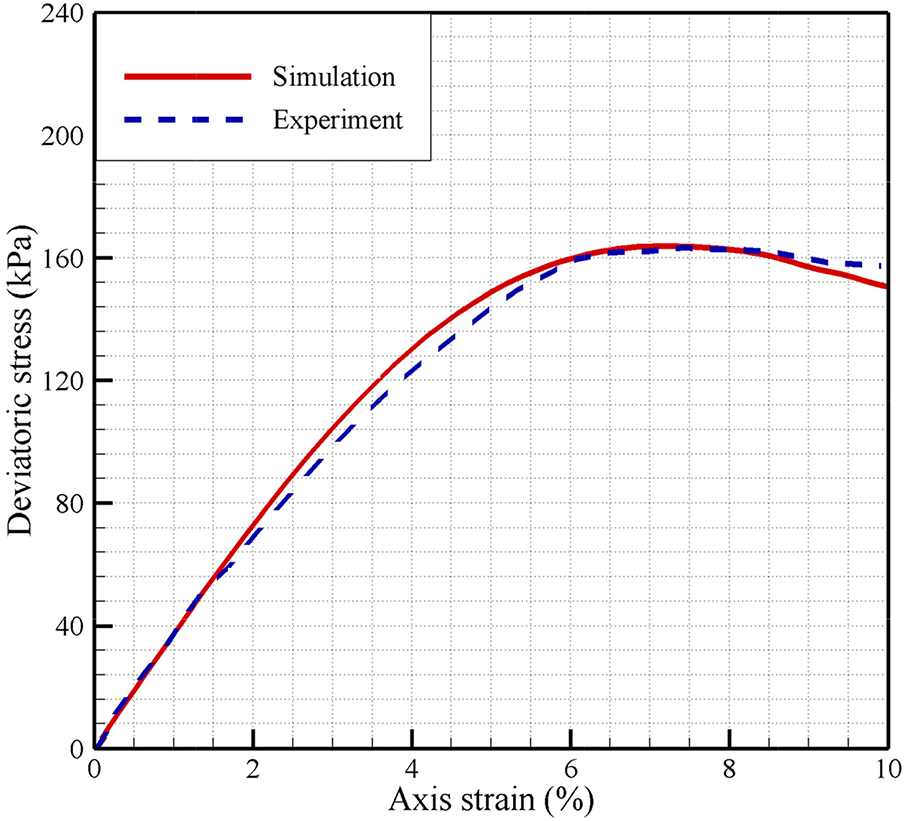
Figure 8: Stress-strain relationship curves predicted by the experiment and the numerical simulation
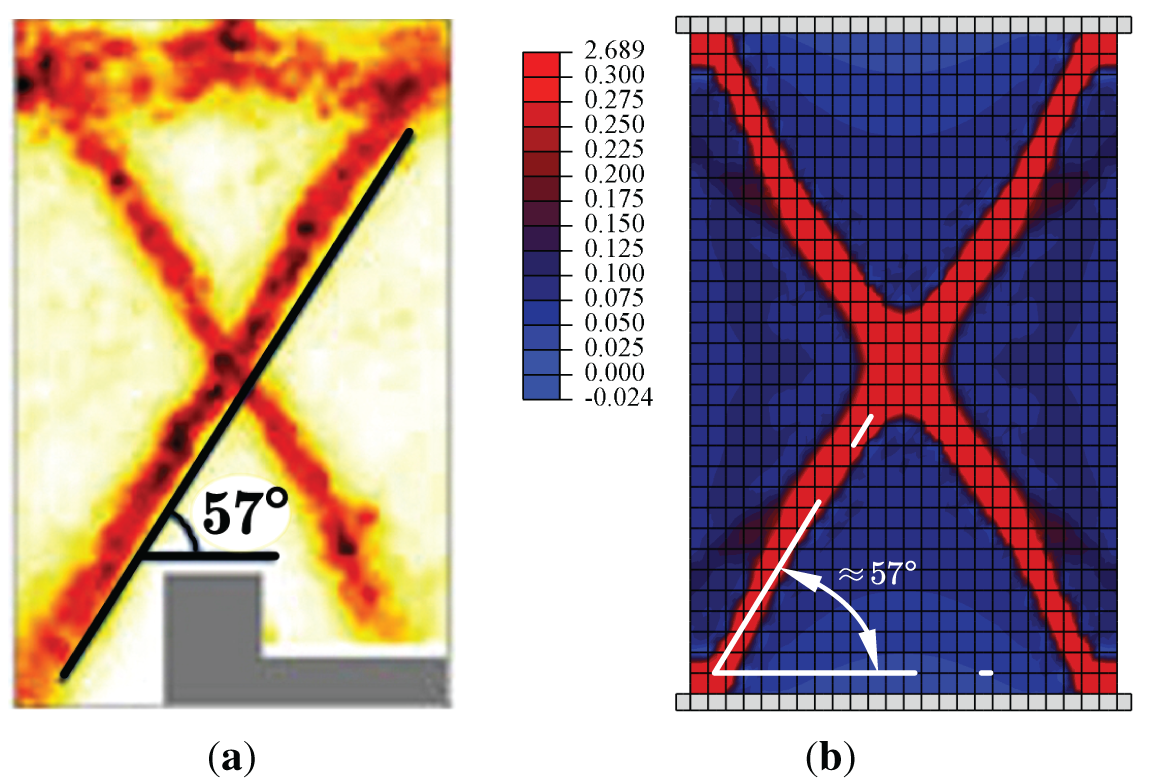
Figure 9: Equivalent strain distributions predicted by (a) the experiment [32] (b) the micromechanics-based softening hyperelastic model
5.2 Influences of Softening Factor on Strain Localization and Strain Softening
The softening factor
Fig. 10 shows force-displacement curves under different softening factors. It can be observed that all the force-displacement curves coincide before 0.8% axial strain, which is the linear elastic stage. Subsequently, as the axial loading continues, cases with a smaller softening factor

Figure 10: Force-displacement curves simulated by the micromechanics-based softening hyperelastic model with different softening factors
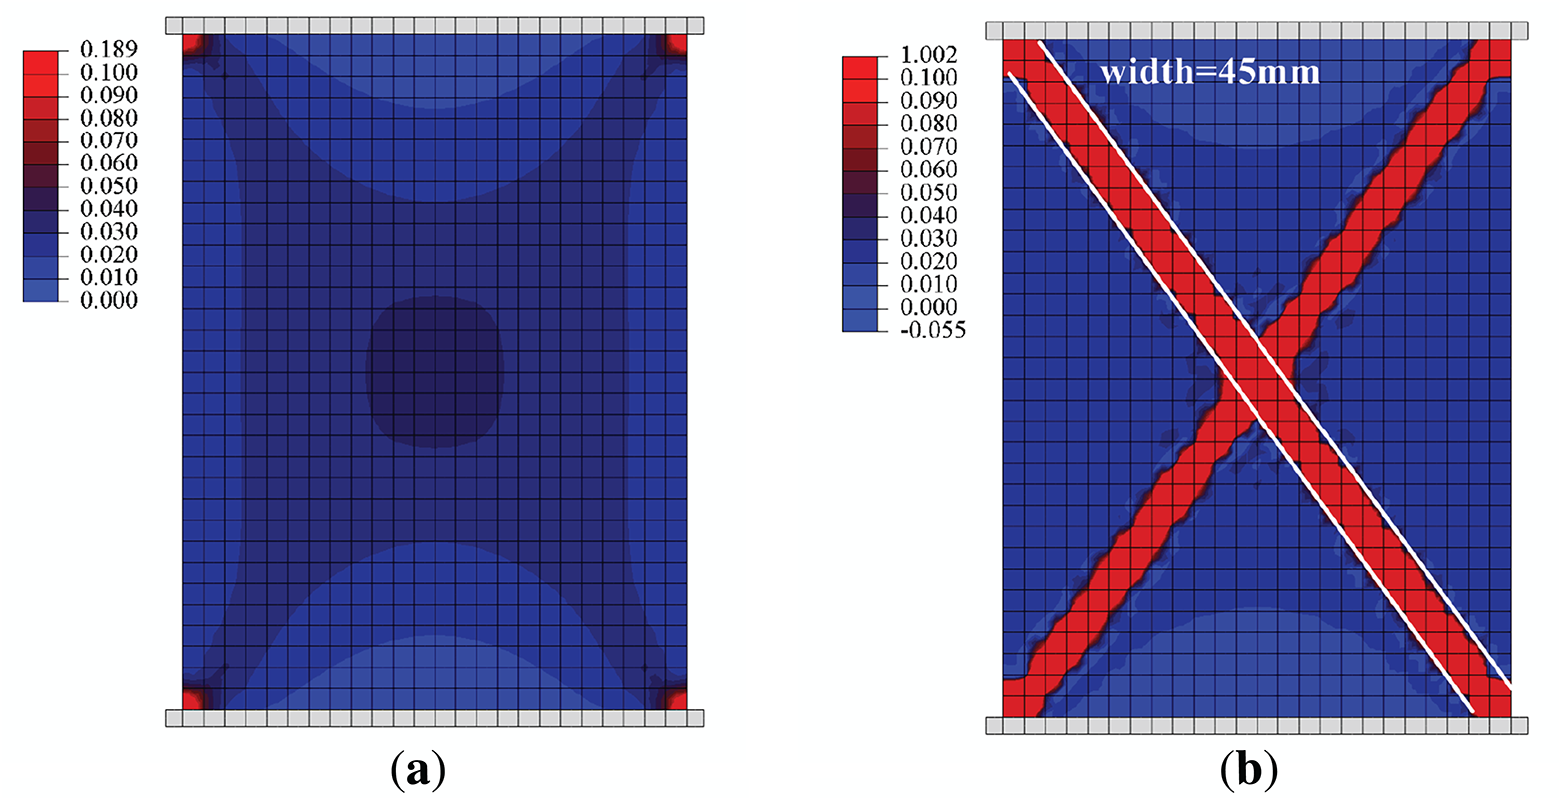
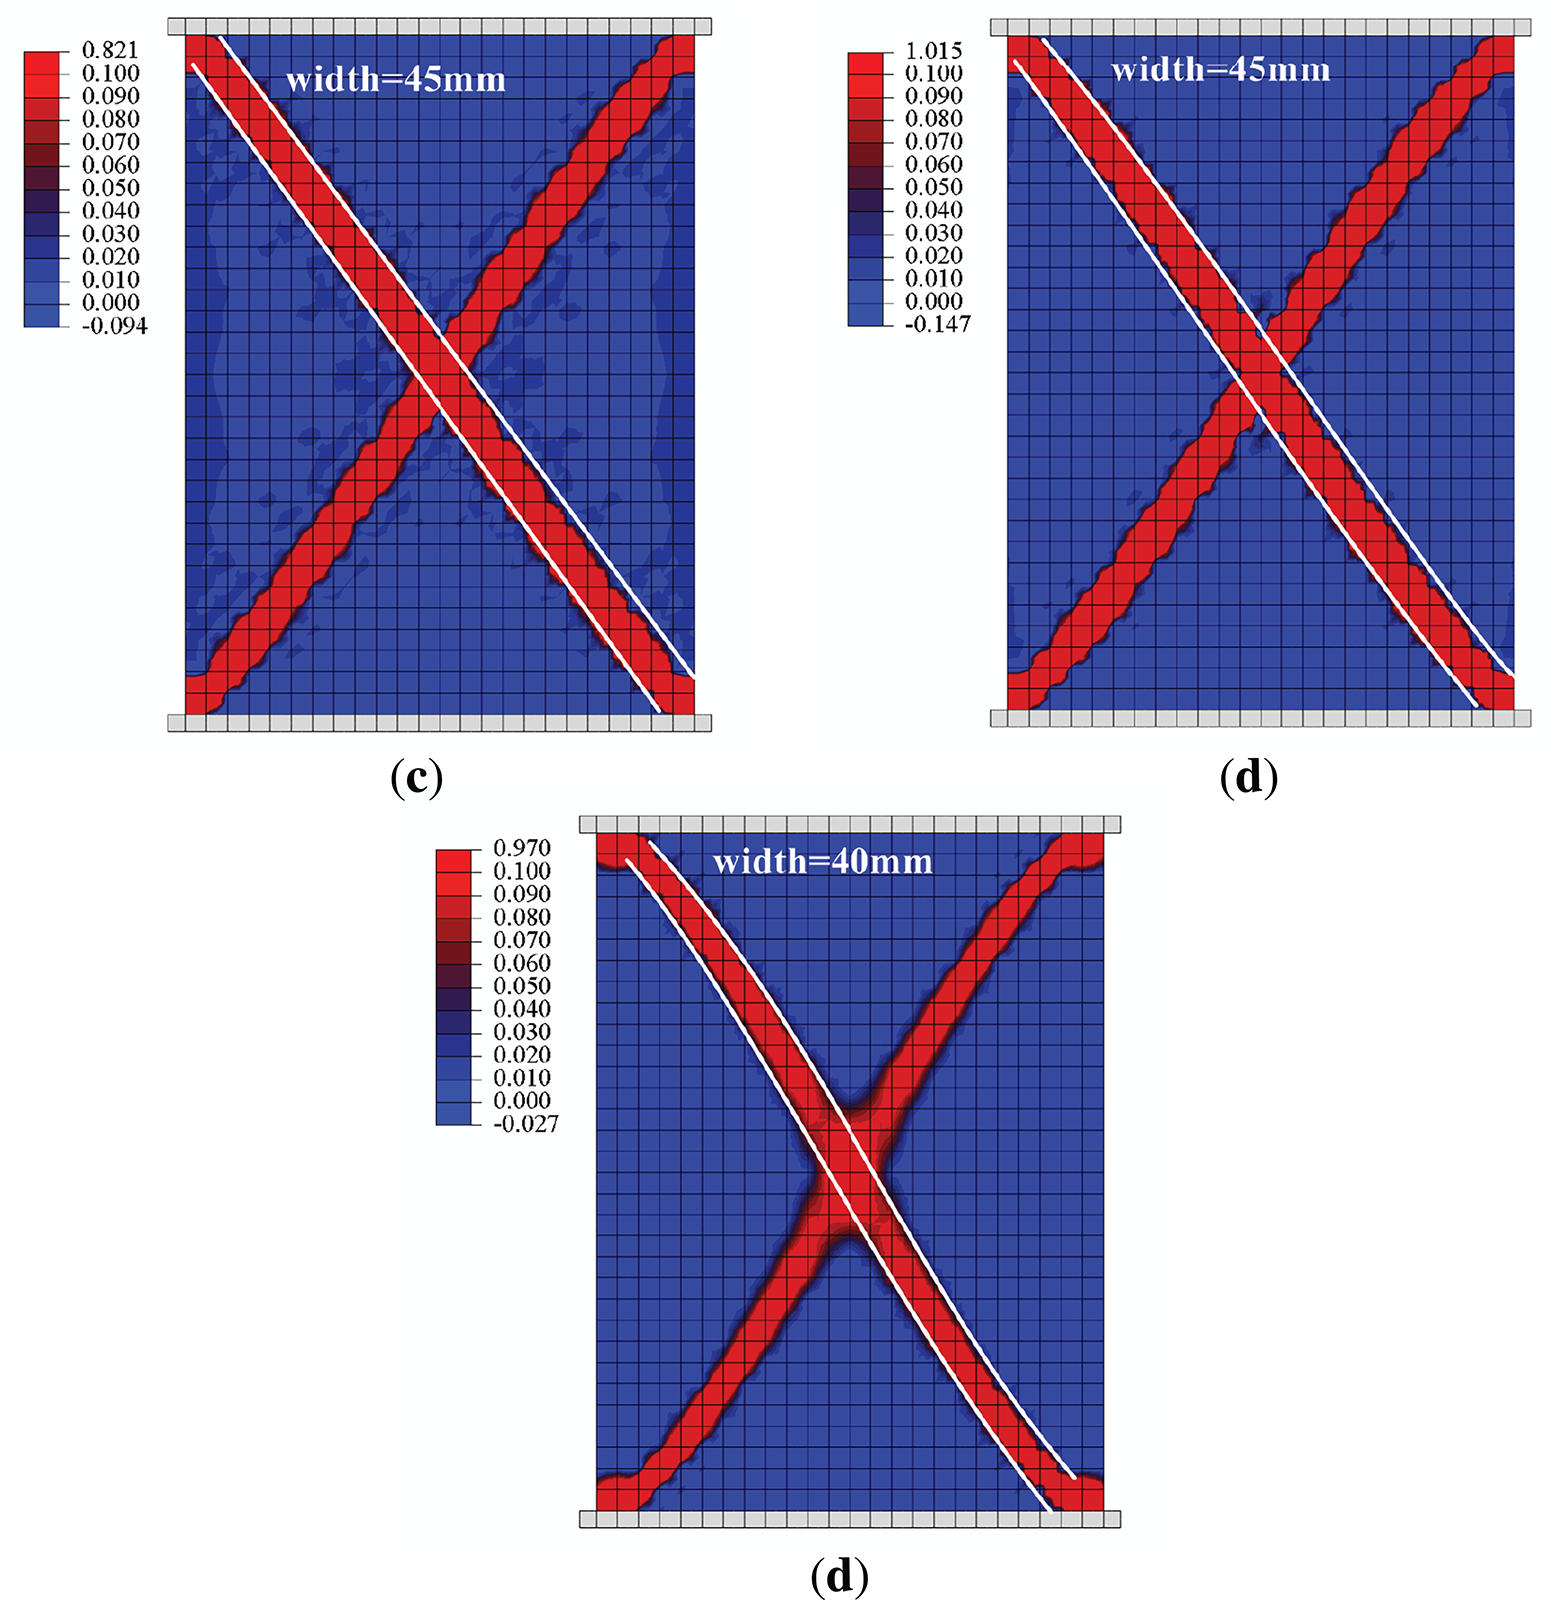
Figure 11: Equivalent strain distributions simulated by the micromechanics-based softening hyperelastic model with different softening factors (a)
Therefore, in order to characterize the mechanical behaviors of granular materials with a critical state, it is recommended that the value of the softening factor
5.3 Influences of Microstructures on Strain Localization and Strain Softening
Fig. 2 shows three distinct and specific microstructures in granular materials. These microstructures, each with its own unique arrangement and configuration of particles, represent different states that granular materials can assume. The microstructure plays a pivotal role in the strength and deformation behavior of granular materials. This section has an in-depth discussion about the influences of these microstructures on strain localization and strain softening. Meanwhile, the results are compared with those of the case based on the isotropic directional distribution density of contacts mentioned previously. The parameters utilized in this analysis remain consistent with those in Table 2.
Figs. 12 and 13 respectively show force-displacement curves and equivalent strain distributions of granular materials with isotropic directional contact distribution density and different microstructures, simulated by the micromechanics-based softening hyperelastic model. As can be observed from Fig. 12, all the force-displacement curves can successively exhibit the linear elasticity, hardening, softening stages, and the critical state. However, the ultimate strengths and residual strengths under various cases are different. The case of isotropic directional contact distribution density (red line) has the maximum ultimate strength (706 kPa) and residual strength (661 kPa), followed by the case of monodisperse dense microstructure (blue line) and the case of bidisperse dense microstructure (black line) in turn. While the case of medium dense microstructure (green line) has the minimum ultimate strength (557 kPa) and residual strength (399 kPa). This result is presumed to be related to the porosity of the microstructure. The assumption of isotropic directional distribution density of contacts eliminates information about voids in microstructures. As a consequence, it has the maximum strength. Among the other three specific microstructures, their ultimate and residual strength are inversely proportional to the porosity of the microstructure. When the porosity is at its minimum, i.e., 26% in Table 1, the case of monodisperse dense microstructure exhibits greater strength and is quite close to the case of the isotropic assumption.

Figure 12: Force-displacement curves of granular materials with isotropic directional distribution density of contacts and different microstructures simulated by the micromechanics-based softening hyperelastic model
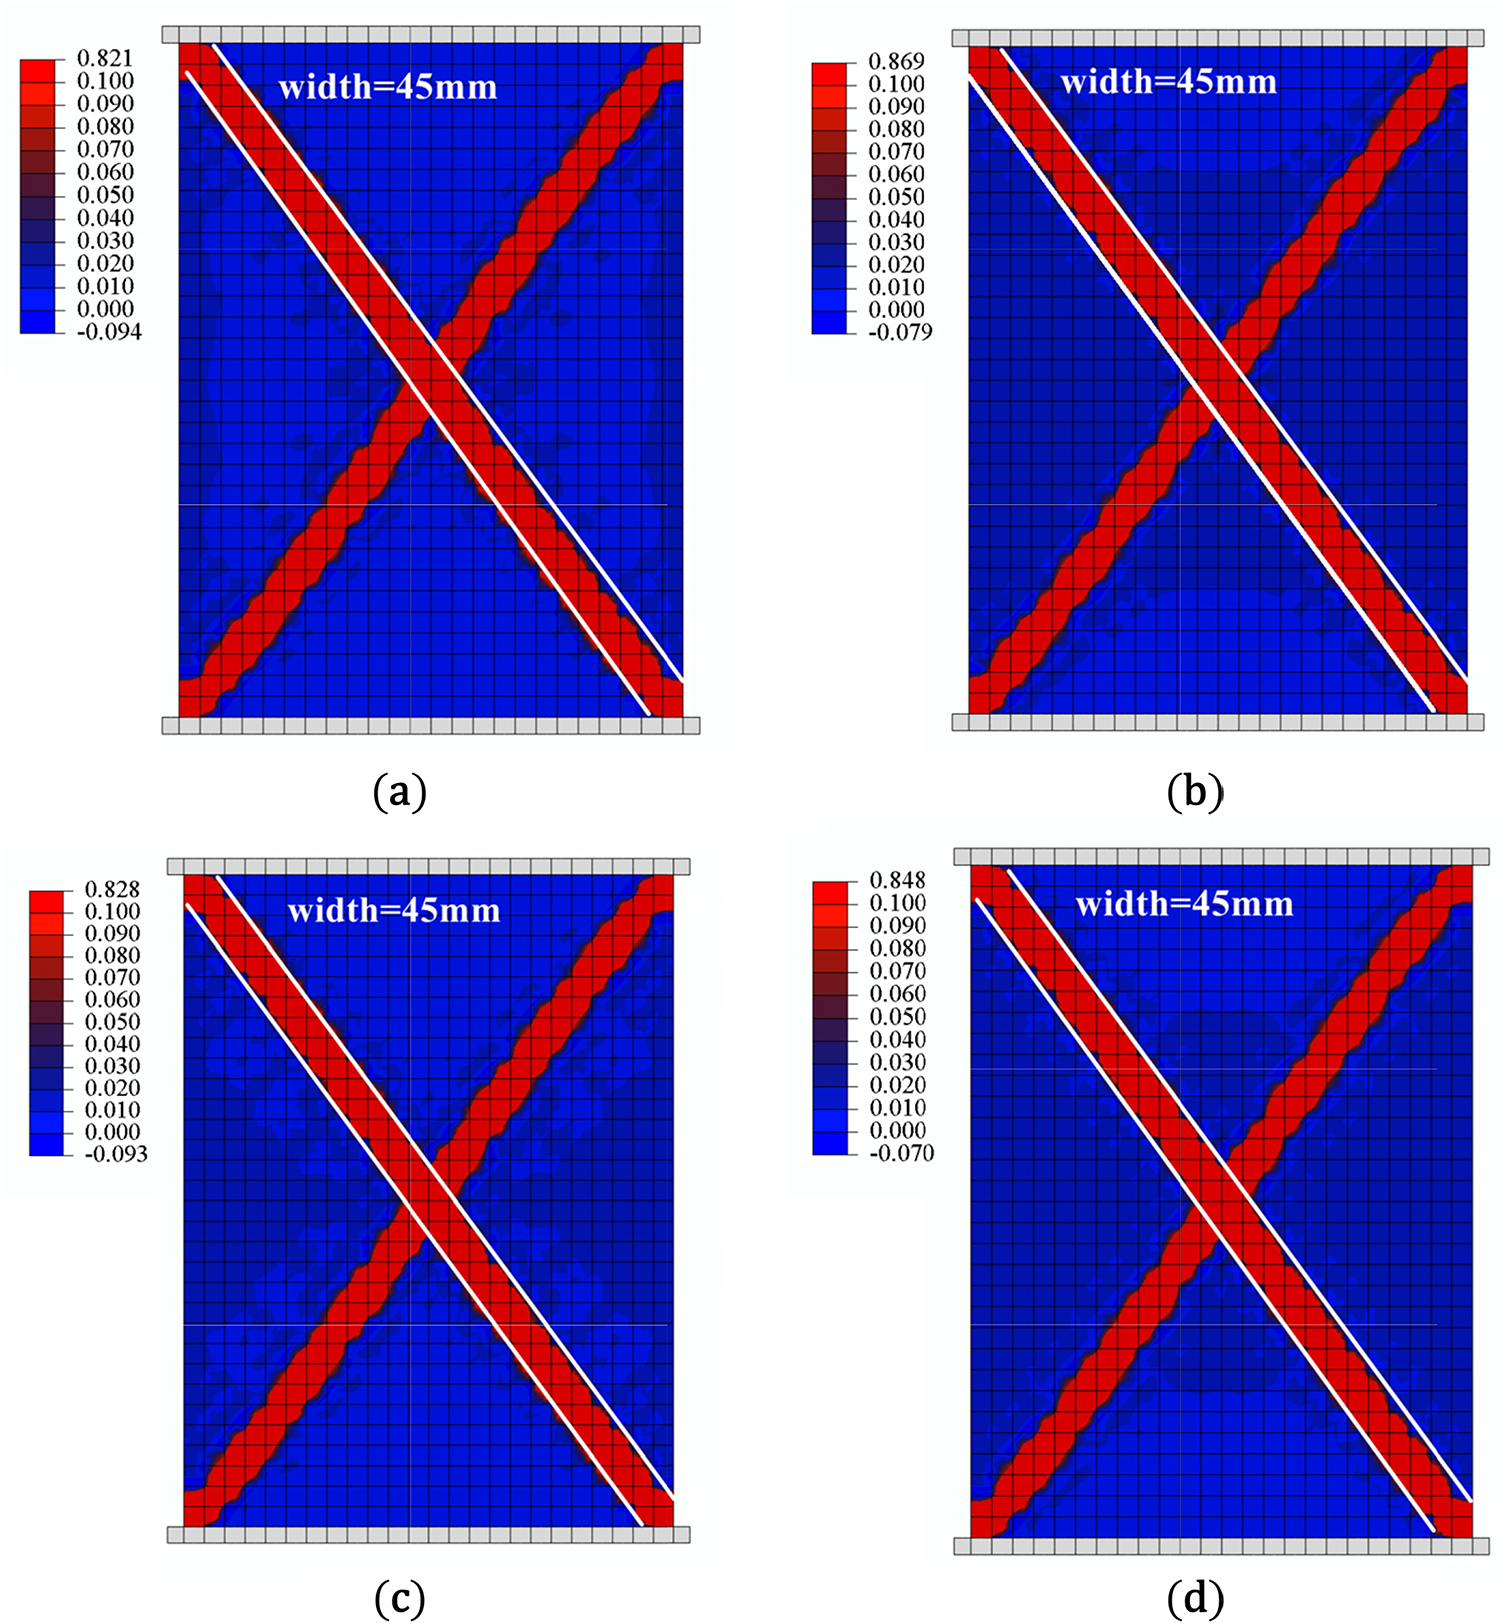
Figure 13: Equivalent strain distributions of granular materials with (a) isotropic directional density distribution of contacts (b) medium dense microstructure (c) monodisperse dense microstructure (d) bidisperse dense microstructure
Since all cases exhibit a critical state, the equivalent strain distributions as shown in Fig. 13 are quite similar. They all feature distinct X-shaped shear bands, with each shear band having a width of approximately 45 mm. However, the degree of localization is slightly different, which is consistent with the aforementioned rule regarding the force-displacement curves. Given that the case of medium dense microstructure has the minimum residual strength, it has the highest degree of localization, followed by the case of bidisperse dense microstructure, the case of monodisperse dense microstructure, and the case of isotropic assumption in turn.
It should be noted that the three microstructures in this paper are merely the most basic and easily constructed types of granular materials. In contrast, real granular materials (e.g., soils and rocks) possess extremely complex microstructures, featuring variations in particle size, shape, and arrangement. However, these complex microstructures can be regarded as being composed of simple and fundamental microstructural unit cells. Therefore, the investigation into the influences of the three proposed microstructures is also of great significance. It lays a foundation for subsequent studies on how complex microstructures affect macroscopic mechanical behaviors of granular materials.
5.4 Influences of Microscopic Parameters and Critical Failure Energy Density on Strain Localization and Strain Softening
This section discusses the influences of microscopic and macroscopic parameters in the micromechanics-based softening hyperelastic model on strain localization and strain softening, including contact stiffnesses, the particle size, and the critical failure energy density. And the micromechanics-based softening hyperelastic model is applied based on the isotropic directional density distribution of contacts.
5.4.1 The Influence of Ratio of Normal to Tangential Contact Stiffness
The normal and tangential contact stiffnesses are among the most important microscopic parameters for simulating and controlling the mechanical behaviors of granular materials. It is noteworthy that the normal contact stiffness is larger than the tangential contact stiffness [33], and the normal contact stiffness is typically set as twice the tangential contact stiffness in some numerical simulation studies [34]. To investigate the appropriate values and their influences for the normal and tangential contact stiffnesses, this study defines a ratio
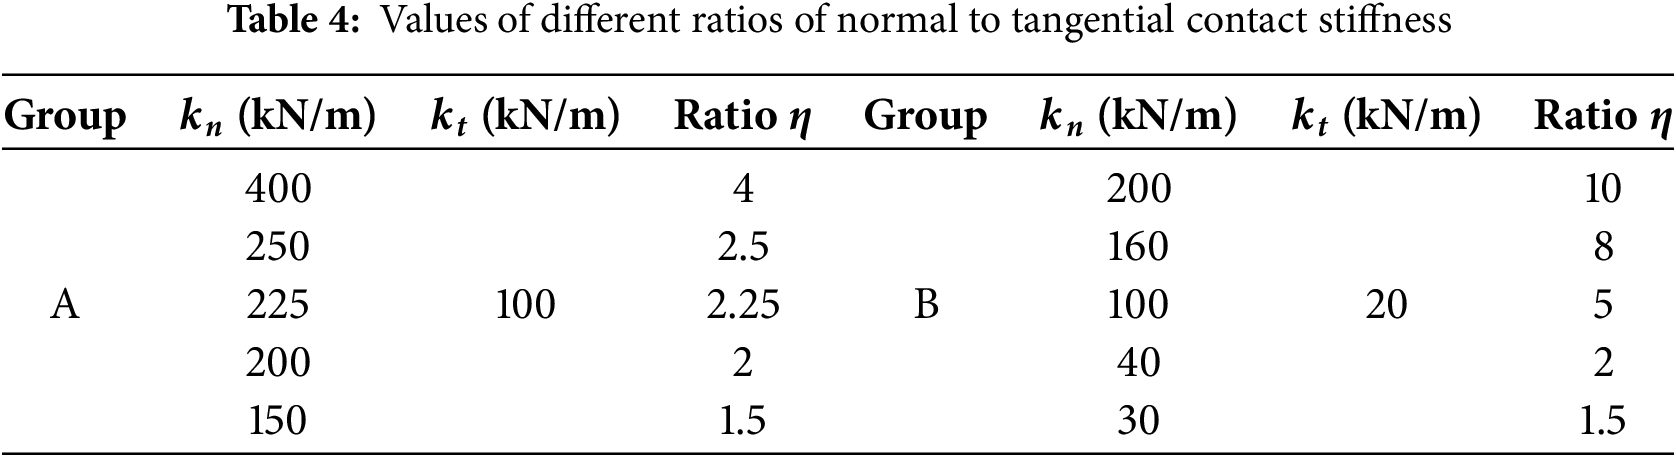
Fig. 14 gives force-displacement curves under different contact stiffness ratios
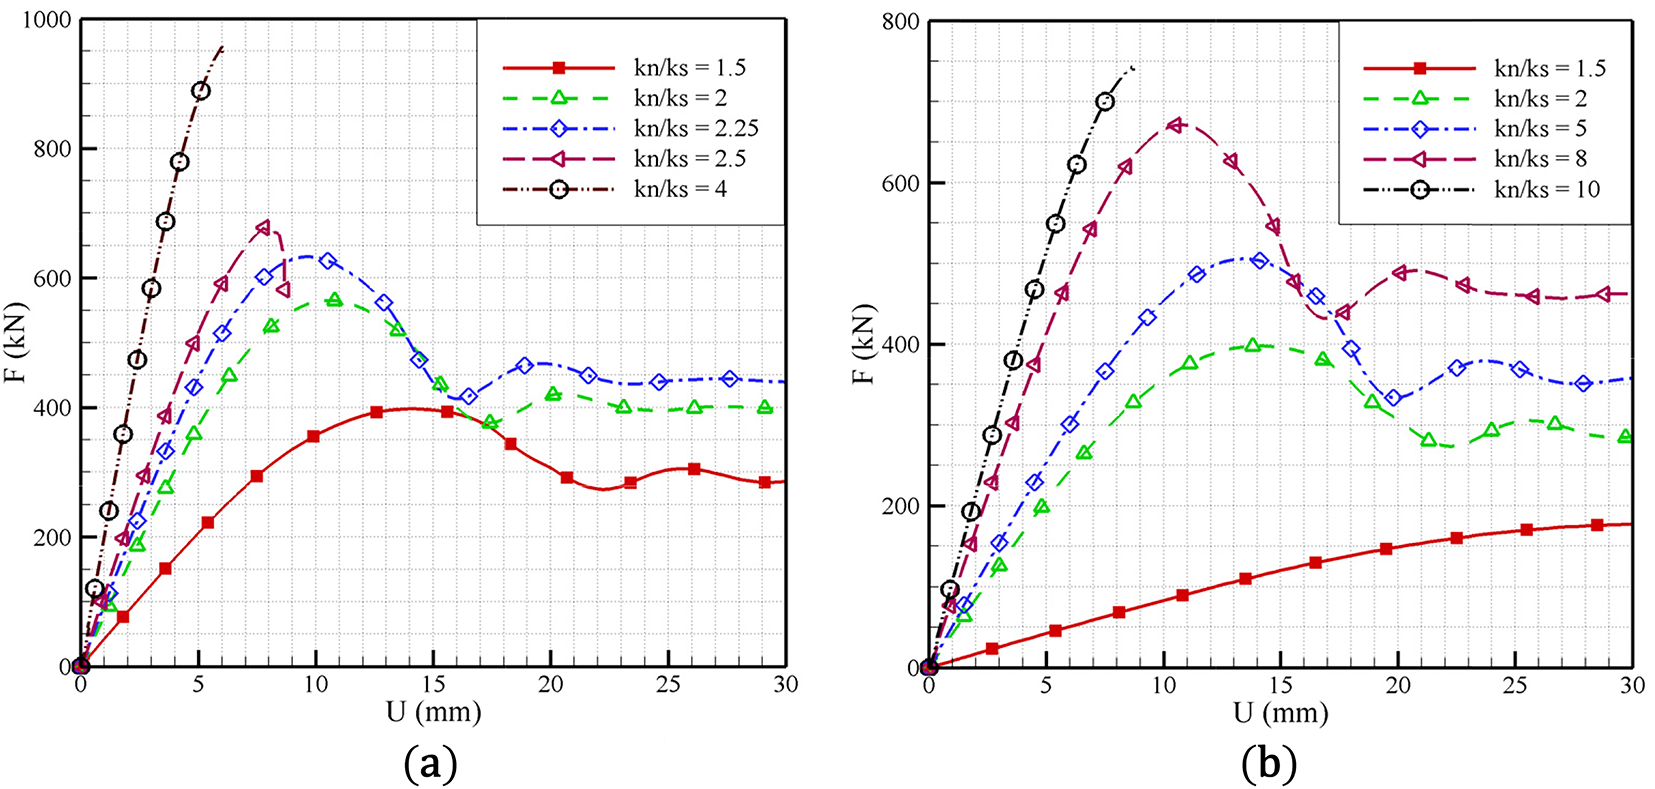
Figure 14: Force-displacement curves under different ratios of normal to tangential contact stiffness (a) group A:
Figs. 15 and 16 present equivalent strain distributions under different contact stiffness ratios for Group A and Group B in Table 4, respectively. In Fig. 15, X-shaped shear bands can be simulated when

Figure 15: Equivalent strain distributions under

Figure 16: Equivalent strain distributions under
Based on the comprehensive analysis, when the values of normal and tangential contact stiffnesses are generally higher, it is recommended that the contact stiffness ratio
5.4.2 The Influence of Internal Length
The internal length
It indicates that the characteristic length
Fig. 17 gives force-displacement curves under different internal lengths
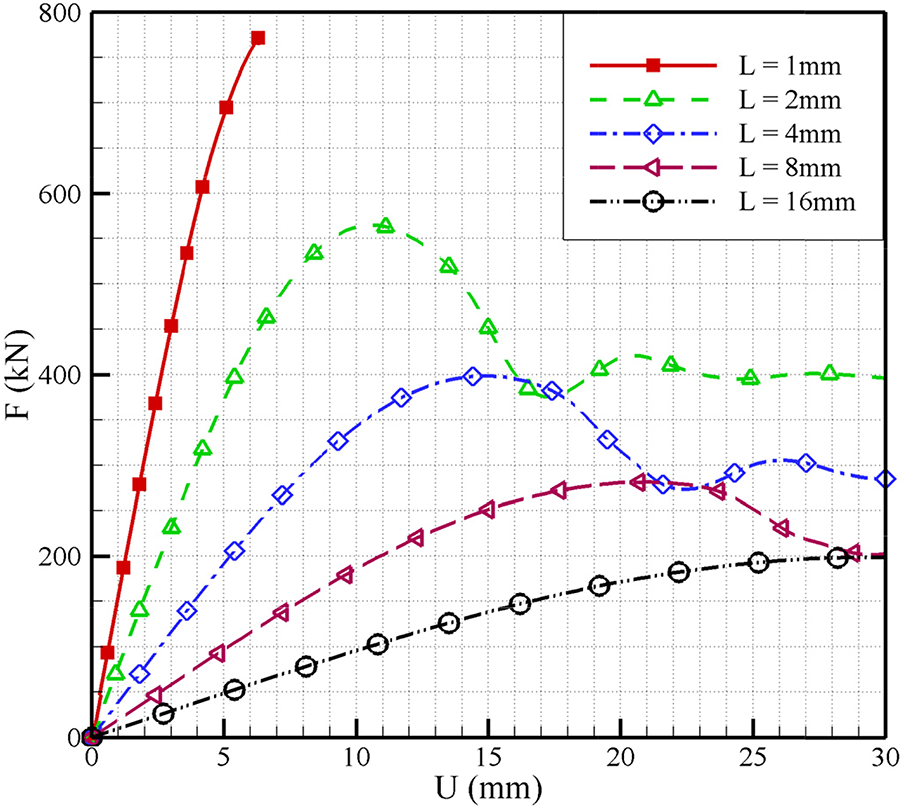
Figure 17: Force-displacement curves under different internal lengths
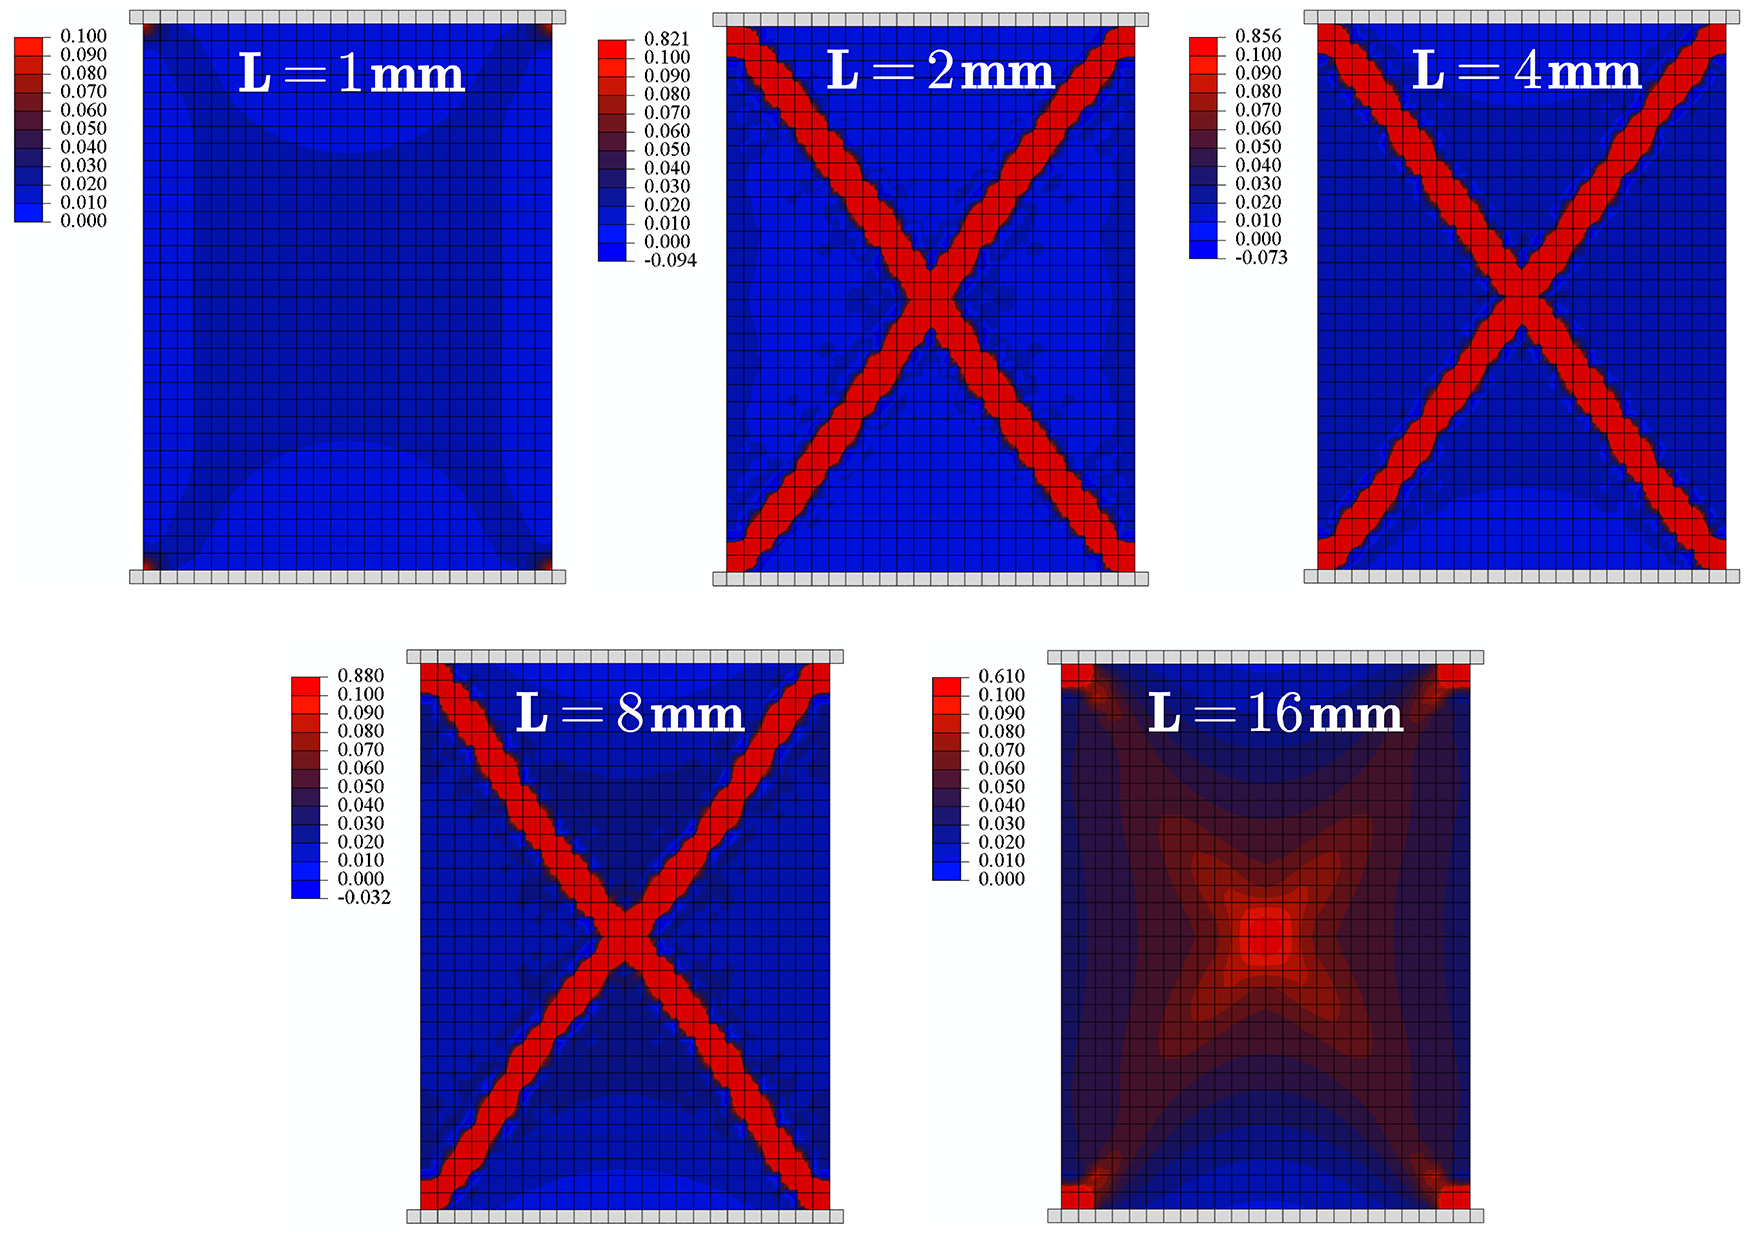
Figure 18: Equivalent strain distributions under different internal lengths
5.4.3 The Influence of Critical Failure Energy Density
The critical failure energy density
Figs. 19 and 20 present the force-displacement curves and equivalent strain distributions, respectively, simulated by the micromechanics-based softening hyperelastic model under different critical failure energy densities. The results demonstrate that
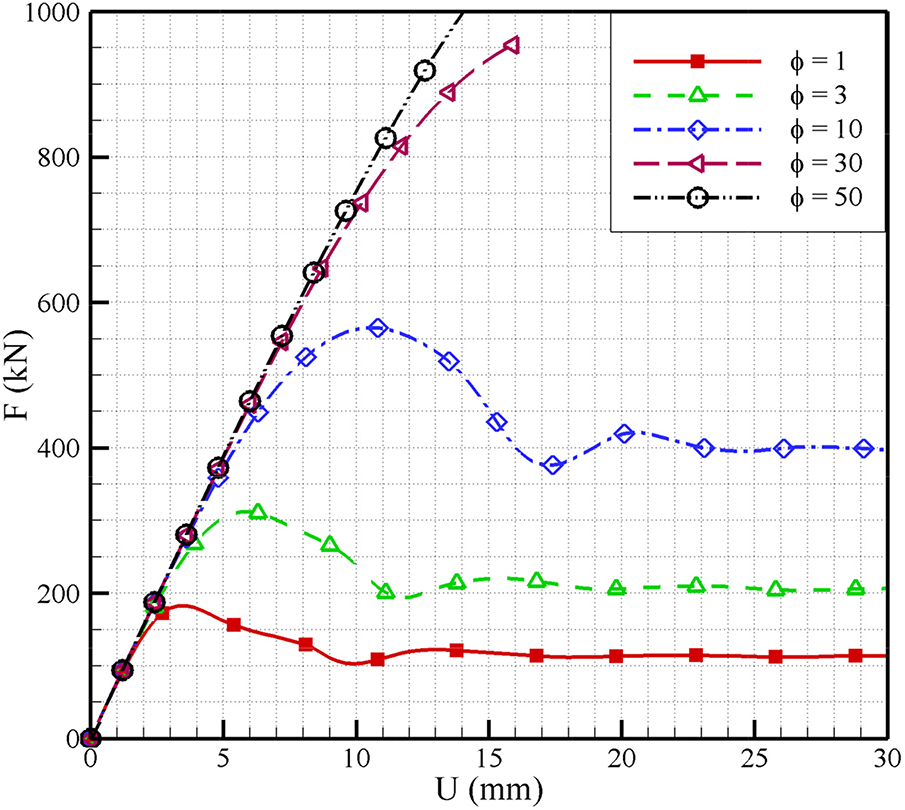
Figure 19: Force-displacement curves under different critical failure energy densities

Figure 20: Equivalent strain distributions under different critical failure energy densities
This study identifies that a value of
5.5 Mesh Independence Analysis
Owing to the existence of the internal length that describes the microstructural size of granular materials in this model, a regularization mechanism is provided, which helps to avoid pathological mesh dependency. In order to investigate the mesh independence of the proposed model, Fig. 21 gives four finite element meshes: 18 × 24, 24 × 32, 30 × 40 and 60 × 80. Parameters are used in Table 2.

Figure 21: Different finite element meshes for the plate model (a) 18 × 24 (b) 24 × 32 (c) 30 × 40 (d) 60 × 80
Fig. 22 shows force-displacement curves under four different meshes. For the coarsest mesh 18 × 24, the curve exhibits non-convergence after the linear elastic stage; therefore, strain localization cannot be presented simultaneously. As the mesh size decreases, all cases can basically converge to the same force-displacement curve. For further quantitative analysis, a relative error in the L2-norm for the load-displacement curves is proposed in this study. The result from the finest mesh (60 × 80) is taken as the reference solution. The relative L2 error
where

Figure 22: Force-displacement curves under different meshes
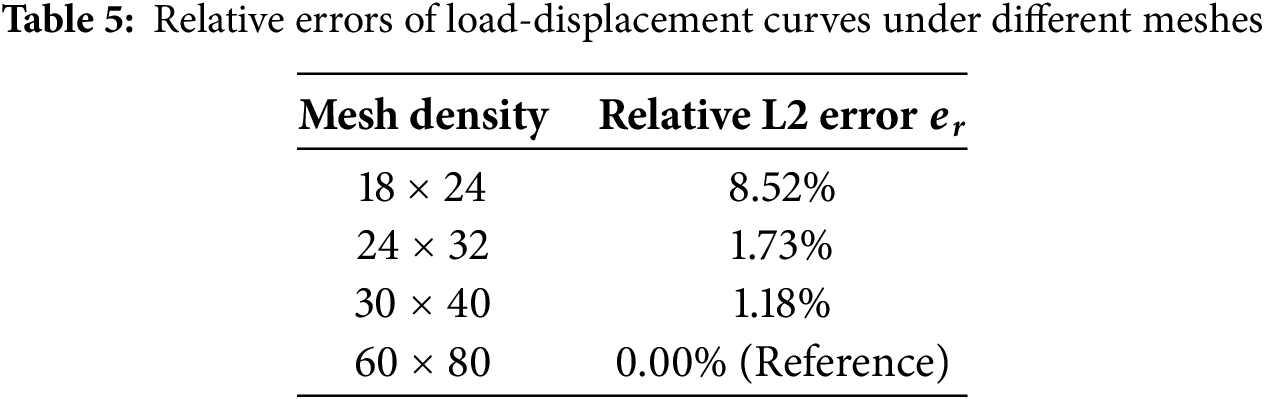
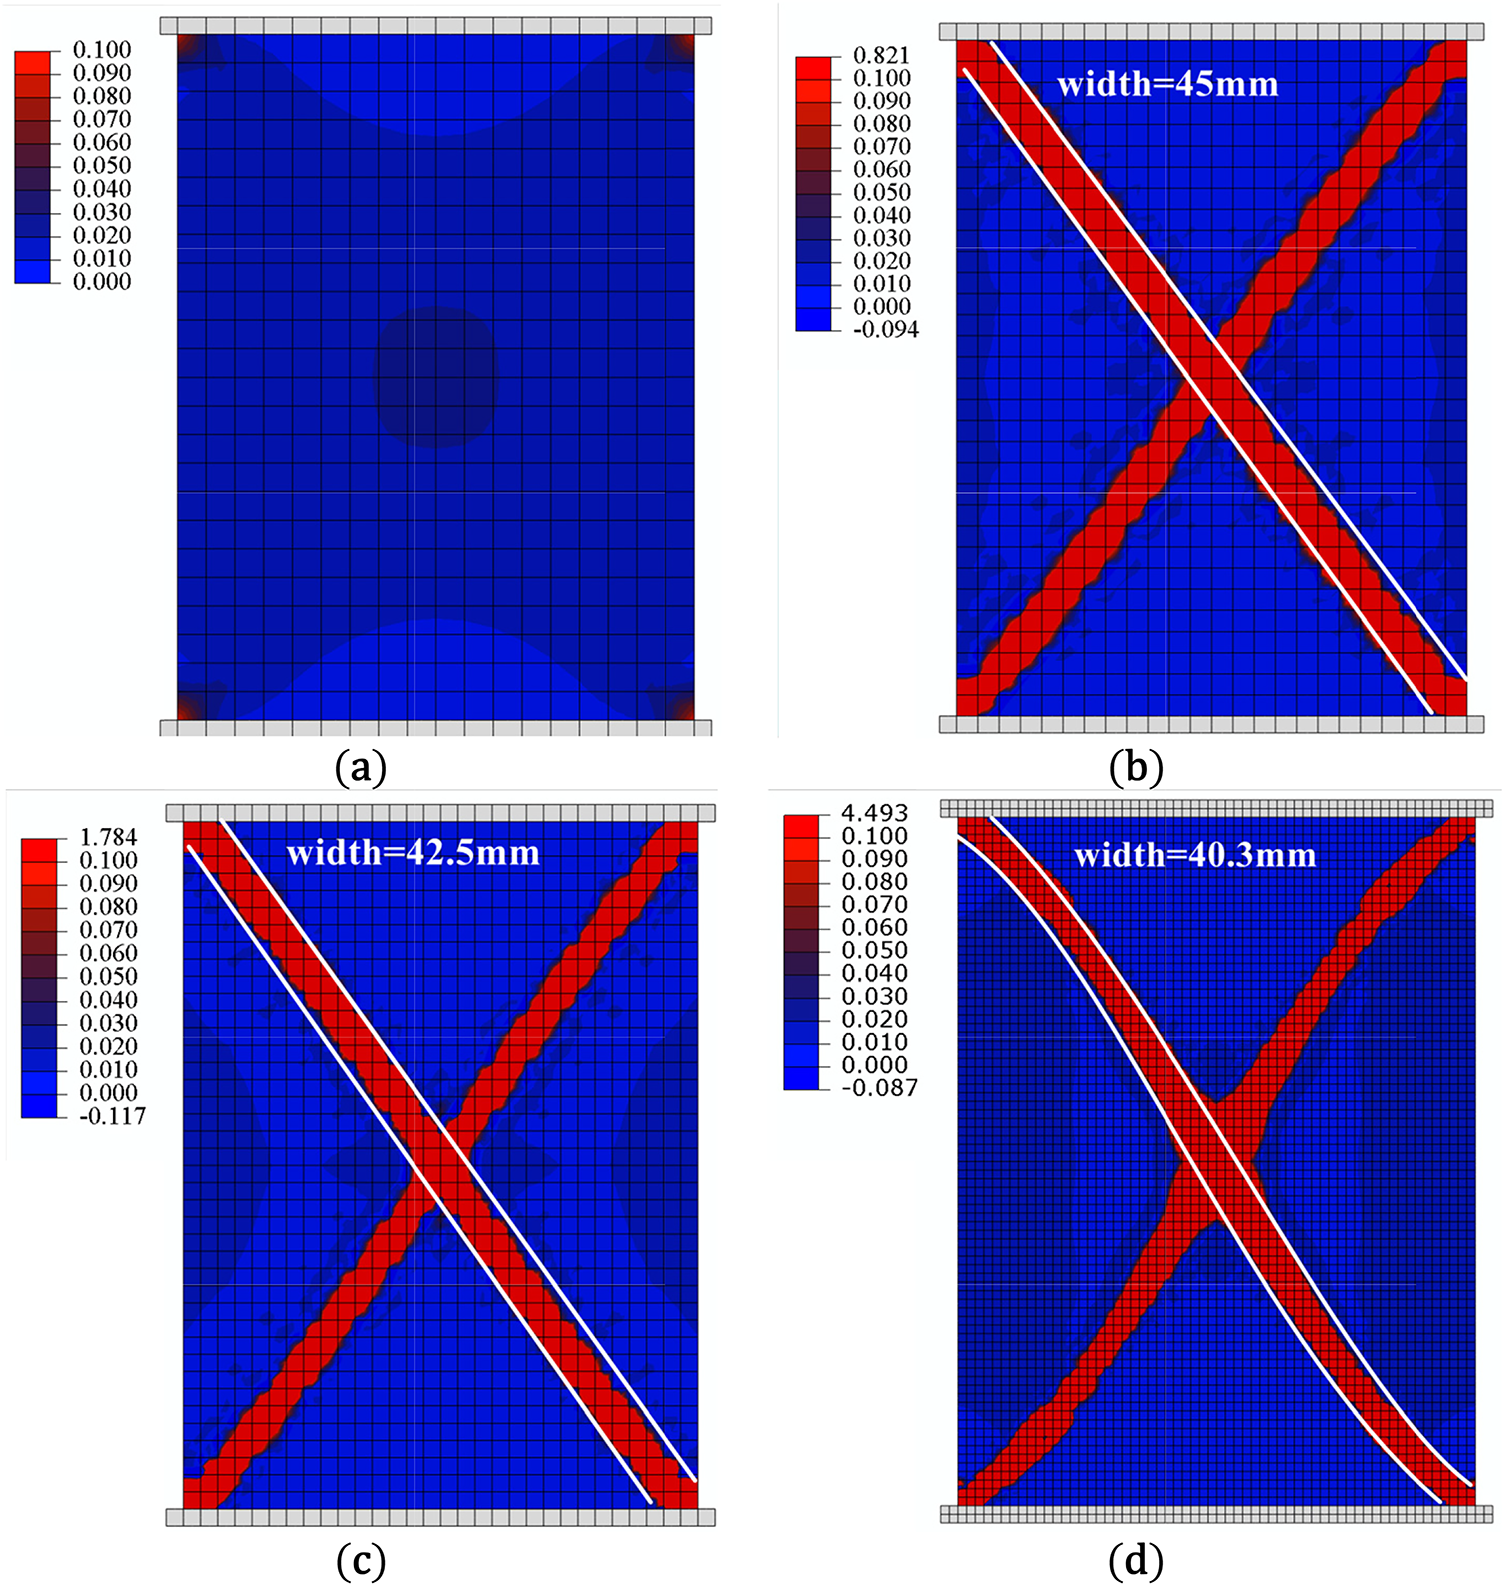
Figure 23: Equivalent strain distributions under different meshes (a) 18 × 24 (b) 24 × 32 (c) 30 × 40 (d) 60 × 80
5.6 Simulations of Slope Instability Issue
This section uses the micromechanics-based softening hyperelastic model to simulate and analyze the slope instability issue.
5.6.1 Simulation on the Slip Surface of the Slope
A 19.2 m × 9.6 m slope model with 24 × 24 mesh and its boundary conditions are given in Fig. 24. The slope is subjected to an eccentric compression load through the rigid slab on the top, and the eccentricity is 0.6 m. And a 0.4 m vertical displacement loads at the eccentric point. Table 6 gives the parameters for the slope model; different contact stiffness ratios are investigated in this part.
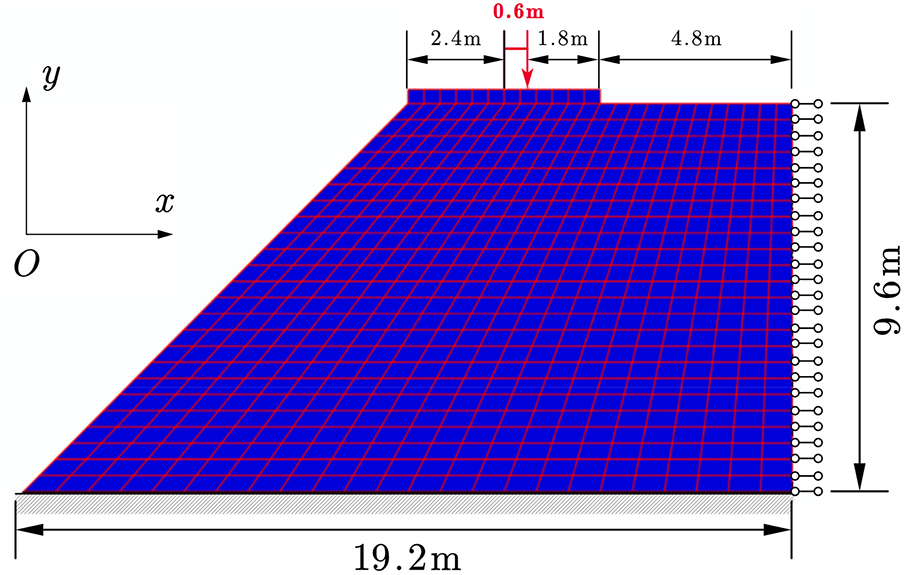
Figure 24: Schematic diagram of the slope model

Fig. 25 gives force-displacement curves for the slope model under different contact stiffness ratios
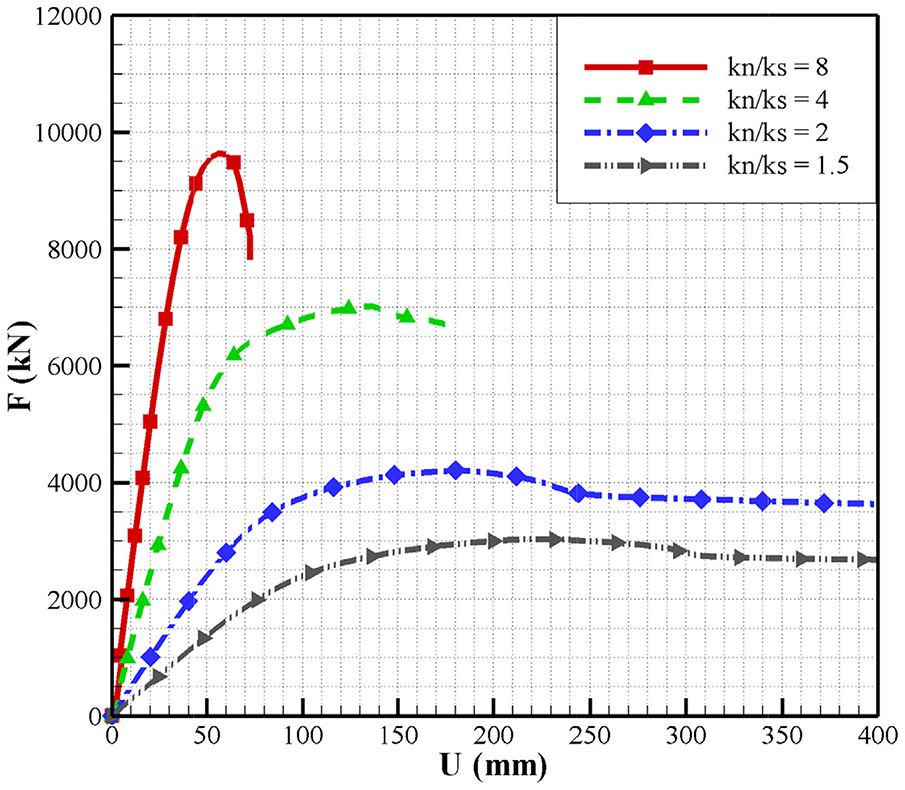
Figure 25: Force-displacement curves for the slope model under different contact stiffness ratios

Figure 26: Equivalent strain distributions for the slope model under different contact stiffness ratios (a)
Furthermore, this study investigates the evolution process of the slip surface, considering the case when
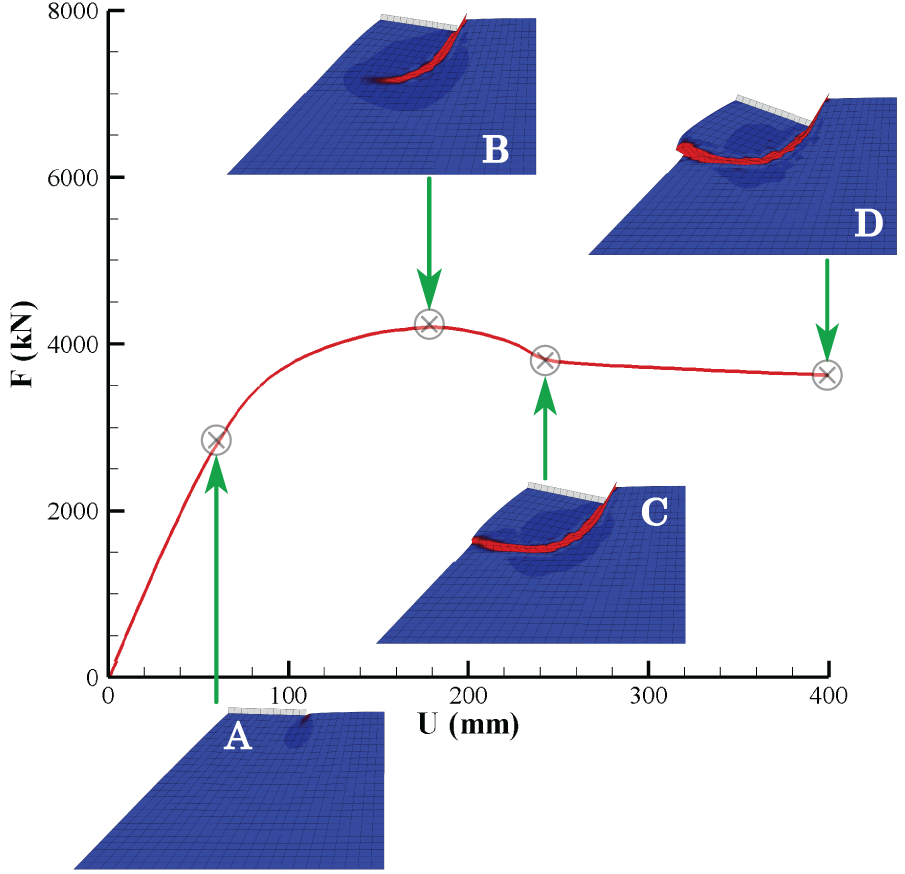
Figure 27: Evolution process of slip surface of slope when contact stiffness ratio
5.6.2 Comparative Analysis between Micromechanics-Based Softening Hyperelastic and Abaqus DP Models
Then, a comparative analysis is conducted with results of the micromechanics-based softening hyperelastic model and Abaqus DP model for simulating the slip surface of slope. The parameters are used in Table 7, and the contact stiffness ratio
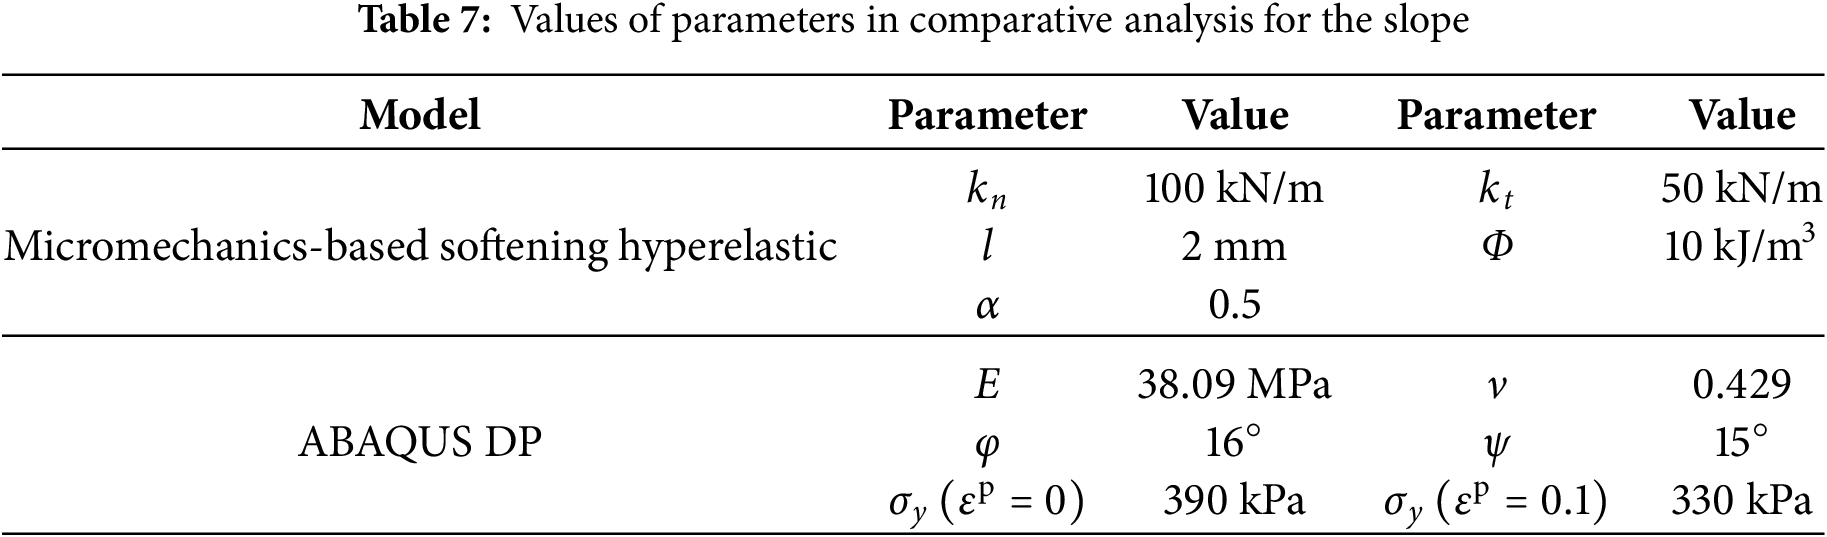
Fig. 28 gives force-displacement curves for the slope simulated by micromechanics-based softening hyperelastic and Abaqus DP models. Using the parameters in Table 7, the curves show good agreement in the elastic stage, hardening stage, and ultimate strength. However, the post-peak softening degree in the DP model is significantly less than that in the micromechanics-based model. This discrepancy originates from their fundamental constitutive frameworks. The softening in the presented model is a result of continuous evolution, naturally derived from a single hyperelastic potential function embedded with microstructural information, where the sharp strength drop reflects the physical essence of microstructural instability. In contrast, the DP model is a staged, phenomenological model whose softening mainly relies on the definition of the yield surface and a user-prescribed softening law that lacks a direct connection to micromechanisms. Therefore, the observed difference is an inevitable manifestation of these two modeling approaches in describing material instability, arising from intrinsic theoretical distinctions. Furthermore, Fig. 29 presents the equivalent plastic strain distributions for the slope from both models. Although the shapes of the slip surfaces and the degrees of strain localization are generally similar, the slip surface in the DP model is about 0.1 m wider than that in the micromechanics-based model. This difference results from the intrinsic distinctions in how the two theoretical frameworks describe the localization process. The micromechanics-based model, through its internal length scale, provides a physical constraint on the concentration of the strain localization band. In contrast, the DP model, as a macroscopic phenomenological theory, lacks such an internal scale related to micro-geometric characteristics within its framework. This results in a different representation in controlling the localization band width compared with the micro-mechanics-based approach.
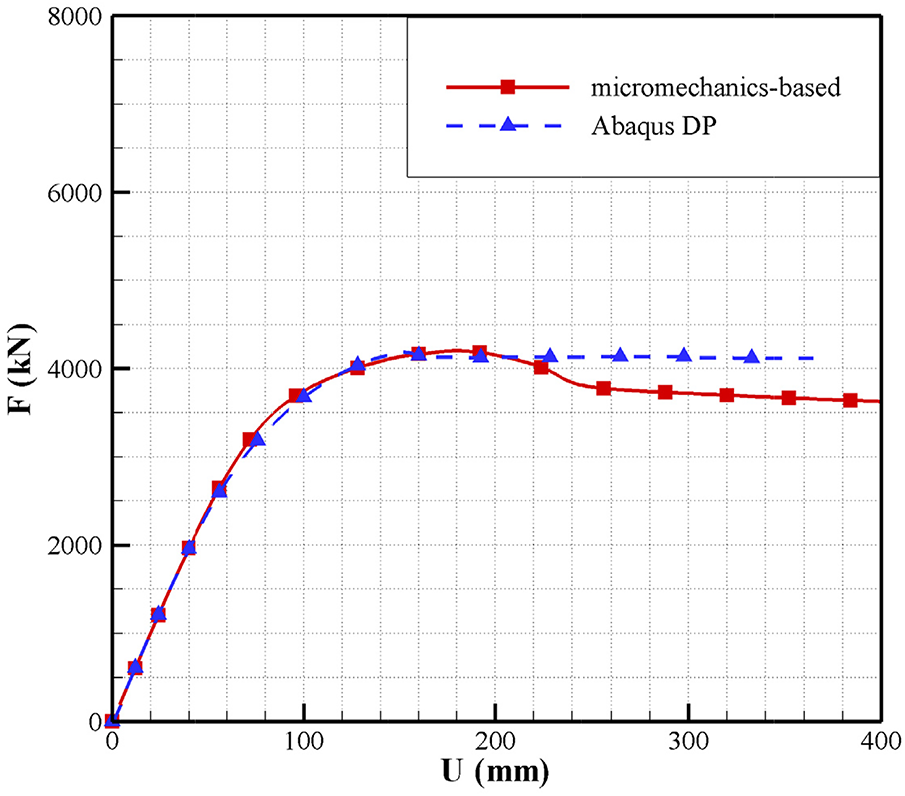
Figure 28: Force-displacement curves simulated by different models for the slope model
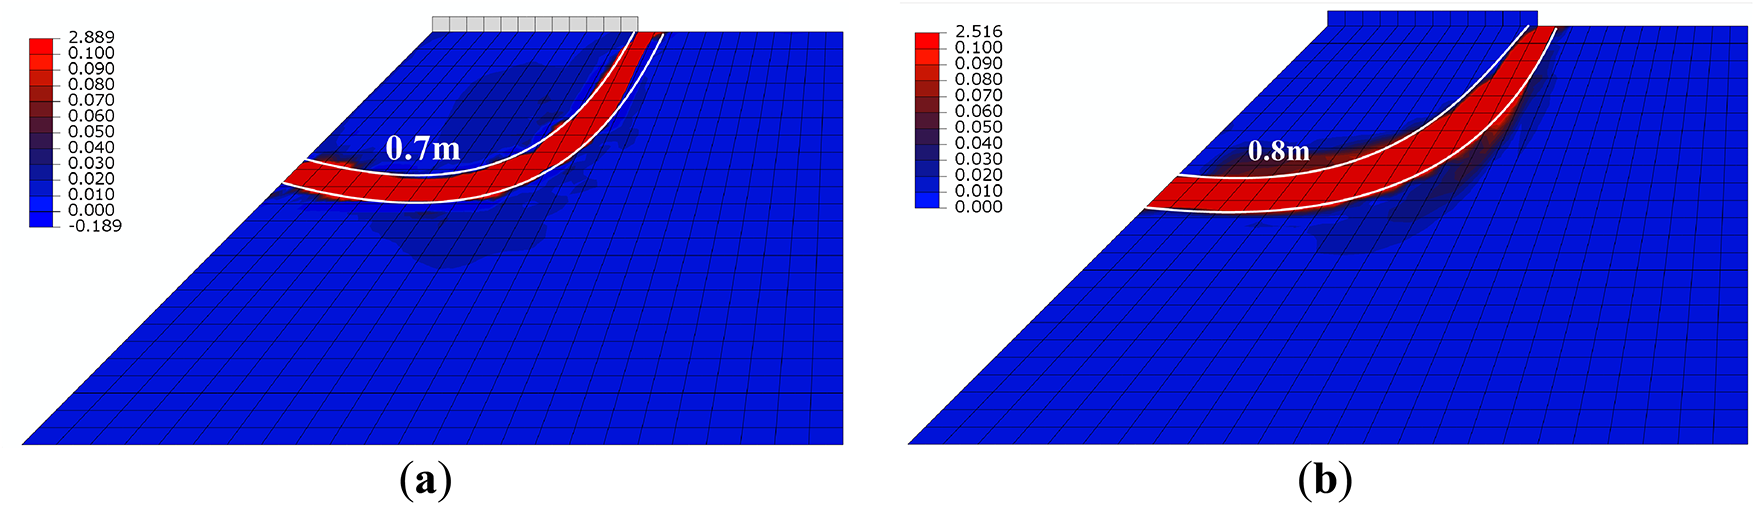
Figure 29: Equivalent strain distributions of the slope model simulated by (a) micromechanics-based softening hyperelastic model and (b) Abaqus Drucker-Prager model
5.6.3 The Influence of Softening Factor
In the previous section, the influence of the softening factor on strain localization and strain softening is discussed for the flat plate compression numerical test. This part continues to investigate its influence on the slope instability issue. The microscopic parameters are the same with those in Table 7.
Figs. 30 and 31 respectively show force-displacement curves and equivalent strain distributions for the slope model under different softening factors. Fig. 31 exhibits certain patterns similar to those in Fig. 10, but there are also distinct differences. The force-displacement curves can demonstrate the complete process from the linear elastic stage to the critical state, only when

Figure 30: Force-displacement curves for the slope model under different softening factors
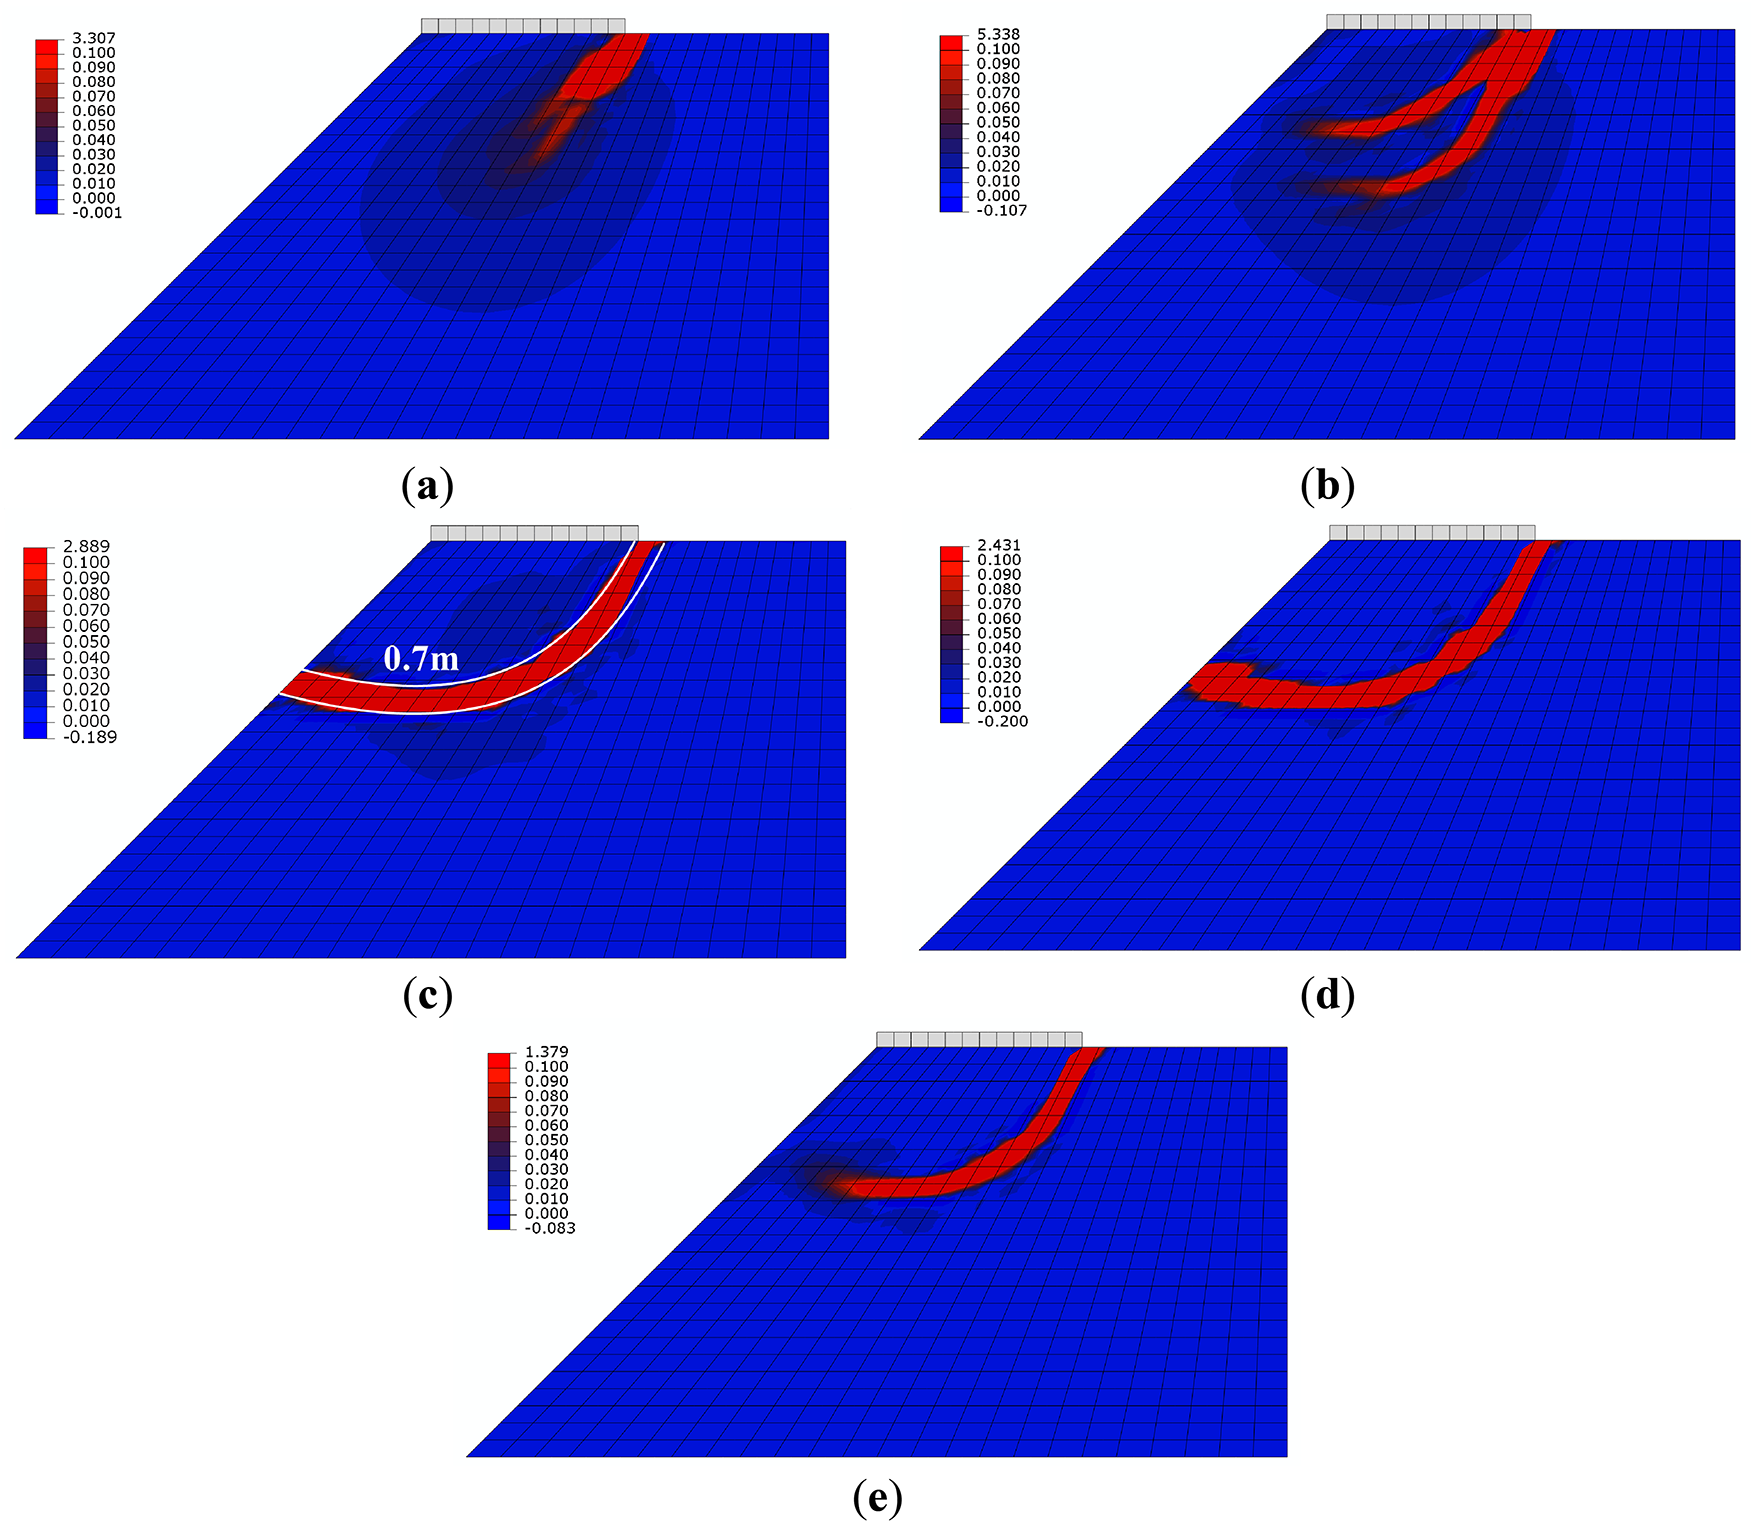
Figure 31: Equivalent strain distributions of the slope model simulated by the micromechanics-based softening hyperelastic model with different softening factors (a)
5.6.4 Slip Surface of Slope under Different Microstructures
The discussion in the preceding text has validated the influence of microstructure on strain localization and strain softening for granular materials, through the flat plate compression numerical test.
Figs. 32 and 33 respectively give force-displacement curves and equivalent strain distributions of granular materials with isotropic directional contact distribution density and different microstructures for the slope model. The overall pattern of the force-displacement curves is basically consistent with that presented in Fig. 12. However, for granular materials with different microstructures in Fig. 32, their critical states are not clearly enough defined, compared with the case of isotropic directional contact distribution density. Correspondingly, their degrees of localizations are lower than that of the case of isotropic directional distribution density, as shown in Fig. 33. For cases with different microstructures, the widths of their slip surfaces are basically the same, all around 0.6 m, which is smaller than that in the case of isotropic directional contact distribution density.
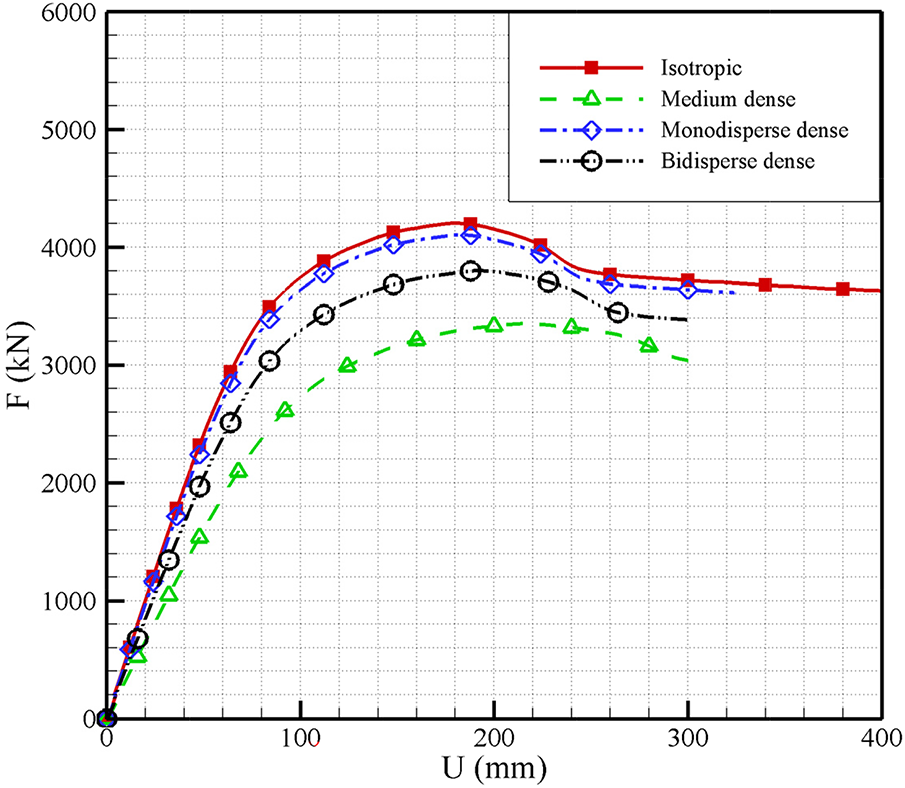
Figure 32: Force-displacement curves of granular materials with different microstructures for the slope model
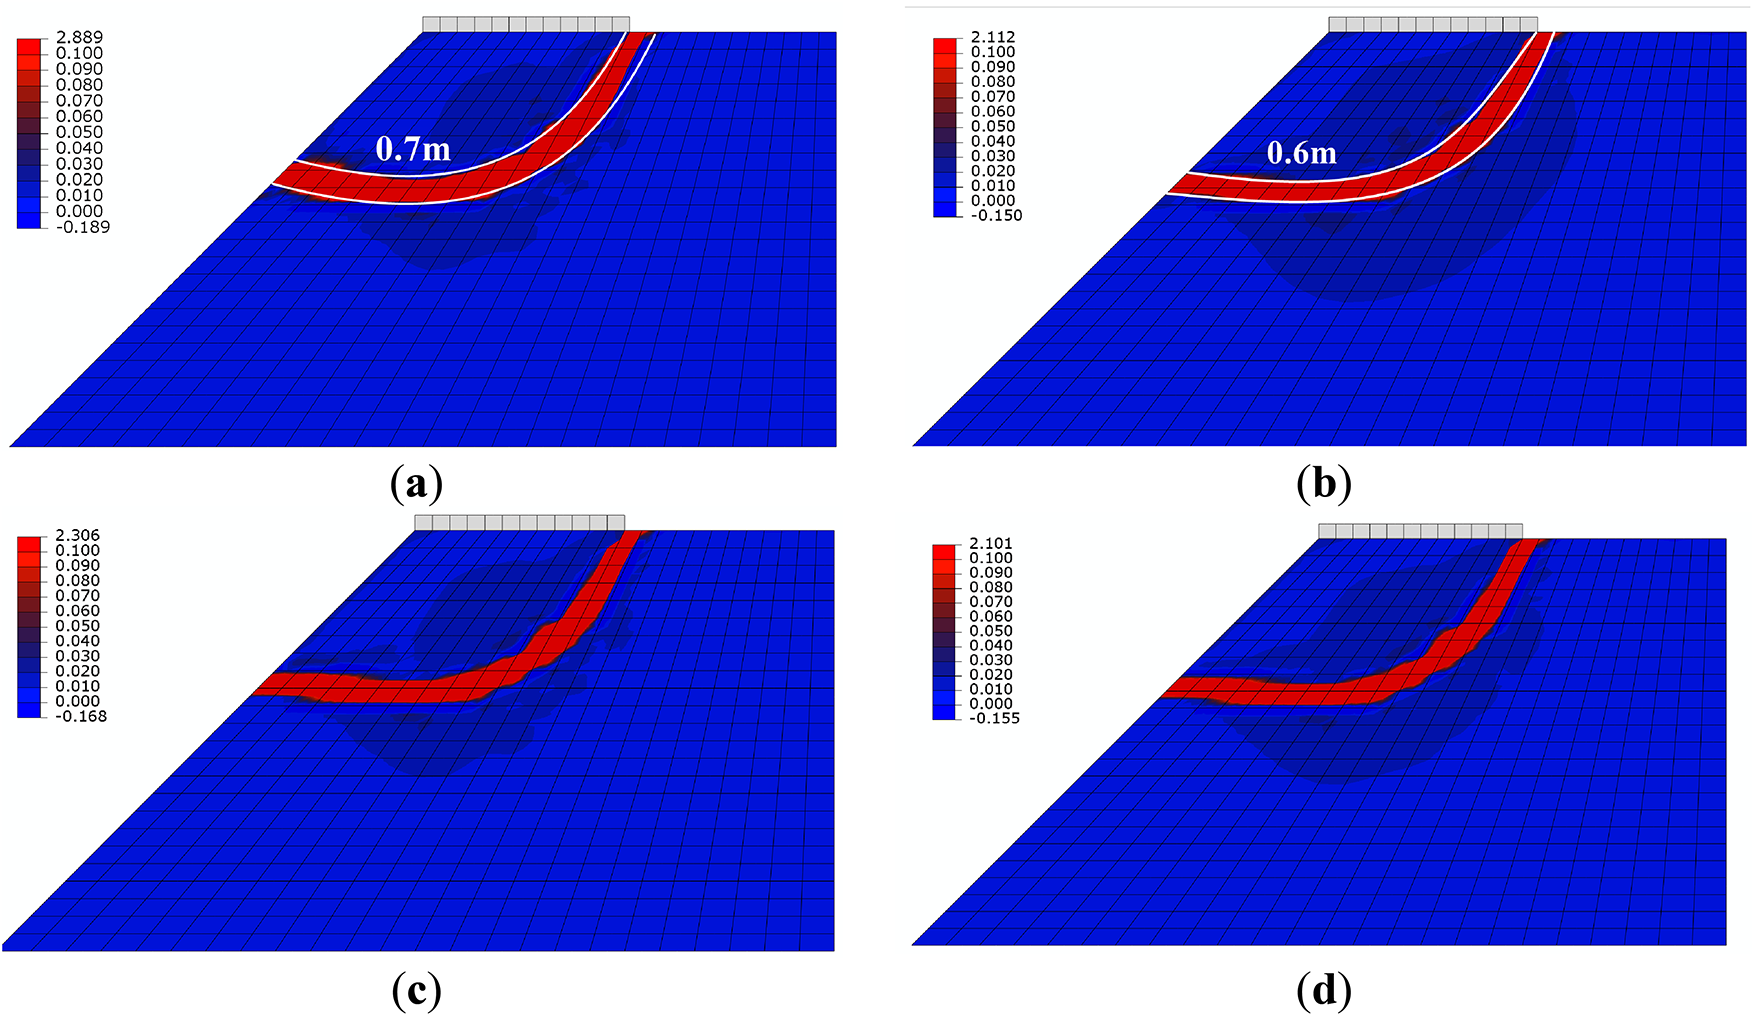
Figure 33: Equivalent strain distributions of granular materials with (a) isotropic directional density distribution (b) medium dense microstructure (c) monodisperse dense microstructure (d) bidisperse dense microstructure
This paper presents a novel micromechanics-based softening hyperelastic model for granular materials, integrating softening hyperelasticity with microstructural insights. It considers an isotropic directional contact distribution density and three specific microstructures for granular materials, and the hyperelastic constitutive modulus tensors are explicitly derived. The proposed model offers two key advantages: First, it has a clear conceptualization, straightforward formulation, and ease of numerical implementation under the hyperelastic framework. Second, it effectively incorporates micro-scale microstructural information to reveal its influences on macroscopic mechanical behaviors of granular materials. A softening factor is introduced to describe the critical state, and numerical implementation is achieved via the User Material (UMAT) subroutine in Abaqus. The model successfully simulates strain localization and strain softening, with the influences of microstructural information are thoroughly investigated. The principal conclusions are summarized as follows:
(1) By introducing the critical state, the proposed model can capture a complete mechanical response process of a linear elastic stage, a hardening stage, a softening stage, and a critical state with the residual strength. The continuous X-shaped shear bands are simulated, and the evolution process of strain localization is obtained under the consideration of the critical state. Results by the micromechanics-based softening hyperelastic model are compared with the macro-scale Volokh softening hyperelastic model, Abaqus Drucker-Prager model, and the experiment to verify the validity of the proposed model.
(2) The influence of the softening factor
(3) Microstructural porosity significantly affects the mechanical behaviors of granular materials. Simulations using a micromechanics-based softening hyperelastic model reveal that strength characteristics vary with microstructure porosity. The isotropic directional contact distribution density assumption, ignoring voids, yields the highest strength, while the monodisperse dense microstructure, with minimal porosity, approaches this strength. In contrast, the medium dense microstructure, with higher porosity, shows the lowest strength. These results highlight the critical role of porosity in determining macroscopic mechanical responses of granular materials.
(4) The influences of important parameters—normal to tangential contact stiffness ratio (
(5) The mesh independence for numerical simulations based on this proposed model is discussed. As the model introduces an internal length describing the microstructural size, it can basically eliminate the pathological mesh dependency.
(6) The model is applied to simulate slope instability, capturing the evolution of the slip surface and corresponding force-displacement curve. The slip surface of the slope presents a penetrating narrow-band zone to the middle left of the slope. Compared with the Abaqus DP model, the proposed model shows minor differences during the softening stage. Influences of softening factor
Acknowledgement: Not applicable.
Funding Statement: This work is supported by the National Natural Science Foundation of China through grant numbers 12002245 and 12172263, the Science and Technology Research Program of Chongqing Municipal Education Commission through grant number KJQN202300742, the National Natural Science Foundation of Chongqing Municipality through grant number CSTB2025NSCQ-GPX0841, and Chongqing Jiaotong University through grant number F1220038.
Author Contributions: Chenxi Xiu: Conceptualization, Funding acquisition, Supervision, Investigation, Methodology, Software, Writing—original draft, Writing—review & editing. Xihua Chu: Conceptualization, Methodology, Funding acquisition, Writing—review & editing. Ao Mei: Investigation, Writing—review & editing. Liangfei Gong: Software, Writing—review & editing. All authors reviewed the results and approved the final version of the manuscript.
Availability of Data and Materials: Not applicable.
Ethics Approval: Not applicable.
Conflicts of Interest: The authors declare no conflicts of interest to report regarding the present study.
Appendix A Identification Procedure of Constitutive Modulus Tensor:
This appendix shows how to get the specific constitutive tensor (Eq. (18)) from the general formula (Eq. (14)) for the medium dense microstructure. The general constitutive modulus tensor is given in Eq. (14). To find the tensor for a specific microstructure, the discrete sums over all contacts in the RVE must be calculated. For the medium dense structure (coordination number = 8), it assumes equal-sized particles, so the branch vector is
Let
Substitute
Then, the sums in Eq. (A2) can be obtained as
Substituting back to Eq. (A3), the final component is obainted:
Repeating this process for all index combinations
The constitutive modulus tensors for the monodisperse dense and bidisperse dense microstructures (Eqs. (19) and (20)) are derived in the same manner, differing only in the specific contact orientations and coordination numbers used in the discrete summations. Their detailed derivations are omitted here for brevity.
Appendix B Numerical Implementation:
The governing equation for the quasi-static mechanical response of granular materials is the equilibrium equation in the strong form:
where
where
The weak form is derived using the principle of virtual work:
where
The domain
where
where
Substituting into the weak form yields the discrete system of equations:
where
here,
The nonlinear system is solved using the Newton-Raphson method, and the UMAT subroutine in Abaqus is used to update
References
1. Yuan J, Zhang Q, Li B, Zhao X. Experimental analysis of shear band formation in plane strain tests on Shanghai silty clay. Bull Eng Geol Environ. 2013;72(1):107–14. doi:10.1007/s10064-012-0453-4. [Google Scholar] [CrossRef]
2. Lu D, Dong H, Lin Q, Guo C, Gao Z, Du X. A method for characterizing the deformation localization in granular materials using the relative particle motion. Comput Geotech. 2023;156:105262. doi:10.1016/j.compgeo.2023.105262. [Google Scholar] [CrossRef]
3. Phan QT, Bui HH, Nguyen GD, Nicot F. Strain localization in the standard triaxial tests of granular materials: insights into meso- and macro-scale behaviours. Num Anal Meth Geomech. 2024;48(5):1345–71. doi:10.1002/nag.3687. [Google Scholar] [CrossRef]
4. Li N, Ma B, Wang H, Sun W. Development of elasto-plastic constitutive model for unbound granular materials under repeated loads. Transp Geotech. 2020;23:100347. doi:10.1016/j.trgeo.2020.100347. [Google Scholar] [CrossRef]
5. Tang H, Wei W, Liu F, Chen G. Elastoplastic Cosserat continuum model considering strength anisotropy and its application to the analysis of slope stability. Comput Geotech. 2020;117:103235. doi:10.1016/j.compgeo.2019.103235. [Google Scholar] [CrossRef]
6. Xiu C, Chu X. A micromorphic elastoplastic model and finite element simulation on failure behaviors of granular materials. Num Anal Meth Geomech. 2020;44(4):484–515. doi:10.1002/nag.3034. [Google Scholar] [CrossRef]
7. Tian J, Lai Y, Liu E, He C. A thermodynamics-based micro-macro elastoplastic micropolar continuum model for granular materials. Comput Geotech. 2023;162:105653. doi:10.1016/j.compgeo.2023.105653. [Google Scholar] [CrossRef]
8. Houlsby GT, Amorosi A, Rojas E. Elastic moduli of soils dependent on pressure: a hyperelastic formulation. Géotechnique. 2005;55(5):383–92. doi:10.1680/geot.55.5.383.66021. [Google Scholar] [CrossRef]
9. Jiang Y, Liu M. A brief review of granular elasticity: why and how far is sand elastic? Eur Phys J E Soft Matter. 2007;22(3):255–60. doi:10.1140/epje/e2007-00009-x. [Google Scholar] [PubMed] [CrossRef]
10. Chang J, Chu X, Xu Y. A softening hyperelastic model and simulation of the failure of granular materials. Geomech Eng. 2014;7(4):335–53. doi:10.12989/gae.2014.7.4.335. [Google Scholar] [CrossRef]
11. Amorosi A, Rollo F, Houlsby GT. A nonlinear anisotropic hyperelastic formulation for granular materials: comparison with existing models and validation. Acta Geotech. 2020;15(1):179–96. doi:10.1007/s11440-019-00827-5. [Google Scholar] [CrossRef]
12. Xiao Y, Zhang Z, Wang J. Granular hyperelasticity with inherent and stress-induced anisotropy. Acta Geotech. 2020;15(3):671–80. doi:10.1007/s11440-019-00768-z. [Google Scholar] [CrossRef]
13. Volokh KY. Hyperelasticity with softening for modeling materials failure. J Mech Phys Solids. 2007;55(10):2237–64. doi:10.1016/j.jmps.2007.02.012. [Google Scholar] [CrossRef]
14. Volokh KY. Softening hyperelasticity for modeling material failure: analysis of cavitation in hydrostatic tension. Int J Solids Struct. 2007;44(14–15):5043–55. doi:10.1016/j.ijsolstr.2006.12.022. [Google Scholar] [CrossRef]
15. Lei D, Huang J, Xu W, Wang W, Zhang P. Deformation analysis of shear band in granular materials via a robust plane shear test and numerical simulation. Powder Technol. 2018;323:385–92. doi:10.1016/j.powtec.2017.10.027. [Google Scholar] [CrossRef]
16. Zhu H, Zhou WH, Yin ZY. Deformation mechanism of strain localization in 2D numerical interface tests. Acta Geotech. 2018;13(3):557–73. doi:10.1007/s11440-017-0561-1. [Google Scholar] [CrossRef]
17. Cao W, Mei J, Yang X, Zhou W, Chang X, Ma G. A network-based investigation on static liquefaction of sheared granular materials. Granul Matter. 2024;26(3):60. doi:10.1007/s10035-024-01433-3. [Google Scholar] [CrossRef]
18. Guo N, Yang Z, Yuan W, Zhao J. A coupled SPFEM/DEM approach for multiscale modeling of large-deformation geomechanical problems. Num Anal Meth Geomech. 2021;45(5):648–67. doi:10.1002/nag.3175. [Google Scholar] [CrossRef]
19. Li X, Liu Q, Zhang J. A micro-macro homogenization approach for discrete particle assembly-Cosserat continuum modeling of granular materials. Int J Solids Struct. 2010;47(2):291–303. doi:10.1016/j.ijsolstr.2009.09.033. [Google Scholar] [CrossRef]
20. Zhao S, Zhao J, Liang W, Niu F. Multiscale modeling of coupled thermo-mechanical behavior of granular media in large deformation and flow. Comput Geotech. 2022;149:104855. doi:10.1016/j.compgeo.2022.104855. [Google Scholar] [CrossRef]
21. Chang CS, Ma L. Modeling of discrete granulates as micropolar continua. J Eng Mech. 1990;116(12):2703–21. doi:10.1061/(asce)0733-9399(1990)116:12(2703). [Google Scholar] [CrossRef]
22. Chang CS, Lun M. Elastic material constants for isotropic granular solids with particle rotation. Int J Solids Struct. 1992;29(8):1001–18. doi:10.1016/0020-7683(92)90071-Z. [Google Scholar] [CrossRef]
23. Xiu C, Chu X, Wang J, Wu W, Duan Q. A micromechanics-based micromorphic model for granular materials and prediction on dispersion behaviors. Granul Matter. 2020;22(4):74. doi:10.1007/s10035-020-01044-8. [Google Scholar] [CrossRef]
24. Talebi H, Silani M, Bordas SPA, Kerfriden P, Rabczuk T. A computational library for multiscale modeling of material failure. Comput Mech. 2014;53(5):1047–71. doi:10.1007/s00466-013-0948-2. [Google Scholar] [CrossRef]
25. Goswami S, Anitescu C, Chakraborty S, Rabczuk T. Transfer learning enhanced physics informed neural network for phase-field modeling of fracture. Theor Appl Fract Mech. 2020;106:102447. doi:10.1016/j.tafmec.2019.102447. [Google Scholar] [CrossRef]
26. Kanit T, Forest S, Galliet I, Mounoury V, Jeulin D. Determination of the size of the representative volume element for random composites: statistical and numerical approach. Int J Solids Struct. 2003;40(13–14):3647–79. doi:10.1016/S0020-7683(03)00143-4. [Google Scholar] [CrossRef]
27. Chang CS, Misra A. Packing structure and mechanical properties of granulates. J Eng Mech. 1990;116(5):1077–93. doi:10.1061/(asce)0733-9399(1990)116:5(1077). [Google Scholar] [CrossRef]
28. Li X, Zhang S, Duan Q. Effective hydro-mechanical material properties and constitutive behaviors of meso-structured RVE of saturated granular media. Comput Geotech. 2020;127:103774. doi:10.1016/j.compgeo.2020.103774. [Google Scholar] [CrossRef]
29. Xiu C, Chu X, Wang J. The micromorphic constitutive parameters and dispersion behaviors in different granular crystals. Powder Technol. 2021;392:325–43. doi:10.1016/j.powtec.2021.07.021. [Google Scholar] [CrossRef]
30. Yilmaz N, Yildizdag ME, Fabbrocino F, Placidi L, Misra A. Emergence of critical state in granular materials using a variationally-based damage-elasto-plastic micromechanical continuum model. Num Anal Meth Geomech. 2024;48(13):3369–91. doi:10.1002/nag.3795. [Google Scholar] [CrossRef]
31. Xiu C, Chu X. Finite element simulations on failure behaviors of granular materials with microstructures using a micromechanics-based cosserat elastoplastic model. Comput Model Eng Sci. 2024;138(3):2305–38. doi:10.32604/cmes.2023.030194. [Google Scholar] [CrossRef]
32. Le Bouil A, Amon A, Sangleboeuf JC, Orain H, Bésuelle P, Viggiani G, et al. A biaxial apparatus for the study of heterogeneous and intermittent strains in granular materials. Granul Matter. 2014;16(1):1–8. doi:10.1007/s10035-013-0477-x. [Google Scholar] [CrossRef]
33. Kruyt NP, Agnolin I, Luding S, Rothenburg L. Micromechanical study of elastic moduli of loose granular materials. J Mech Phys Solids. 2010;58(9):1286–301. doi:10.1016/j.jmps.2010.06.003. [Google Scholar] [CrossRef]
34. Durán O, Kruyt NP, Luding S. Micro-mechanical analysis of deformation characteristics of three-dimensional granular materials. Int J Solids Struct. 2010;47(17):2234–45. doi:10.1016/j.ijsolstr.2010.04.014. [Google Scholar] [CrossRef]
35. Li X, Tang H. A consistent return mapping algorithm for pressure-dependent elastoplastic Cosserat continua and modelling of strain localisation. Comput Struct. 2005;83(1):1–10. doi:10.1016/j.compstruc.2004.08.009. [Google Scholar] [CrossRef]
Cite This Article
 Copyright © 2026 The Author(s). Published by Tech Science Press.
This work is licensed under a Creative Commons Attribution 4.0 International License , which permits unrestricted use, distribution, and reproduction in any medium, provided the original work is properly cited.
 Downloads
 Citation Tools