
 Submit a Paper
 Propose a Special lssue
 Open Access
ARTICLE

Advancing Breast Cancer Molecular Subtyping: A Comparative Study of Convolutional Neural Networks and Vision Transformers on Mammograms
1 Faculty of Electronic Engineering & Technology (FKTEN), Universiti Malaysia Perlis, Arau, 02600, Perlis, Malaysia
2 Sport Engineering Research Centre (SERC), Universiti Malaysia Perlis, Arau, 02600, Perlis, Malaysia
3 Centre of Excellence for Advanced Communication Engineering (ACE), Universiti Malaysia Perlis, Arau, 02600, Perlis, Malaysia
4 School of Medical Sciences, Health Campus, Universiti Sains Malaysia, Kubang Kerian, 16150, Kelantan, Malaysia
5 Biomedical and Bioinformatics Engineering (BBE) Research Group, Centre for Multimodal Signal Processing (CMSP), Tunku Abdul Rahman University of Management and Technology (TAR UMT), Jalan Genting Kelang, Setapak, Kuala Lumpur, 53300, Malaysia
* Corresponding Author: Chee Chin Lim. Email:
Computers, Materials & Continua 2026, 86(3), 53 https://doi.org/10.32604/cmc.2025.070468
Received 16 July 2025; Accepted 28 October 2025; Issue published 12 January 2026
 View Full Text
 Download PDF
Abstract
Breast cancer remains one of the leading causes of cancer mortality world-wide, with accurate molecular subtyping is critical for guiding treatment and improving patient outcomes. Traditional molecular subtyping via immuno-histochemistry (IHC) test is invasive, time-consuming, and may not fully represent tumor heterogeneity. This study proposes a non-invasive approach using digital mammography images and deep learning algorithm for classifying breast cancer molecular subtypes. Four pretrained models, including two Convolutional Neural Networks (MobileNet_V3_Large and VGG-16) and two Vision Transformers (ViT_B_16 and ViT_Base_Patch16_Clip_224) were fine-tuned to classify images into HER2-enriched, Luminal, Normal-like, and Triple Negative subtypes. Hyperparameter tuning, including learning rate adjustment and layer freezing strategies, was applied to optimize performance. Among the evaluated models, ViT_Base_Patch16_Clip_224 achieved the highest test accuracy (94.44%), with equally high precision, recall, and F1-score of 0.94, demonstrating excellent generalization. MobileNet_V3_Large achieved the same accuracy but showed less training stability. In contrast, VGG-16 recorded the lowest performance, indicating a limitation in its generalizability for this classification task. The study also highlighted the superior performance of the Vision Transformer models over CNNs, particularly due to their ability to capture global contextual features and the benefit of CLIP-based pretraining in ViT_Base_Patch16_Clip_224. To enhance clinical applicability, a graphical user interface (GUI) named “BCMS Dx” was developed for streamlined subtype prediction. Deep learning applied to mammography has proven effective for accurate and non-invasive molecular subtyping. The proposed Vision Transformer-based model and supporting GUI offer a promising direction for augmenting diagnostic workflows, minimizing the need for invasive procedures, and advancing personalized breast cancer management.Keywords
Breast cancer, characterized by the uncontrolled proliferation of abnormal breast cells and often related to dysregulated estrogen receptors (ER), progesterone receptors (PR), and human epidermal growth factor receptor 2 (HER2), is a global health concern affecting both women and, less commonly, men. The World Health Organization (WHO) reported 2.3 million cases and approximately 670,000 deaths globally in 2022, solidifying its position as the second most common cancer worldwide [1,2]. Alarmingly, Asia is experiencing a rapid rise in breast cancer mortality. In Malaysia, the GLOBOCAN 2022 report identifies breast cancer as the most prevalent cancer, accounting for 16.2% of all cancer cases, surpassing colorectal (13.8%) and lung cancer (10.7%) [3].
Accurate molecular subtyping of breast cancer is paramount for effective clinical management and treatment. Molecular subtypes, initially identified by Perou et al. in 2000 [4], have been refined by The Cancer Genome Atlas Project (TCGA) into four distinct categories: Luminal A, Luminal B, HER2-enriched, and Basal-like [5]. A fifth subtype, claudin-low, was later discovered [6,7]. These subtypes exhibit varying responses to treatment; for instance, luminal tumors often respond to endocrine therapy, HER2-enriched tumors to targeted antibody therapy, and some aggressive Basal-like or triple-negative tumors to chemotherapy [8]. Early and precise subtype identification is crucial for personalized treatment strategies and improved patient outcomes.
Currently, breast cancer subtyping primarily relies on immunohistochemistry (IHC) markers obtained via invasive needle biopsies. While effective, this procedure can cause patient discomfort, anxiety, and may not fully capture tumor heterogeneity. Furthermore, IHC’s suitability for large-scale screening and frequent monitoring is limited, impacting population-wide health management and contributing to increased healthcare costs, analysis time, and patient distress through unnecessary biopsies.
Non-invasive imaging modalities such as mammography, magnetic resonance imaging (MRI), and ultrasound offer a broader view of tumor heterogeneity without the need for tissue extraction. Mammography, specifically, is a cornerstone in both diagnostic and screening contexts, providing two-dimensional X-ray views (mediolateral oblique (MLO) and craniocaudal (CC)) of the breast [9]. Recent advancements in radiomics-based breast cancer subtype characterization have shown significant promise, demonstrating correlations between imaging characteristics and specific molecular subtypes [10]. However, existing models face challenges including limited and imbalanced data, leading to biases and inaccuracies [11,12]. Moreover, most models primarily focus on benign-malignant classification [13,14], which is insufficient for guiding treatment decisions, and some developed models or systems lack interpretability, hindering clinical adoption [10].
To address these limitations, this study aims to develop and evaluate robust classification models for breast cancer molecular subtypes using digital mammographic images. By leveraging pre-trained deep learning architectures, including Convolutional Neural Networks (MobileNet_V3_Large and VGG-16) and Vision Transformers (ViT_B_16 and ViT_Base_Patch16_Clip_224), and optimizing their performance through hyperparameter tuning, we seek to enhance the accuracy and efficiency of breast cancer subtype classification. The ultimate goal is to provide a reliable, non-invasive diagnostic tool for clinical use, encapsulated within a user-friendly Graphical User Interface (GUI). This will empower breast radiologists with a powerful tool for effective molecular subtype identification, leading to improved diagnostic precision, personalized treatment, and better patient outcomes.
The motivation for this study is driven by the need to improve breast cancer molecular subtype prediction directly from mammographic images, an area that remains underexplored compared to conventional benign–malignant classification tasks. The main contributions of this work are summarized as follows:
1. Development of a Vision Transformer (ViT_Base_Patch16_Clip_224) framework fine-tuned for molecular subtype prediction, demonstrating strong performance despite the limited dataset size.
2. A comparative evaluation of CNN-based models (MobileNet_V3_Large and VGG-16) and the Vision Transformer, providing insights into their respective strengths and limitations for mammography analysis.
3. Investigation of transfer learning configurations (freezing versus unfreezing layers) and learning rates to assess their impact on model generalization.
4. Establishment of a balanced augmented dataset of 1440 mammogram images to mitigate class imbalance and enable fair model evaluation.
5. Critical discussion of limitations—including dataset size, risk of overfitting, and the absence of explainable AI—and identification of future research directions such as dataset expansion, integration of explainability methods, and advanced hyperparameter optimization.
Collectively, these contributions underscore both the potential and the challenges of applying deep learning, particularly Vision Transformers, to the molecular subtyping of breast cancer from mammography.
Recent advancements in artificial intelligence (AI), particularly machine learning (ML) and deep learning (DL), have significantly improved diagnostic capabilities in medical imaging, including breast cancer detection and classification. Traditional ML methods have been applied successfully to mammogram images, often achieving high accuracies. For instance, Khalid et al. [13] reported a 96.49% accuracy using Random Forest for benign-malignant classification, while Ma et al. [8] utilized a Naïve Bayes classifier for molecular subtype identification. However, these methods rely heavily on manual feature selection and are less effective for capturing the complex patterns inherent in medical images.
Deep learning approaches, especially convolutional neural networks (CNNs), offer automated feature extraction and have demonstrated superior performance in breast cancer imaging tasks. Bobowicz et al. [14] achieved 82.2% accuracy using ResNet-34 for benign-malignant classification, and Thangavel et al. [15] highlighted mammography’s potential in early-stage abnormality detection. Several studies have also explored breast cancer subtyping using DL, with Nissar et al. [11] achieving 90% accuracy using MobileNet-V3 integrated with attention mechanisms, and Zhang et al. [12] reporting 88.5% using ResNet-50 with modality attention.
More recently, Vision Transformers (ViTs) have emerged as a promising alternative to CNNs due to their ability to model global dependencies through self-attention mechanisms. Studies by Gheflati & Rivaz [16] with ultrasound datasets and Zeng et al. [17] who studied breast mass diagnosis reported accuracies of 86.7% and 92.7%, respectively, while hybrid models combining ViTs with CNNs [18] achieved up to 99.22% accuracy for breast calcifications classifications.
Research Gap Analysis
Despite recent advancements in AI for medical imaging, a significant research gap persists in the accurate and effective classification of breast cancer molecular subtypes directly from mammographic images. Existing models often focus narrowly on distinguishing benign from malignant tumors, which is insufficient for guiding the precise, personalized treatment decisions necessitated by different molecular subtypes. Furthermore, the limited number of studies specifically addressing molecular subtyping via mammography (only five identified) often suffer from low accuracy or introduce high model complexity that hinders clinical interpretability and widespread adoption. Table 1 shows a survey of recent state-of-the-artwork of mammography-based breast cancer classification.
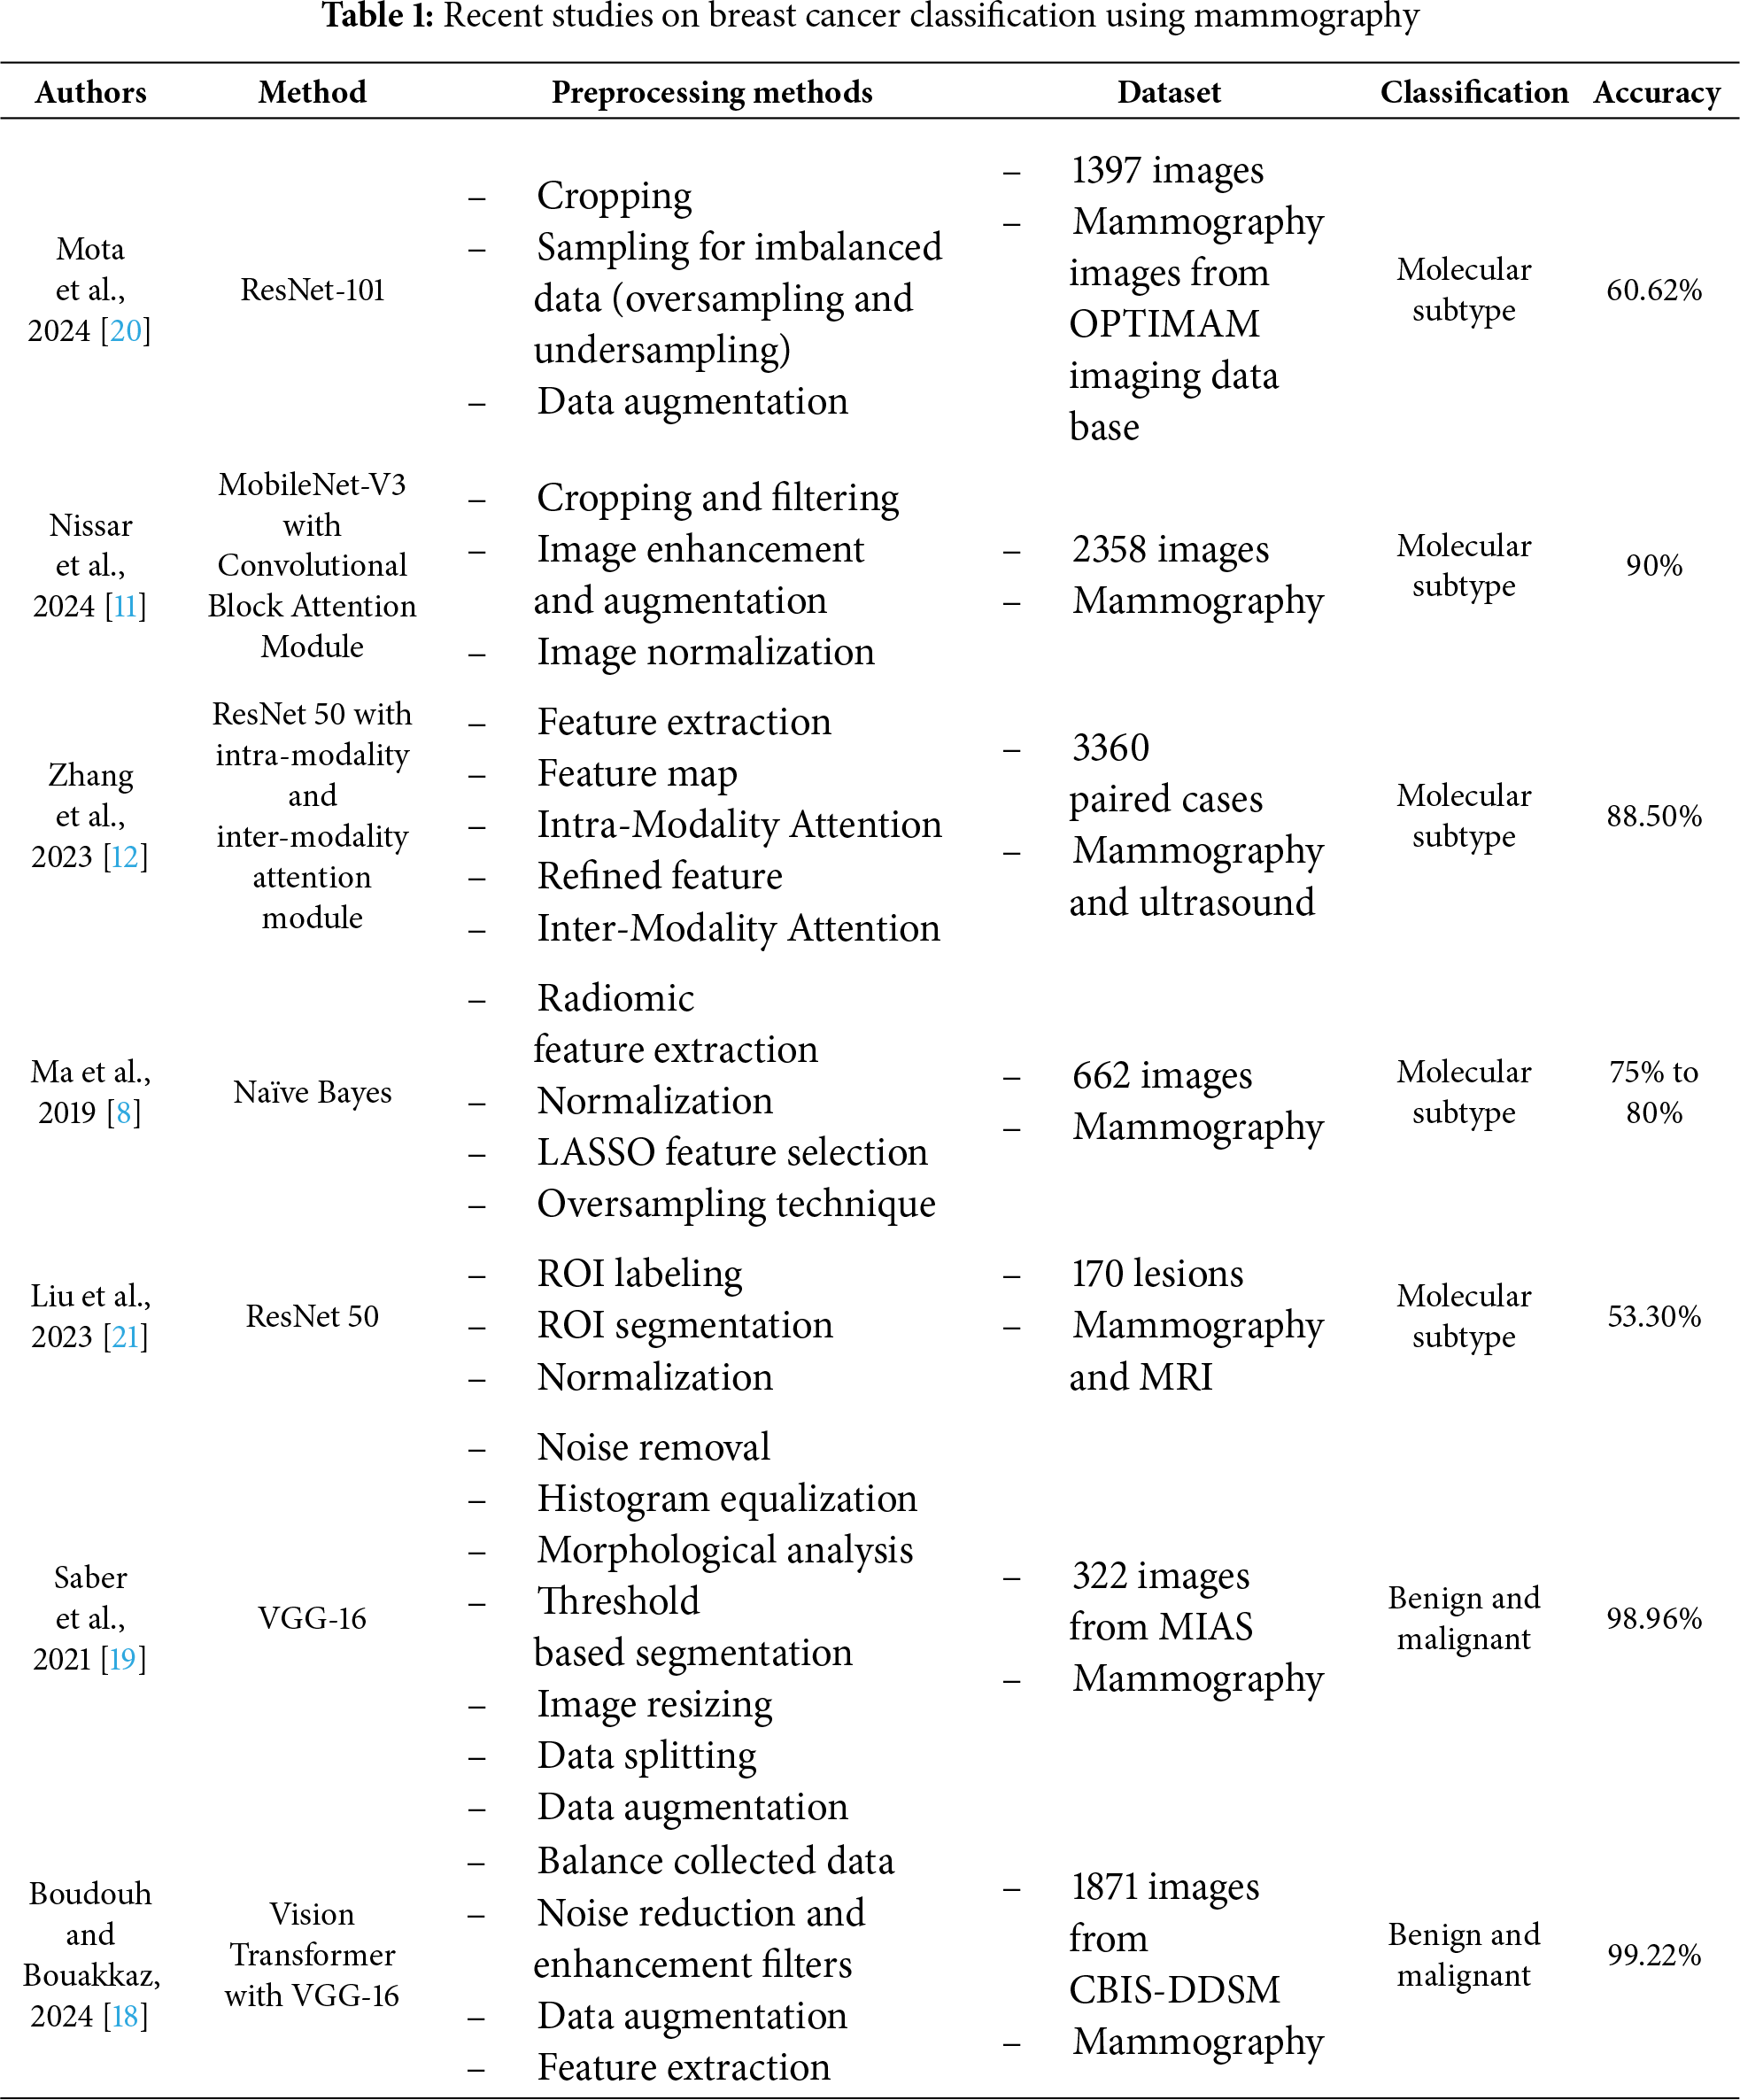
To bridge this gap, there is a clear need for highly accurate yet computationally efficient and interpretable classification models for breast cancer molecular subtyping. While some attention-mechanism-enhanced models like MobileNet-V3 have shown promising accuracy (90% in Nissar et al.’s study [11]), their inherent complexity can be a barrier. Conversely, architectures like VGG-16 have demonstrated exceptionally high accuracy (up to 98.96%) [19] in the related task of benign/malignant classification, and its fusion with Vision Transformers has pushed this even higher (99.22%) [18]. This suggests their untapped potential for accurate molecular subtyping. Therefore, this study aims to evaluate and compare the performance of pre-trained Vision Transformers and CNNs (specifically MobileNet-V3 and VGG-16) for breast cancer molecular subtype classification, seeking an optimal approach that achieves both high accuracy and maintains lower computational complexity, ultimately leading to a more reliable and user-friendly diagnostic tool.
Fig. 1 illustrates the workflow for developing a breast cancer molecular subtype classification model using mammographic images. The process begins with pre-processing of raw images, including data augmentation, resizing and normalization, to enhance model performance and generalization. The prepared dataset is then randomly divided into three subsets, which are 80% for training, 10% for validation and 10% for testing. In the classification stage, deep learning models, specifically Vision Transformers and Convolutional Neural Networks, are employed to categorize breast cancer into Luminal, HER2-enriched, Triple Negative and Normal-like subtypes. Following initial model evaluation, hyperparameter tuning is conducted to optimize classification accuracy. Finally, a Graphical User Interface (GUI) is developed to support practical clinical applications.
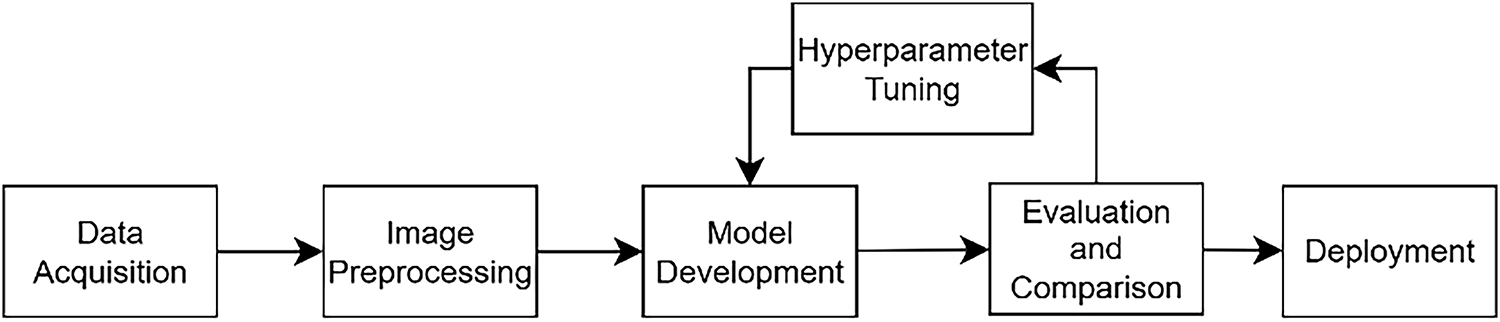
Figure 1: Research flow chart
The digital mammographic images used in this study were sourced from Hospital Pakar Universiti Sains Malaysia (HPUSM). The dataset comprises a total of 409 breast images, including both left and right views, collected between September 2020 and December 2024. The images were initially obtained in the Digital Imaging and Communications in Medicine (DICOM) format and were subsequently converted to Portable Network Graphics (PNG) format to facilitate the image processing stage. This study involving human participants was reviewed and approved by the Human Research Ethics Committee (Jawatankuasa Etika Penyelidikan Manusia) of Universiti Sains Malaysia (JEPeM-USM), reference number USM/JEPeM/KK/25030246. The study protocol complies with the Declaration of Helsinki, International Conference on Harmonization Good Clinical Practice (ICH-GCP) guidelines, Council for International Organizations of Medical Sciences (CIOMS) standards, World Health Organization (WHO) operational guidance for ethics review, and relevant Malaysian regulations.
As the distribution of images across all categories is unequal, this may lead to data bias and reduced model performance. In this study, data augmentation was performed on the full dataset prior to partitioning into training (80%), validation (10%), and testing (10%) subsets, using stratified sampling, ensuring that all four molecular subtypes were proportionally represented in each subset. This strategy was chosen because the original dataset contained only 409 mammogram images, with noticeable class imbalance. This approach minimized the risk of subtype imbalance or omission in the evaluation process. By augmenting before splitting, each subset remained balanced and representative, which is essential for reliable evaluation in small-sample biomedical studies [22]. The augmentation transformations introduced variations (rotation, flipping, scaling, etc.) that generated new yet distinct samples, rather than exact duplicates. Data augmentation specifically geometric transformations were applied (see Fig. 2), resulting in 360 images per class and a total of 1440 images for training the deep learning models. Therefore, while augmented variants may share similarity with originals across subsets, this does not constitute harmful data leakage but instead enhances model robustness under realistic clinical variations [23]. This approach has also been reported as a practical solution for small medical datasets, where augmentation prior to splitting is sometimes applied to ensure statistical reliability of evaluation [24].
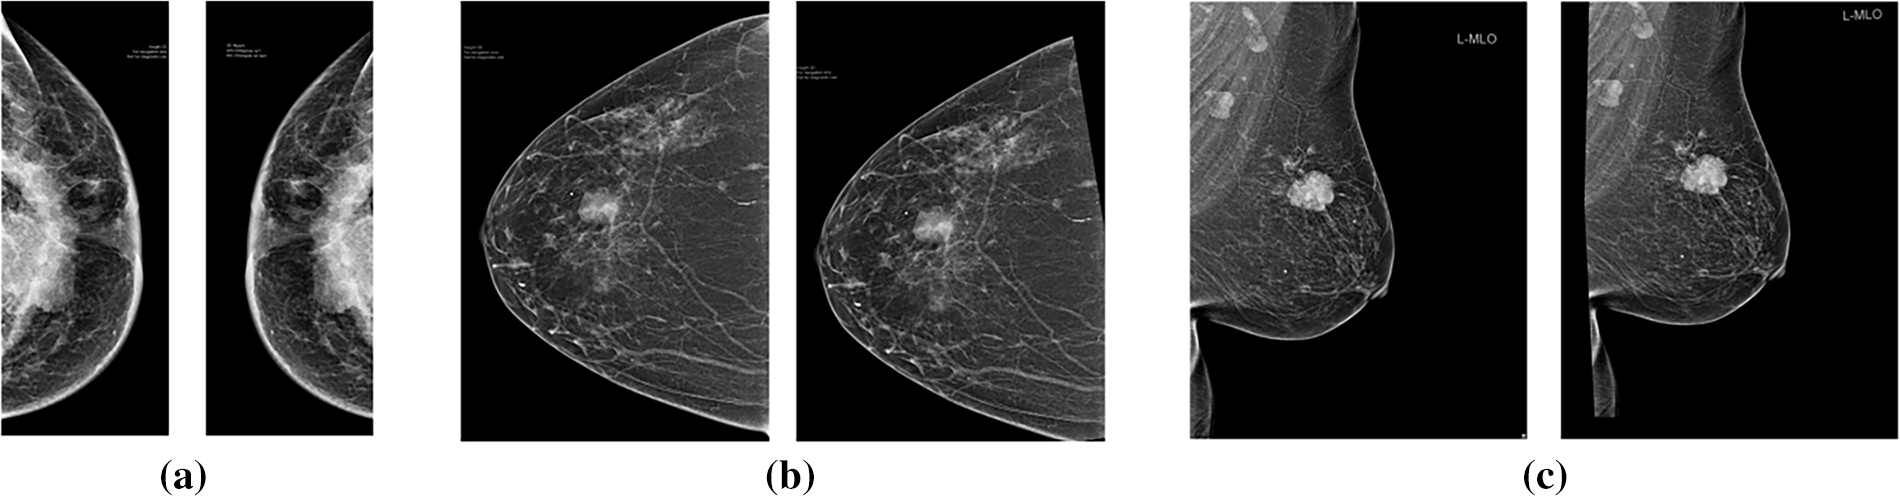
Figure 2: Original (left) and augmented (right) mammographic image with: (a) random horizontal flipping; (b) random rotation; (c) random affine transformation incorporating rotation and translation
Most pre-trained deep learning models, including Vision Transformers and CNNs, require input images of a fixed size to ensure compatibility with their architecture. In this study, all mammographic images were resized to 224 × 224 pixels using bilinear interpolation, which balances computational efficiency and image quality. This resizing helps reduce GPU memory usage and accelerates training and inference. The bilinear interpolation process is illustrated in Fig. 3 and Eq. (1).
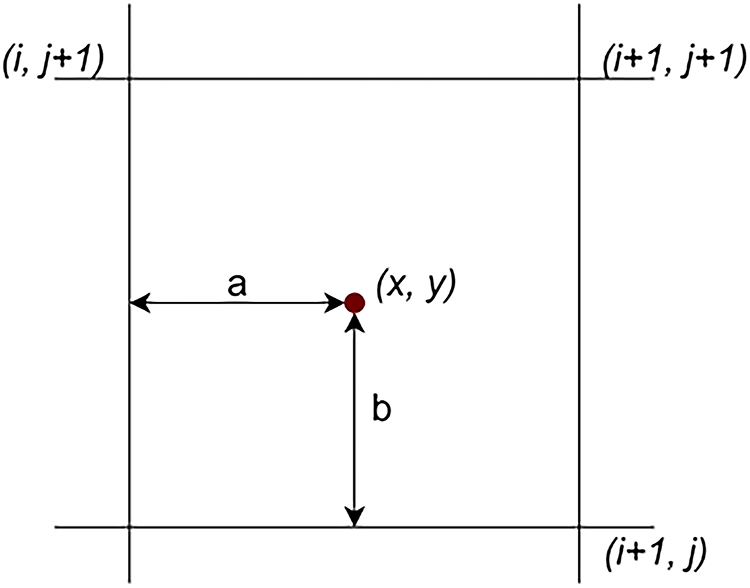
Figure 3: Illustration of bilinear interpolation calculation [20]
Normalization is an essential preprocessing step that improves training stability and model performance by standardizing pixel intensity ranges. In this study, Min-Max scaling (Eq. (2)) was applied to rescale pixel values to the [−1, 1] range, ensuring consistent input magnitudes across all images. This helps prevent features with larger values from dominating the learning process and facilitates faster model convergence.
where
X_min is the minimum pixel value in the original input range.
X_max is the maximum pixel value in the original input range.
MobileNet-V3 is a lightweight, efficient deep learning architecture designed for high accuracy with minimal computational resources. This study employs the ImageNet-pretrained MobileNet_V3_Large variant, chosen for its balance of efficiency and robust performance, making it well-suited for resource-constrained environments. Its architecture (see Fig. 4a) features depthwise-separable convolutions, which significantly reduce computation while maintaining accuracy, alongside a Squeeze-and-Excitation (SE) module for enhanced feature extraction via an attention mechanism [25–27]. The linear bottleneck module further optimizes activation functions based on input dimensionality for effective feature capturing [28]. MobileNet_V3_Large is particularly effective for cancer detection and demonstrates superior generalization with limited datasets due to its streamlined design, reducing overfitting compared to larger models like VGG-19 and ResNet-50 [11].
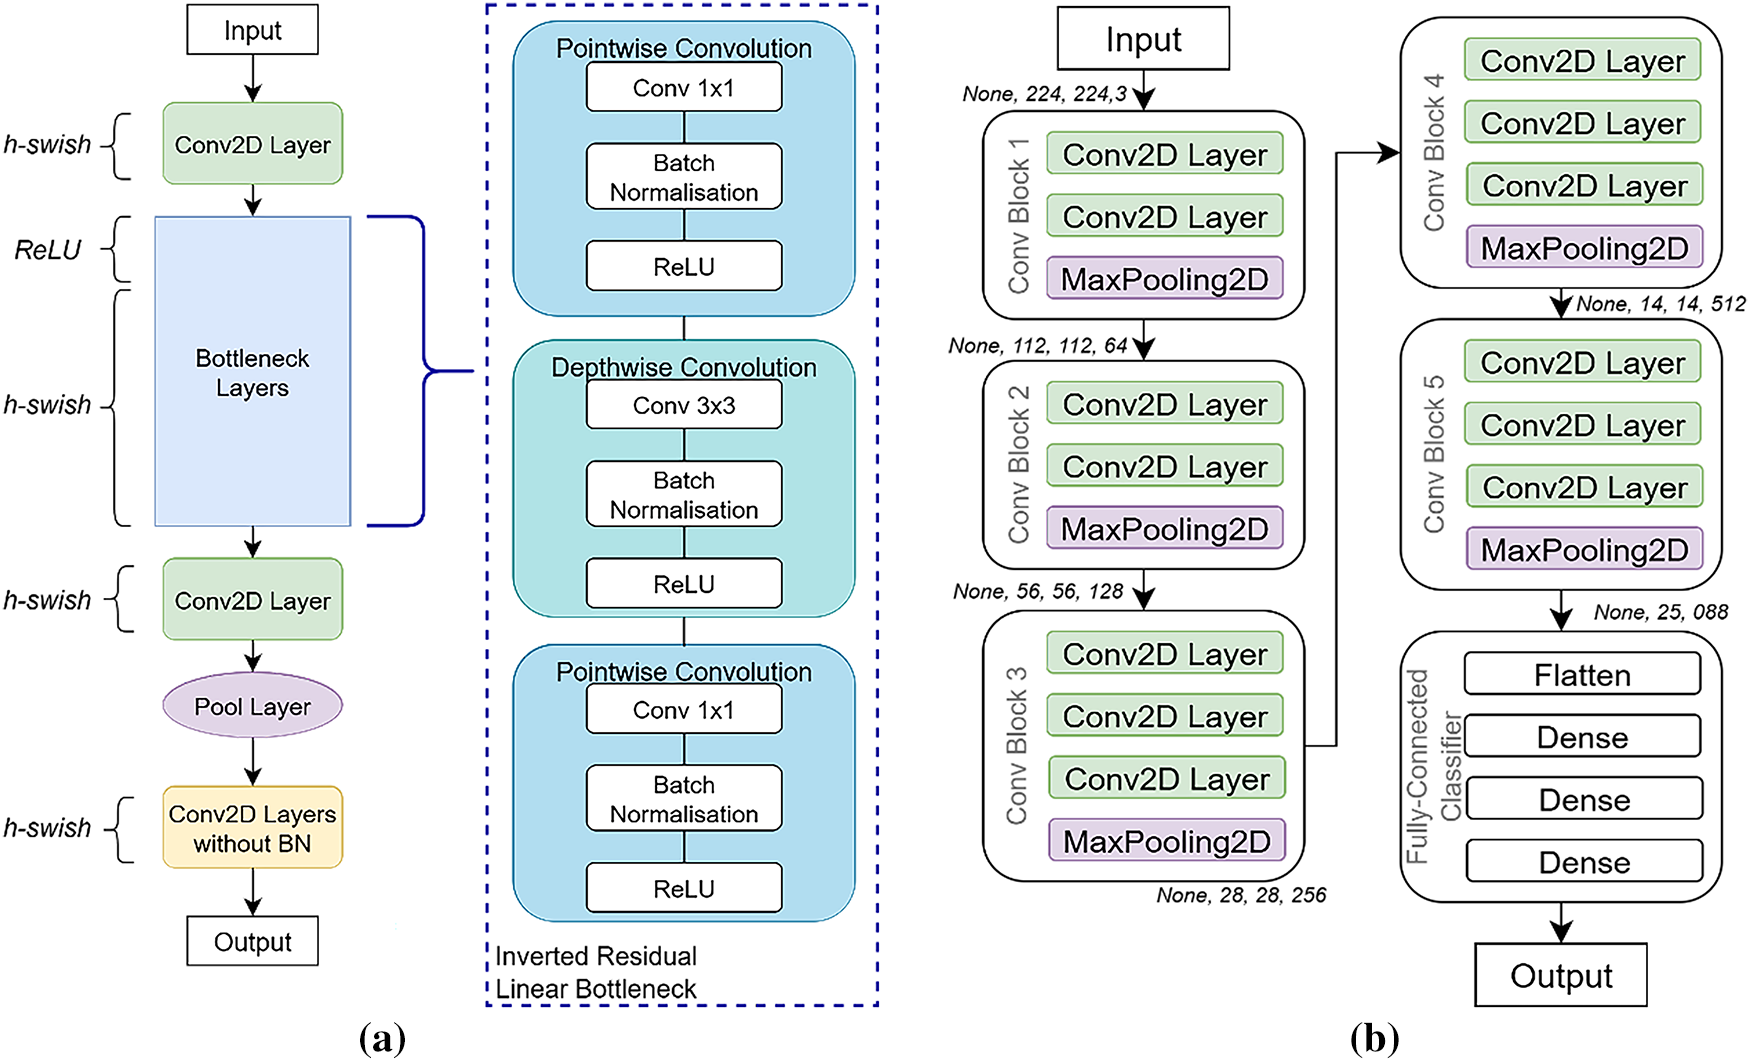
Figure 4: Convolutional neural networks (CNNs) architectures: (a) MobileNet_V3_Large (b) VGG-16
The VGG-16 network, pre-trained on the ImageNet database, is a robust deep learning architecture known for its exceptional accuracy, even with smaller datasets, thanks to its extensive initial training [19]. Its architecture (see Fig. 4b) consists of 13 convolutional layers, each using small 3 × 3 receptive fields for detailed feature extraction. Five 2 × 2 Max pooling layers are interspersed to downsample feature maps and reduce spatial dimensions. The network concludes with three fully connected layers, and a softmax layer provides the final class probabilities. All hidden layers incorporate ReLU activation functions to introduce non-linearity and enhance feature learning [29].
The Vision Transformer (ViT) architecture represents a paradigm shift in computer vision, adapting the Transformer architecture from natural language processing directly to image data [30]. Unlike traditional CNNs, ViT treats an image as a sequence of fixed-size, non-overlapping patches (see Fig. 5). These patches are flattened and linearly projected into an embedding space, combined with learnable position embeddings, and prepended with a special “classification token” (CLS token) [30,31]. This sequence is then fed into a Transformer encoder, which features multiple layers, each containing a Multi-Head Self-Attention (MHSA) mechanism and a Feed-Forward Network (FFN) [32]. The MHSA mechanism is crucial as it allows the model to capture global contextual relationships between different image patches, a significant advantage over CNNs’ local receptive fields. Layer normalization and residual connections ensure model stability and gradient flow. Finally, the output embedding of the CLS token passes through a Multilayer Perceptron (MLP) head to perform the final classification [32]. The ViT_B_16 model, commonly pre-trained on the ImageNet dataset, offers a balanced trade-off between computational demands and expressive power, enabling the transfer of rich, generalized visual features for tasks like breast cancer molecular subtype classification [30].
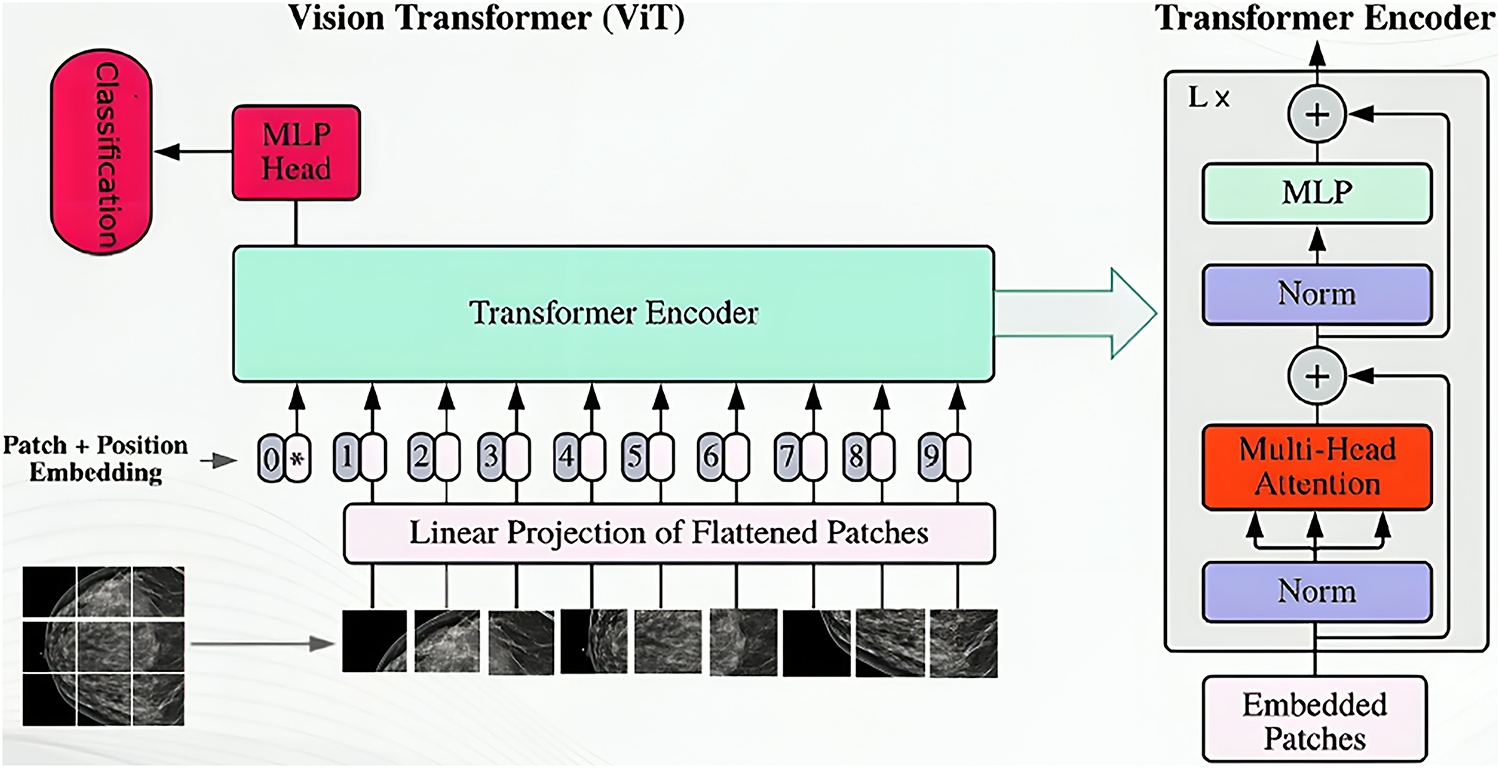
Figure 5: Vision transformer architecture
3.3.4 ViT_Base_Patch16_Clip_224
This study also utilizes the ViT_Base_Patch16_Clip_224 variant of the Vision Transformer [33]. Like other ViT models, it processes images using patch embedding, positional encoding with a classification token, a Transformer encoder, and an MLP head [30]. A key distinguishing feature is its pre-training strategy, CLIP_224, which indicates initialization with weights from Contrastive Language-Image Pre-training (CLIP) [34]. CLIP learns highly generalized visual representations by training on a massive dataset of 400 million image-text pairs, aligning visual concepts with natural language semantics (see Fig. 6). This extensive and diverse pre-training equips ViT_Base_Patch16_Clip_224 with a robust understanding of visual features, making it highly adaptable and efficient for fine-tuning on domain-specific medical datasets like those for breast cancer molecular subtype classification [34].
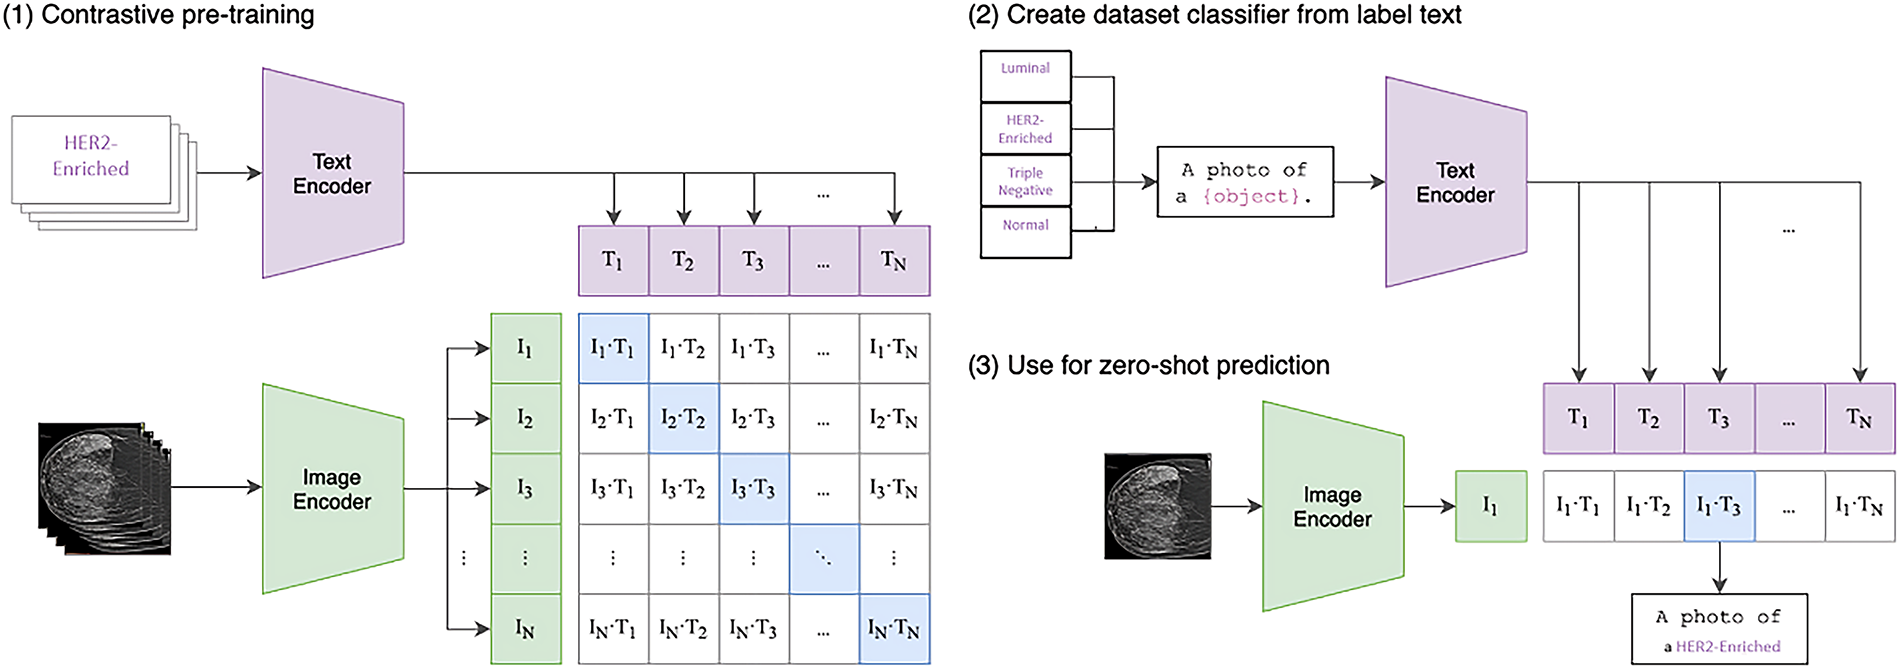
Figure 6: Contrastive language-image pretraining (CLIP)
In short, Convolutional Neural Networks (CNNs), such as VGG-16 and MobileNet-V3, have been widely adopted in medical imaging due to their efficiency in extracting hierarchical spatial features and their relatively low computational cost. Their strengths lie in capturing local texture and edge information, which is particularly useful for lesion detection in mammograms. However, CNNs are inherently limited by their locality bias and pooling operations, which can reduce their ability to capture global contextual dependencies. In contrast, Vision Transformers (ViTs) leverage self-attention mechanisms to model long-range feature relationships across the entire image, making them more suitable for capturing complex tissue patterns and subtle inter-class differences in breast cancer subtyping. Despite this advantage, ViTs typically require larger datasets and higher computational resources to achieve optimal performance.
The computational complexity of the proposed framework is primarily determined by the underlying neural architectures. For a standard Convolutional Neural Network (CNN), the complexity of a convolutional layer can be expressed as:
where K is the kernel size, Cin and Cout are the input and output channel dimensions, and H × W represents the spatial resolution of the feature map.
In contrast, the Vision Transformer (ViT) introduces complexity from its self-attention mechanism. For an image partitioned into N patches with embedding dimension D, the multi-head self-attention layer has a complexity of:
The quadratic term O(N2⋅D) arises from the pairwise attention score computations, which becomes the dominant cost for larger patch counts. Given that the input mammograms were resized to 224 × 224 pixels and divided into 16 × 16 patches (yielding N = 196), the self-attention computation remains tractable in practice.
The pretrained ViT_Base_Patch16_Clip_224 model balances accuracy and efficiency, requiring fewer FLOPs compared with deeper CNNs (e.g., ResNet-101), while providing stronger global feature representation. This trade-off highlights that while ViT introduces quadratic attention complexity, the reduced patch count and optimized architecture make the approach computationally feasible for clinical use.
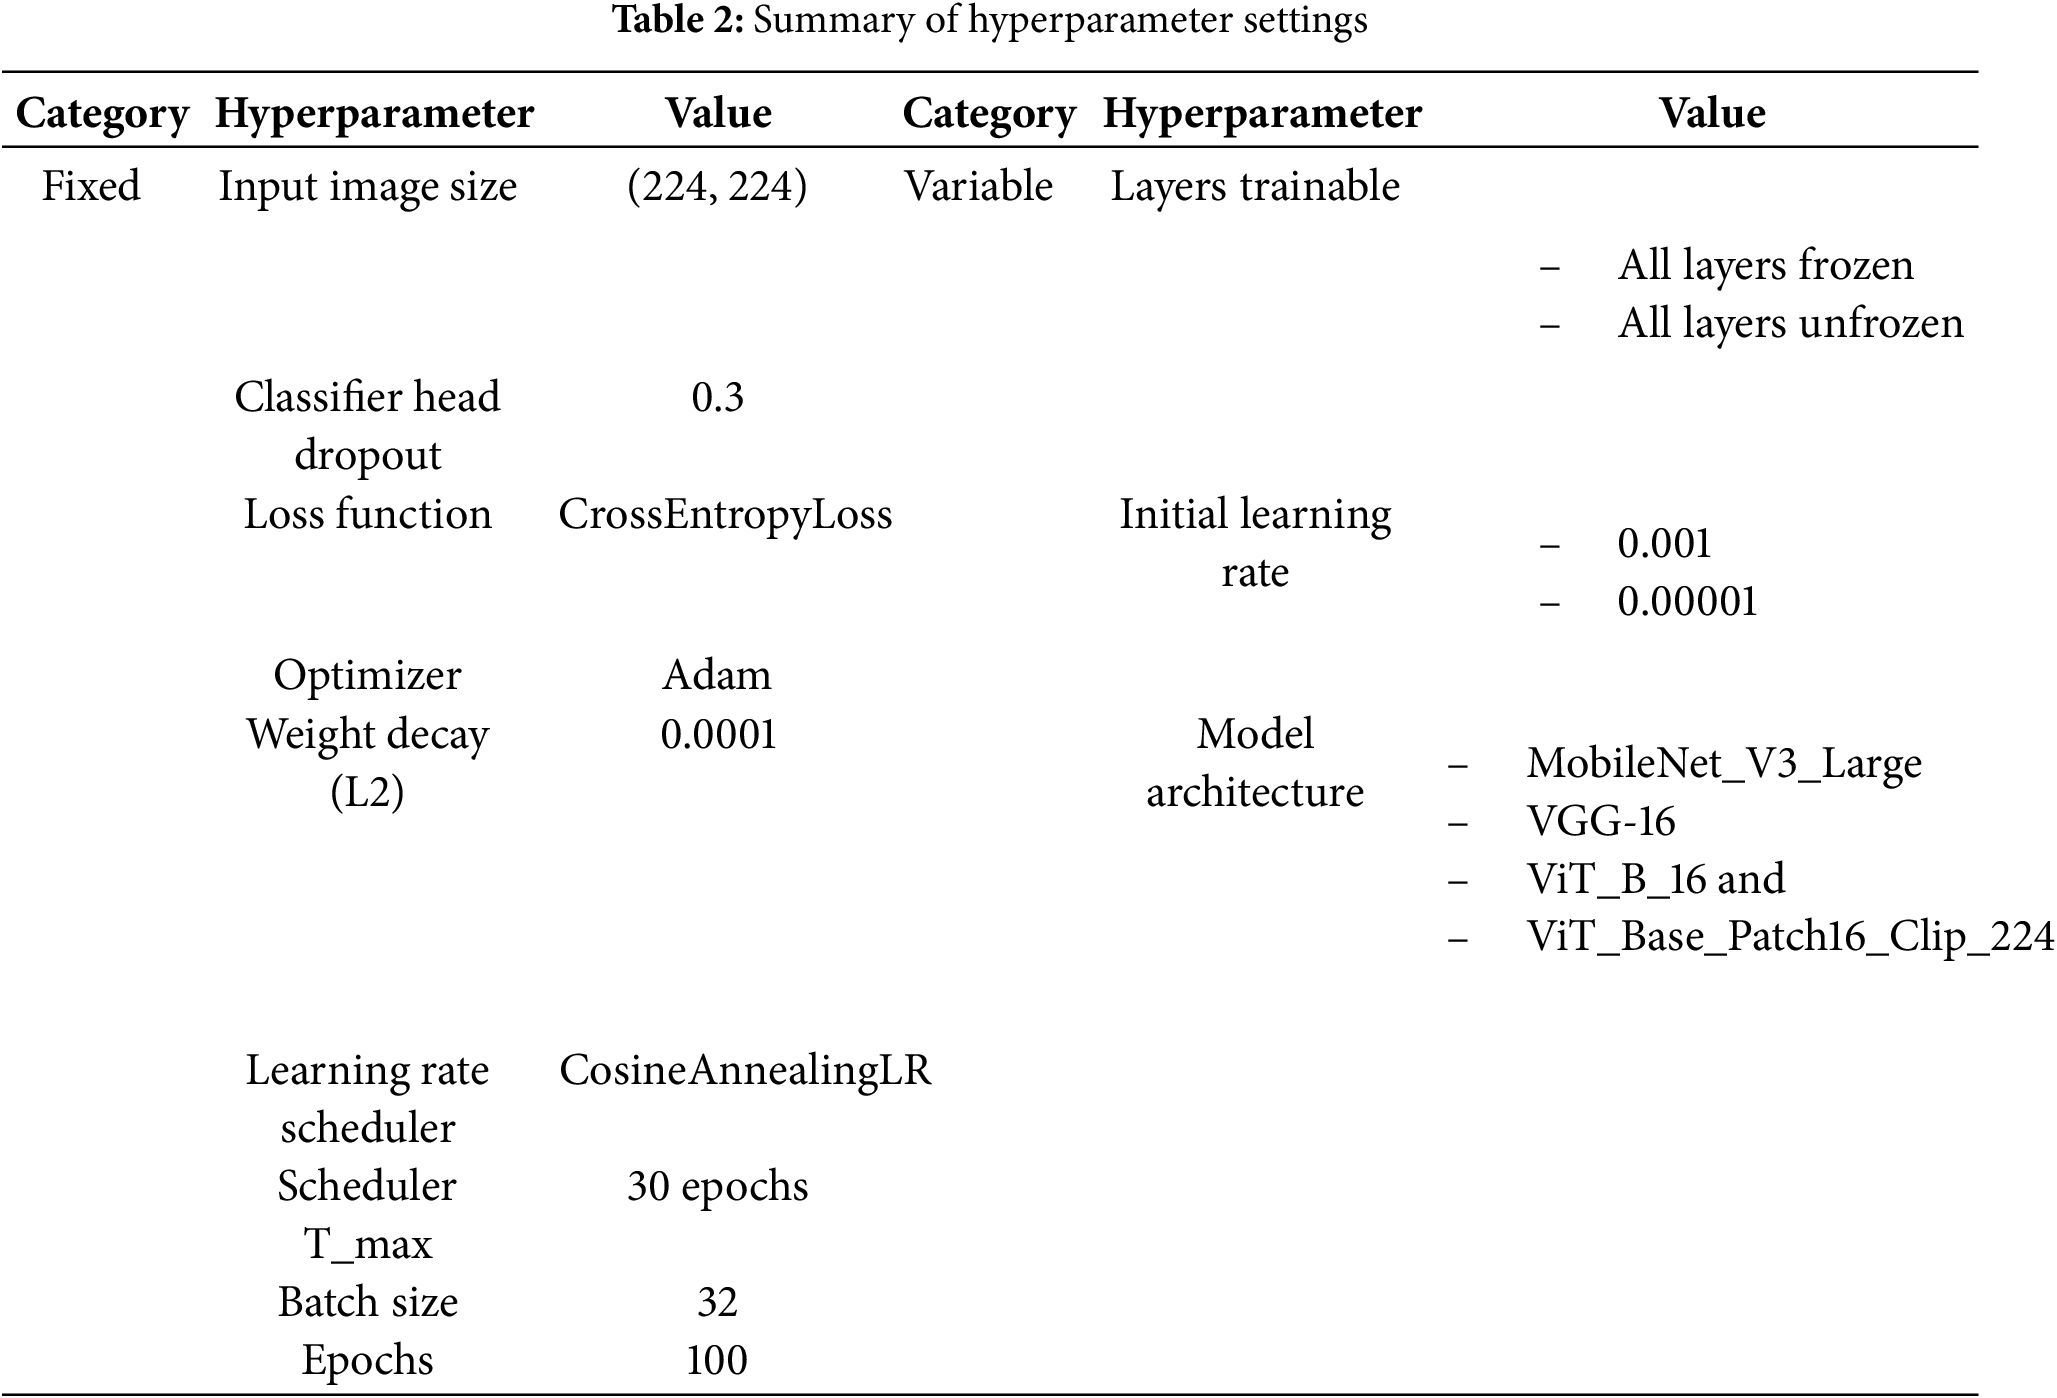
This section details the key hyperparameters used during model training, as summarized in Table 2. These settings were consistently applied across all proposed architectures to ensure a fair and valid comparative analysis. Besides, to evaluate the effect of different training configurations, experiments were conducted by freezing and unfreezing all layers of the model except the final classification head for adapting the pretrained model to the four-class subtype task. Freezing the layers indicates keeping the pretrained weights unchanged during training, allowing only the final classifier to learn, whereas unfreezing allows all layers of the model to be fine-tuned, enabling the network to learn task-specific features from the new dataset. Each configuration was trained with 0.001 and 0.00001 initial learning rate for Cosine Annealing Learning Rate scheduler to dynamically adjust the learning rate throughout training. These settings have been shown in prior studies to provide stable convergence and prevent overfitting when adapting pretrained networks to small medical datasets [35,36]. While this study was limited to a narrow search space due to computational resources, future work will incorporate broader exploration of hyperparameters, including alternative optimizers, batch sizes, dropout rates, and weight decay, to establish optimal fine-tuning strategies for CNN and Vision Transformer models.
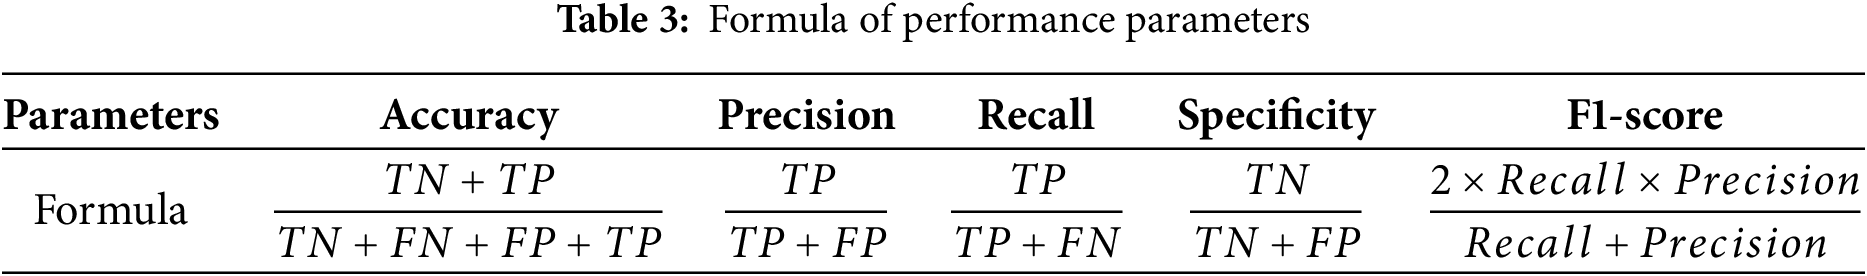
The performance of the classifiers is evaluated using a 4 × 4 confusion matrix, which provides a detailed comparison between predicted and actual classifications across four distinct classes. This matrix enables the calculation of essential metrics such as True Positives (TP), True Negatives (TN), False Positives (FP), and False Negatives (FN) for each class [37]. The 4 × 4 structure directly illustrates the distribution of correct predictions and misclassifications, allowing for a comprehensive evaluation of the quadruple-class model’s performance. Besides, the performance parameters such as accuracy, precision, recall, specificity and F1-score are calculated to assessed the performance of classifier, as shown in Table 3.
During preliminary trials, we observed that some models, particularly VGG-16, achieved perfect (100%) training accuracy under certain configurations. This phenomenon is not indicative of data leakage but rather reflects the model’s strong capacity to memorize the relatively small augmented dataset (1440 images) when trained for 100 epochs. Importantly, validation and testing accuracies remained lower, clearly demonstrating that the generalization gap arises from overfitting. This observation underscores the limitation of dataset size in medical imaging and highlights the necessity of larger and more diverse datasets in future research to mitigate overfitting and improve clinical applicability.
4.1 Performance of Convolutional Neural Networks (CNNs)
4.1.1 Performance of MobileNet_V3_Large
The performance of the pre-trained MobileNet_V3_Large model was significantly influenced by layer freezing strategies and initial learning rates (see Table 4). Freezing all layers resulted in modest to poor performance (e.g., 67.36% testing accuracy with a 0.001 learning rate and 44.44% with 0.00001), indicating underfitting due to limited adaptation to the new dataset. In stark contrast, unfreezing all layers, especially with an initial learning rate of 0.001, yielded superior results, achieving 94.44% testing accuracy and 93.75% validation accuracy with low losses, signifying robust generalization. This optimal configuration also achieved consistently high average precision, recall, and F1-scores of 0.94. Analysis of the loss and accuracy curves over epochs (see Fig. 7) showed rapid initial learning and convergence to high, stable performance by 100 epochs. However, a notable loss spike and corresponding accuracy dip in the validation and testing sets are observed around epoch 55. Upon closer inspection, this fluctuation may be attributed to transient instability in the optimization process, potentially caused by large gradient updates, sensitivity to class imbalance, or exposure to a more complex minibatch due to stochastic sampling. Importantly, the model quickly recovered and stabilized in subsequent epochs, suggesting that the chosen learning rate and optimizer provided sufficient corrective adjustment. While the temporary instability did not affect final convergence, it underscores the sensitivity of MobileNet_V3_Large to training dynamics, highlighting the importance of careful learning rate tuning and monitoring of gradient behavior in future work.
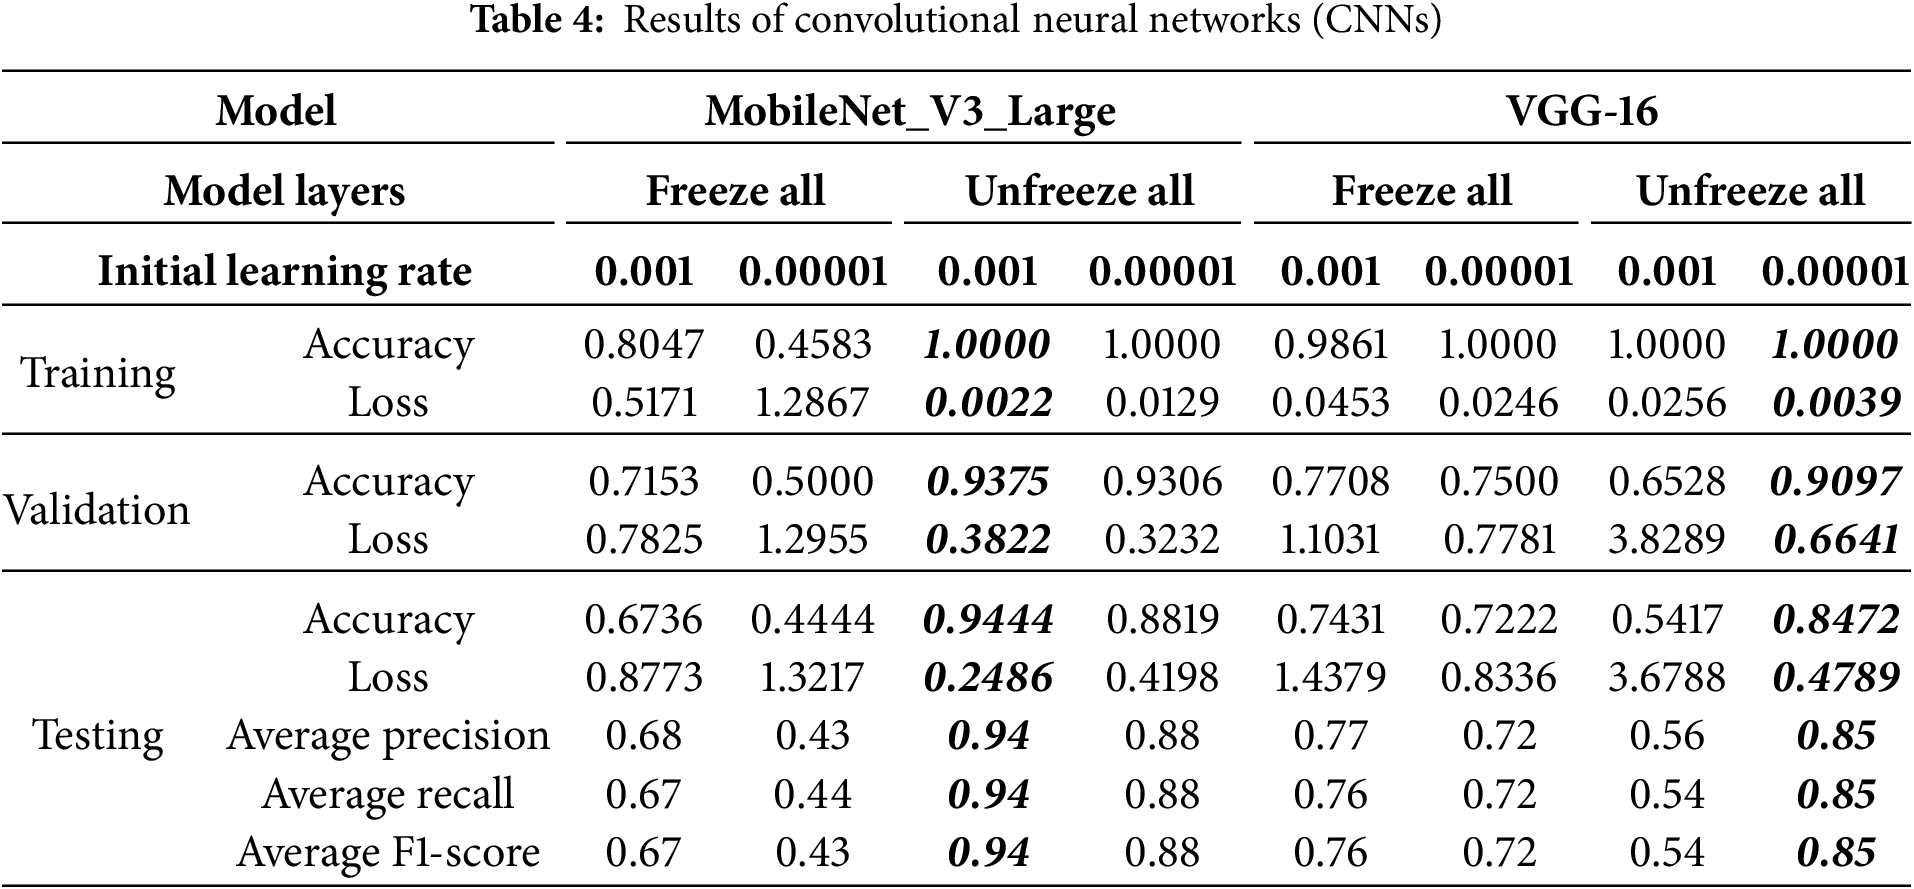
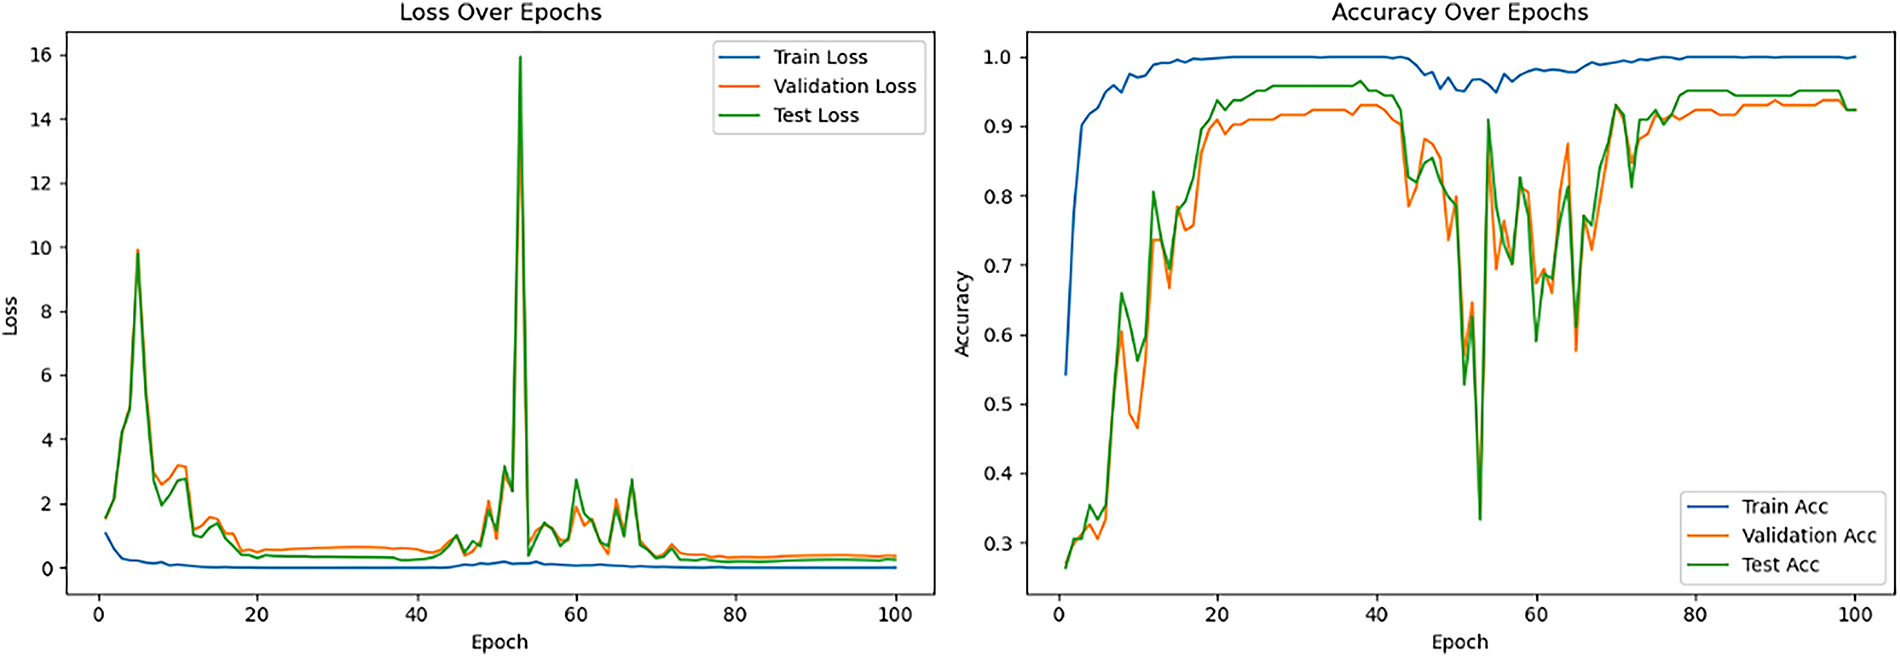
Figure 7: Loss and accuracy curve for the best-performing pretrained MobileNet_V3_Large model
Table 4 also details the performance of the pre-trained VGG-16 model, revealing that its optimal training conditions differed from MobileNet_V3_Large. When VGG-16 layers were frozen, the model achieved respectable testing accuracies (e.g., 74.31% with 0.001 learning rate), with lower learning rates improving loss stability. In contrast, unfreezing all layers with a 0.001 learning rate led to severe overfitting and very poor generalization (54.17% testing accuracy). However, the best overall performance (84.72% testing accuracy, 90.97% validation accuracy, and lowest losses) was achieved when unfreezing all layers with a much lower initial learning rate of 0.00001. This highlights VGG-16’s greater sensitivity to learning rate during full fine-tuning, requiring very small values to prevent catastrophic forgetting and ensure stable convergence. For this optimal configuration, average precision, recall, and F1-score all reached 0.85. The learning curves (see Fig. 8) demonstrated rapid training accuracy to 100%, with validation and test accuracy maintaining high performance. It is noteworthy that VGG-16 achieved perfect training accuracy (100%) under several configurations, even with frozen layers. This reflects the model’s high capacity to memorize the relatively small augmented dataset (1440 images), rather than genuine task generalization. The discrepancy between perfect training accuracy and lower validation/testing accuracy indicates overfitting, not data leakage. This phenomenon highlights the challenge of limited dataset size in medical imaging and underlines the need for larger, more diverse datasets in future work. After their initial descent, the validation and testing loss curves fluctuate but remain relatively stable during the final 20 epochs. Besides, the test loss remains consistently lower than the validation loss in the later epochs, this could be due to the specific characteristics or distribution differences between the test and validation datasets.
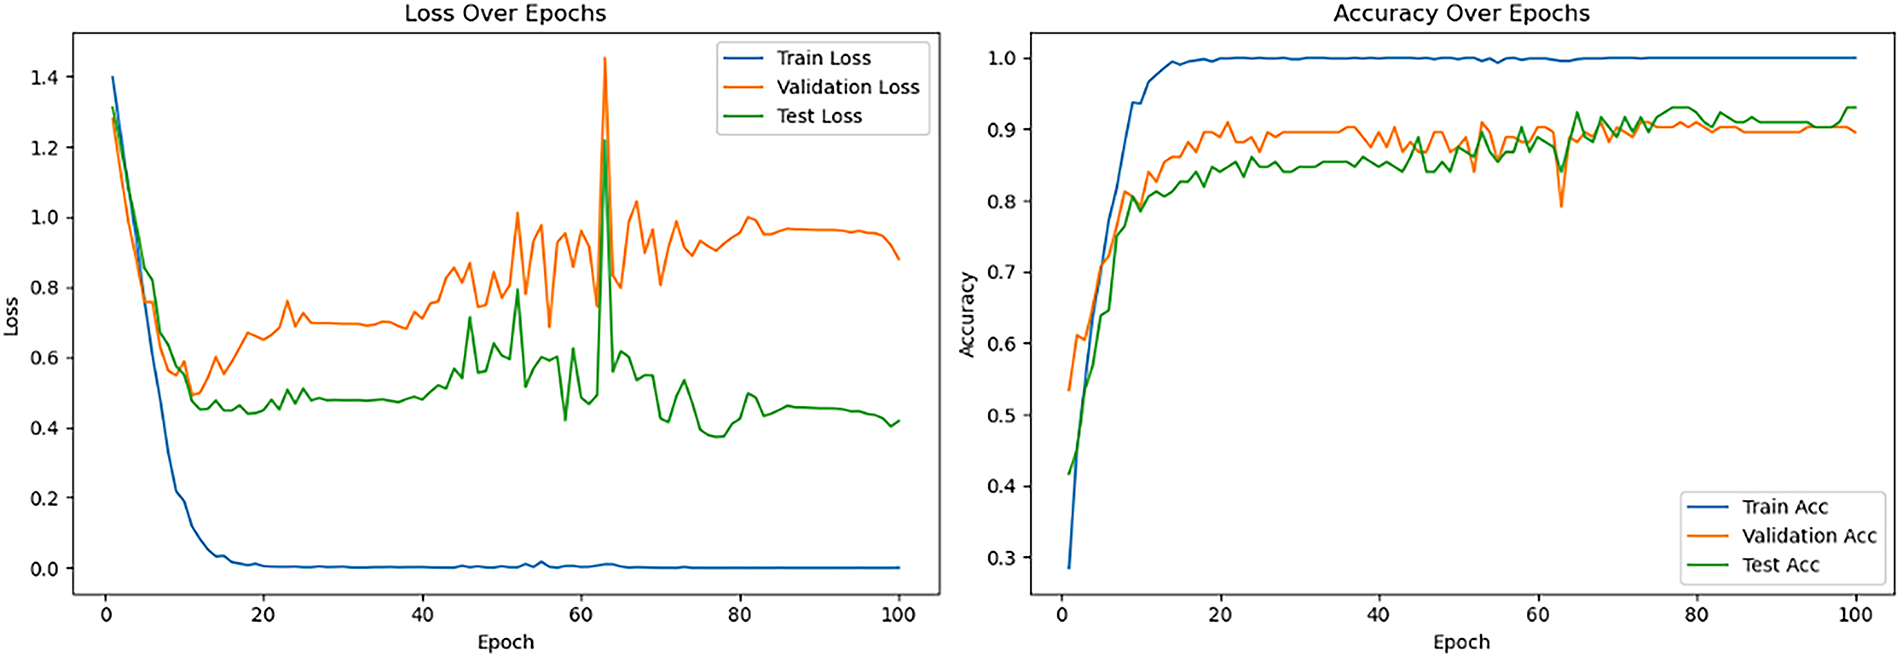
Figure 8: Loss and accuracy curve for the best-performing pretrained VGG-16 model
4.2 Performance of Vision Transformers (ViTs)
Table 5 details the performance of the pre-trained Vision Transformer models, which proved highly sensitive to fine-tuning strategies and learning rates. For Vision Transformer Base-16 (ViT_B_16) model, when layers were frozen, moderate performance was observed (71.53% testing accuracy with 0.001 learning rate), with lower rates significantly degrading results, indicating that a higher learning rate was necessary for the classification head. Conversely, the “Unfreeze all” strategy with a 0.001 learning rate led to extremely poor performance due to training instability. However, reducing the initial learning rate to 0.00001 under the “Unfreeze all” configuration yielded the best overall results, achieving 90.97% testing accuracy and 96.53% validation accuracy with remarkably low losses. This highlights that full fine-tuning of ViT_B_16 requires a very small learning rate for stable updates and effective adaptation. For this optimal setting, average precision, recall, and F1-score reached between 0.90 and 0.91. The corresponding learning curves (see Fig. 9) demonstrated rapid convergence, stable high performance for validation and testing, and notably lacked the divergences seen in CNNs, indicating robust generalization.
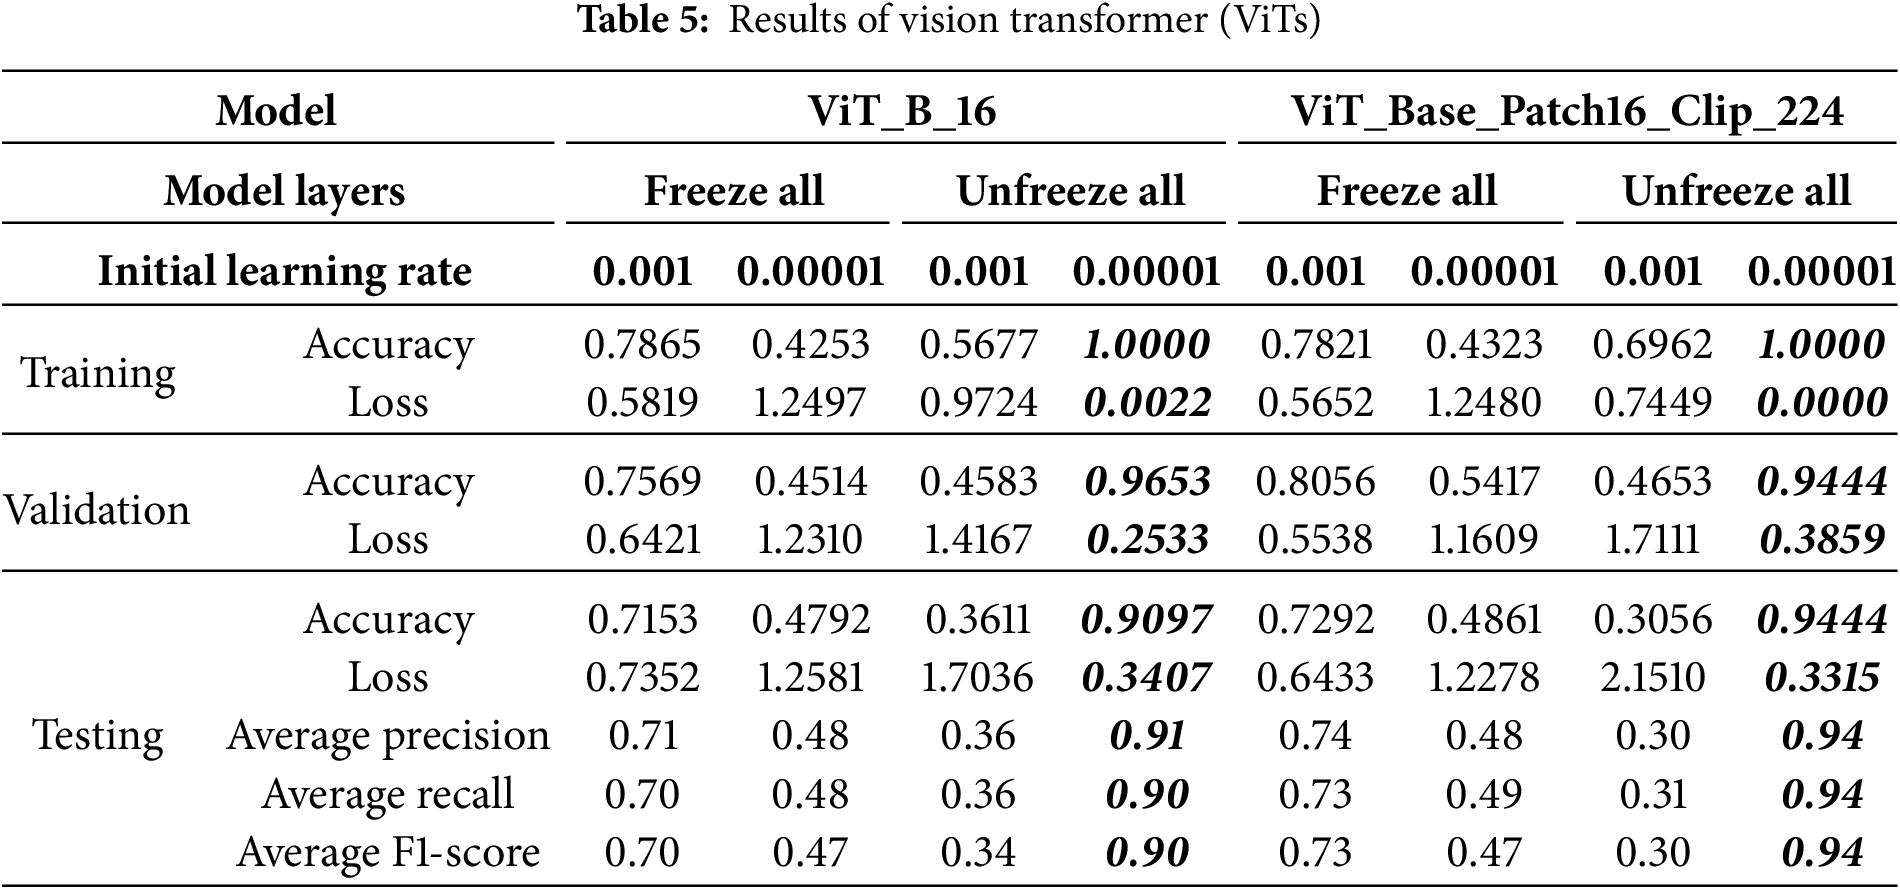
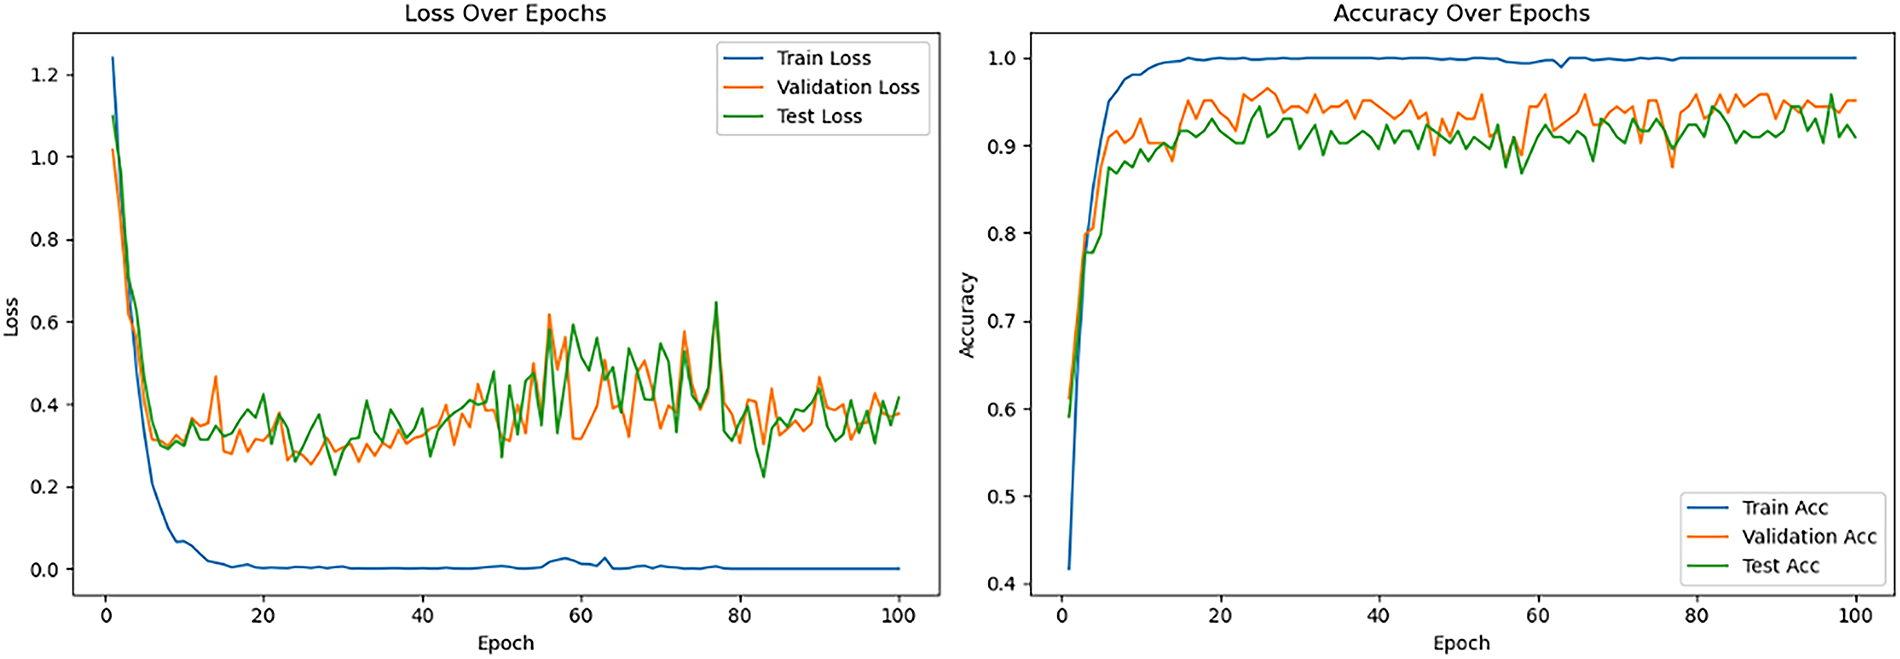
Figure 9: Loss and accuracy curve for the best-performing pretrained ViT_B_16 model
4.2.2 Performance of ViT_Base_Patch16_Clip_224
Table 5 also summarizes the ViT_Base_Patch16_Clip_224 model’s performance, highlighting its sensitivity to hyperparameters due to its CLIP pre-training. Under the “Freeze all” strategy, a 0.001 learning rate yielded moderate performance (72.92% testing accuracy), outperforming a lower rate (48.61%), indicating a need for a higher learning rate for the new classification head. Conversely, with “Unfreeze all,” a 0.001 learning rate resulted in severely poor performance (30.56% testing accuracy) due to destabilization of the vast parameters. However, reducing the learning rate to 0.00001 under “Unfreeze all” achieved the best results: 94.44% validation and testing accuracy, negligible training loss, and peak average precision, recall, and F1-scores of 0.94. This underscores that fine-tuning CLIP-pretrained ViTs demand very small learning rates to preserve acquired knowledge and ensure stable optimization. The learning curves (see Fig. 10) showed rapid training convergence, strong testing generalization, though validation loss occasionally rose, potentially indicating mild overfitting to the validation set or dataset differences. Although the training confusion matrix (Fig. 11a) shows perfect classification, it indicates overfitting, where the model memorized the small training dataset during 100 epochs of fine-tuning. The more reliable indicators of generalization are the validation and test sets (Fig. 11b,c), where the model achieved strong but not perfect performance. This distinction is crucial, as overfitting is a common issue in deep learning with limited medical datasets [38].
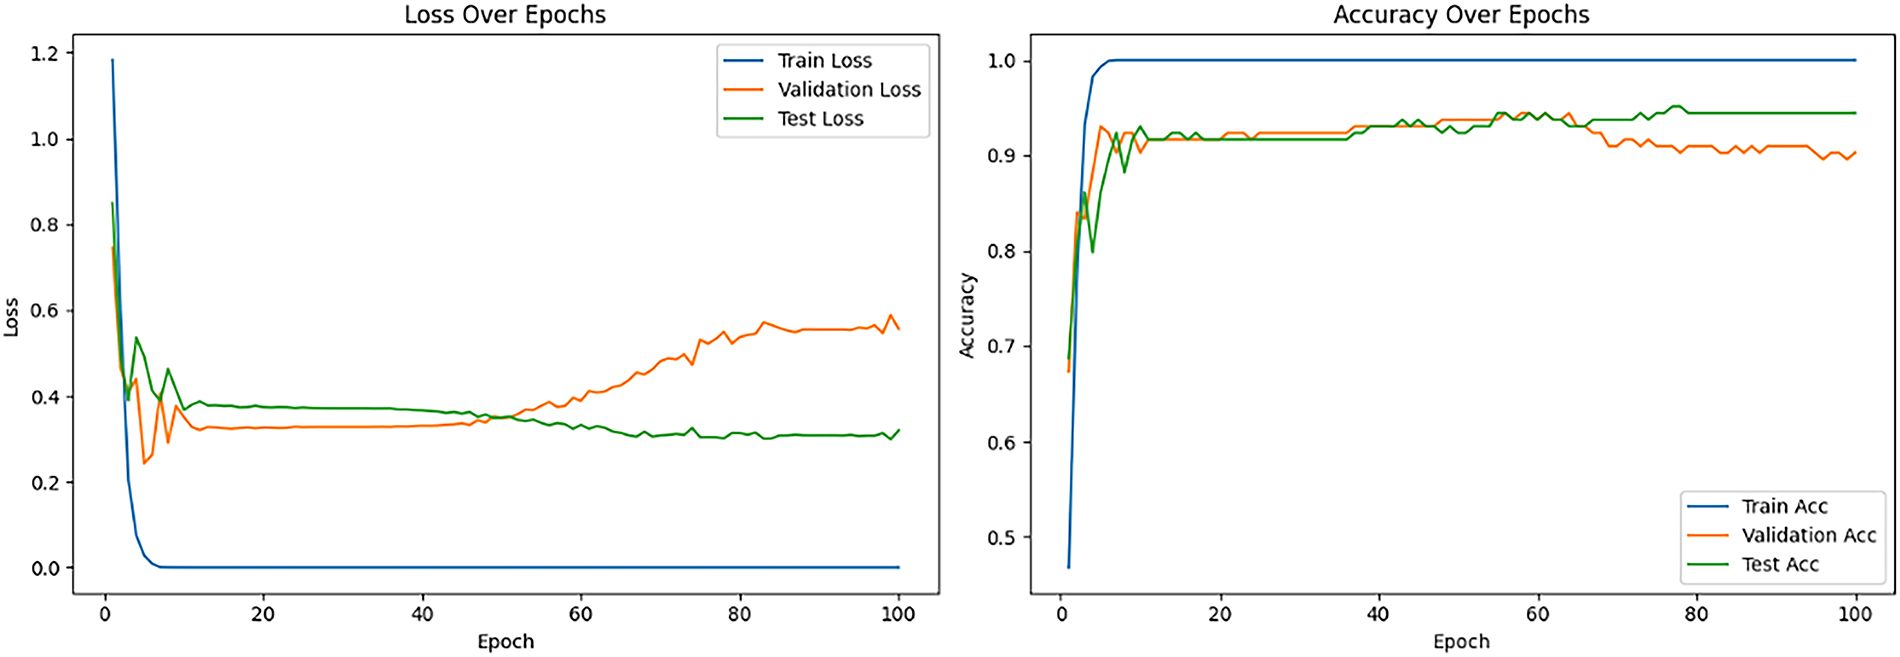
Figure 10: Loss and accuracy curve for the best-performing pretrained ViT_Base_Patch16_Clip_224 model
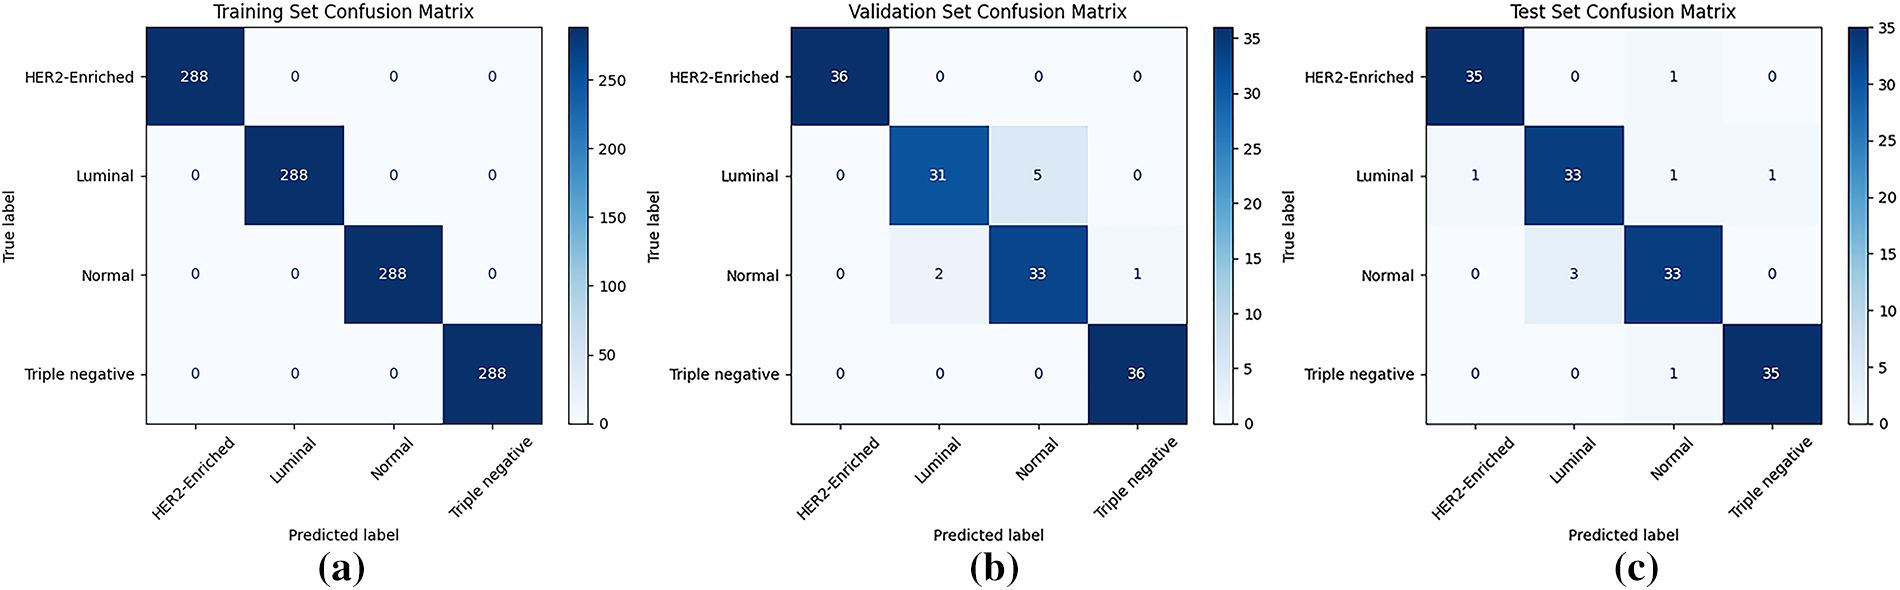
Figure 11: Confusion matrix for the best-performing pretrained ViT_Base_Patch16_Clip_224 model: (a) training set; (b) validation set; (c) testing set
Although ViT_Base_Patch16_Clip_224 achieved 94.44% accuracy, precision, recall, and F1-score on the test set, this outcome should be interpreted carefully. Medical imaging research is often constrained by relatively small datasets, particularly for specialized tasks such as molecular subtyping [36]. This limitation, combined with the subtle visual overlap between certain subtypes (e.g., Normal-like vs. Luminal), means that the reported performance may partly reflect dataset-specific adaptation rather than universal robustness. Nevertheless, the results provide a strong proof-of-concept, suggesting that pretrained Vision Transformers can extract meaningful features even from modest datasets. Future work will focus on validating this approach using larger, multi-institutional cohorts to better assess true clinical applicability. The confusion matrices (Fig. 11a–c) further support the model’s effectiveness, demonstrating perfect classification on the training set and minimal errors on both validation and testing sets.
A consistent misclassification pattern was observed across models, frequently mistaking normal mammograms for luminal breast cancer and vice versa, with up to six samples misclassified in some models. This recurring error is attributed to textural similarities between normal dense breast tissue and luminal breast cancer, where dense tissue obscures tumors and luminal subtypes often lack distinctive morphological features, making differentiation difficult [39,40]. Furthermore, the 2D nature of mammography contributes to these challenges by superimposing tissues, which can create artificial densities mimicking lesions and complicating accurate classification [41]. To illustrate this challenge, Fig. 12 presents a representative luminal mammogram (with the tumor region of interest highlighted) alongside a normal mammogram from the dataset. Both images exhibit dense parenchymal patterns with comparable texture and brightness distributions, visually demonstrating why the models—and even radiologists—may find these cases difficult to distinguish.
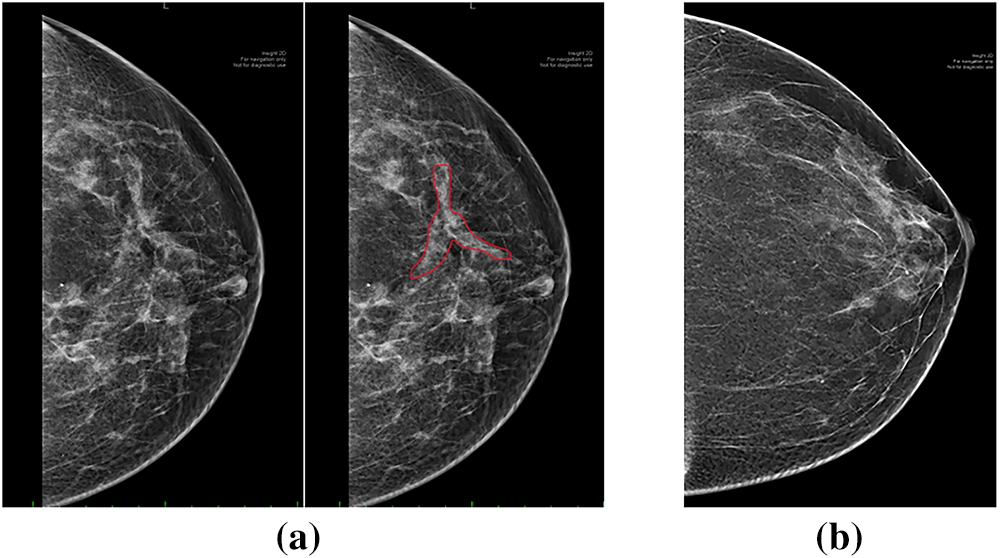
Figure 12: Example of misclassification challenge: (a) luminal mammogram with tumor ROI highlighted; (b) normal mammogram with dense breast tissue
4.3 Comparative Analysis of Model Performances VGG16, MobileNet and ViT
MobileNet_V3_Large, under its optimal configuration, achieved the same peak test accuracy (94.44%) as ViT_Base_Patch16_Clip_224. However, its training curve (Fig. 7) revealed instability with noticeable fluctuations around epoch 55, suggesting less reliable convergence. In contrast, ViT_Base_Patch16_Clip_224 consistently converged to high performance with minimal volatility, supporting its superior robustness. Therefore, while MobileNet showed competitive peak accuracy, the Vision Transformer demonstrated more stable generalization. Importantly, as no statistical significance testing was conducted, these comparisons should be interpreted as descriptive observations rather than definitive claims. Future work should incorporate repeated trials and statistical analyses to better establish the relative performance differences.
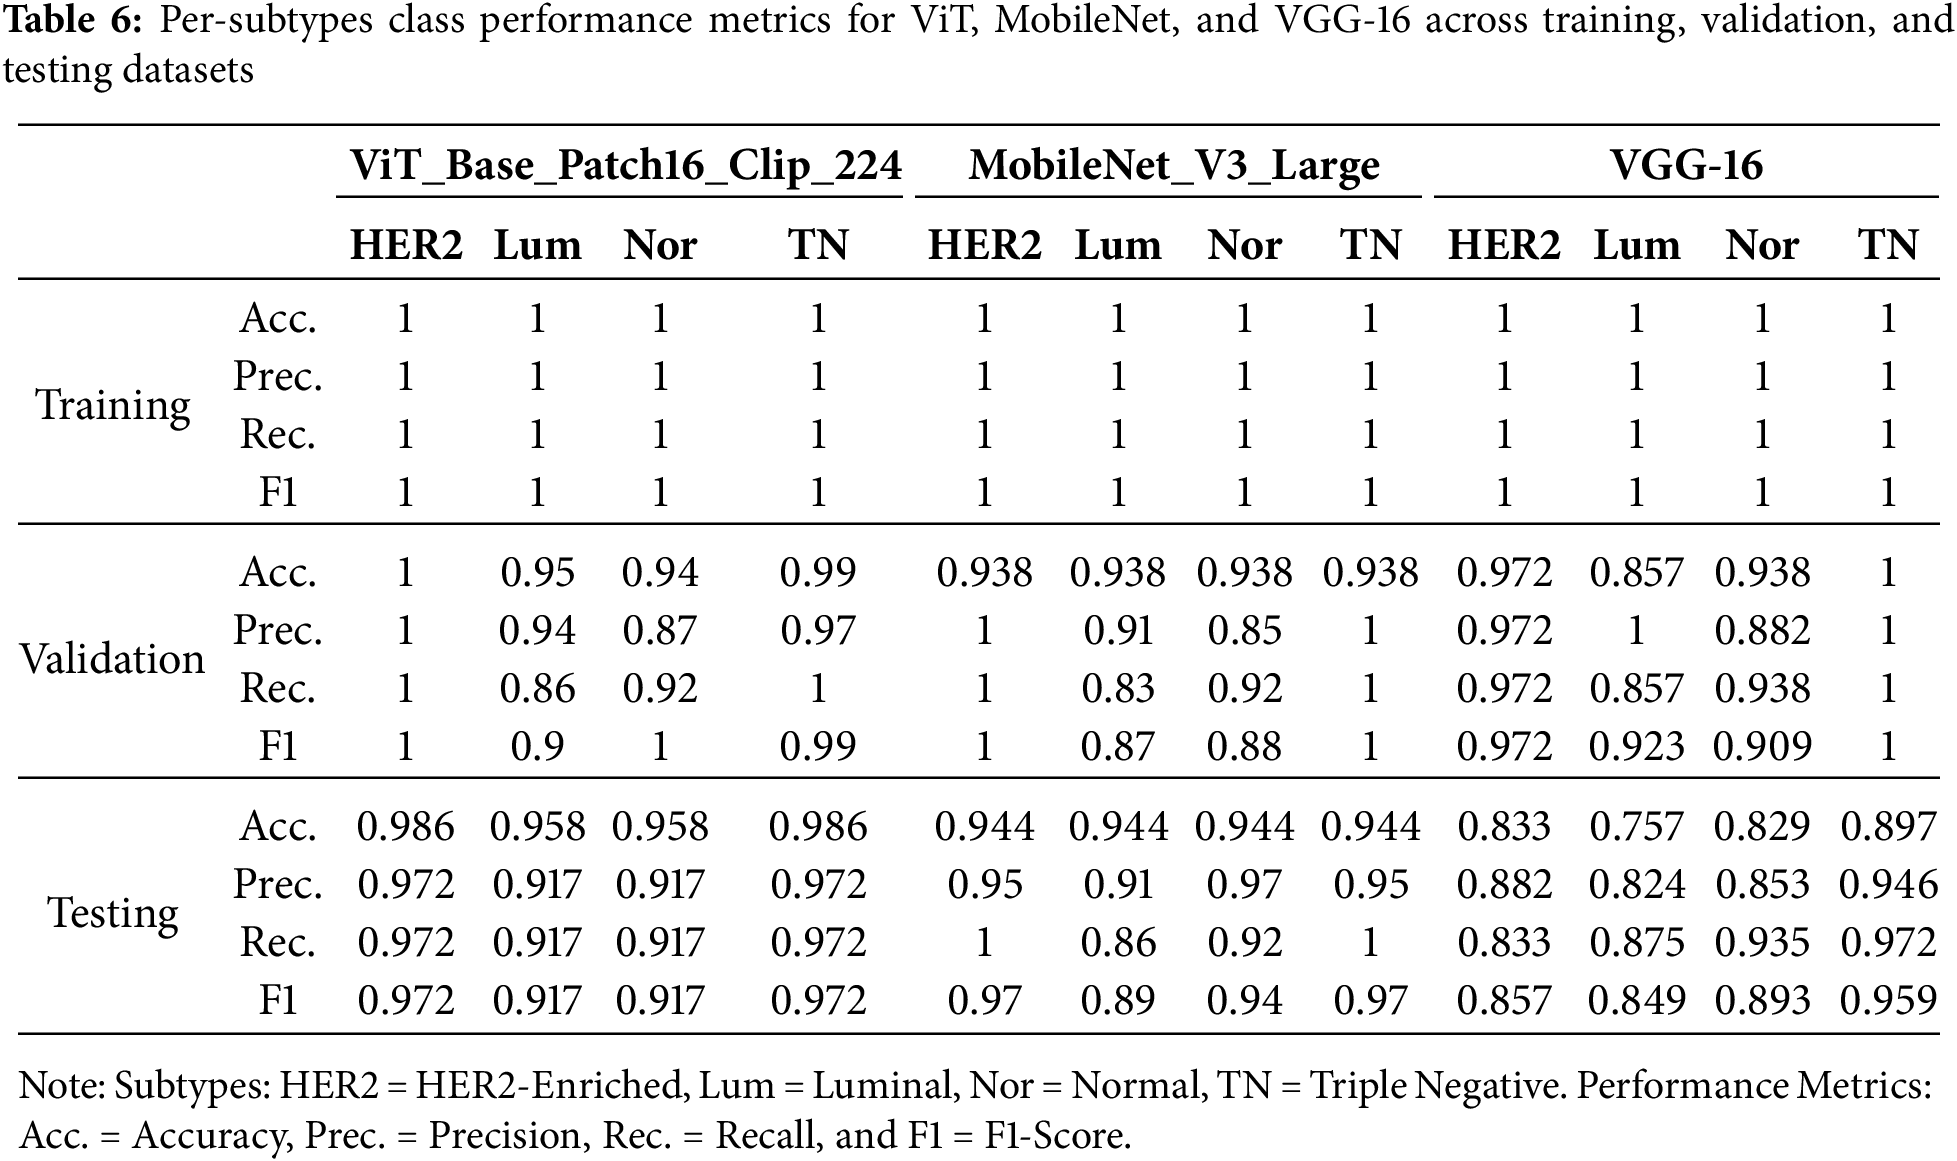
In addition to reporting overall accuracy, precision, recall, and F1-score, model performance was further evaluated at the subtype level. Table 6 summarizes per-class metrics for ViT_Base_Patch16_Clip_224, MobileNet_V3_Large, and VGG-16 across training, validation, and testing datasets. The results indicate that ViT_Base_Patch16_Clip_224 achieved consistently high precision and recall across all four subtypes in the test set (≈0.97 for HER2-Enriched and Triple Negative; ≈0.92 for Luminal and Normal). MobileNet_V3_Large also demonstrated competitive performance, although recall for the Luminal subtype decreased to 0.86, suggesting some sensitivity to class variability. By contrast, VGG-16 exhibited greater instability, particularly for the Luminal subtype (precision ≈ 0.82, recall ≈ 0.88), and overall lower consistency across subtypes. This per-class evaluation demonstrates that while aggregated metrics appear strong, detailed subtype-level analysis reveals critical differences that must be considered in clinically oriented applications.
4.4 Comparative Analysis of Model Performance against Previous Studies
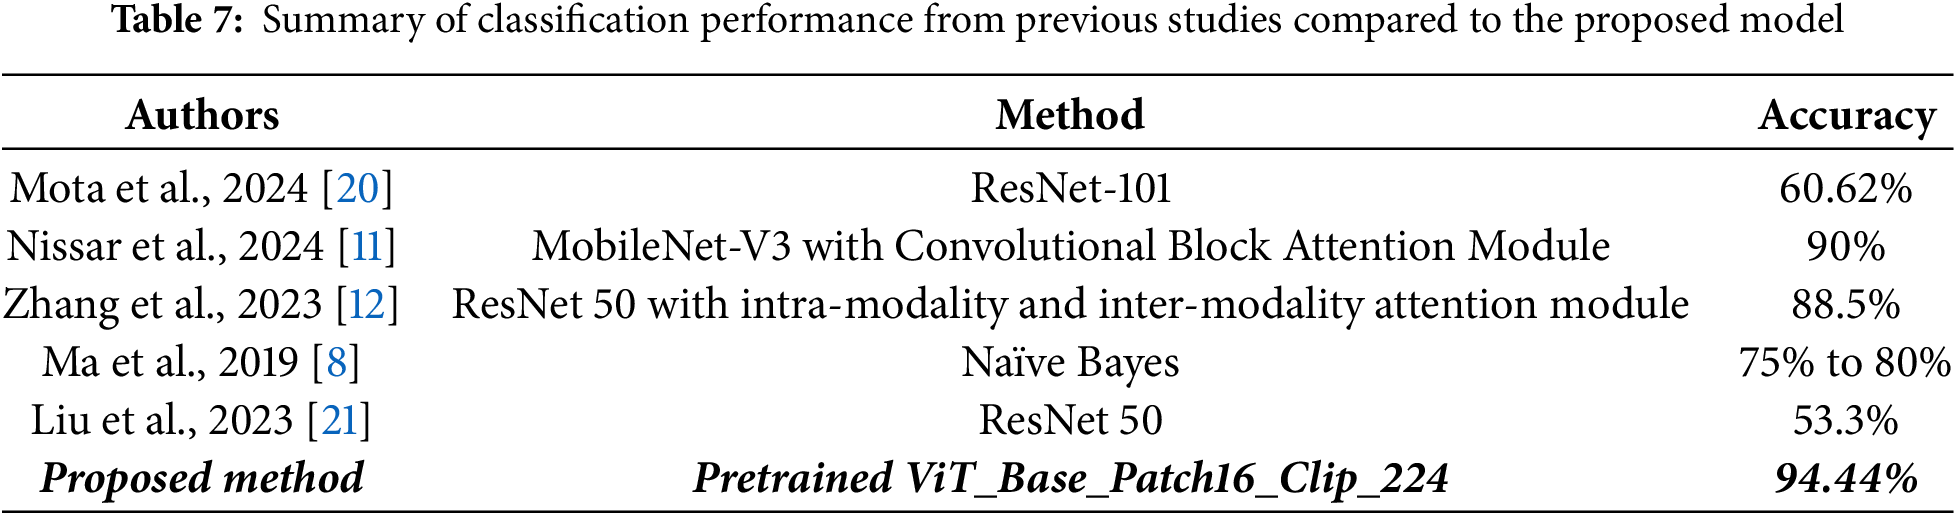
This section compares the proposed ViT_Base_Patch16_Clip_224 model’s performance against previous studies in breast cancer subtype classification using mammographic images, as displayed in Table 7. The model achieved an excellent testing accuracy of 94.44%, which is higher than the reported performance of prior methods, including Nissar et al.’s study [11], MobileNet-V3 with an attention module by 4.44 percentage points. While direct benchmarking across studies is constrained by differences in datasets and experimental settings, these results suggest that the Vision Transformer offers competitive and potentially superior performance for mammogram-based classification. This improvement can be attributed to the Transformer’s ability to capture global contextual information, a key advantage over traditional CNNs, as well as the robust and generalized visual features derived from large-scale CLIP pre-training on diverse datasets. Taken together, this work demonstrates the promise of Vision Transformers in this limited research domain and highlights their potential for developing more accurate diagnostic and decision-support tools.
4.5 Graphical User Interface (GUI)
To demonstrate the potential for clinical deployment, a proof-of-concept GUI application (“BCMS Dx”) was developed (Fig. 13a,b) using Tkinter in Python, with Visual Studio Code as the development environment. The GUI integrates the ViT_Base_Patch16_Clip_224 model and supports single-image and batch predictions for common formats, including DICOM. Outputs include predicted subtypes, confidence scores, and basic visualization tools. While this interface streamlines workflow and facilitates preliminary usability testing, it is presented here primarily as an example of how the trained model could be translated into a practical diagnostic aid.
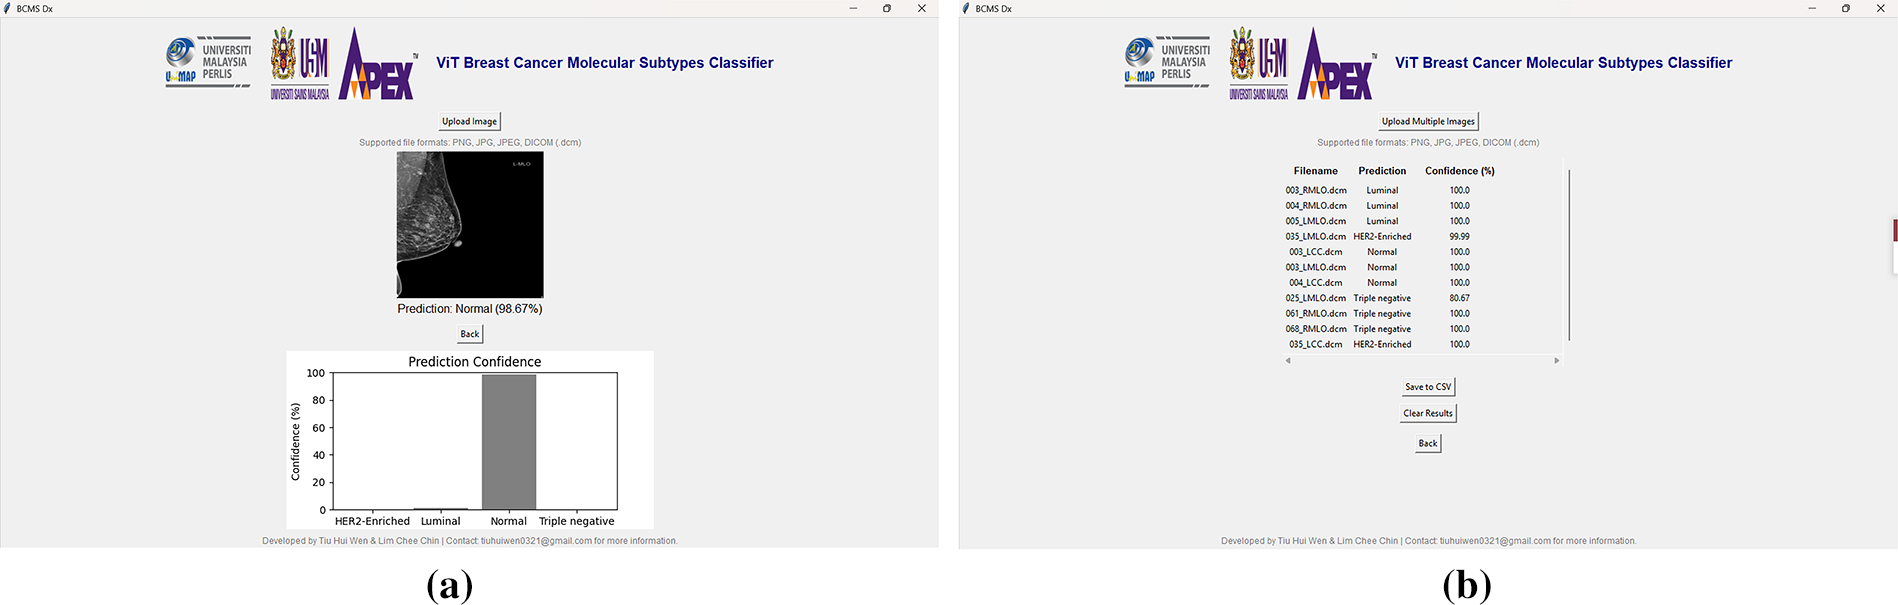
Figure 13: The “BCMS Dx” GUI application: (a) single image prediction interface with uploaded mammographic image and results; (b) batch image prediction interface with uploaded mammographic images and results
This study successfully developed and optimized deep learning models, including Vision Transformers (ViT_B_16, ViT_Base_Patch16_Clip_224) and CNNs (Mo-bileNet_V3_Large, VGG-16), for breast cancer molecular subtype classification using mammographic images. Optimal performance was consistently achieved with the “Unfreeze all” fine-tuning strategy, though the best initial learning rate varied by architecture, with ViTs and VGG-16 preferring 0.00001 while MobileNet_V3_Large favored 0.001. The ViT_Base_Patch16_Clip_224 model emerged as the top performer, attaining an impressive 94.44% test accuracy, matching MobileNet_V3_Large’s best, and surpassing previous studies. This highlights the architectural advantages of Vision Transformers in capturing global contextual information and the benefits of large-scale, diverse pre-training with CLIP for robust generalization in medical imaging.
The clinical relevance of this study lies in its potential to augment decision-making in breast cancer management. Accurate molecular subtype classification is critical for determining targeted therapies and predicting patient prognosis [42]. Currently, subtype determination relies heavily on invasive biopsy and histopathological evaluation, which can be time-consuming and resource intensive [43]. The proposed deep learning framework demonstrates that mammographic images, when analyzed with Vision Transformers and advanced CNNs, can yield subtype-level insights that complement conventional diagnostic workflows. While not a replacement for histopathology, such tools could serve as non-invasive, rapid screening aids to flag high-risk patients, prioritize biopsy candidates, and support clinicians in tailoring personalized treatment strategies. This underscores the translational value of the proposed system and its potential role in advancing precision oncology.
Although the proposed models achieved strong results within our experimental setup, these findings must be interpreted cautiously due to the small and imbalanced dataset. The test set consisted of approximately 144 images, which limits the robustness of the evaluation and increases the risk of overestimating performance. Furthermore, the absence of cross-validation or repeated trials restricts the reliability of claims regarding generalization. Therefore, the reported results should be considered preliminary, serving as a proof-of-concept that pretrained Vision Transformers can effectively adapt to mammographic subtyping tasks. Future studies will focus on incorporating larger, more balanced datasets and adopting cross-validation protocols to ensure stronger statistical validity and more trustworthy clinical generalizability.
However, limitations include a small and imbalanced dataset, the inherent challenge of visualizing certain tumors in 2D mammograms, and computational constraints preventing the exploration of additional architectures and larger model variants. The 2D nature of mammography can lead to tissue overlap, obscuring lesions and contributing to misclassification—particularly between luminal and normal subtypes. Future work should focus on expanding and balancing datasets, exploring advanced 3D imaging modalities such as Digital Breast Tomosynthesis (DBT), which acquires multiple projection images to reconstruct thin slices of the breast, thereby reducing tissue overlapping and improving lesion visibility [39,40]. Furthermore, evaluating other state-of-the-art architectures (e.g., ResNet, EfficientNet, DenseNet, Swin Transformers, ConvNeXt, or Mamba, and emerging Vision Transformer variants), integrating multimodal imaging, incorporating tumor segmentation, and extracting radiomic features could further enhance clinical utility. Overall, this study establishes a strong foundation for AI-assisted breast cancer diagnosis, offering a non-invasive method for complex phenotyping and encouraging broader adoption of Vision Transformers in medical imaging.
Although the dataset size was limited, we adopted an augmentation-before-splitting strategy to balance the classes and ensure representative subsets for training, validation, and testing. This approach, while sometimes debated, is recognized in medical imaging research as a practical solution for small datasets where class imbalance and limited samples can undermine statistical reliability [22]. Nevertheless, future work will focus on expanding the dataset and adopting cross-validation to further strengthen the robustness and generalizability of the proposed models. Future research will investigate multimodal learning strategies that incorporate both image features and DICOM metadata to improve predictive accuracy and clinical relevance.
Although the present study reports point out estimates of accuracy, precision, recall, and F1-score, these values alone may be misleading, particularly for small and non-homogeneous datasets. Reporting classification performance metrics with 95% confidence intervals (CIs) is considered best practice in statistical evaluation, as CIs capture the variability in model predictions and provide a range within which the true performance is likely to fall. Confidence intervals reduce the risk of overinterpreting results that may be inflated by dataset size, imbalance, or sampling bias. Future extensions of this work will incorporate CI estimation methods, such as bootstrapping and cross-validation, to provide a more robust and transparent evaluation of deep learning models in clinical applications.
Another limitation of this study is the restricted hyperparameter optimization process, which was confined to two learning rates (0.001 and 0.00001) and binary fine-tuning configurations (freezing all convolutional layers vs. unfreezing all layers). While sufficient for this proof-of-concept, such a narrow search may not fully capture optimal performance. Future work will employ more systematic tuning strategies, including k-fold cross-validation and broader hyperparameter exploration (e.g., optimizers, batch sizes, dropout, weight decay), to enhance the rigor and reliability of the results.
Another promising direction for future work is the integration of explainable AI (XAI) techniques, such as Gradient-weighted Class Activation Mapping (Grad-CAM) and attention visualization. These methods can generate heatmaps highlighting the regions of mammograms that most strongly influence the model’s predictions [44]. Incorporating such visual explanations would help verify whether the models are attending to clinically relevant features and enhance interpretability and trustworthiness for radiologists. This step is particularly important for building confidence in AI-assisted diagnostic tools and improving their acceptance in clinical practice.
Acknowledgement: This research was supported by the Ministry of Higher Education (MoHE), Malaysia, under the Fundamental Research Grant Scheme—Early Career Researcher (FRGS-EC), Grant No. FRGS-EC/1/2024/ICT02/UNIMAP/02/8. The authors would like to express their sincere gratitude to MoHE for the financial support that made this work possible.
Funding Statement: This research was funded by the Ministry of Higher Education (MoHE) Malaysia through the Fundamental Research Grant Scheme—Early Career Researcher (FRGS-EC), grant number FRGS-EC/1/2024/ICT02/UNIMAP/02/8.
Author Contributions: The authors confirm contribution to the paper as follows: Conceptualization, Chiew Chea Lau and Chee Chin Lim; methodology, Hui Wen Tiu; software, Hui Wen Tiu, Chee Chin Lim; validation, Chiew Chea Lau; formal analysis, Chee Chin Lim; investigation, Qi Wei Oung, Xiao Jian Tan; resources, Chee Chin Lim, Qi Wei Oung; data curation, Chiew Chea Lau; writing—original draft preparation, Hui Wen Tiu; writing—review and editing, Chiew Chea Lau; visualization, Chiew Chea Lau; supervision, Chee Chin Lim, Qi Wei Oung; project administration, Chee Chin Lim, Qi Wei Oung; funding acquisition, Qi Wei Oung. All authors reviewed the results and approved the final version of the manuscript.
Availability of Data and Materials: The data that support the findings of this study are available from the corresponding author, Chee Chin Lim, upon reasonable request.
Ethics Approval: This study involving human participants was reviewed and approved by the Human Research Ethics Committee (Jawatankuasa Etika Penyelidikan Manusia) of Universiti Sains Malaysia (JEPeM-USM), reference number USM/JEPeM/KK/25030246. The study protocol complies with the Declaration of Helsinki, International Conference on Harmonization Good Clinical Practice (ICH-GCP) guidelines, Council for International Organizations of Medical Sciences (CIOMS) standards, World Health Organization (WHO) operational guidance for ethics review, and relevant Malaysian regulations. The informed patient consent was obtained for the use of anonymized mammogram images.
Conflicts of Interest: The authors declare no conflicts of interest to report regarding the present study.
References
1. World Health Organization. Breast cancer [Internet]. 2024 [cited 2024 Oct 22]. Available from: https://www.who.int/news-room/fact-sheets/detail/breast-cancer. [Google Scholar]
2. Breast cancer statistics [Internet]. 2025 [cited 2025 Jan 9]. Available from: https://www.wcrf.org/cancer-trends/breast-cancer-statistics/. [Google Scholar]
3. Cancer today [Internet]. [cited 2024 Oct 22]. Available from: https://gco.iarc.fr/today/en. [Google Scholar]
4. Perou CM, Sørlie T, Eisen MB, van de Rijn M, Jeffrey SS, Rees CA, et al. Molecular portraits of human breast tumours. Nat. 2000;406(6797):747–52. doi:10.1038/35021093. [Google Scholar] [PubMed] [CrossRef]
5. The Cancer Genome Atlas Network. Comprehensive molecular portraits of human breast tumours. Nature. 2012;490(7418):61–70. doi:10.1038/nature11412. [Google Scholar] [PubMed] [CrossRef]
6. Herschkowitz JI, Simin K, Weigman VJ, Mikaelian I, Usary J, Hu Z, et al. Identification of conserved gene expression features between murine mammary carcinoma models and human breast tumors. Genome Biol. 2007;8(5):R76. doi:10.1186/gb-2007-8-5-r76. [Google Scholar] [PubMed] [CrossRef]
7. Łukasiewicz S, Czeczelewski M, Forma A, Baj J, Sitarz R, Stanisławek A. Breast cancer-epidemiology, risk factors, classification, prognostic markers, and current treatment strategies-an updated review. Cancers. 2021;13(17):4287. doi:10.3390/cancers13174287. [Google Scholar] [PubMed] [CrossRef]
8. Ma W, Zhao Y, Ji Y, Guo X, Jian X, Liu P, et al. Breast cancer molecular subtype prediction by mammographic radiomic features. Acad Radiol. 2019;26(2):196–201. doi:10.1016/j.acra.2018.01.023. [Google Scholar] [PubMed] [CrossRef]
9. Zhang M, Mesurolle B, Theriault M, Meterissian S, Morris EA. Imaging of breast cancer-beyond the basics. Curr Probl Cancer. 2023;47(2):100967. doi:10.1016/j.currproblcancer.2023.100967. [Google Scholar] [PubMed] [CrossRef]
10. Ma M, Liu R, Wen C, Xu W, Xu Z, Wang S, et al. Predicting the molecular subtype of breast cancer and identifying interpretable imaging features using machine learning algorithms. Eur Radiol. 2022;32(3):1652–62. doi:10.1007/s00330-021-08271-4. [Google Scholar] [PubMed] [CrossRef]
11. Nissar I, Alam S, Masood S, Kashif M. MOB-CBAM: a dual-channel attention-based deep learning generalizable model for breast cancer molecular subtypes prediction using mammograms. Comput Methods Programs Biomed. 2024;248:108121. doi:10.1016/j.cmpb.2024.108121. [Google Scholar] [PubMed] [CrossRef]
12. Zhang T, Tan T, Han L, Appelman L, Veltman J, Wessels R, et al. Predicting breast cancer types on and beyond molecular level in a multi-modal fashion. npj Breast Cancer. 2023;9(1):16. doi:10.1038/s41523-023-00517-2. [Google Scholar] [PubMed] [CrossRef]
13. Khalid A, Mehmood A, Alabrah A, Alkhamees BF, Amin F, AlSalman H, et al. Breast cancer detection and prevention using machine learning. Diagnostics. 2023;13(19):3113. doi:10.3390/diagnostics13193113. [Google Scholar] [PubMed] [CrossRef]
14. Bobowicz M, Rygusik M, Buler J, Buler R, Ferlin M, Kwasigroch A, et al. Attention-based deep learning system for classification of breast lesions—multimodal, weakly supervised approach. Cancers. 2023;15(10):2704. doi:10.3390/cancers15102704. [Google Scholar] [PubMed] [CrossRef]
15. Thangavel Y, Garg H, Alagarsamy M, Pradeep D. Revolutionizing breast cancer diagnosis with a comprehensive approach using digital mammogram-based feature extraction and selection for early-stage identification. Biomed Signal Process Control. 2024;94(3–2):106268. doi:10.1016/j.bspc.2024.106268. [Google Scholar] [CrossRef]
16. Gheflati B, Rivaz H. Vision transformers for classification of breast ultrasound images. In: Proceedings of the 2022 44th Annual International Conference of the IEEE Engineering in Medicine & Biology Society (EMBC); 2022 Jul 11–15; Glasgow, Scotland, UK. p. 480–3. doi:10.1109/EMBC48229.2022.9871809. [Google Scholar] [PubMed] [CrossRef]
17. Zeng T, Zhang Z, Zeng Y, Zhang X, Ichiji K, Homma N. Vision transformer-based breast mass diagnosis in mammography using bilateral information. In: Proceedings of the 2024 IEEE International Conference on Artificial Intelligence in Engineering and Technology (IICAIET); 2024 Aug 26–28; Kota, Kinabalu, Malaysia. p. 147–52. doi:10.1109/IICAIET62352.2024.10730097. [Google Scholar] [CrossRef]
18. Boudouh SS, Bouakkaz M. Advancing precision in breast cancer detection: a fusi on of vision transformers and CNNs for calcification mammography classification. Appl Intell. 2024;54(17):8170–83. doi:10.1007/s10489-024-05619-3. [Google Scholar] [CrossRef]
19. Saber A, Sakr M, Abo-Seida OM, Keshk A, Chen H. A novel deep-learning model for automatic detection and classification of breast cancer using the transfer-learning technique. IEEE Access. 2021;9:71194–209. doi:10.1109/ACCESS.2021.3079204. [Google Scholar] [CrossRef]
20. Mota AM, Mendes J, Matela N. Breast cancer molecular subtype prediction: a mammography-based AI approach. Biomedicines. 2024;12(6):1371. doi:10.3390/biomedicines12061371. [Google Scholar] [PubMed] [CrossRef]
21. Liu M, Zhang S, Du Y, Zhang X, Wang D, Ren W, et al. Identification of Luminal A breast cancer by using deep learning analysis based on multi-modal images. Front Oncol. 2023;13:1243126. doi:10.3389/fonc.2023.1243126. [Google Scholar] [PubMed] [CrossRef]
22. Shen D, Wu G, Suk HI. Deep learning in medical image analysis. Annu Rev Biomed Eng. 2017;19(1):221–48. doi:10.1146/annurev-bioeng-071516-044442. [Google Scholar] [PubMed] [CrossRef]
23. Perez L, Wang J. The effectiveness of data augmentation in image classification using deep learning. arXiv:1712.04621. 2017. [Google Scholar]
24. Shorten C, Khoshgoftaar TM. A survey on image data augmentation for deep learning. J Big Data. 2019;6(1):60. doi:10.1186/s40537-019-0197-0. [Google Scholar] [CrossRef]
25. Galal S, Sanchez-Freire V. Candy cane: breast cancer pixel-wise labeling with fully convolutional DenseNets. In: Proceedings of the International Conference Image Analysis and Recognition; 2018 Jun 27–29; Póvoa de Varzim, Portugal. Cham, Switzerland: Springer International Publishing; 2018. p. 820–6. [Google Scholar]
26. Kwok S. Multiclass classification of breast cancer in whole-slide images. In: Proceedings of the International Conference Image Analysis and Recognition; 2018 Jun 27–29; Póvoa de Varzim, Portugal. Cham, Switzerland: Springer International Publishing; 2018. p. 931–40. doi:10.1007/978-3-319-93000-8_106. [Google Scholar] [CrossRef]
27. Qian S, Ning C, Hu Y. MobileNetV3 for image classification. In: Proceedings of the 2021 IEEE 2nd International Conference on Big Data, Artificial Intelligence and Internet of Things Engineering (ICBAIE); 2021 Mar 26–28; Nanchang, China. p. 490–7. doi:10.1109/ICBAIE52039.2021.9389905. [Google Scholar] [CrossRef]
28. Huang J, Mei L, Long M, Liu Y, Sun W, Li X, et al. BM-net: CNN-based MobileNet-V3 and bilinear structure for breast cancer detection in whole slide images. Bioengineer. 2022;9(6):261. doi:10.3390/bioengineering9060261. [Google Scholar] [PubMed] [CrossRef]
29. Theckedath D, Sedamkar RR. Detecting affect states using VGG16, ResNet50 and SE-ResNet50 networks. SN Comput Sci. 2020;1(2):79. doi:10.1007/s42979-020-0114-9. [Google Scholar] [CrossRef]
30. Dosovitskiy A. An image is worth 16 × 16 words: transformers for image recognition at scale. arXiv:2010.11929. 2021. [Google Scholar]
31. Adaloglou N. How the vision transformer (ViT) Works in 10 Minutes: an image is worth 16 × 16 words [Internet]; 2021 [cited 2025 Jul 2]. Available from: https://theaisummer.com/vision-transformer/. [Google Scholar]
32. Ghosh S. Vision transformer (ViT) decoded: a new era in computer vision [Medium]. 2025 [cited 2025 Jul 2]. Available from: https://medium.com/@gsayantan1999/vision-transformer-vit-decoded-a-new-era-in-computer-vision-8d3df7434821. [Google Scholar]
33. Radford A, Kim JW, Hallacy C, Ramesh A, Goh G, Agarwal S, et al. Learning transferable visual models from natural language supervision. arXiv:2103.00020. 2021. [Google Scholar]
34. Radford A, Sutskever I, Jong WK, Krueger G, Agarwal S. CLIP: connecting text and images [Internet]; 2021 [cited 2025 Jul 2]. Available from: https://openai.com/index/clip/. [Google Scholar]
35. He K, Zhang X, Ren S, Sun J. Deep residual learning for image recognition. In: Proceedings of the 2016 IEEE Conference on Computer Vision and Pattern Recognition (CVPR); 2016 Jun 27–30; Las Vegas, NV, USA. p. 770–8. doi:10.1109/cvpr.2016.90. [Google Scholar] [CrossRef]
36. Litjens G, Kooi T, Bejnordi BE, Setio AAA, Ciompi F, Ghafoorian M, et al. A survey on deep learning in medical image analysis. Med Image Anal. 2017;42(13):60–88. doi:10.1016/j.media.2017.07.005. [Google Scholar] [PubMed] [CrossRef]
37. Tharwat A. Classification assessment methods. Appl Comput Inform. 2021;17(1):168–92. doi:10.1016/j.aci.2018.08.003. [Google Scholar] [CrossRef]
38. Recht B, Roelofs R, Schmidt L, Shankar V. Do CIFAR-10 classifiers generalize to CIFAR-10? In: Proceedings of the 36th International Conference on Machine Learning; 2019 Jun 9–15; Long Beach, CA, USA. p. 5389–400. [Google Scholar]
39. Brown AL, Vijapura C, Patel M, De La Cruz A, Wahab R. Breast cancer in dense breasts: detection challenges and supplemental screening opportunities. Radiographics. 2023;43(10):e230024. doi:10.1148/rg.230024. [Google Scholar] [PubMed] [CrossRef]
40. Boisserie-Lacroix M, Bullier B, Hurtevent-Labrot G, Ferron S, Lippa N, Mac Grogan G. Correlation between imaging and prognostic factors: molecular classification of breast cancers. Diagn Interv Imaging. 2014;95(2):227–33. doi:10.1016/j.diii.2013.12.013. [Google Scholar] [PubMed] [CrossRef]
41. Johnson B. Asymmetries in mammography. Radiol Technol. 2021;92(3):281M–98M. [Google Scholar] [PubMed]
42. Sørlie T, Perou CM, Tibshirani R, Aas T, Geisler S, Johnsen H, et al. Gene expression patterns of breast carcinomas distinguish tumor subclasses with clinical implications. Proc Natl Acad Sci U S A. 2001;98(19):10869–74. doi:10.1073/pnas.191367098. [Google Scholar] [PubMed] [CrossRef]
43. Waks AG, Winer EP. Breast cancer treatment: a review. JAMA. 2019;321(3):288–300. doi:10.1001/jama.2018.19323. [Google Scholar] [PubMed] [CrossRef]
44. Selvaraju RR, Cogswell M, Das A, Vedantam R, Parikh D, Batra D. Grad-CAM: visual explanations from deep networks via gradient-based localization. In: Proceedings of the 2017 IEEE International Conference on Computer Vision (ICCV); 2017 Oct 22–29; Venice, Italy. p. 618–26. doi:10.1109/ICCV.2017.74. [Google Scholar] [CrossRef]
Cite This Article
 Copyright © 2026 The Author(s). Published by Tech Science Press.
This work is licensed under a Creative Commons Attribution 4.0 International License , which permits unrestricted use, distribution, and reproduction in any medium, provided the original work is properly cited.
 Downloads
 Citation Tools