
 Submit a Paper
 Propose a Special lssue
 Open Access
ARTICLE

A Novel Semi-Supervised Multi-View Picture Fuzzy Clustering Approach for Enhanced Satellite Image Segmentation
1 Institute of Information Technology, Vietnam Academy of Science and Technology, Hanoi, 100000, Vietnam
2 Graduate University of Science and Technology, Vietnam Academy of Science and Technology, Hanoi, 100000, Vietnam
3 Faculty of Information Technology, Thai Nguyen University of Information and Communication Technology, Thai Nguyen, 250000, Vietnam
4 School of Information and Communications Technology, Hanoi University of Industry, Hanoi, 100000, Vietnam
* Corresponding Authors: Hoang Thi Canh. Email: ; Nguyen Long Giang. Email:
(This article belongs to the Special Issue: Advances in Image Recognition: Innovations, Applications, and Future Directions)
Computers, Materials & Continua 2026, 86(3), 44 https://doi.org/10.32604/cmc.2025.071776
Received 12 August 2025; Accepted 17 October 2025; Issue published 12 January 2026
 View Full Text
 Download PDF
Abstract
Satellite image segmentation plays a crucial role in remote sensing, supporting applications such as environmental monitoring, land use analysis, and disaster management. However, traditional segmentation methods often rely on large amounts of labeled data, which are costly and time-consuming to obtain, especially in large-scale or dynamic environments. To address this challenge, we propose the Semi-Supervised Multi-View Picture Fuzzy Clustering (SS-MPFC) algorithm, which improves segmentation accuracy and robustness, particularly in complex and uncertain remote sensing scenarios. SS-MPFC unifies three paradigms: semi-supervised learning, multi-view clustering, and picture fuzzy set theory. This integration allows the model to effectively utilize a small number of labeled samples, fuse complementary information from multiple data views, and handle the ambiguity and uncertainty inherent in satellite imagery. We design a novel objective function that jointly incorporates picture fuzzy membership functions across multiple views of the data, and embeds pairwise semi-supervised constraints (must-link and cannot-link) directly into the clustering process to enhance segmentation accuracy. Experiments conducted on several benchmark satellite datasets demonstrate that SS-MPFC significantly outperforms existing state-of-the-art methods in segmentation accuracy, noise robustness, and semantic interpretability. On the Augsburg dataset, SS-MPFC achieves a Purity of 0.8158 and an Accuracy of 0.6860, highlighting its outstanding robustness and efficiency. These results demonstrate that SS-MPFC offers a scalable and effective solution for real-world satellite-based monitoring systems, particularly in scenarios where rapid annotation is infeasible, such as wildfire tracking, agricultural monitoring, and dynamic urban mapping.Keywords
Satellite imagery has become an indispensable resource across numerous domains, including precision agriculture, urban development, disaster response, land cover classification, and environmental monitoring [1,2]. The large scale, high dimensionality, and heterogeneity of remote sensing data present significant challenges for image analysis. Advanced techniques capable of interpreting, segmenting, and extracting meaningful patterns from these data with minimal human intervention are essential for real-world applications [3].
Image segmentation, the process of partitioning an image into semantically coherent regions, is a fundamental task in remote sensing but remains a challenging problem, especially in large-scale, multi-sensor environments. Traditional image segmentation methods rely heavily on supervised learning paradigms, which require extensive pixel-level annotations. These annotations are costly, labor-intensive, and require domain expertise, making them impractical for many real-world applications [4]. As a result, unsupervised clustering approaches have emerged as a partial solution, enabling the discovery of latent patterns and grouping pixels into coherent clusters without relying on ground truth labels [5,6]. However, the lack of supervision in unsupervised clustering often leads to suboptimal and semantically ambiguous segmentations, limiting their usefulness in critical applications such as land use monitoring, urban planning, and agricultural mapping [7,8].
Semi-supervised learning (SSL) provides a viable solution by leveraging a limited set of labeled data to assist in the clustering procedure. Even sparse annotations can significantly improve segmentation accuracy [9,10]. However, integrating supervision effectively into clustering algorithms remains a major challenge, especially in the context of heterogeneous data sources.
Satellite data is inherently multi-view, with images captured from multiple perspectives. These perspectives can include spectral views (e.g., RGB, NIR, and SWIR), spatial views (e.g., texture and edge features), and contextual views (e.g., elevation maps, radar overlays, and weather data). Traditional single-view clustering algorithms fail to fully exploit this heterogeneity, often leading to biased or incomplete segmentations. Multi-view clustering (MvC) methods have been introduced to overcome this challenge by combining complementary data from various sources [11]. These methods can generally be divided into two categories: multi-feature-based techniques, which extract different features from the same sensor data [12], and multi-source-based techniques, which utilize diverse modalities such as hyperspectral (HS), multispectral (MS), synthetic aperture radar (SAR), and digital surface models (DSM) [13–15]. While these modalities provide distinct and valuable information, such as spectral richness, terrain elevation, and object geometry, fusing such diverse sources and modeling their interactions effectively remains a complex task, particularly for high-resolution, large-scale datasets.
Fuzzy clustering methods, particularly Fuzzy C-Means (FCM) and its variants, have demonstrated substantial capability in modeling uncertainty by permitting each data point to belong to multiple clusters with different levels of membership [16]. The concept of Picture Fuzzy Sets (PFS), an advancement in fuzzy theory, adds a neutral dimension, allowing for a more nuanced representation of ambiguity [17]. This characteristic is particularly useful in satellite image segmentation, where mixed pixels caused by clouds, shadows, or sensor noise are common. For example, Ref. [2] demonstrates the effectiveness of picture fuzzy clustering for weather nowcasting by integrating it with spatiotemporal regression and rule-based reasoning.
Despite advancements in semi-supervised learning, multi-view clustering, and picture fuzzy set theory, no existing work has effectively integrated all three into a unified framework for satellite image segmentation. This gap limits the full potential of remote sensing data in practical applications. To overcome this challenge, we propose a new clustering approach called Semi-Supervised Multi-View Picture Fuzzy Clustering (SS-MPFC). Our approach simultaneously models the uncertainty inherent in remote sensing data, leverages heterogeneous views from multiple sources, and incorporates limited supervision to enhance segmentation quality. Specifically, we first formulate a novel objective function that unifies picture fuzzy set theory with multi-view representation and semi-supervised constraints. Then, we design a principled optimization algorithm to efficiently solve the resulting non-convex problem.
Our main contributions are outlined below:
1. Novel Objective Function: We present a clustering objective that combines PFS with MvC and SSL, efficiently addressing pixel ambiguity and neutrality in satellite images.
2. Semi-Supervised Constraints: We embed must-link and cannot-link constraints into the clustering process, utilizing limited labeled data to improve segmentation accuracy and consistency.
3. Efficient Optimization Algorithm: We propose an alternating optimization framework grounded in Lagrangian methodology, specifically designed to address non-convex objective functions. The algorithm demonstrates computational efficiency and is supported by rigorous theoretical guarantees of convergence.
4. Extensive Experiments: Our experiments on benchmark satellite datasets show that the proposed method surpasses existing techniques in accuracy, noise resilience, and interpretability.
The paper is organized as follows: Section 2 reviews related work, Section 3 details the SS-MPFC algorithm, Section 4 presents the experimental setup, results, and discussion, and Section 5 concludes with key insights and future research directions.
2.1 Satellite Image Segmentation Methods
Satellite image segmentation plays a vital role in remote sensing by partitioning images into regions with similar characteristics to facilitate object detection, classification, and monitoring of phenomena such as vegetation, urban areas, wildfires, and floods. Existing methods are typically grouped into three categories: supervised, unsupervised, and semi-supervised segmentation. Each approach comes with inherent strengths and limitations, and its suitability depends on the data characteristics and specific application requirements.
Supervised methods depend on substantial labeled training datasets. Machine learning models learn to classify pixels based on these labels and often achieve high accuracy when ample annotations are available.
• Deep Neural Networks (DNNs): Convolutional Neural Networks (CNNs) have become the leading method for satellite image segmentation, thanks to their capability to automatically extract both spatial and semantic features from raw images [18]. Architectures like U-Net enhance segmentation accuracy by utilizing encoder-decoder structures [19]. However, DNN-based models require large-scale annotated datasets, which are expensive and labor-intensive to obtain in remote sensing contexts [20].
• Classical Machine Learning Models: Techniques such as Random Forests (RF) and Support Vector Machines (SVM) have also been widely used. While these models are effective under controlled conditions, their performance degrades in the presence of environmental variability or when class distributions are highly imbalanced or overlapping [21,22]. Moreover, they lack adaptability in complex multi-class segmentation scenarios.
Despite their high performance, supervised methods are often impractical in satellite imagery tasks where annotation costs are prohibitive, especially for high-resolution or multi-sensor data.
Unsupervised segmentation algorithms do not require labeled data and instead group pixels based on intrinsic similarities using clustering techniques.
• K-Means Clustering: A common baseline method, K-means divides data into k clusters using distance metrics. While simple and efficient, it struggles with complex spatial relationships and performs poorly in images with class overlap or non-convex structures [23].
• Fuzzy C-Means: FCM improves upon K-means by allowing partial membership of pixels to multiple clusters, enabling better handling of transition regions and ambiguous boundaries [7,24]. However, it still faces limitations in dealing with strong class heterogeneity and overlapping distributions.
• Deep Clustering: Recent approaches incorporate deep learning to learn latent features for clustering, using autoencoders [25] or contrastive learning frameworks [26]. However, most are designed for single-view data and fail to leverage the complementary information inherent in multi-sensor satellite inputs. To address this, multi-view deep clustering has emerged. For instance, Guan et al. [27] use contrastive learning to enforce view consistency, while Luo et al. [28] and Cai et al. [29] propose joint multi-view representations based on self-supervised and transformer-based models, respectively. In contrast to single-view data, multi-view data enables the training of a more holistic representation, leading to improved performance in clustering tasks.
While unsupervised methods eliminate the need for labels, they often lack semantic precision and struggle with heterogeneous or high-dimensional data, leading to suboptimal segmentation in complex scenes.
Semi-supervised segmentation seeks to bridge the gap by combining a limited amount of labeled data with a larger set of unlabeled data. This method provides an effective trade-off between annotation efficiency and segmentation quality.
• Classical Semi-Supervised Learning: SSL methods exploit limited supervision to guide learning on unlabeled data [30]. Huan et al. (2023) integrated SSL with clustering for satellite images, demonstrating strong performance even with sparse labels [31]. Lu et al. (2025) proposed an uncertainty-aware masked consistency learning (U-MCL) framework, combining masked denoising and image consistency modules to reduce pseudo-label noise and boost segmentation accuracy [32].
• Deep Semi-Supervised Learning: Deep SSL models such as Deep Label Propagation and Variational Autoencoders can effectively generalize from limited annotations [33,34]. However, they are computationally intensive and often fail to model complex multi-view and multi-scale characteristics of satellite data effectively.
Although SSL offers promising label efficiency, current approaches are limited in their ability to model uncertainty and heterogeneity, especially in high-resolution, multi-modal satellite imagery.
In summary, supervised methods offer high accuracy but are annotation-dependent and costly. Unsupervised methods are annotation-free but lack semantic precision, especially in complex or heterogeneous scenes. Semi-supervised methods provide a middle ground but still face challenges in uncertainty modeling and multi-view data integration. Therefore, there remains a critical research gap: developing segmentation frameworks that combine the benefits of all three paradigms while effectively addressing the challenges of ambiguity, class overlap, and data heterogeneity in satellite imagery. Integrating multi-view learning, semi-supervised clustering, and uncertainty-aware fuzzy modeling offers a promising direction for advancing satellite image segmentation under real-world constraints.
2.2 Fuzzy Set Theory and Picture Fuzzy Sets (PFS)
Fuzzy set theory, originally proposed by Zadeh in 1965 [35], provides a foundational mathematical framework for modeling uncertainty and imprecision in data analysis. A fuzzy set (FS) in a non-empty universe of discourse
where
Conventional fuzzy set-based methods are limited to two components: membership and non-membership, which represent the degree to which a pixel belongs or does not belong to a particular class. However, these two values alone may be insufficient to represent complex and ambiguous scenarios often encountered in satellite images, especially in regions where pixels exhibit characteristics of multiple classes without strong evidence for or against any specific class.
To overcome this limitation, PFS were introduced as an extension of both fuzzy sets and intuitionistic fuzzy sets [17]. A picture fuzzy set on a universe is defined as a collection of ordered triples:
here,
Additionally, the quantity
In satellite image segmentation, spectral mixing is frequently observed between classes such as vegetation, urban areas, water bodies, and clouds. For instance, cloud edges, semi-transparent haze, or terrain shadows can produce mixed pixels that exhibit weak or conflicting signals across multiple spectral bands. Traditional binary or even intuitionistic fuzzy methods struggle to capture such ambiguity, often resulting in hard misclassification or loss of detail. Picture fuzzy sets address these issues by explicitly modeling the neutral zone between membership and non-membership. This makes them particularly well-suited for remote sensing applications where class boundaries are uncertain or gradual, sensor noise and environmental factors introduce ambiguity, and mixed pixels frequently occur due to spatial resolution limitations.
The benefits of PFS in satellite image segmentation are threefold:
(i) Uncertainty Modeling: PFS provides a robust framework to model ambiguity and uncertain regions, particularly where class transitions are smooth or ill-defined.
(ii) Neutrality Handling: The neutrality degree offers a mathematically consistent way to represent pixels that are neither strongly affiliated with a class nor definitively excluded, improving flexibility in classification.
(iii) Improved Segmentation Accuracy: Incorporating PFS into fuzzy clustering algorithms has been shown to enhance segmentation performance, especially in cases with class overlap, mixed pixels, or soft boundaries between classes.
Despite its promising capabilities, the application of PFS in large-scale satellite image segmentation still faces several challenges. Current fuzzy clustering algorithms based on PFS require optimization for high-resolution data and must efficiently scale to handle datasets with a large number of classes and views. Furthermore, integrating PFS into modern frameworks such as deep learning and semi-supervised learning remains an open research direction. Such integration could enable PFS-based methods to fully leverage unlabeled data and high-dimensional representations, paving the way for more robust and practical segmentation in real-world remote sensing scenarios.
2.3 Multi-View Graph Clustering in Satellite Image Segmentation
Multi-view clustering has become a crucial method in satellite image analysis, as it facilitates the combination of diverse data sources, each providing distinct perspectives or “views” of the same geographical area [9]. These views typically include spectral features, such as RGB, NIR, or SWIR bands; spatial features like texture, edge, and shape; and contextual information, such as elevation maps or meteorological overlays. By combining these diverse features within a unified clustering framework, MvC significantly improves the accuracy and completeness of satellite image segmentation.
Graph-based methods have become increasingly popular in MvC for modeling the intrinsic structure and connectivity within multi-view data [36,37]. Traditional MvC methods often construct a consensus graph by regularizing multiple view-specific graphs, followed by spectral clustering to infer the final segmentation. For instance, Liu et al. [38] introduced a consistent anchor graph that preserves inter-view commonality while filtering out view-specific noise. Wang et al. [39] proposed FMVACC, which utilizes anchor graphs to reduce computational complexity by avoiding pairwise similarity calculations. This approach presents a versatile framework for identifying anchor correspondences using both feature and structural information, followed by column-wise graph fusion to enhance clustering results. In a similar vein, Wan et al. [40] proposed the AWMVC algorithm, which tackles the challenges of high time complexity and scalability in multi-view clustering by learning dimension-specific coefficient matrices and merging them to generate an optimal consensus matrix.
The development of Deep MvC methods has significantly advanced, with algorithms such as MDC [15], CMSCGC [27], SAMVGC [41], MFLVC [42], CVCL [43], SDMVC [44], GCFAgg [45], and MDFL [46]. These methods leverage deep learning to tackle multi-view clustering problems, fully utilizing complementary information from various data sources, which enhances clustering accuracy and performance. One of the main benefits of Deep MvC algorithms is their capability to autonomously learn intricate features from unlabeled data, thereby minimizing the dependence on pre-labeled annotations. Moreover, they efficiently handle large-scale data and are highly adaptable in integrating multiple views, making them particularly effective in remote sensing, image recognition, and complex data analysis tasks.
Recent progress in GNNs (graph neural networks) has resulted in the creation of more adaptable and versatile multi-view clustering methods. For example, Xiao et al. [47] introduced a dual fusion-propagation GNN to integrate and refine information across multiple views, while Chen et al. [48] proposed a graph autoencoder combined with a standard autoencoder for learning discriminative multi-view representations. However, these GNN-based approaches still face challenges due to fixed graph topologies, which can struggle to correct incorrect or noisy edge connections, particularly in remote sensing data with overlapping or ambiguous classes. SAMVGC tackles key challenges in multi-view clustering by adaptively learning both the graph and cluster structures. Unlike fixed graph methods that introduce noise and structural heterogeneity, SAMVGC refines adjacency matrices using geometric features and applies contrastive learning to central samples and consistent learning to confusing samples, improving clustering compactness and consistency [41].
One of the persistent challenges in satellite image segmentation is class overlap, where classes such as land and vegetation, or land and clouds, share similar visual and spectral features. Multi-view clustering mitigates this by incorporating diverse features from different modalities, improving class separability, and enhancing segmentation results.
When combined with semi-supervised learning and Picture Fuzzy Sets, multi-view clustering becomes even more powerful. Semi-supervised clustering allows the model to operate effectively with only a small set of labeled samples, reducing annotation costs. PFS, with its triplet representation of membership, non-membership, and neutrality, offers a robust way to model ambiguity and uncertainty, especially in regions with mixed or transitional classes [17,49]. This is particularly valuable in satellite imagery, where boundaries between classes are rarely distinct and pixels may exhibit partial membership across multiple land cover types. Integrating multi-view clustering with PFS in a semi-supervised framework allows for richer utilization of diverse data views, reduction in reliance on labeled data, and improved ability to handle ambiguous or overlapping class boundaries. This hybrid approach greatly enhances segmentation performance, particularly in real-world scenarios characterized by sparse or unavailable labeled data, high data heterogeneity, and gradual class transitions (e.g., mixed vegetation-soil or cloud-terrain boundaries).
In summary, combining multi-view clustering, semi-supervised learning, and picture fuzzy set modeling provides a promising pathway for satellite image segmentation. It addresses the challenges of limited annotations and class ambiguity while fully exploiting the complementary strengths of spectral, spatial, and contextual information embedded in remote sensing imagery.
We propose a novel clustering framework, Semi-Supervised Multi-view Picture Fuzzy Clustering (SS-MPFC), designed to tackle challenges such as uncertainty, class overlap, and data heterogeneity in satellite image segmentation. This framework integrates multi-view representation learning, semi-supervised learning, and picture fuzzy set modeling in a unified architecture. The overall process is organized into two main stages, as illustrated in Fig. 1.
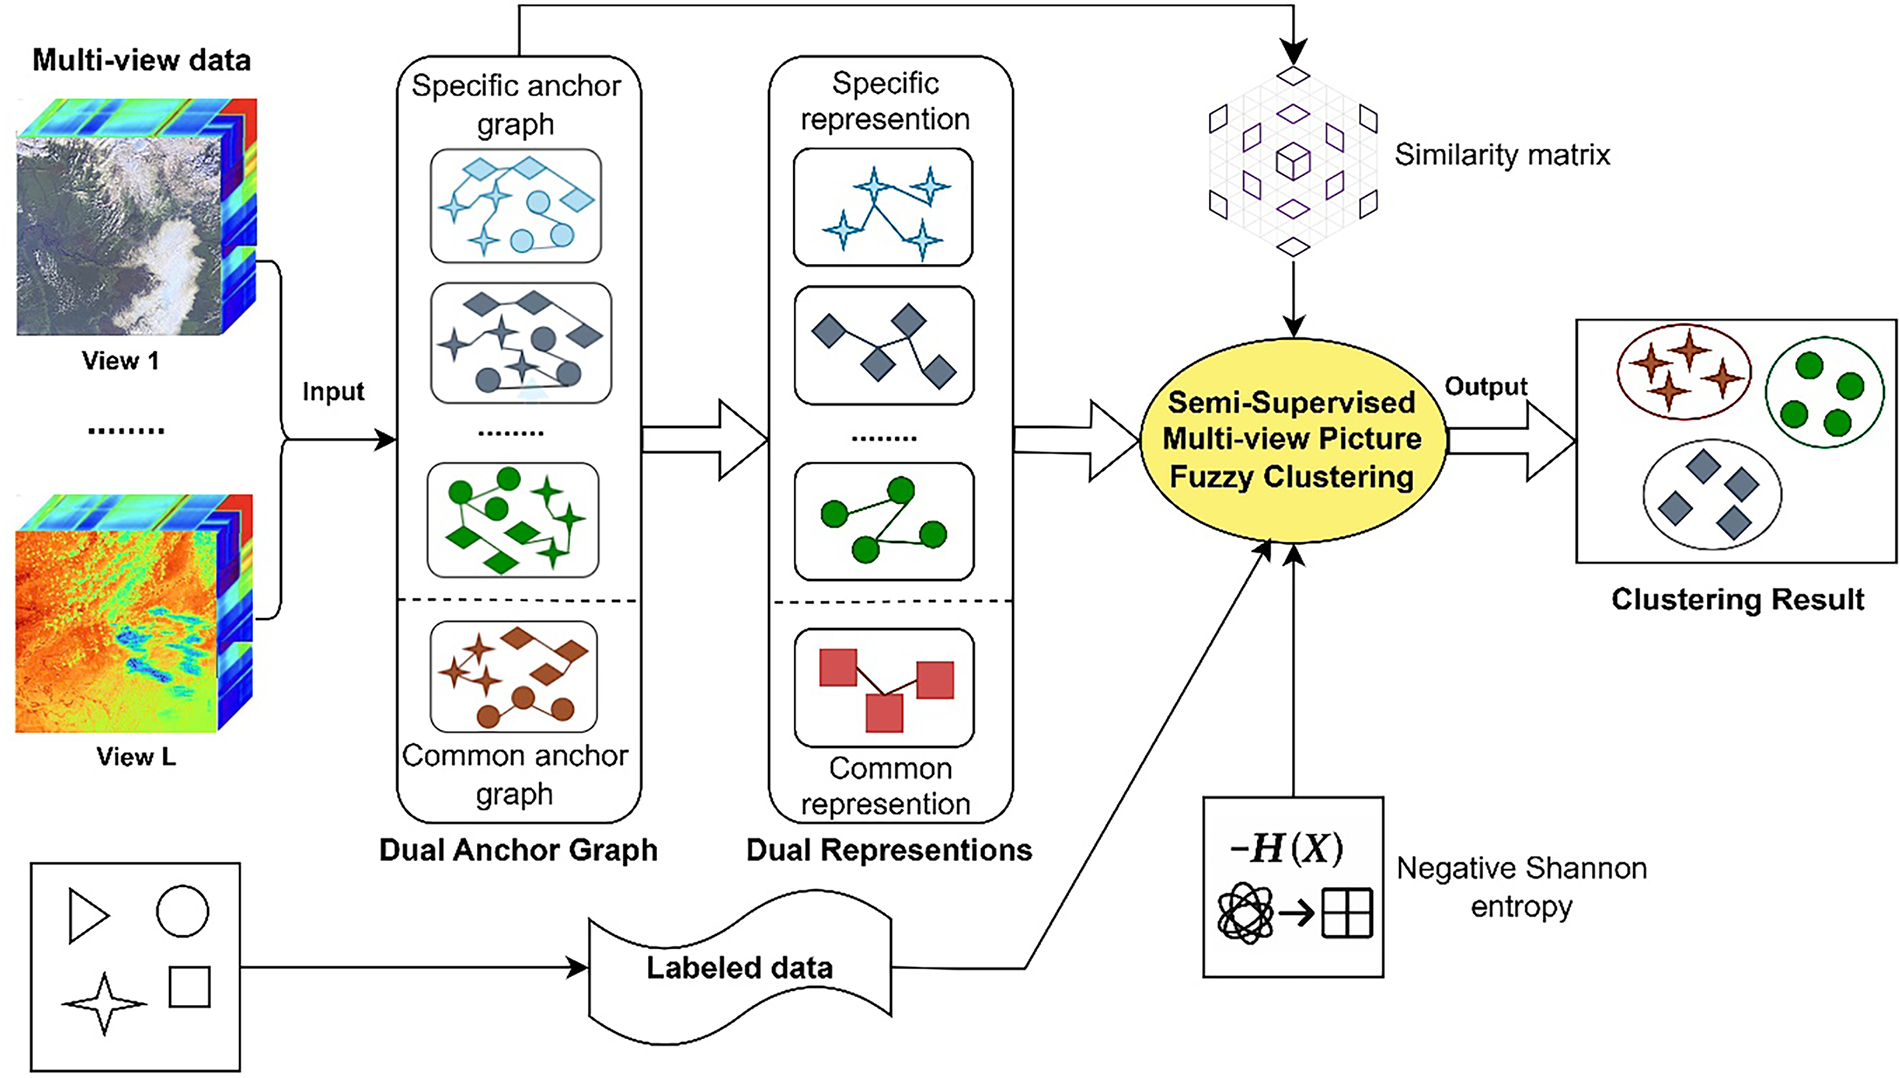
Figure 1: A schematic representation of the proposed SS-MPFC framework
Step 1: Dual Anchor Graph Construction and Representation Learning
Given multi-view remote sensing data, each view is first processed to construct view-specific anchor graphs that capture the inherent neighborhood relationships of the data in that particular modality. This is accomplished using matrix factorization, a technique that denoises raw data and mitigates inaccuracies, enabling the identification of high-quality hidden features for each view. Each individual view generates its own anchor graph that effectively captures the specific neighborhood structure inherent to that modality.
In parallel, a common anchor graph is learned to preserve the global consensus structure shared across views. This common graph serves to capture the shared information among different perspectives of the data, ensuring that the commonalities across views are retained. Both the view-specific and common anchor graphs are constructed via an iterative refinement procedure that integrates latent representation learning with anchor graph learning. This approach promotes synergistic interactions between the two types of graphs, enhancing the accuracy and robustness of the learned representations.
These graphs are then used to generate two types of representations:
(1) Specific representations, which retain distinctive characteristics of each individual view. These representations are essential for capturing the unique information present in each modality.
(2) Common representations, which emphasize the agreement across different views. These representations preserve the shared information across all views, which is essential for capturing the overall structure of the data and ensuring consistency across modalities.
This dual-anchor graph construction process, inspired by the MV_DAGL approach [50], effectively captures both the global consensus and view-specific features of the data, providing a robust framework for representing multi-view data in remote sensing applications. The objective function of the MV_DAGL algorithm is defined as follows:
where
This dual-graph and dual-representation design enables the framework to jointly model view-specific diversity and cross-view consistency, providing a comprehensive, and robust feature basis for clustering.
Step 2: Semi-Supervised Multi-View Picture Fuzzy Clustering
The learned representations and graphs are fed into a semi-supervised clustering module built upon picture fuzzy set theory. In this setting, each data point is associated with three degrees: membership, non-membership, and neutrality, allowing fine-grained modeling of ambiguity and class transitions. To incorporate supervision, a limited number of labeled samples are utilized through pairwise constraints (must-link and cannot-link), steering the clustering process toward semantically consistent partitions. Additionally, a negative Shannon entropy term is added to the objective function to enhance the distinction between fuzzy clusters and reduce uncertain assignments.
By combining multi-view feature fusion, partial supervision, and uncertainty modeling, our SS-MPFC framework achieves enhanced segmentation accuracy and robustness on complex satellite imagery.
Mathematical notation: In this study, we consider a set of multi-view satellite image data
The core objective of the proposed SS-MPFC framework is to jointly optimize a clustering function that captures uncertainty, integrates multi-view representations, and effectively utilizes limited supervision. To realize this goal, we formulate an objective function composed of multiple components, each weighted by different parameters. The weight coefficients
The overall objective function is expressed as follows:
The constraint conditions:
Below is a comprehensive breakdown of each component:
1. First Component:
This component assesses how data points are spread across clusters by measuring the distance between the cluster centroids. The objective is to optimize the assignment of data points to clusters, ensuring a clear separation between clusters. This component minimizes the overlap between clusters by evaluating the distance between data points and their respective centroids in the multi-view space.
2. Second Component:
This component adjusts the degree of uncertainty in the clustering process, particularly for neutral and refusal degrees. By incorporating uncertainty, it ensures that ambiguous data points, which cannot be clearly classified, are appropriately handled, allowing the clustering process to remain robust even in the presence of unclear data.
3. Third Component:
This component employs Shannon entropy to regulate the weight allocation among different views, with the goal of preventing any single view from being overly influential. By ensuring balanced contributions from all views, this term helps maintain the fairness of the clustering process, avoiding biases that might occur if a particular view dominates.
4. Fourth Component:
This component guarantees uniformity and reliability throughout the clusters. It promotes the consistency of the clustering process by encouraging the data points that are similar to be grouped into the same clusters. The component reduces the risk of instability in the clustering results, ensuring that the clusters formed are coherent and not scattered.
5. Fifth Component:
This component measures the difference between the data labels
6. Sixth Component:
This component reduces the excessive variation in membership degrees, thus improving the consistency and reliability of the clustering process. It helps minimize the fuzziness in the membership assignments, ensuring that the clustering process is more conclusive and the results are easier to interpret. By regulating the spread of membership degrees, this factor strengthens the distinctness and accuracy of the clustering outcomes.
The objective function is designed to optimize fuzzy clustering in a semi-supervised, multi-view context. It incorporates various components to balance cluster separation, uncertainty, consistency across views, and the alignment of data labels with fuzzy membership degrees. Each component is carefully crafted to guarantee that the clustering process is resilient, transparent, and optimized, addressing challenges such as uncertainty, label alignment, and the integration of multi-view information. These components collectively contribute to a more accurate and stable clustering outcome, making the approach particularly effective for satellite image segmentation tasks.
The objective function (5) defined in Section 3.2 involves multiple interdependent variables across different views and fuzzy components. To efficiently solve this optimization problem, we adopt an alternating optimization strategy combined with Lagrange multipliers, which iteratively updates the cluster centers and picture fuzzy membership values.
The optimization proceeds in an iterative fashion with the following key update steps:
Step 1: Update Cluster Centers
Step 2: Update Picture Fuzzy Membership Degrees
– The positive membership degree
in which:
– The positive membership degree
in which:
– The neutral degree
– The refusal degree
Step 3: Update View Weights
– The weight for each view of the labeled data elements is calculated as follows:
in which:
– The weight for each view of the unlabeled data elements is calculated as follows:
in which:
Step 4: The value of J is calculated using Formula (5).
Step 5: Check stopping condition.
The above steps are repeated until
Algorithm 1 outlines the SS-MPFC algorithm.
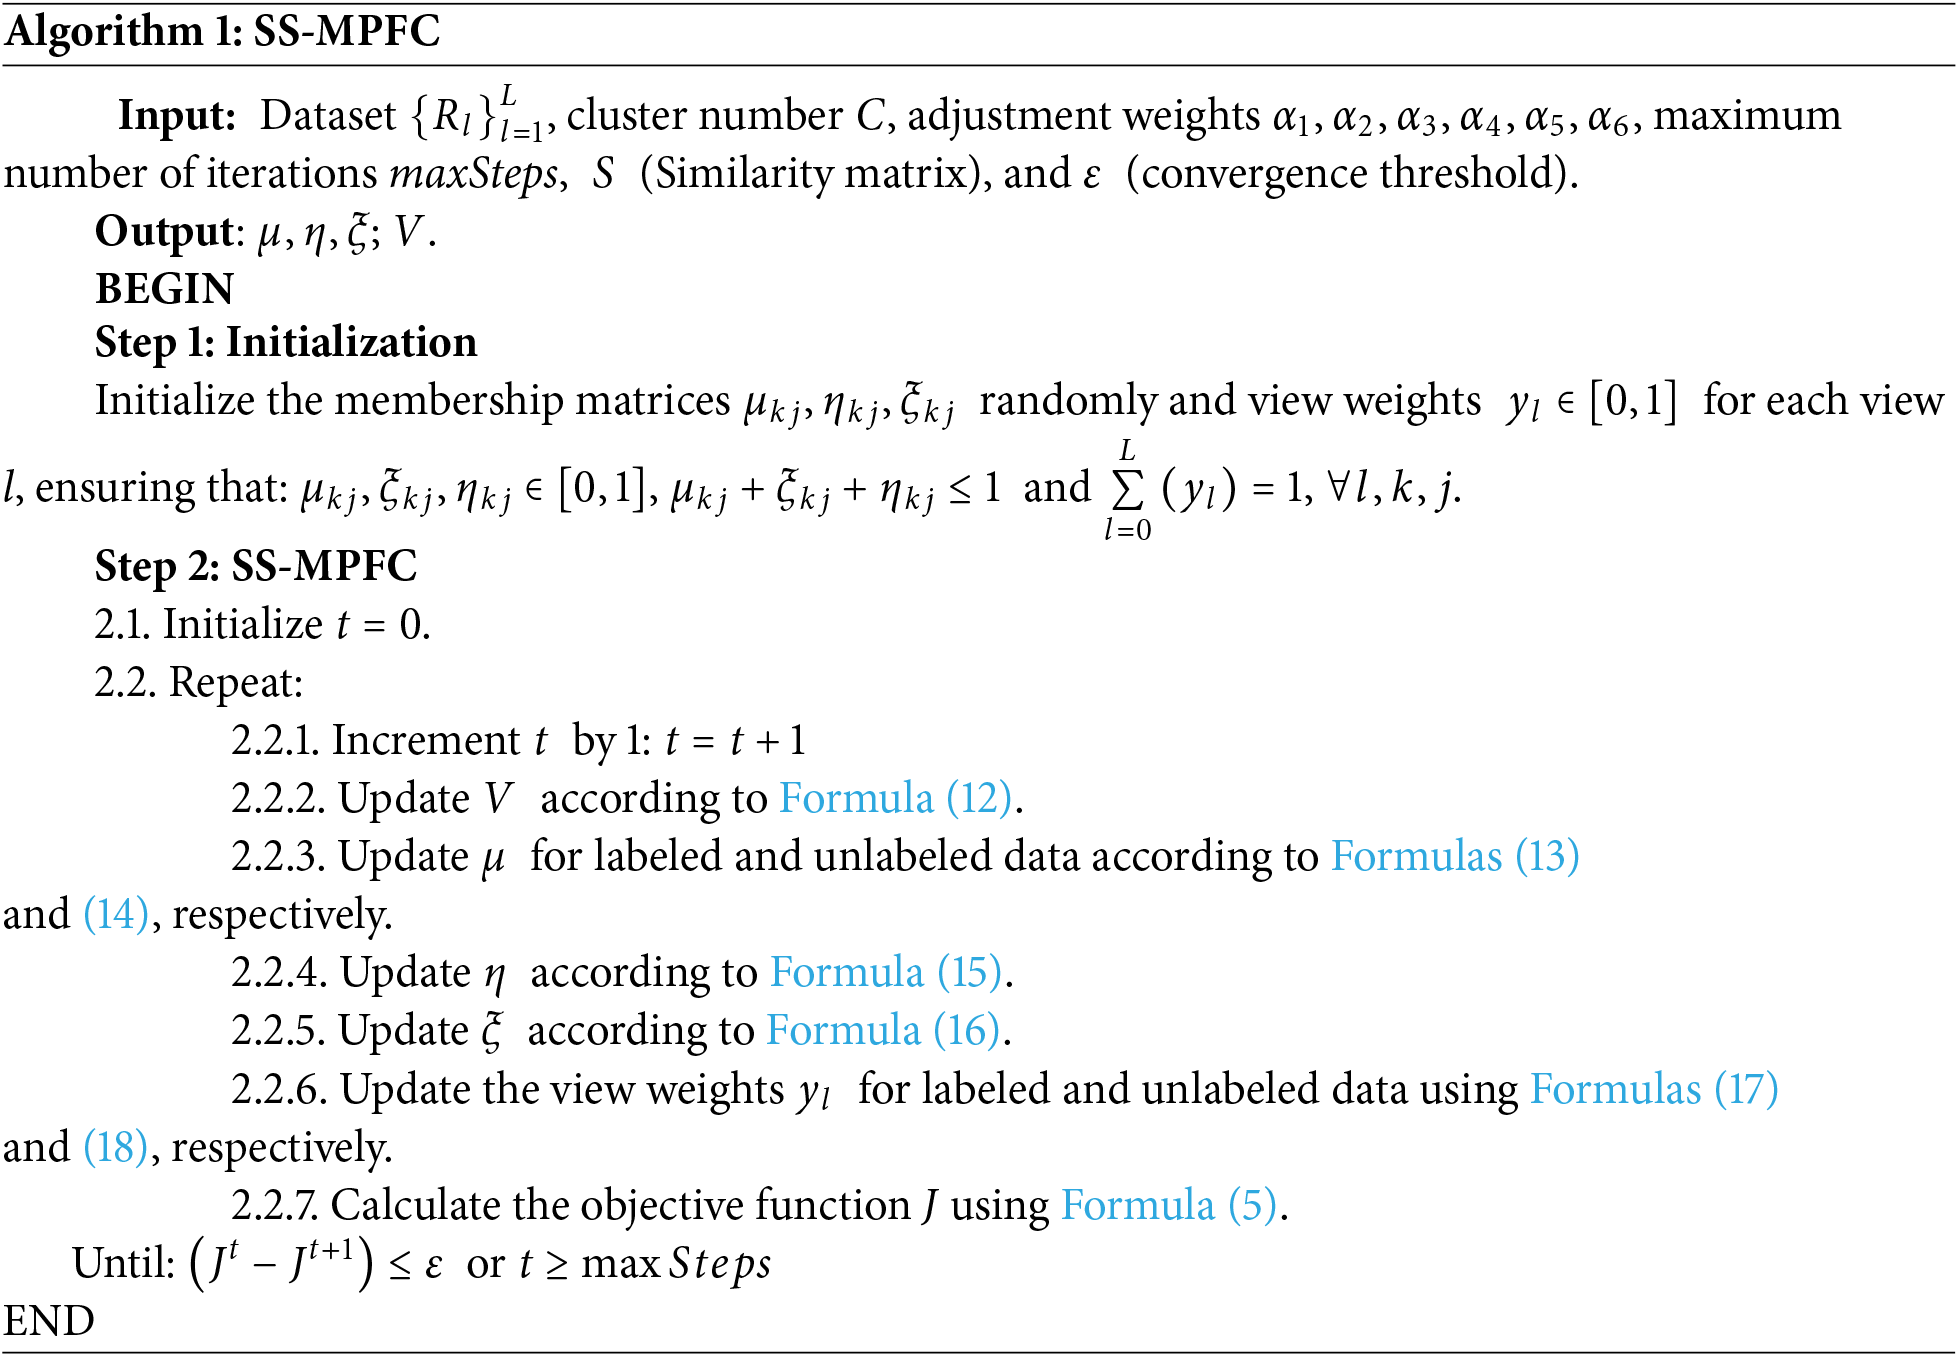
This optimization strategy balances interpretability, theoretical soundness, and computational efficiency, making it suitable for large-scale satellite image segmentation tasks involving heterogeneous and ambiguous data.
The proposed algorithm finds solutions using the gradient descent method and Lagrange multiplier, which uses partial derivatives for each variable to find local extremes in the process of finding global solutions. Therefore, through successive iterations, the algorithm’s objective function tends to converge to extreme points.
We analyze the computational complexity of the proposed SS-MPFC algorithm by examining the key steps in each iteration of the alternating optimization process. First, the proposed method employs dual-anchor graph learning for extracting anchors, representation data, and similarity matrices. Then it is
In (12), we have one loop for
Looking at the most complicated Eq. (13), which includes three parts:
– The first part is
– The second part is
– The last part is
• Similar to Eq. (13), the complexity of Eq. (14) is the same with
• The complexities of the remaining equations are as follows: Eqs. (15)–(18) have complexities of
• Finally, for calculating (5), six components have to be solved, with complexities of
Consequently, the overall complexity of the proposed method is about
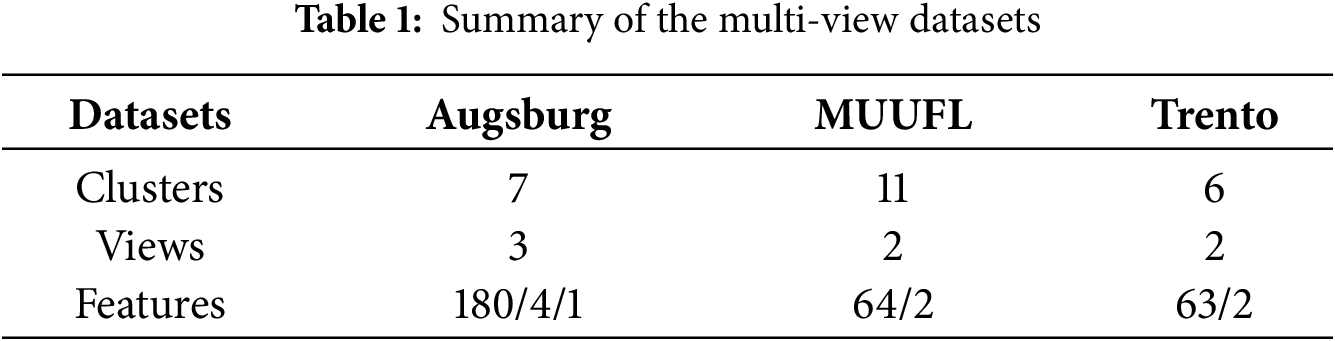
Datasets: To assess the performance of the proposed SS-MPFC algorithm, experiments were carried out on three publicly available multi-view remote sensing datasets: Augsburg [51], Trento [52], and MUUFL [53]. Table 1 provides a summary of the main characteristics of these datasets, including the number of clusters, views, and feature dimensionalities.
• Augsburg: This dataset contains 78,294 samples across 7 clusters with three distinct views: 180 HS (hyperspectral) features, 4 SAR (synthetic aperture radar) features, and 1 DSM (digital surface model) feature. It was acquired over a metropolitan area in Augsburg, Germany. It contains 7 classes: Residential Area, Commercial Area, Industrial Area, Low Plants, Forest, Allotment, and Water.
• Trento: This dataset includes 30,214 samples grouped into 6 clusters (Wood, Buildings, Apple Trees, Road, Ground, Vineyard), with two views: 63 HS features and 2 LiDAR features, collected over an urban area in Trento, Italy.
• MUUFL Gulfport: This dataset provides 53,687 samples across 11 clusters, with two views: 64 HS features and 2 LiDAR features, captured over the University of Southern Mississippi, USA. The classes include Trees, Grass, Roads, Buildings, Water, and others.
Implementation Details: The proposed algorithm was implemented in Python 3.10. All experiments were performed on a workstation equipped with an Intel Core i7 CPU at 3.6 GHz and 24 GB of RAM. The number of clusters, c, was set to match the number of ground-truth classes. In the semi-supervised settings, 5% of labeled pixels were randomly selected to create must-link and cannot-link constraints, with a fixed random seed to ensure reproducibility. The fuzzification coefficient m was set to 2, the maximum number of iterations was 100, and convergence was achieved when the change in the objective function was less than 10−5. For all baselines, experiments were conducted in the same environment to ensure fair comparison.
Evaluation Metrics: To evaluate performance, we utilize several criteria: ACC (Accuracy), ARI (Adjusted Rand Index), PUR (Purity), and NMI (Normalized Mutual Information) [41]. Higher values of ARI, ACC, NMI, and PUR signify better clustering results, reflecting improved accuracy and stronger alignment between the model’s clustering and the ground truth. These metrics are commonly employed in clustering tasks as they provide important insights into various aspects of clustering performance.
(1) ARI: ARI is a metric used to evaluate the similarity between two clusters, adjusting for chance grouping of data points. In satellite image segmentation, ARI measures the alignment between algorithm-generated clusters and the ground truth segmentation, assessing how well the algorithm reflects actual land-cover classes (e.g., water, vegetation, and urban areas). Unlike the Rand Index (RI), which measures the proportion of pairs of data points grouped similarly or differently, ARI corrects for random groupings by comparing the observed similarity with the expected similarity under random clustering. ARI ranges from −1 (complete disagreement) to 1 (perfect agreement), with 0 indicating random clustering. This metric is crucial for evaluating the accuracy of clustering algorithms in satellite image segmentation. ARI is calculated as:
here, E[RI] is the expected Rand Index under random clustering, and max(RI) is its maximum possible value.
(2) ACC: Accuracy assesses the proportion of correctly classified samples in a clustering. In the context of satellite image segmentation, it evaluates how effectively the algorithm assigns pixels to the correct categories by comparing them with the ground truth classification. ACC is calculated as:
here,
(3) NMI: NMI measures the amount of information shared between the model’s clustering and the true clustering, normalizing for cluster size. In satellite image segmentation, NMI quantifies the shared information between the predicted clustering and the true land-cover classes, providing a measure of their agreement while accounting for the number of clusters. NMI ranges from 0 (no shared information) to 1 (perfect correlation), and is commonly used to evaluate how well the model captures the true structure in satellite image segmentation, measuring the overlap of information between the clusters. NMI is calculated as:
here, I(K;G) is the mutual information between the predicted labels K and true labels G, and H(K) and H(G) are the entropies of their respective distributions.
(4) PUR: Purity quantifies how much each cluster is dominated by data points from a single class. In satellite image segmentation, Purity indicates how effectively the algorithm separates land-cover types, with a higher Purity value indicating a clearer distinction between different land-cover classes in the image. PUR is calculated as:
here,
These metrics are essential for evaluating clustering algorithms, particularly in satellite image segmentation tasks, where the objective is to accurately classify different land-cover types and assess the segmentation quality in real-world applications.
Parameter Settings: The regularization parameters
Baseline Methods: We evaluated the proposed SS-MPFC method against 10 advanced state-of-the-art techniques, including:
• Classic MvC methods: FMVACC [39], AWMVC [40].
• Deep MvC methods: MDC [15], CMSCGC [27], SAMVGC [41], MFLVC [42], CVCL [43], SDMVC [44], GCFAgg [45] and MDFL [46].
In this section, we performed experiments using three multi-view datasets to assess the performance of the proposed method and compared the outcomes with those from 10 other existing techniques. The algorithms were run 10 times, with a maximum of 100 iterations per run. The results, assessed using various metrics, are presented in Table 2, where the bold values indicate the best performance for each dataset.
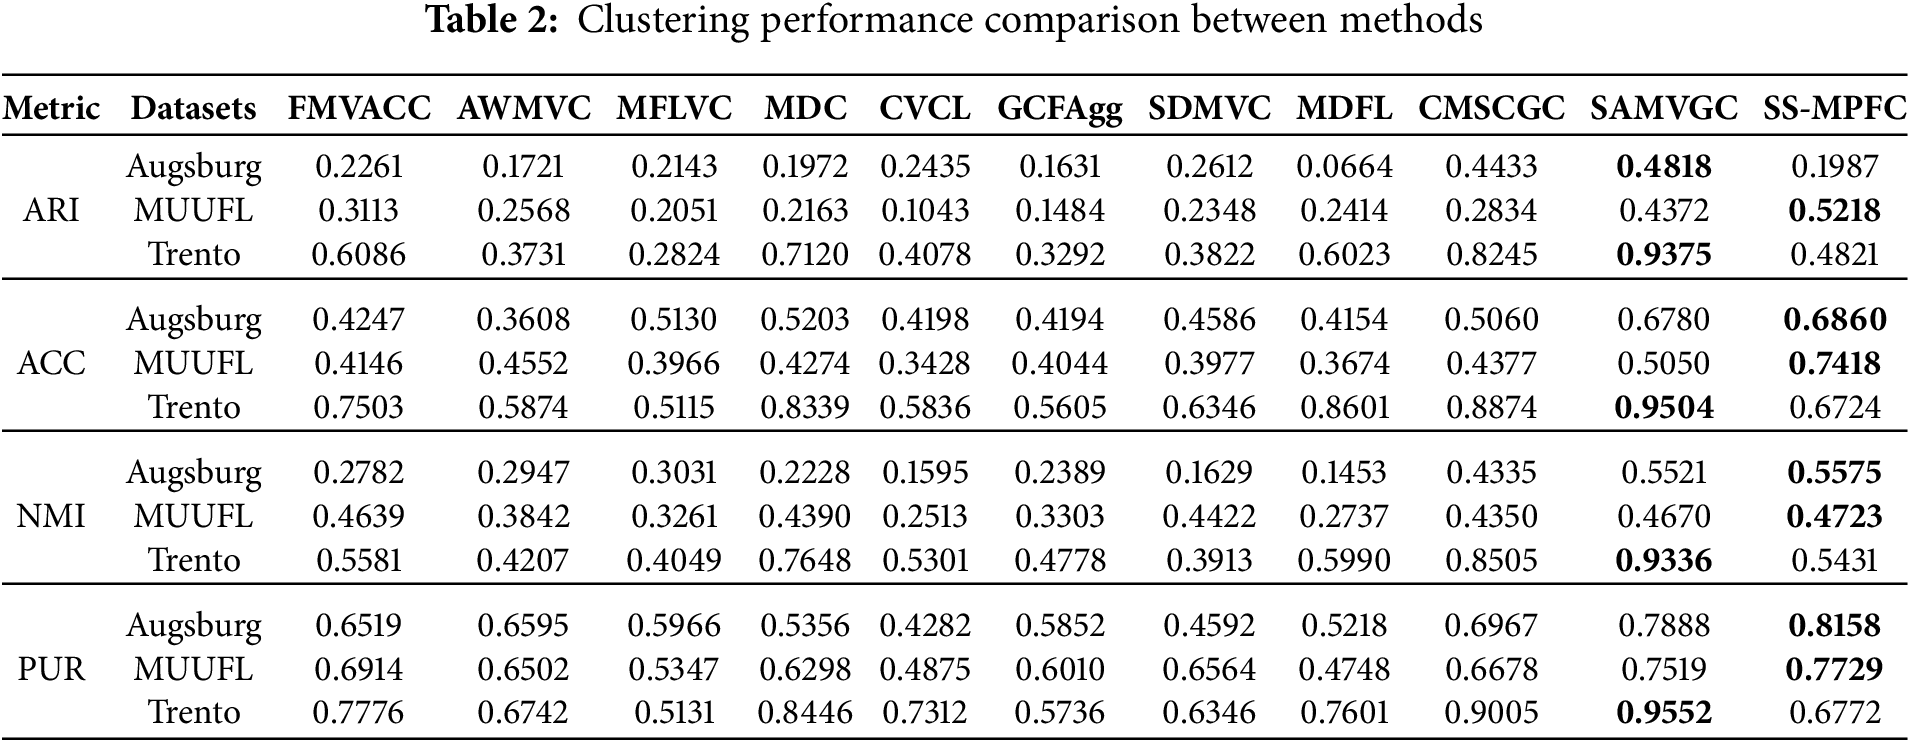
Across three benchmark datasets (Augsburg, MUUFL, Trento) and four evaluation metrics, the proposed method SS-MPFC demonstrates a clear advantage on datasets with low separability and high noise. Specifically, SS-MPFC attains the highest scores on MUUFL for metrics including ACC = 0.7418, ARI = 0.5218, NMI = 0.4723, and PUR = 0.7729, outperforming the strongest baseline (SAMVGC) by margins ranging from 1.1% (NMI on MUUFL) to 46.9% (ACC on MUUFL). On MUUFL, the improvements are +19.4% in ARI, +46.9% in ACC, +1.1% in NMI, and +2.8% in PUR, indicating superior label assignment accuracy and cluster purity, even under substantial class overlap, thus demonstrating robustness on very low-separability data.
By contrast, on Augsburg and especially Trento, SS-MPFC’s performance degrades, particularly in ARI and NMI. Concretely, on Augsburg, SS-MPFC is slightly better in ACC (+1.2%), NMI (+1.0%), and PUR (+3.4%) but suffers a substantial drop in ARI (−58.8%), suggesting that the model’s optimization leans toward label assignment/purity rather than recovering cluster boundaries aligned with ground-truth labels. Conversely, Trento exposes pronounced weaknesses (ARI −48.6%, ACC −29.3%, NMI −41.8%, PUR −29.1%), indicating that SS-MPFC does not yet fully exploit the pronounced spatial, spectral structure and strong class stratification, traits that favor graph-structure optimization methods, such as SAMVGC. This highlights potential avenues for improvement (e.g., strengthening graph constraints or incorporating spatial attention mechanisms) to close the gap with methods advantaged on well-structured data. Overall, the experimental results indicate that SS-MPFC is an effective and competitive solution for complex clustering tasks, particularly under noise, feature overlap, and low separability, while motivating future work to enhance performance on datasets with pronounced class structure.
The experimental results on the MUUFL and Trento datasets (Fig. 2) show that the SS-MPFC algorithm significantly improves the metrics (ACC, NMI, ARI, Purity) as the number of anchors increases from 1C to 4C. However, from 4C to 5C, the performance no longer improves significantly and even slightly decreases. This indicates that the optimal number of anchors is around 4C, where the performance stabilizes and remains relatively unchanged with further increases in anchor count.
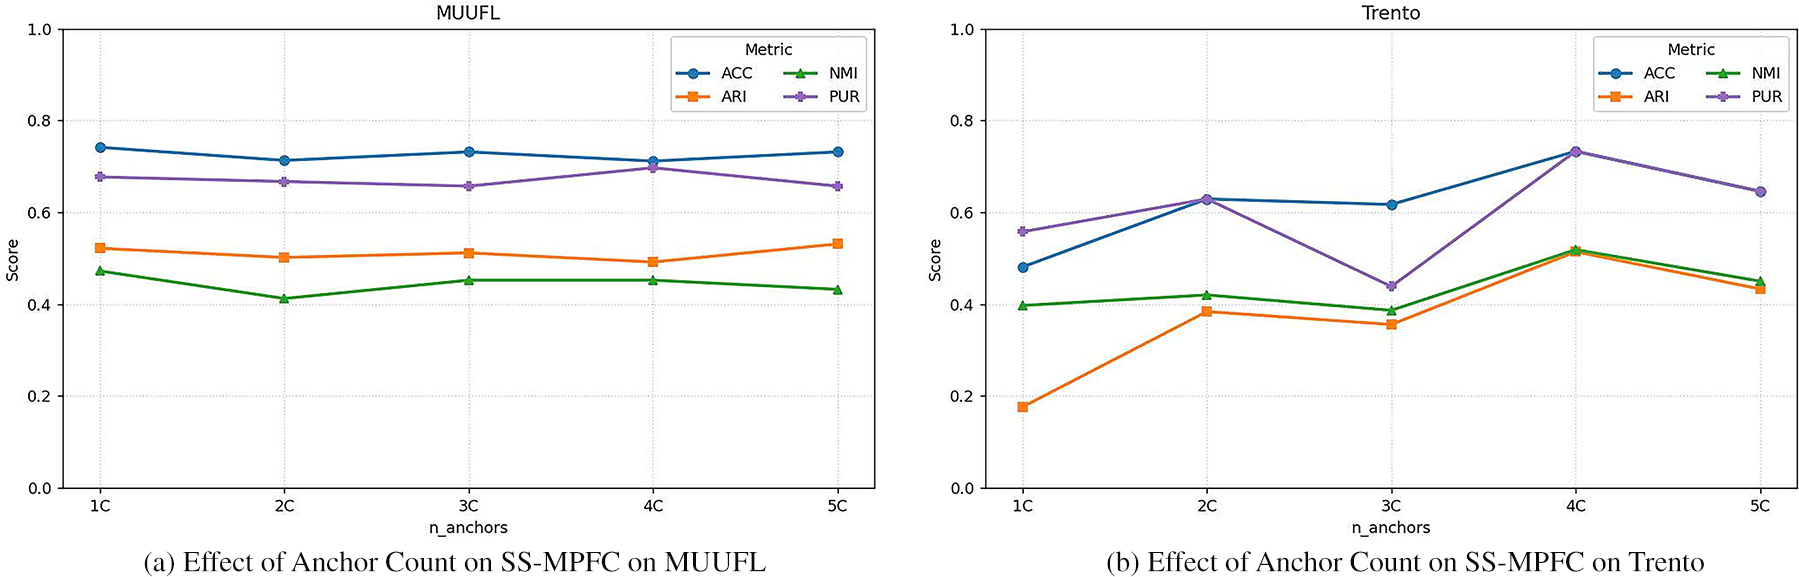
Figure 2: Effect of anchor count on SS-MPFC algorithm performance: results on MUUFL (a) and Trento (b) Datasets
To evaluate the robustness of the semi-supervised approach, we conducted additional experiments with two other labeling ratios (1% and 10%) on the MUUFL and Trento datasets, with the results presented in Fig. 3.
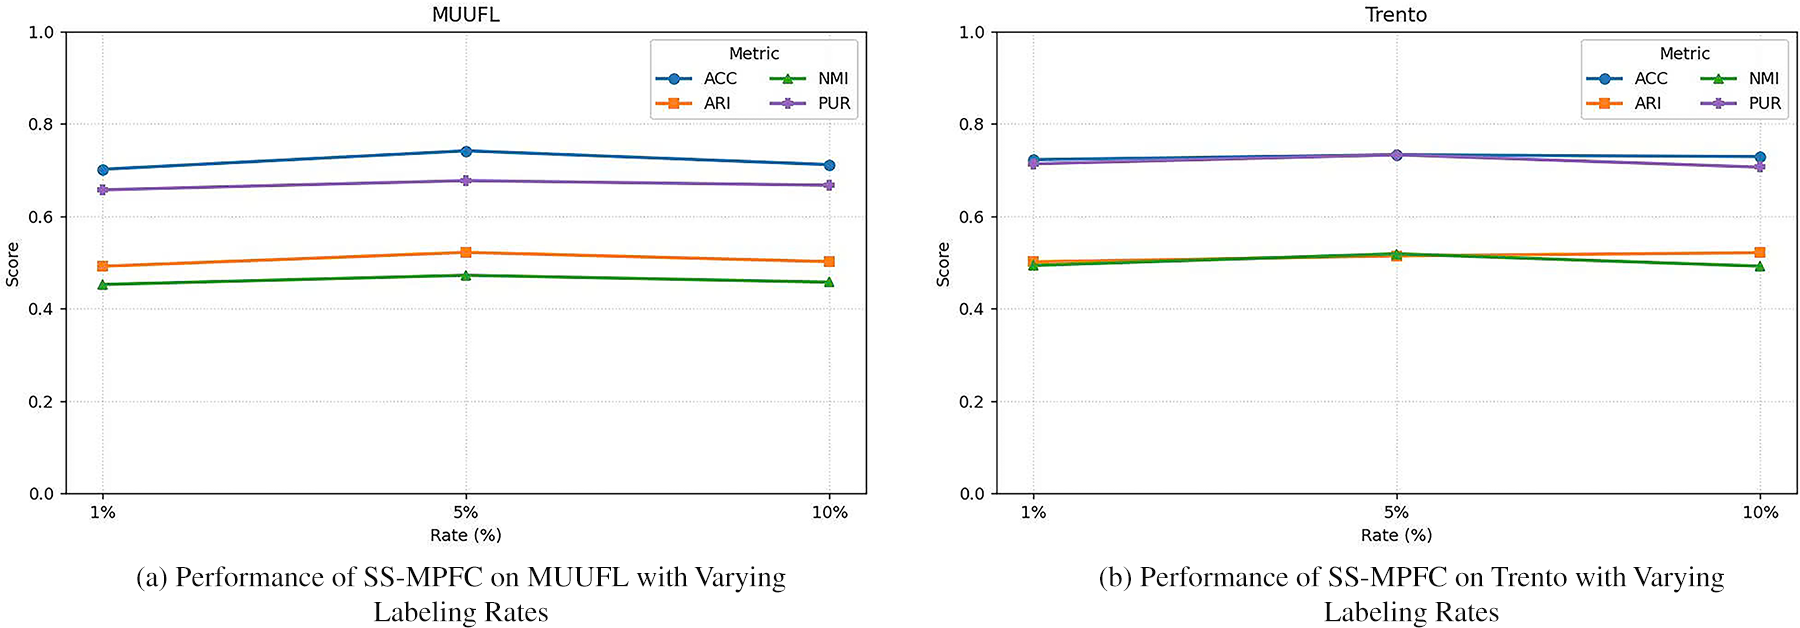
Figure 3: SS-MPFC performance with varying labeling rates (MUUFL (a) and Trento (b))
The experimental results on the MUUFL and Trento datasets with 1%, 5%, and 10% labeling rates show that the SS-MPFC algorithm maintains stable performance across different labeling ratios. For MUUFL, performance slightly decreases with lower labeling rates, whereas Trento remains consistent across all rates. These findings confirm that SS-MPFC is robust and effective even with limited labeled data.
Reasons Behind the Model’s Effectiveness: The superior performance of SS-MPFC stems from the synergistic integration of three key components. First, multi-view representation learning allows the model to leverage complementary information from different data sources, resulting in a more discriminative feature space compared to single-view methods. Second, the semi-supervised learning component is crucial when labeled data is limited, as it allows label information to propagate effectively across unlabeled samples, particularly benefiting minority classes. Third, the incorporation of picture fuzzy sets enables the model to represent overlapping and ambiguous regions more flexibly. For instance, land–water boundaries, which are inherently vague, are better captured through fuzzy logic, enhancing inter-class discrimination in complex transitional regions.
Compared to traditional MvC methods such as FMVACC and AWMVC, SS-MPFC achieves significantly better results because conventional methods often fail to handle unlabeled data and lack mechanisms to model uncertainty. Advanced deep learning-based methods like MDC, MFLVC, GCFAgg and CVCL perform well under fully supervised conditions but tend to degrade sharply when label availability is low. In contrast, SS-MPFC maintains high accuracy even in low-label scenarios. As for graph-based clustering approaches such as SDMVC, MDFL, SAMVGC and CMSCGC, while they benefit from effective information propagation via graph structures, their lack of integration between fuzzy modeling and semi-supervised learning hinders their performance in noisy and overlapping scenarios. SS-MPFC addresses these limitations by combining adaptive graph construction, semi-supervised label propagation, and fuzzy modeling in a unified framework.
Despite its promising performance, SS-MPFC is not without limitations. First, its computational cost is relatively high, especially for large-scale datasets (e.g., more than 10,000 samples). Second, the current implementation requires manual tuning of several hyperparameters, including regularization weights and the number of anchors, which may limit its usability in automated or scalable systems. Third, SS-MPFC does not yet explicitly exploit spatial-geographic relationships, such as neighborhood consistency or topographic structure, which are often crucial for enhancing accuracy in remote sensing applications.
Visualization: The following section presents the segmentation results of satellite images using the proposed SS-MPFC algorithm to highlight its effectiveness. The ground truth labels and the segmentation outputs generated by SS-MPFC on three benchmark datasets: Augsburg, MUUFL, and Trento are shown in Figs. 4–6, respectively.
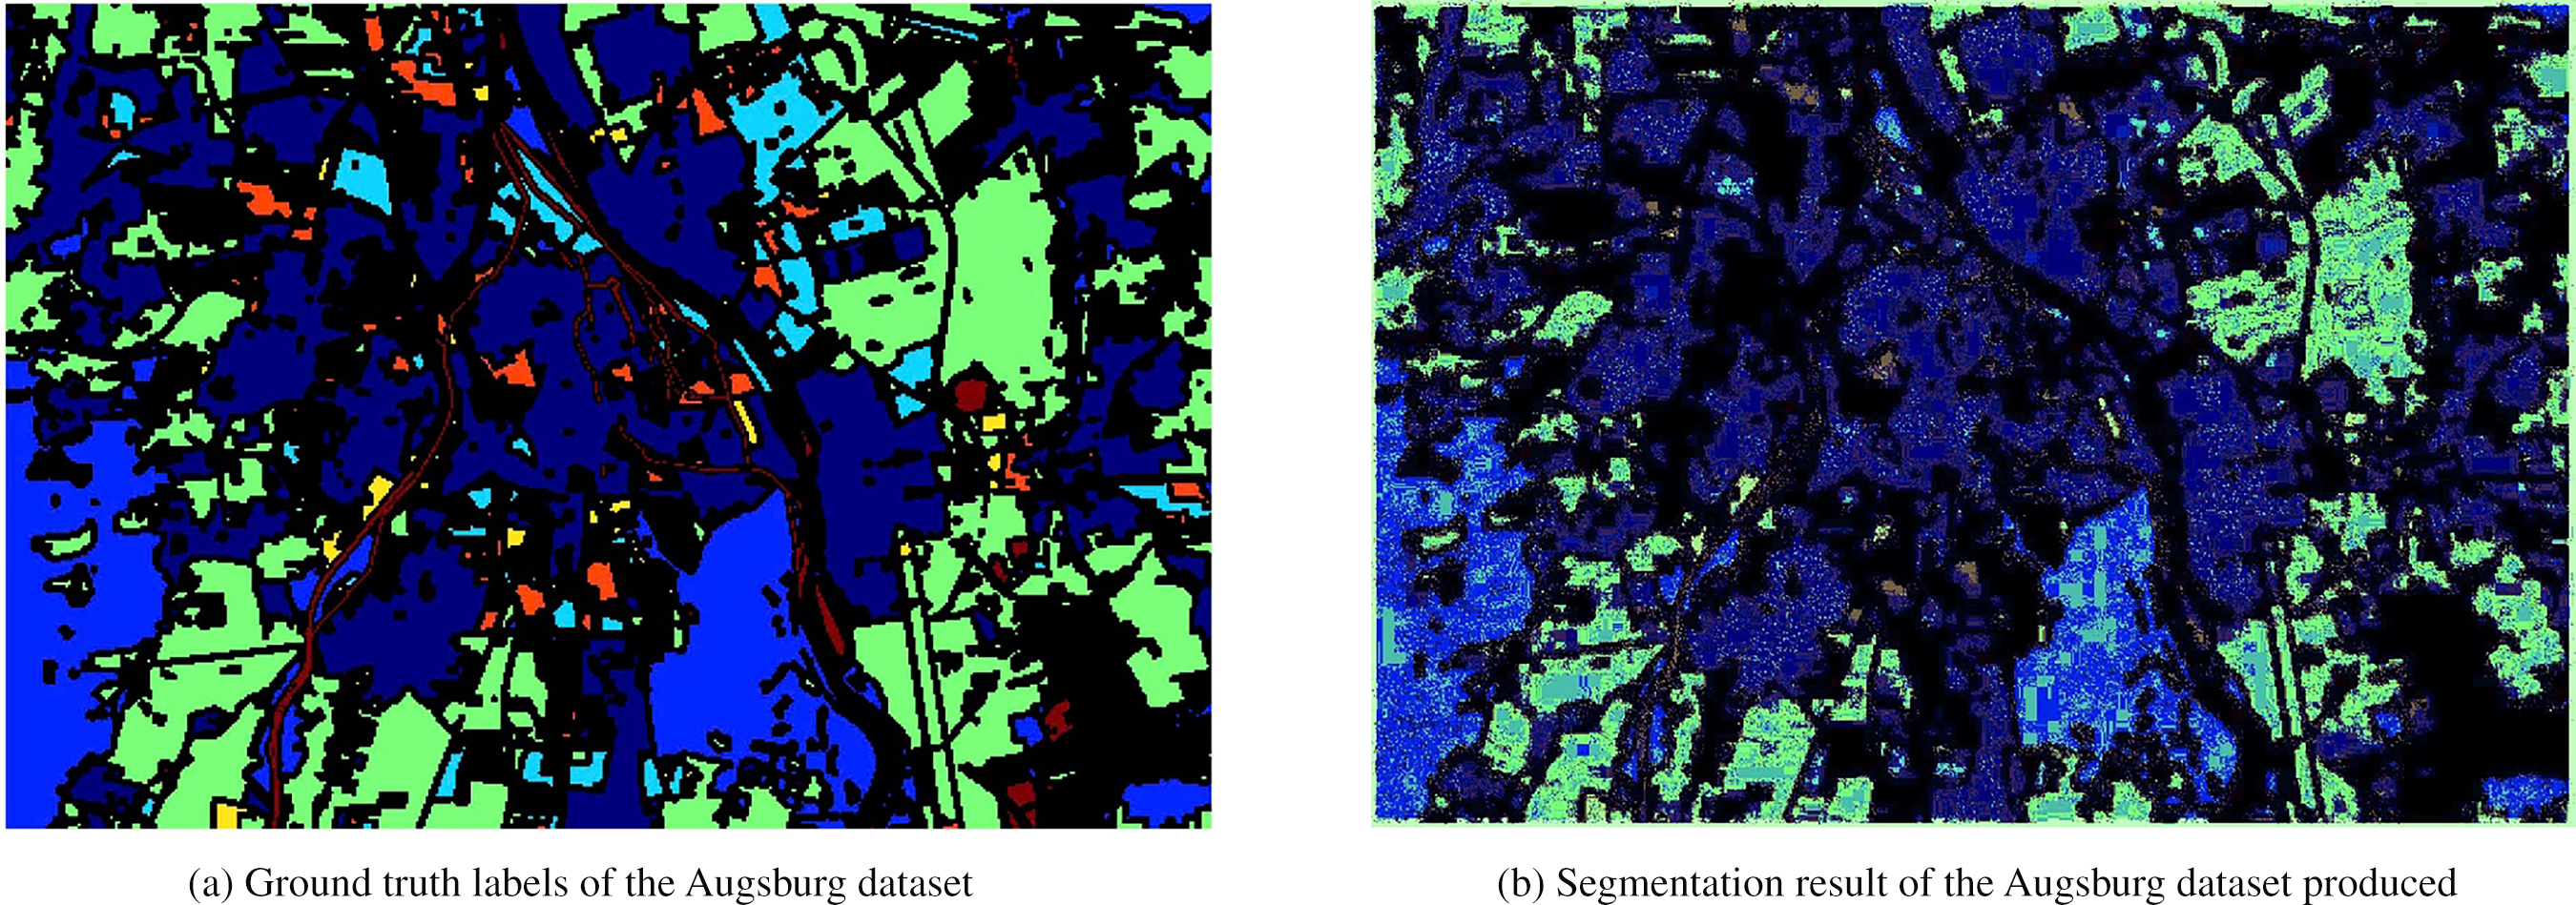
Figure 4: (a) Ground truth labels of the Augsburg dataset. (b) Segmentation results of the Augsburg dataset produced by the SS-MPFC algorithm, demonstrating effective discrimination among diverse urban and vegetation classes, improved boundary delineation, and less noise than baseline approaches
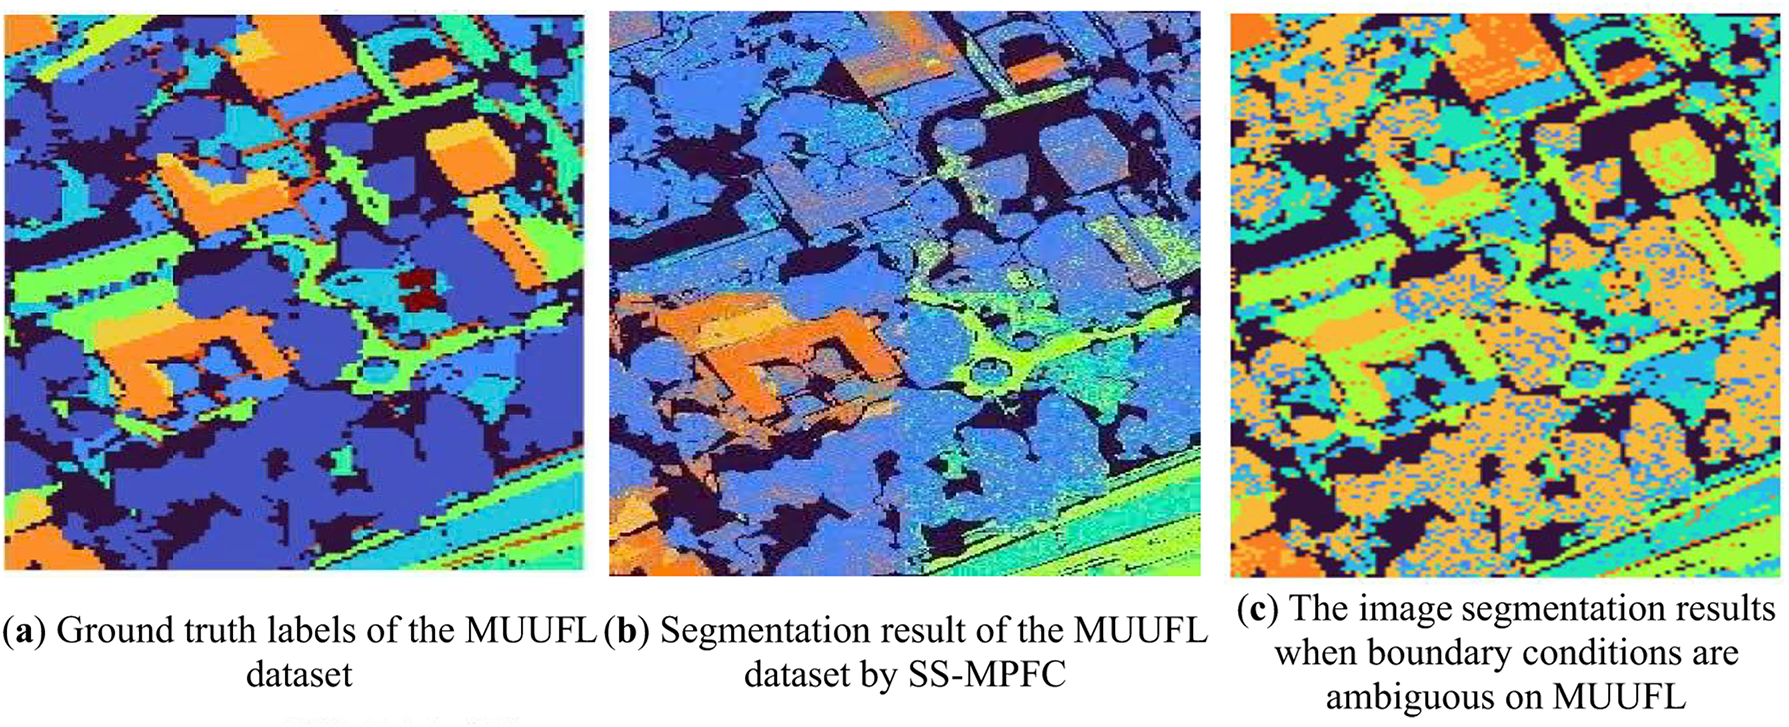
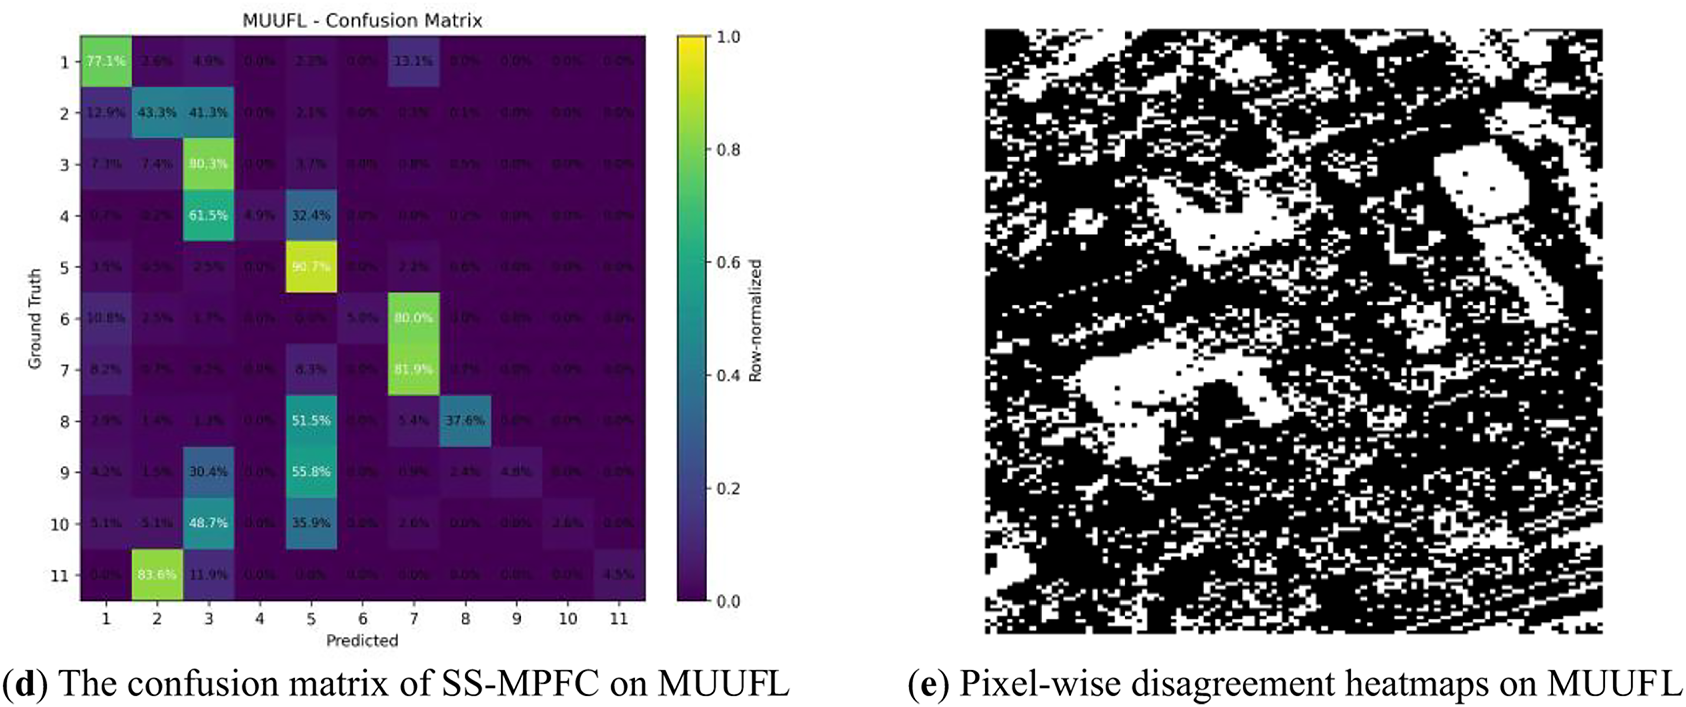
Figure 5: (a) Ground truth labels of the MUUFL dataset. (b) Segmentation results obtained by the proposed SS-MPFC method demonstrate better discrimination between spectrally similar urban and vegetation classes, with improved boundary preservation and reduced noise compared to baseline methods. (c) Image segmentation results on MUUFL when boundary conditions are ambiguous. (d) The confusion matrix of SS-MPFC on the MUUFL dataset, showing the classification performance across all classes. (e) Pixel-wise disagreement heatmaps on MUUFL, illustrating regions of uncertainty and disagreement between the predicted and ground truth labels
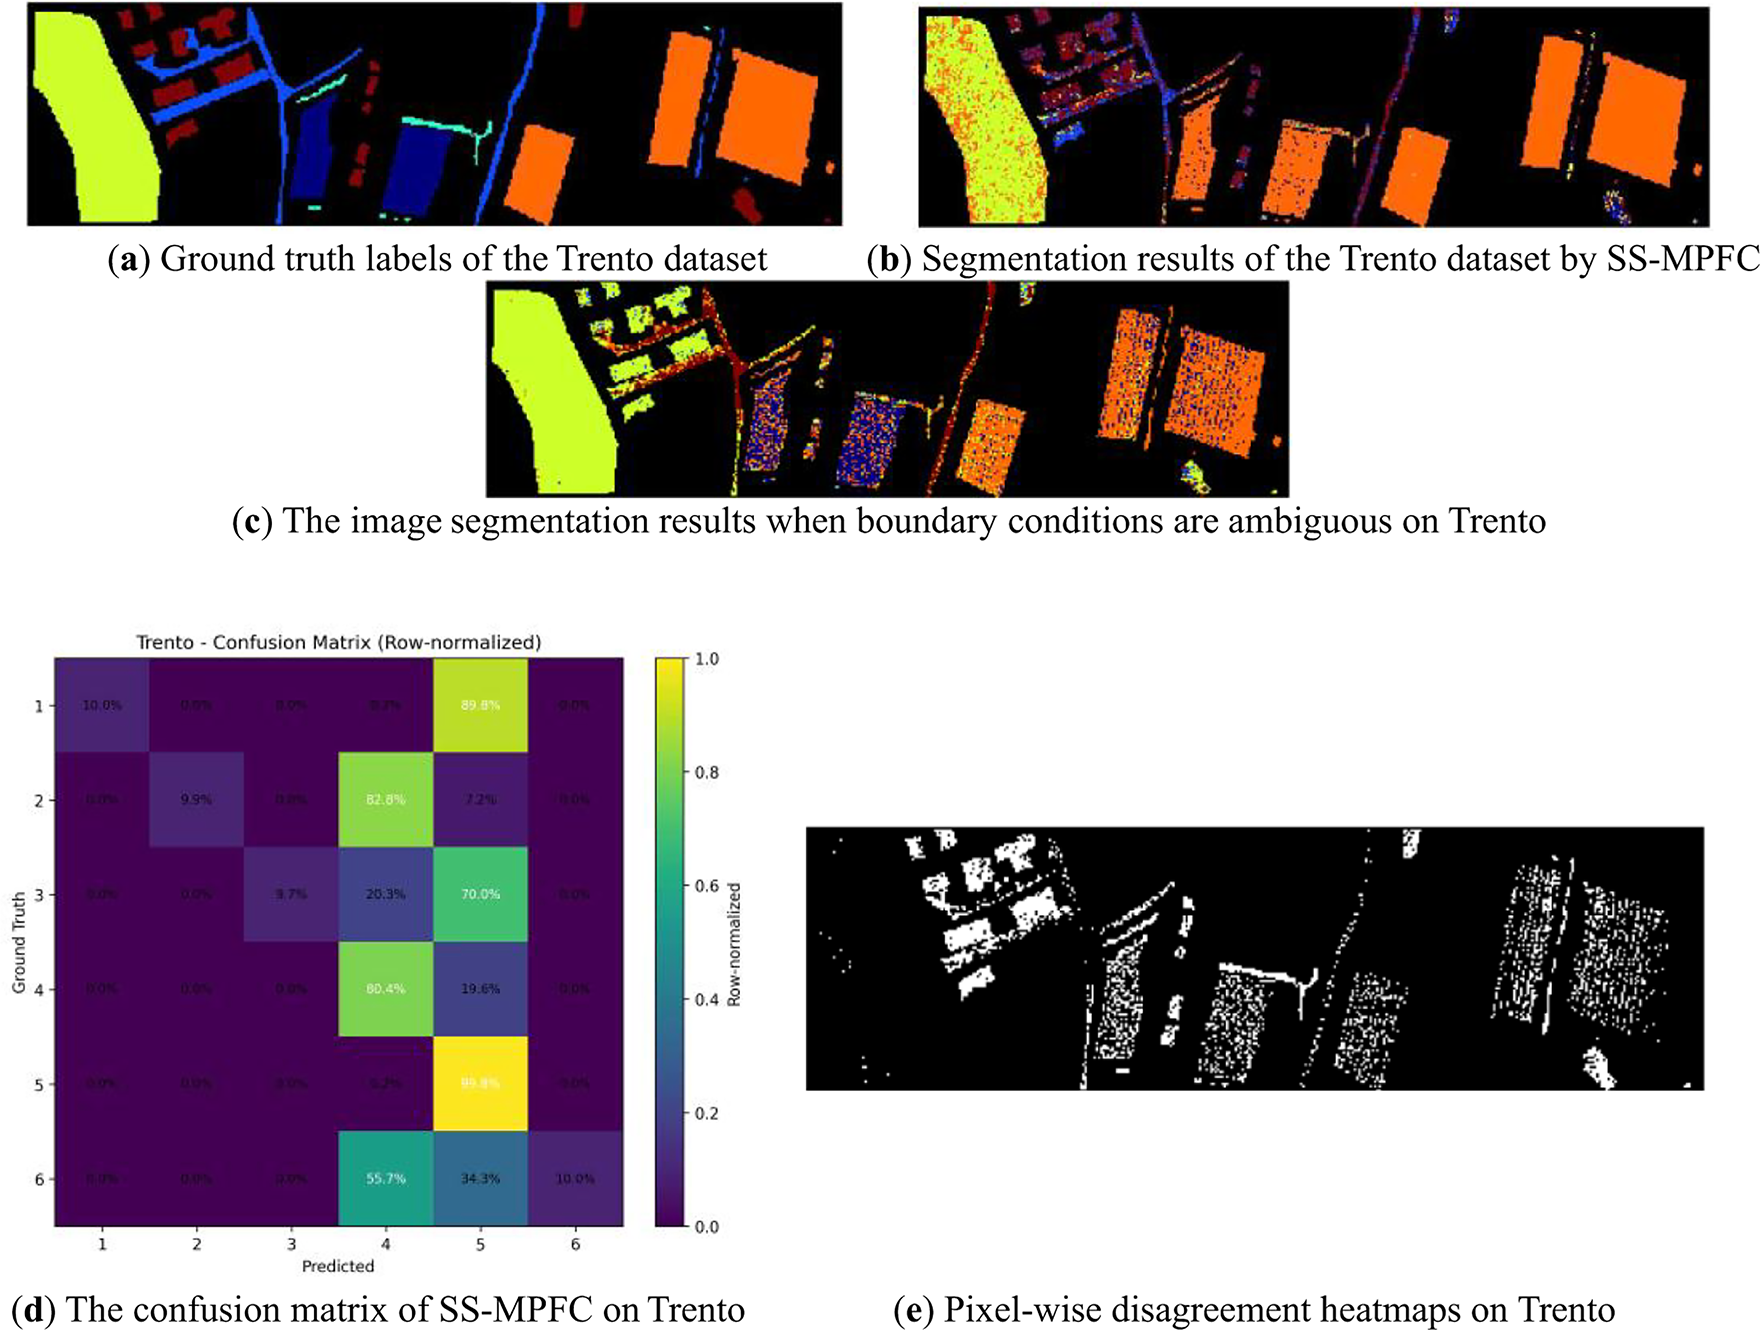
Figure 6: (a) Ground truth labels of the Trento dataset. (b) Segmentation results of the Trento obtained by the proposed SS-MPFC method, showing accurate classification of both vegetation and urban areas, with clear boundary preservation and reduced misclassification compared to baseline methods. (c) Image segmentation results on Trento when boundary conditions are ambiguous. (d) The confusion matrix of SS-MPFC on the Trento dataset, illustrating the classification performance across all classes. (e) Pixel-wise disagreement heatmaps on Trento, highlighting regions of uncertainty and disagreement between predicted and ground truth labels
The quantitative evaluation results on the Augsburg dataset, summarized in Table 2, demonstrate the superior performance of the proposed SS-MPFC algorithm compared to several state-of-the-art baseline methods. Specifically, SS-MPFC achieves the highest scores across multiple metrics, including ACC of 0.6860, NMI of 0.5575, and PUR of 0.8158. These improvements indicate that SS-MPFC more effectively captures the complex spectral and spatial characteristics inherent in the diverse urban and vegetation classes of the Augsburg dataset. The enhanced boundary delineation and noise reduction observed in the visual segmentation results (Fig. 4b) further corroborate the robustness and discriminative power of our approach compared to the other methods.
The quantitative results on the MUUFL dataset, presented in Table 2, indicate that the proposed SS-MPFC algorithm significantly outperforms existing baseline methods across all evaluation metrics. SS-MPFC achieves the highest ARI of 0.5218, ACC of 0.7418, NMI of 0.4723, and PUR of 0.7729. These results demonstrate the algorithm’s strong capability in effectively discriminating between spectrally similar urban and vegetation classes. Furthermore, the visual segmentation outcomes (Fig. 5b,c) illustrate improved boundary preservation and reduced noise, validating the robustness of SS-MPFC in handling complex and heterogeneous data inherent to the MUUFL dataset. In addition, the confusion matrix in Fig. 5d also illustrates the performance of SS-MPFC on the MUUFL dataset.
The quantitative results on the Trento dataset, summarized in Table 2, indicate that the proposed SS-MPFC algorithm performs less competitively compared to several state-of-the-art baseline methods. Specifically, SS-MPFC achieves lower scores in ARI at 0.4821, ACC at 0.6724, NMI at 0.5431, and PUR at 0.6772. These results suggest that while SS-MPFC can capture some of the spectral-spatial characteristics of the Trento dataset, it struggles to fully discriminate the highly heterogeneous classes and complex urban-vegetation interfaces present in this dataset. Visual results (Fig. 6b,c) still show reasonable boundary preservation and classification, but there is noticeable room for improvement in handling the challenging variations and fine details within the data. The confusion matrix in Fig. 6d also illustrates the performance of SS-MPFC on the Trento dataset. Future work may focus on enhancing the model’s capacity to better capture these complexities to achieve more robust segmentation performance on such datasets.
Error-map visualizations, specifically pixel-wise disagreement heatmaps, utilize a color scheme where black represents regions of pixel uniformity (indicating accurate predictions) and white signifies areas of non-uniformity (indicating incorrect predictions). As shown in Fig. 5e, the MUUFL dataset predominantly features darker regions, which reflect the model’s high segmentation accuracy. Conversely, the presence of lighter regions highlights instances of incorrect predictions, suggesting challenges in the model’s ability to identify complex features. In Fig. 6e, which pertains to the Trento dataset, while some areas exhibit uniformity, the notable presence of significant non-uniform regions emphasizes the necessity for the model to improve its classification capabilities, particularly in regions characterized by diverse and overlapping structures. A thorough analysis of these non-uniform areas is essential for optimizing the model’s performance in practical satellite image segmentation applications.
In summary, the proposed SS-MPFC algorithm consistently achieves superior segmentation results on the MUUFL and Augsburg datasets by effectively discriminating diverse urban and vegetation classes with improved boundary preservation and noise reduction. However, its performance on the Trento dataset is comparatively limited, highlighting challenges in handling highly heterogeneous and complex spectral-spatial features. These findings suggest that while SS-MPFC is robust for a range of multi-view remote sensing scenarios, further enhancements are needed to improve its adaptability and accuracy on more challenging datasets.
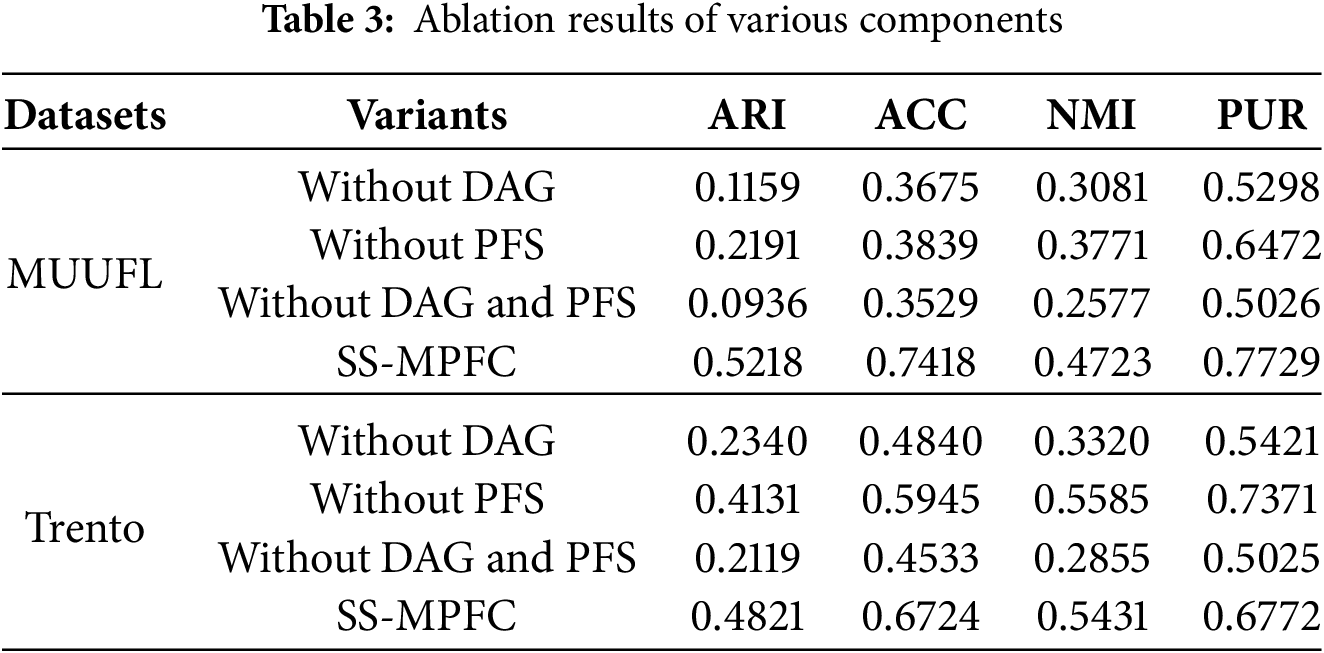
Ablation Study: The ablation study results demonstrate the impact of removing the Dual Anchor Graph (DAG), Picture Fuzzy Set (PFS), and both components on the performance of the SS-MPFC algorithm (Table 3). Removing DAG leads to a significant decrease in the ARI, ACC, NMI, and PUR metrics on both the MUUFL and Trento datasets, indicating that DAG plays a crucial role in improving clustering performance. Removing PFS also results in a reduction in these metrics, though the decrease is less pronounced. Notably, when both DAG and PFS are removed, the performance drops the most, highlighting the importance of both components in optimizing the SS-MPFC algorithm’s results. This indicates that both DAG and PFS are essential for enhancing the clustering effectiveness of the model.
In this paper, we have introduced SS-MPFC, a novel semi-supervised multi-view clustering algorithm tailored for the challenges of satellite image segmentation. By jointly integrating multi-view representation learning, semi-supervised learning, and picture fuzzy set modeling, SS-MPFC effectively addresses three critical aspects of remote sensing data: heterogeneity, class overlap, and uncertainty. Experimental evaluations on the Trento, MUUFL, and Augsburg datasets demonstrated that SS-MPFC achieves superior performance over several state-of-the-art baselines, particularly in noisy and low-separability scenarios, while also exhibiting improved boundary delineation and semantic interpretability.
The core advantage of SS-MPFC lies in its capacity to harness complementary information from diverse views while simultaneously handling the absence of labels and modeling the inherent fuzziness in real-world satellite scenes. Furthermore, the use of picture fuzzy sets enhances its robustness in complex geographical transitions, such as land–water boundaries where traditional methods often struggle. However, despite these promising results, the current implementation of SS-MPFC presents some limitations. Specifically, the computational cost remains a limiting factor due to the high dimensionality of multi-view data and the integration of graph-based optimization, which may impede scalability for real-time or large-scale applications. Additionally, the model requires manual tuning of several hyperparameters, which can limit its adaptability to unseen datasets. Another open challenge is the lack of explicit spatial-context modeling, which could further improve segmentation accuracy in geographically structured environments. To address these issues, future work will focus on four prioritized directions: (i) incorporating more efficient optimization strategies and lightweight deep learning architectures to enhance scalability while also demonstrating the convergence of the algorithm through theoretical analysis, (ii) integrating spatial-contextual information, such as spatial attention mechanisms or graph convolutional networks, to better exploit neighborhood and topographic structures, (iii) developing automated hyperparameter tuning methods (e.g., Bayesian optimization or meta-learning) to improve generalization across diverse datasets, and (iv) extending SS-MPFC toward online and continual learning to support real-time applications in disaster monitoring, agricultural management, and dynamic urban mapping.
In summary, SS-MPFC provides a unified, interpretable, and flexible framework that advances the state of the art in multi-view clustering for remote sensing. Its conceptual design and empirical effectiveness make it a strong candidate for integration into next-generation intelligent Earth observation systems.
Acknowledgement: Not applicable.
Funding Statement: This work was funded by the Research Project: THTETN.05/24-25, Vietnam Academy of Science and Technology.
Author Contributions: Conceptualization of the study: Pham Huy Thong, Hoang Thi Canh, Nguyen Long Giang; data collection and experimental work: Hoang Thi Canh, Pham Huy Thong, Nguyen Tuan Huy; analysis and interpretation of data: Hoang Thi Canh, Pham Huy Thong, Nguyen Long Giang, Luong Thi Hong Lan; manuscript preparation: Hoang Thi Canh, Pham Huy Thong, Luong Thi Hong Lan. All authors reviewed the results and approved the final version of manuscript.
Availability of Data and Materials: The datasets that support the findings of this study are openly accessible in public repositories: the Augsburg dataset for multimodal classification is available at https://figshare.com/articles/dataset/28112405 (accessed on 01 January 2025) [51], the Trento dataset is available at https://github.com/tyust-dayu/Trento (accessed on 01 January 2025) [52], and the MUUFL Gulfport hyperspectral dataset is available at https://github.com/GatorSense/MUUFLGulfport (accessed on 01 January 2025) [53].
Ethics Approval: Not applicable.
Conflicts of Interest: The authors declare no conflicts of interest to report regarding the present study.
References
1. Guan R, Li Z, Li X, Tang C. Pixel-superpixel contrastive learning and pseudo-label correction for hyperspectral image clustering. In: Proceedings of the ICASSP 2024—2024 IEEE International Conference on Acoustics, Speech and Signal Processing (ICASSP); 2024 Apr 14–19; Seoul, Republic of Korea. Piscataway, NJ, USA: EEE; 2024. p. 6795–9. doi:10.1109/ICASSP48485.2024.10447080. [Google Scholar] [CrossRef]
2. Hoang S, Huy T. Some novel hybrid forecast methods based on picture fuzzy clustering for weather nowcasting from satellite image sequences. Appl Intell. 2017;46(1):1–15. doi:10.1007/s10489-016-0811-1. [Google Scholar] [CrossRef]
3. Plaza A, Benediktsson JA, Boardman JW, Brazile J, Bruzzone L, Camps-Valls G, et al. Recent advances in techniques for hyperspectral image processing. Remote Sens Environ. 2009;113:S110–22. doi:10.1016/j.rse.2007.07.028. [Google Scholar] [CrossRef]
4. Chen Y, Jiang H, Li C, Jia X, Ghamisi P. Deep feature extraction and classification of hyperspectral images based on convolutional neural networks. IEEE Trans Geosci Remote Sens. 2016;54(10):6232–51. doi:10.1109/TGRS.2016.2584107. [Google Scholar] [CrossRef]
5. Zhai H, Zhang H, Li P, Zhang L. Hyperspectral image clustering: current achievements and future lines. IEEE Geosci Remote Sens Mag. 2021;9(4):35–67. doi:10.1109/MGRS.2020.3032575. [Google Scholar] [CrossRef]
6. Liu Y, Zhu E, Wang Q, Li J, Liu S, Hu Y, et al. Spatial-spectral adaptive graph convolutional subspace clustering for hyperspectral image. IEEE J Sel Top Appl Earth Obs Remote Sens. 2025;18:1139–52. doi:10.1109/JSTARS.2024.3502504. [Google Scholar] [CrossRef]
7. Thong PH, Huan PT, Canh HT, Hao HT, Thai VD, Son LH. Flood detection through satellite image segmentation utilizing fuzzy clustering and picture fuzzy sets. In: Advances in information and communication technology. Cham, Switzerland: Springer Nature; 2025. p. 9–20. doi:10.1007/978-3-031-80943-9_2. [Google Scholar] [CrossRef]
8. Liu Y, Diao C, Mei W, Zhang C. CropSight: towards a large-scale operational framework for object-based crop type ground truth retrieval using street view and PlanetScope satellite imagery. ISPRS J Photogramm Remote Sens. 2024;216:66–89. doi:10.1016/j.isprsjprs.2024.07.025. [Google Scholar] [CrossRef]
9. Canh HT, Thong PH, Huan PT, Trang VT, Hieu NN, Phuong NT, et al. A novel semi-supervised consensus fuzzy clustering method for multi-view relational data. Int J Electr Comput Eng. 2024;14(6):6883–93. doi:10.11591/ijece.v14i6.pp6883-6893. [Google Scholar] [CrossRef]
10. Ye H, Chen H, Chen X, Chung V. Adaptively augmented consistency learning: a semi-supervised segmentation framework for remote sensing. In: Mahmud M, Doborjeh M, Wong K, Leung ACS, Doborjeh Z, Tanveer M, editors. Neural Information Processing: 31st International Conference, ICONIP 2024; 2024 Dec 2–6; Auckland, New Zealand. Singapore: Springer; 2025. p. 122–35. doi:10.1007/978-981-96-6603-4_9. [Google Scholar] [CrossRef]
11. Xu C, Tao D, Xu C. A survey on multi-view learning. arXiv:1304.5634. 2013. [Google Scholar]
12. Chen Z, Zhang C, Mu T, He Y. Tensorial multiview subspace clustering for polarimetric hyperspectral images. IEEE Trans Geosci Remote Sens. 2022;60:5528513. doi:10.1109/TGRS.2022.3174830. [Google Scholar] [CrossRef]
13. Cai Y, Zhang Z, Liu X, Ding Y, Li F, Tan J. Learning unified anchor graph for joint clustering of hyperspectral and LiDAR data. IEEE Trans Neural Netw Learn Syst. 2025;36(4):6341–54. doi:10.1109/TNNLS.2024.3392484. [Google Scholar] [PubMed] [CrossRef]
14. Zhang Y, Yan S, Jiang X, Zhang L, Cai Z, Li J. Dual graph learning affinity propagation for multimodal remote sensing image clustering. IEEE Trans Geosci Remote Sens. 2024;62:5521713. doi:10.1109/TGRS.2024.3416459. [Google Scholar] [CrossRef]
15. Shahi KR, Ghamisi P, Rasti B, Scheunders P, Gloaguen R. Unsupervised data fusion with deeper perspective: a novel multisensor deep clustering algorithm. IEEE J Sel Top Appl Earth Obs Remote Sens. 2022;15:284–96. doi:10.1109/JSTARS.2021.3132856. [Google Scholar] [CrossRef]
16. Bezdek JC, Ehrlich R, Full W. FCM: the fuzzy c-means clustering algorithm. Comput Geosci. 1984;10(2–3):191–203. doi:10.1016/0098-3004(84)90020-7. [Google Scholar] [CrossRef]
17. Huy T, Hoang S. Picture fuzzy clustering: a new computational intelligence method. Soft Comput. 2016;20(9):3549–62. doi:10.1007/s00500-015-1712-7. [Google Scholar] [CrossRef]
18. Zhang P, Ke Y, Zhang Z, Wang M, Li P, Zhang S. Urban land use and land cover classification using novel deep learning models based on high spatial resolution satellite imagery. Sensors. 2018;18(11):3717. doi:10.3390/s18113717. [Google Scholar] [PubMed] [CrossRef]
19. Pan Z, Xu J, Guo Y, Hu Y, Wang G. Deep learning segmentation and classification for urban village using a worldview satellite image based on U-Net. Remote Sens. 2020;12(10):1574. doi:10.3390/rs12101574. [Google Scholar] [CrossRef]
20. Saralioglu E, Gungor O. Semantic segmentation of land cover from high resolution multispectral satellite images by spectral-spatial convolutional neural network. Geocarto Int. 2022;37(2):657–77. doi:10.1080/10106049.2020.1734871. [Google Scholar] [CrossRef]
21. Tanim AH, McRae CB, Tavakol-Davani H, Goharian E. Flood detection in urban areas using satellite imagery and machine learning. Water. 2022;14(7):1140. doi:10.3390/w14071140. [Google Scholar] [CrossRef]
22. Yousefi S, Mirzaee S, Almohamad H, Al Dughairi AA, Gomez C, Siamian N, et al. Image classification and land cover mapping using sentinel-2 imagery: optimization of SVM parameters. Land. 2022;11(7):993. doi:10.3390/land11070993. [Google Scholar] [CrossRef]
23. Hamada MA, Kanat Y, Abiche AE. Multi-spectral image segmentation based on the K-means clustering. Int J Innov Technol Explor Eng. 2019;9(2):1016–9. doi:10.35940/ijitee.k1596.129219. [Google Scholar] [CrossRef]
24. Manjula P, Muyal O, Al-Absi AA. Satellite image segmentation and classification using fuzzy C-means clustering and support vector machine classifier. In: Proceedings of International Conference on Smart Computing and Cyber Security; 2020 Jul 7–8. Goseong-gun, Republic of Korea. Singapore: Springer; 2020. p. 225–37. doi:10.1007/978-981-15-7990-5_22. [Google Scholar] [CrossRef]
25. Li J, Guan R, Han Y, Hu Y, Li Z, Wu Y, et al. Superpixel-based dual-neighborhood contrastive graph autoencoder for deep subspace clustering of hyperspectral image. In: Advanced intelligent computing technology and applications. Singapore: Springer Nature; 2024. p. 181–92. doi:10.1007/978-981-97-5597-4_16. [Google Scholar] [CrossRef]
26. Yang X, Liu W, Liu W. Tensor canonical correlation analysis networks for multi-view remote sensing scene recognition. IEEE Trans Knowl Data Eng. 2022;34(6):2948–61. doi:10.1109/TKDE.2020.3016208. [Google Scholar] [CrossRef]
27. Guan R, Li Z, Tu W, Wang J, Liu Y, Li X, et al. Contrastive multiview subspace clustering of hyperspectral images based on graph convolutional networks. IEEE Trans Geosci Remote Sens. 2024;62:5510514. doi:10.1109/TGRS.2024.3370633. [Google Scholar] [CrossRef]
28. Luo F, Liu Y, Gong X, Nan Z, Guo T. EMVCC: enhanced multi-view contrastive clustering for hyperspectral images. In: Proceedings of the 32nd ACM International Conference on Multimedia; 2024 Oct 28. Melbourne, VIC, Australia. New York, NY, USA: ACM; 2024. p. 6288–96. doi:10.1145/3664647.3681600. [Google Scholar] [CrossRef]
29. Cai Y, Zhang Z, Ghamisi P, Rasti B, Liu X, Cai Z. Transformer-based contrastive prototypical clustering for multimodal remote sensing data. Inf Sci. 2023;649(1):119655. doi:10.1016/j.ins.2023.119655. [Google Scholar] [CrossRef]
30. Sharifzadeh S, Amiri S, Abdi S. A new method for semi-supervised segmentation of satellite images. In: Proceedings of the 2021 22nd IEEE International Conference on Industrial Technology (ICIT); 2021 Mar 10–12; Valencia, Spain. Piscataway, NJ, USA: IEEE; 2021. p. 832–7. doi:10.1109/icit46573.2021.9453700. [Google Scholar] [CrossRef]
31. Huan PT, Canh HT, Thai VD, Khoi DH, Giang LT. Enhancing wildfire detection using semi-supervised fuzzy clustering on satellite imagery. In: Advances in information and communication technology. Cham, Switzerland: Springer Nature; 2023. p. 166–75. doi:10.1007/978-3-031-49529-8_18. [Google Scholar] [CrossRef]
32. Lu X, Li L, Jiao L, Liu X, Liu F, Ma W, et al. Uncertainty-aware semi-supervised learning segmentation for remote sensing images. IEEE Trans Multimed. 2025;27:5548–62. doi:10.1109/TMM.2025.3543026. [Google Scholar] [CrossRef]
33. Li L, Zhang W, Zhang X, Emam M, Jing W. Semi-supervised remote sensing image semantic segmentation method based on deep learning. Electronics. 2023;12(2):348. doi:10.3390/electronics12020348. [Google Scholar] [CrossRef]
34. Zhang B, Zhang Y, Li Y, Wan Y, Guo H, Zheng Z, et al. Semi-supervised deep learning via transformation consistency regularization for remote sensing image semantic segmentation. IEEE J Sel Top Appl Earth Obs Remote Sens. 2023;16:5782–96. doi:10.1109/JSTARS.2022.3203750. [Google Scholar] [CrossRef]
35. Zadeh LA. Fuzzy sets. Inf Control. 1965;8(3):338–53. doi:10.1016/S0019-9958(65)90241-X. [Google Scholar] [CrossRef]
36. Qu Q, Wan X, Liang W, Liu J, Feng Y, Xu H, et al. A lightweight anchor-based incremental framework for multi-view clustering. In: Proceedings of the 32nd ACM International Conference on Multimedia; 2024 Oct 28; Melbourne, VIC, Australia. New York, NY, USA: ACM; 2024. p. 8652–61. doi:10.1145/3664647.3680837. [Google Scholar] [CrossRef]
37. Xie W, Lu X, Liu Y, Long J, Zhang B, Zhao S, et al. Uncertainty-aware pseudo-labeling and dual graph driven network for incomplete multi-view multi-label classification. In: Proceedings of the 32nd ACM International Conference on Multimedia; 2024 Oct 28; Melbourne, VIC, Australia. New York, NY, USA: ACM; 2024. p. 6656–65. doi:10.1145/3664647.3680932. [Google Scholar] [CrossRef]
38. Liu S, Liao Q, Wang S, Liu X, Zhu E. Robust and consistent anchor graph learning for multi-view clustering. IEEE Trans Knowl Data Eng. 2024;36(8):4207–19. doi:10.1109/TKDE.2024.3364663. [Google Scholar] [CrossRef]
39. Wang S, Liu X, Liu S, Jin J, Tu W, Zhu X, et al. Align then fusion: generalized large-scale multiview clustering with anchor matching correspondences. Adv Neural Inf Process Syst. 2022;35:5882–95. [Google Scholar]
40. Wan X, Liu X, Liu J, Wang S, Wen Y, Liang W, et al. Auto-weighted multi-view clustering for large-scale data. Proc AAAI Conf Artif Intell. 2023;37(8):10078–86. doi:10.1609/aaai.v37i8.26201. [Google Scholar] [CrossRef]
41. Guan R, Tu W, Wang S, Liu J, Hu D, Tang C, et al. Structure-adaptive multi-view graph clustering for remote sensing data. Proc AAAI Conf Artif Intell. 2025;39(16):16933–41. doi:10.1609/aaai.v39i16.33861. [Google Scholar] [CrossRef]
42. Xu J, Tang H, Ren Y, Peng L, Zhu X, He L. Multi-level feature learning for contrastive multi-view clustering. In: Proceedings of the 2022 IEEE/CVF Conference on Computer Vision and Pattern Recognition (CVPR); 2022 Jun 18–24; New Orleans, LA, USA. Piscataway, NJ, USA: IEEE; 2022. p. 16030–9. doi:10.1109/CVPR52688.2022.01558. [Google Scholar] [CrossRef]
43. Chen J, Mao H, Woo WL, Peng X. Deep multiview clustering by contrasting cluster assignments. In: Proceedings of the 2023 IEEE/CVF International Conference on Computer Vision (ICCV); 2023 Oct 1–6; Paris, France. Piscataway, NJ, USA: IEEE; 2024. p. 16706–15. doi:10.1109/ICCV51070.2023.01536. [Google Scholar] [CrossRef]
44. Xu J, Ren Y, Tang H, Yang Z, Pan L, Yang Y, et al. Self-supervised discriminative feature learning for deep multi-view clustering. IEEE Trans Knowl Data Eng. 2023;35(7):7470–82. doi:10.1109/TKDE.2022.3193569. [Google Scholar] [CrossRef]
45. Yan W, Zhang Y, Lv C, Tang C, Yue G, Liao L, et al. GCFAgg: global and cross-view feature aggregation for multi-view clustering. In: Proceedings of the 2023 IEEE/CVF Conference on Computer Vision and Pattern Recognition (CVPR); 2023 Jun 17–24; Vancouver, BC, Canada. Piscataway, NJ, USA: IEEE; 2023. p. 19863–72. doi:10.1109/CVPR52729.2023.01902. [Google Scholar] [CrossRef]
46. Li D, Xie W, Zhang J, Li Y. MDFL: multi-domain diffusion-driven feature learning. Proc AAAI Conf Artif Intell. 2024;38(8):8653–60. doi:10.1609/aaai.v38i8.28710. [Google Scholar] [CrossRef]
47. Xiao S, Du S, Chen Z, Zhang Y, Wang S. Dual fusion-propagation graph neural network for multi-view clustering. IEEE Trans Multimed. 2023;25:9203–15. doi:10.1109/TMM.2023.3248173. [Google Scholar] [CrossRef]
48. Chen R, Tang Y, Cai X, Yuan X, Feng W, Zhang W. Graph structure aware contrastive multi-view clustering. IEEE Trans Big Data. 2024;10(3):260–74. doi:10.1109/TBDATA.2023.3334674. [Google Scholar] [CrossRef]
49. Thong PH, Canh HT, Lan LTH, Huy NT, Giang NL. Multi-view picture fuzzy clustering: a novel method for partitioning multi-view relational data. Comput Mater Contin. 2025;83(3):5461–85. doi:10.32604/cmc.2025.065127. [Google Scholar] [CrossRef]
50. Zhang W, Huang X, Li A, Zhang T, Ding W, Deng Z, et al. Dual anchor graph fuzzy clustering for multiview data. IEEE Trans Fuzzy Syst. 2025;33(2):730–44. doi:10.1109/TFUZZ.2024.3489025. [Google Scholar] [CrossRef]
51. Augsburg data set and Berlin data set for multimodal classification [Internet]. London, UK: Figshare; 2024 [cited 2025 Apr 10]. Available from: https://figshare.com/articles/dataset/28112405. [Google Scholar]
52. Tyust-dayu. Trento dataset [Internet]. San Francisco, CA, USA: GitHub; 2025 [cited 2025 Apr 10]. Available from: https://github.com/tyust-dayu/Trento. [Google Scholar]
53. University of Florida. MUUFL gulfport hyperspectral and LiDAR airborne data set [Internet]. San Francisco, CA, USA: GitHub; 2013 [cited 2025 Apr 10]. Available from: https://github.com/GatorSense/MUUFLGulfport. [Google Scholar]
Cite This Article
 Copyright © 2026 The Author(s). Published by Tech Science Press.
This work is licensed under a Creative Commons Attribution 4.0 International License , which permits unrestricted use, distribution, and reproduction in any medium, provided the original work is properly cited.
 Downloads
 Citation Tools