
 Submit a Paper
 Propose a Special lssue
 Open Access
ARTICLE
Two-Stage LightGBM Framework for Cost-Sensitive Prediction of Impending Failures of Component X in Scania Trucks
Industrial and System Engineering, Kyonggi University, Suwon, 16227, Republic of Korea
* Corresponding Author: Yong Soo Kim. Email:
Computers, Materials & Continua 2026, 86(3), 50 https://doi.org/10.32604/cmc.2025.073492
Received 19 September 2025; Accepted 17 November 2025; Issue published 12 January 2026
 View Full Text
 Download PDF
Abstract
Predictive maintenance (PdM) is vital for ensuring the reliability, safety, and cost efficiency of heavy-duty vehicle fleets. However, real-world sensor data are often highly imbalanced, noisy, and temporally irregular, posing significant challenges to model robustness and deployment. Using multivariate time-series data from Scania trucks, this study proposes a novel PdM framework that integrates efficient feature summarization with cost-sensitive hierarchical classification. First, the proposed last_k_summary method transforms recent operational records into compact statistical and trend-based descriptors while preserving missingness, allowing LightGBM to leverage its inherent split rules without ad-hoc imputation. Then, a two-stage LightGBM framework is developed for fault detection and severity classification: Stage A performs safety-prioritized fault screening (normal vs. fault) with a false-negative-weighted objective, and Stage B refines the detected faults into four severity levels through a cascaded hierarchy of binary classifiers. Under the official cost matrix of the IDA Industrial Challenge, the framework achieves total misclassification costs of 36,113 (validation) and 36,314 (test), outperforming XGBoost and Bi-LSTM by 3.8%–13.5% while maintaining high recall for the safety-critical class (0.83 validation, 0.77 test). These results demonstrate that the proposed approach not only improves predictive accuracy but also provides a practical and deployable PdM solution that reduces maintenance cost, enhances fleet safety, and supports data-driven decision-making in industrial environments.Keywords
The fundamental objectives of vehicle maintenance are to ensure operational safety, maintain fleet availability, and minimize the total cost of ownership (TCO) [1]. Traditional strategies include run-to-failure (reactive) maintenance, where repairs are performed only after a failure occurs, and time-based preventive maintenance, where components are replaced at fixed intervals or mileage thresholds. The former risks unplanned downtime and costly emergency repairs, while the latter ignores the actual degradation state or remaining useful life (RUL) of components, often resulting in unnecessary replacements and over-maintenance [2]. For high-value assets such as heavy-duty fleets, downtime further disrupts logistics operations and regulatory compliance, making it difficult to achieve optimal efficiency through these conventional strategies [3].
To overcome these limitations, predictive maintenance (PdM) has emerged as a data-driven paradigm [4]. PdM utilizes sensor data, diagnostic logs, and operational histories to forecast potential failures in advance, enabling timely and cost-effective interventions [5]. By detecting incipient failures early, PdM reduces downtime and prevents unnecessary maintenance actions, thereby improving both resource allocation and fleet-wide availability.
Despite these advantages, practical PdM implementation remains challenging due to four key issues:
(1) Data imbalance: operational datasets are dominated by normal driving records, while fault samples are scarce, limiting the performance of supervised learning models [6].
(2) Asymmetric cost structure: false negatives (missed detections) are operationally far more costly than false positives (unnecessary inspections), making accuracy alone an inadequate evaluation criterion [7]. This motivates the adoption of application-specific cost matrices, such as those used in the IDA Challenge [8].
(3) Data quality: industrial datasets often contain missing values, distributional drift, and multivariate dependencies, requiring models that are robust to incomplete, noisy, and non-stationary inputs.
(4) Research-practice gap: in real-world operations, decision-making typically focuses on whether intervention is needed rather than identifying the exact root cause. Therefore, distinguishing between normal and imminent-failure states with high recall is the top operational priority [9].
Moreover, accurate detection of incipient failures depends on recognizing subtle warning patterns in recent operational observations. However, real-world logs frequently contain cumulative counters and irregular sampling intervals, which can introduce instability and reduce generalization in end-to-end sequence models [10].
To address these challenges, this study introduces two core innovations. First, the proposed last_k_summary representation compresses the most recent k observations into compact descriptors of statistics, variability, and trend, enabling robust detection of incipient failure signatures under irregular sampling and noisy conditions. Second, a two-stage hierarchical LightGBM framework is developed: Stage A broadly screens potential faults, and Stage B refines severity categorization according to asymmetric risk levels. By integrating last_k_summary with hierarchical decision-making, the proposed framework aligns model behavior with cost asymmetry and operational priorities, providing an effective and computationally efficient PdM solution.
The main contributions of this study are summarized as follows:
(1) We propose the last_k_summary feature engineering method, which condenses the most recent k observations into statistical descriptors of trend, variability, and volatility, enabling direct detection of incipient failures without complex sequence modeling.
(2) Based on this representation, we design a two-stage hierarchical LightGBM classifier in which Stage A broadly identifies fault candidates and Stage B refines severity categorization, achieving high recall for incipient failures while reducing total operational cost.
(3) We align model training, threshold optimization, and evaluation with the official cost-matrix protocol defined in the IDA Challenge, ensuring fair and operationally meaningful benchmarking under the competition-standard metric.
The remainder of this paper is organized as follows. Section 2 reviews related work. Section 3 presents the proposed methodology, including feature construction and hierarchical model design. Section 4 reports experimental results using the Scania Component X dataset and compares performance against existing approaches. Section 5 discusses limitations and implications, focusing on cost asymmetry and dataset imbalance. Finally, Section 6 concludes the study and outlines directions for future research.
With the advent of Industry 4.0, industrial assets have become increasingly integrated with IoT and big data technologies, accelerating digitalization, connectivity, and intelligence. This integration has enabled the large-scale collection of operational data, including sensor signals, load conditions, event logs, alarms, and repair histories [11]. When systematically processed and analyzed, such multidimensional data provide critical insights into equipment health, supporting both accurate diagnostics and reliable prediction of maintenance timing.
As a result, data-driven maintenance strategies are widely recognized as effective for reducing unnecessary interventions, improving operational efficiency, preventing unplanned downtime, enhancing worker safety, and extending the service life of mission-critical components [12,13]. These advantages have made data-centric approaches indispensable in modern industrial environments, where operational continuity and cost efficiency are regarded as primary priorities.
Within this transformation, Condition Monitoring (CM) has attracted significant attention as an essential precursor to predictive strategies [14]. Qi et al. [15] reviewed time-series signal-based CM approaches and highlighted that Fourier and Wavelet Transform techniques, combined with feature extraction and selection methods, are effective tools for assessing the condition of diverse industrial machinery. Marti-Puig et al. [16] further demonstrated the feasibility of AI-driven CM in manufacturing systems through a case study on wooden-piece production, which showcased real-time anomaly detection and improved maintenance efficiency.
These CM studies demonstrated the potential of monitoring techniques to support maintenance decisions and provided a solid foundation for the evolution of Predictive Maintenance (PdM), particularly with the emergence of Machine Learning (ML) and Deep Learning (DL) methods that enable automated and adaptive modeling of complex data sources.
2.1 Machine Learning-Based PdM Research
In the early stages of data-driven maintenance, ML techniques were widely adopted due to their interpretability, modest data requirements, and proven success in fault classification. Kusumaningrum et al. [17] developed a PdM framework using real-time multisensory streams in a smart manufacturing environment, comparing Support Vector Machines (SVM) and Random Forest (RF). Their findings revealed that RF consistently outperformed SVM in both diagnostics and fault prediction accuracy, illustrating the strength of ensemble learning for heterogeneous sensor data.
Arena et al. [18] conducted a systematic review of PdM research in the automotive sector, identifying how statistical inference, probabilistic reasoning, and classical ML techniques (e.g., logistic regression, SVM, and k-Nearest Neighbors) have been applied in engine and electrical system fault detection. Vollert et al. [19] broadened this perspective through a cross-industry survey, outlining persistent challenges such as the scarcity of labeled datasets, the reliance on supervised learning, the limited interpretability of complex models, and the need for multi-source data fusion.
Building on this foundation, Ansari et al. [20] introduced PriMa, a knowledge-based ML framework that integrates text-based fault histories with predictive analytics, recommender systems, and visualization dashboards. Their architecture addressed challenges such as feature engineering, cost sensitivity, and class imbalance, aligning more closely with industrial deployment requirements.
Collectively, these studies illustrate the versatility of ML approaches for PdM but also highlight key limitations, including shallow feature representation, dependence on handcrafted feature engineering, and limited robustness under irregular and noisy industrial conditions.
2.2 Deep Learning-Based PdM Research
With the rapid advancement of Industry 4.0, DL approaches have emerged as transformative tools for PdM, offering powerful representation-learning capabilities and the ability to model high-dimensional, complex, and nonlinear time-series data. Li et al. [21] comprehensively reviewed over 249 PdM studies, categorizing representative DL architectures such as DNNs, CNNs, SAEs, DBNs, and DRNNs, and outlining their strengths, domains of application, and trade-offs to guide model selection.
Deng and Zhou [22] advanced this line of research by combining CNN-based feature extraction, LSTM-based temporal dependency learning, and an attention mechanism into a CNN-LSTM-Attention model for aircraft engine RUL prediction. Their results demonstrated superior performance in capturing both long-term and short-term dependencies, highlighting the value of hybrid architectures for dynamic temporal signals.
Serradilla et al. [23] further analyzed recent DL models for PdM, comparing architectures, benchmarking performance, and evaluating their applicability across different PdM stages. Cummins et al. [24] focused on Explainable Predictive Maintenance (XPM) and reviewed how SHAP, LIME, and Grad-CAM can be integrated into PdM workflows. They emphasized that explainability is essential for fostering operator trust, ensuring transparency, and enabling informed decision-making in safety-critical industrial systems.
While DL offers significant promise, persistent challenges remain, such as the scarcity of fault-specific data, the high computational cost of training and deployment, the black-box nature of deep models, and the limited transferability of learned representations across heterogeneous fleets and operational contexts.
2.3 Research on Scania Component X and the IDA 2024 Industrial Challenge
In recent years, research has increasingly focused on domain-specific datasets that closely mirror industrial conditions. Among them, the Scania Component X dataset, derived from large-scale fleet operations, has been widely utilized in the IDA 2024 Industrial Challenge, which defined impending-failure classification and cost-sensitive evaluation as benchmark tasks.
Parton et al. [25] leveraged path-signature and visibility-graph transformations of time-series data, applying Graph Neural Networks (GNNs) to capture inter-sensor dependencies. Yang and Iqbal [26] extracted sliding-window features using the tsfresh library and benchmarked ML models such as XGBoost and Random Forest. By adopting survival regression (XGBoost-AFT) and contextual clustering based on vehicle specifications, they improved predictive accuracy under cost-sensitive protocols.
Dimidov et al. [27] assumed monotonic degradation patterns in Component X and developed a simplified PdM framework using tabular ML models. Their AutoML-based pipeline reduced development complexity and achieved lower operational cost than baseline methods. More recently, Zhong and Wang [28] evaluated multiple DL architectures—including MLP, CNN, ResNet18, Bi-LSTM, and Bi-LSTM-Attention—on Component X data. Their workflow combined correlation-based feature reduction, imputation, normalization, padding, and data augmentation, while mitigating class imbalance with weighted sampling. Their results showed that CNN achieved the highest statistical accuracy but incurred high operational costs, whereas RNN-based models achieved lower accuracy but better cost efficiency. They concluded that PdM solutions must explicitly account for asymmetric cost structures rather than focusing solely on statistical accuracy to ensure operational viability.
Although both ML-based and DL-based approaches have made substantial progress, significant challenges remain in deploying PdM systems in complex industrial environments. A major difficulty lies in minimizing operational cost while ensuring reliable detection of severe failures. Furthermore, industrial constraints such as cost asymmetry, class imbalance, irregular sampling, and noisy sensor data are not consistently addressed in algorithmic design. These limitations restrict the practical adoption of PdM in fleet operations, where decision-making must balance cost efficiency, operational reliability, and user trust.
To address these challenges, the present study develops a compact, trend-oriented feature representation, termed last_k_summary, which efficiently captures degradation patterns from recent operational cycles without relying on complex sequential architectures. Based on this representation, a two-stage LightGBM framework is designed to separate fault detection (Stage A) from severity classification (Stage B), ensuring cost-sensitive decision-making across heterogeneous operating conditions.
By combining lightweight feature summarization with hierarchical classification, the proposed framework achieves a strong balance between accuracy, interpretability, and deployability. This design simultaneously enhances cost efficiency and fault detection reliability, providing a practical and data-driven solution for real-world predictive maintenance of heavy-duty fleets.
This section presents the methodology adopted in this study. First, we introduce the dataset employed in the IDA 2024 Industrial Challenge, including the formal definition of the problem, dataset composition, and the cost-matrix-based evaluation criterion. We then describe the preprocessing procedures that transform multivariate time-series signals into vehicle-level tabular representations. Finally, we detail the proposed hierarchical LightGBM framework, which is specifically designed to address the requirements of cost-sensitive impending-failures prediction. An overview of the framework is depicted in Fig. 1.
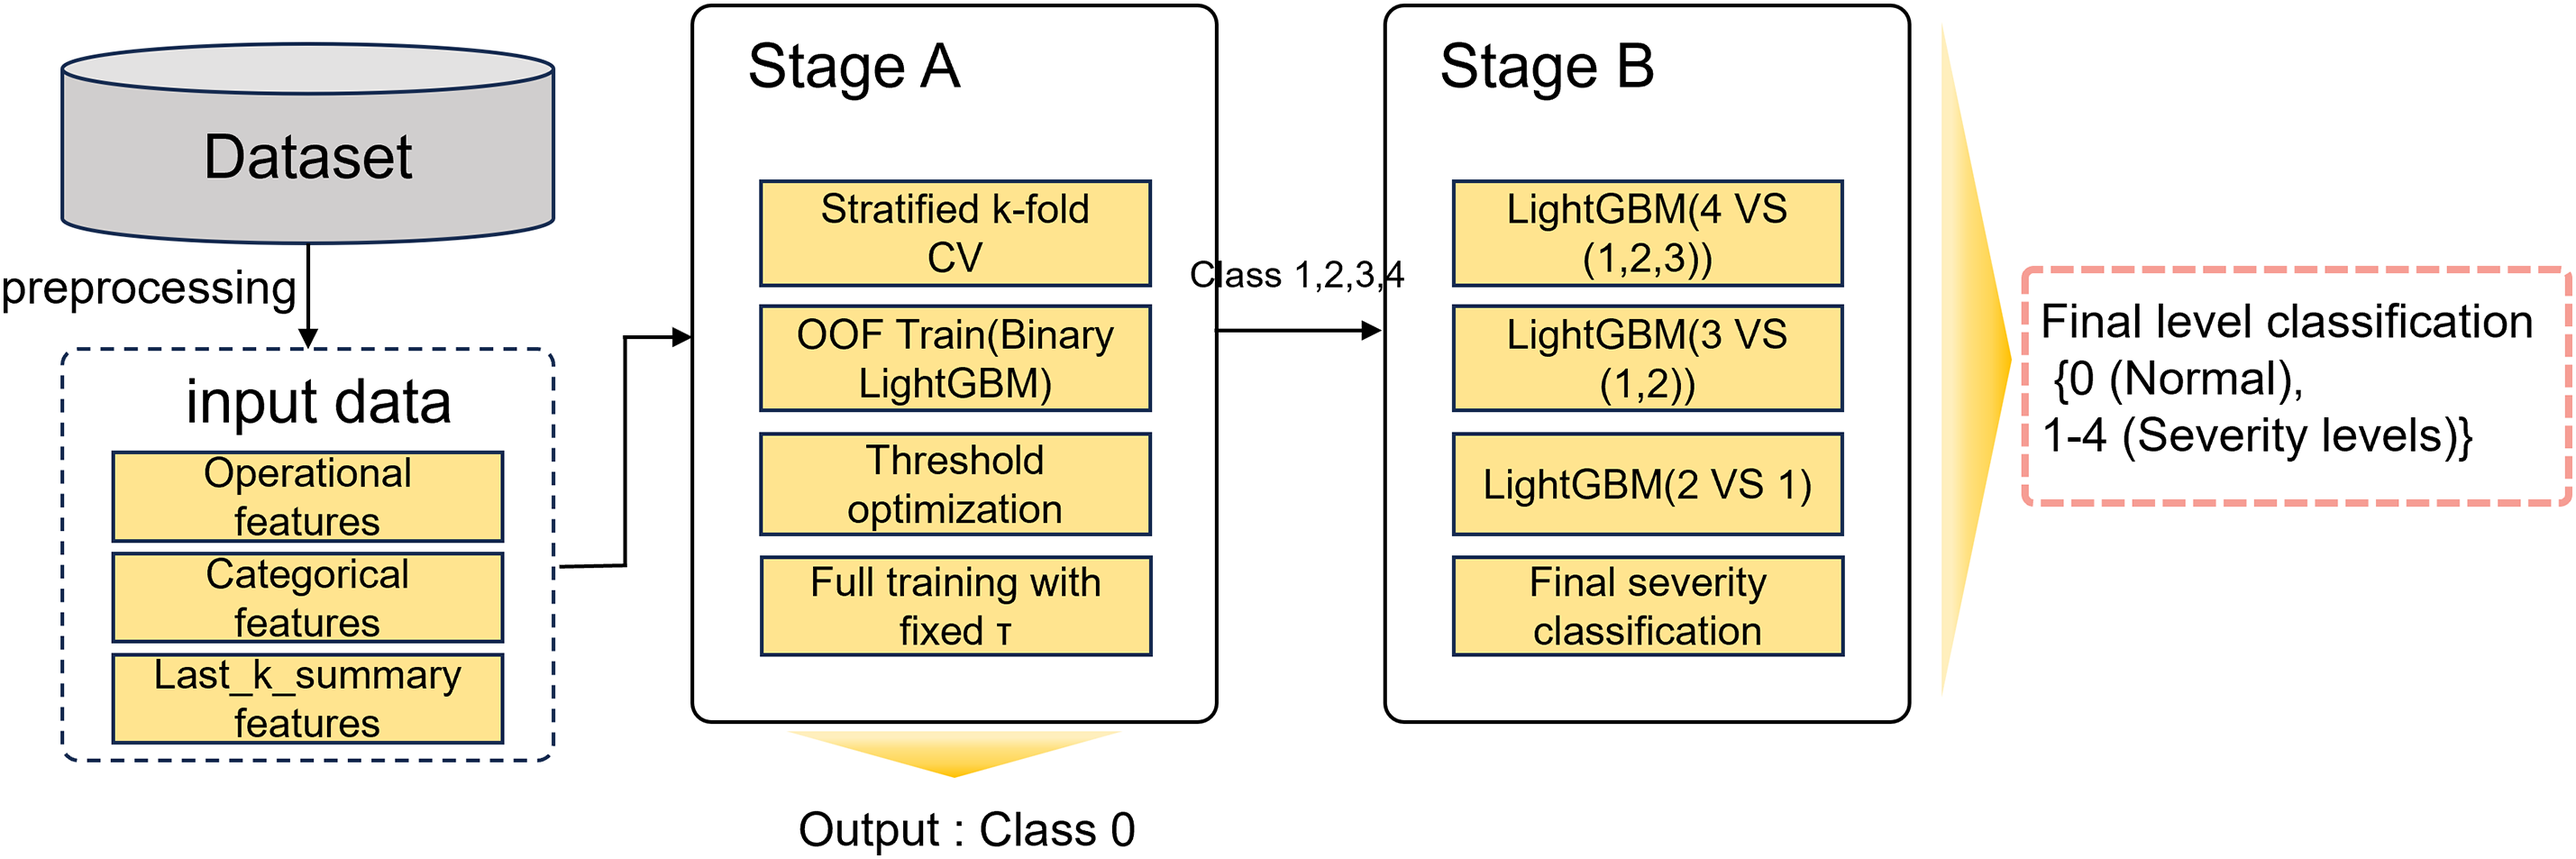
Figure 1: Overview of the proposed two-stage LightGBM framework
3.1 IDA 2024 Challenge Dataset
We consider a fleet of vehicles
Each observation at time step
Based on this formulation, we utilize the Scania Component X dataset, released in the IDA Industrial Challenge 2024 [29]. This dataset contains real-world multivariate time-series collected from 33,641 heavy-duty trucks, split into training (70%, 23,550 vehicles), validation (15%, 5046 vehicles), and test (15%, 5045 vehicles) sets. It is composed of three parts:
(1) Vehicle specifications: eight categorical variables (Spec_0–Spec_7), including engine type, wheel configuration, and other static attributes.
(2) Time-to-event information: labels on whether Component X failed during the study period (in_study_repair) and the time index of repair (length_of_study_time_step). These are provided only for training; validation and test sets contain only the final class label.
(3) Operational readouts: 107 time-series variables, divided into two categories. Single-counter features are cumulative and typically monotonically increasing. Histogram-based features represent frequency distributions of operational ranges. Although post-processed to be monotonic non-decreasing, the raw signals still contain transient glitches and occasional cumulative downward steps due to sensor and telemetry artifacts.
In addition, the dataset is characterized by a pronounced class imbalance, as shown in Fig. 2. While the majority of vehicles belong to class 0 (normal), classes 1–3 are extremely sparse, and class 4 remains underrepresented relative to class 0. This imbalance presents a significant challenge for supervised learning.
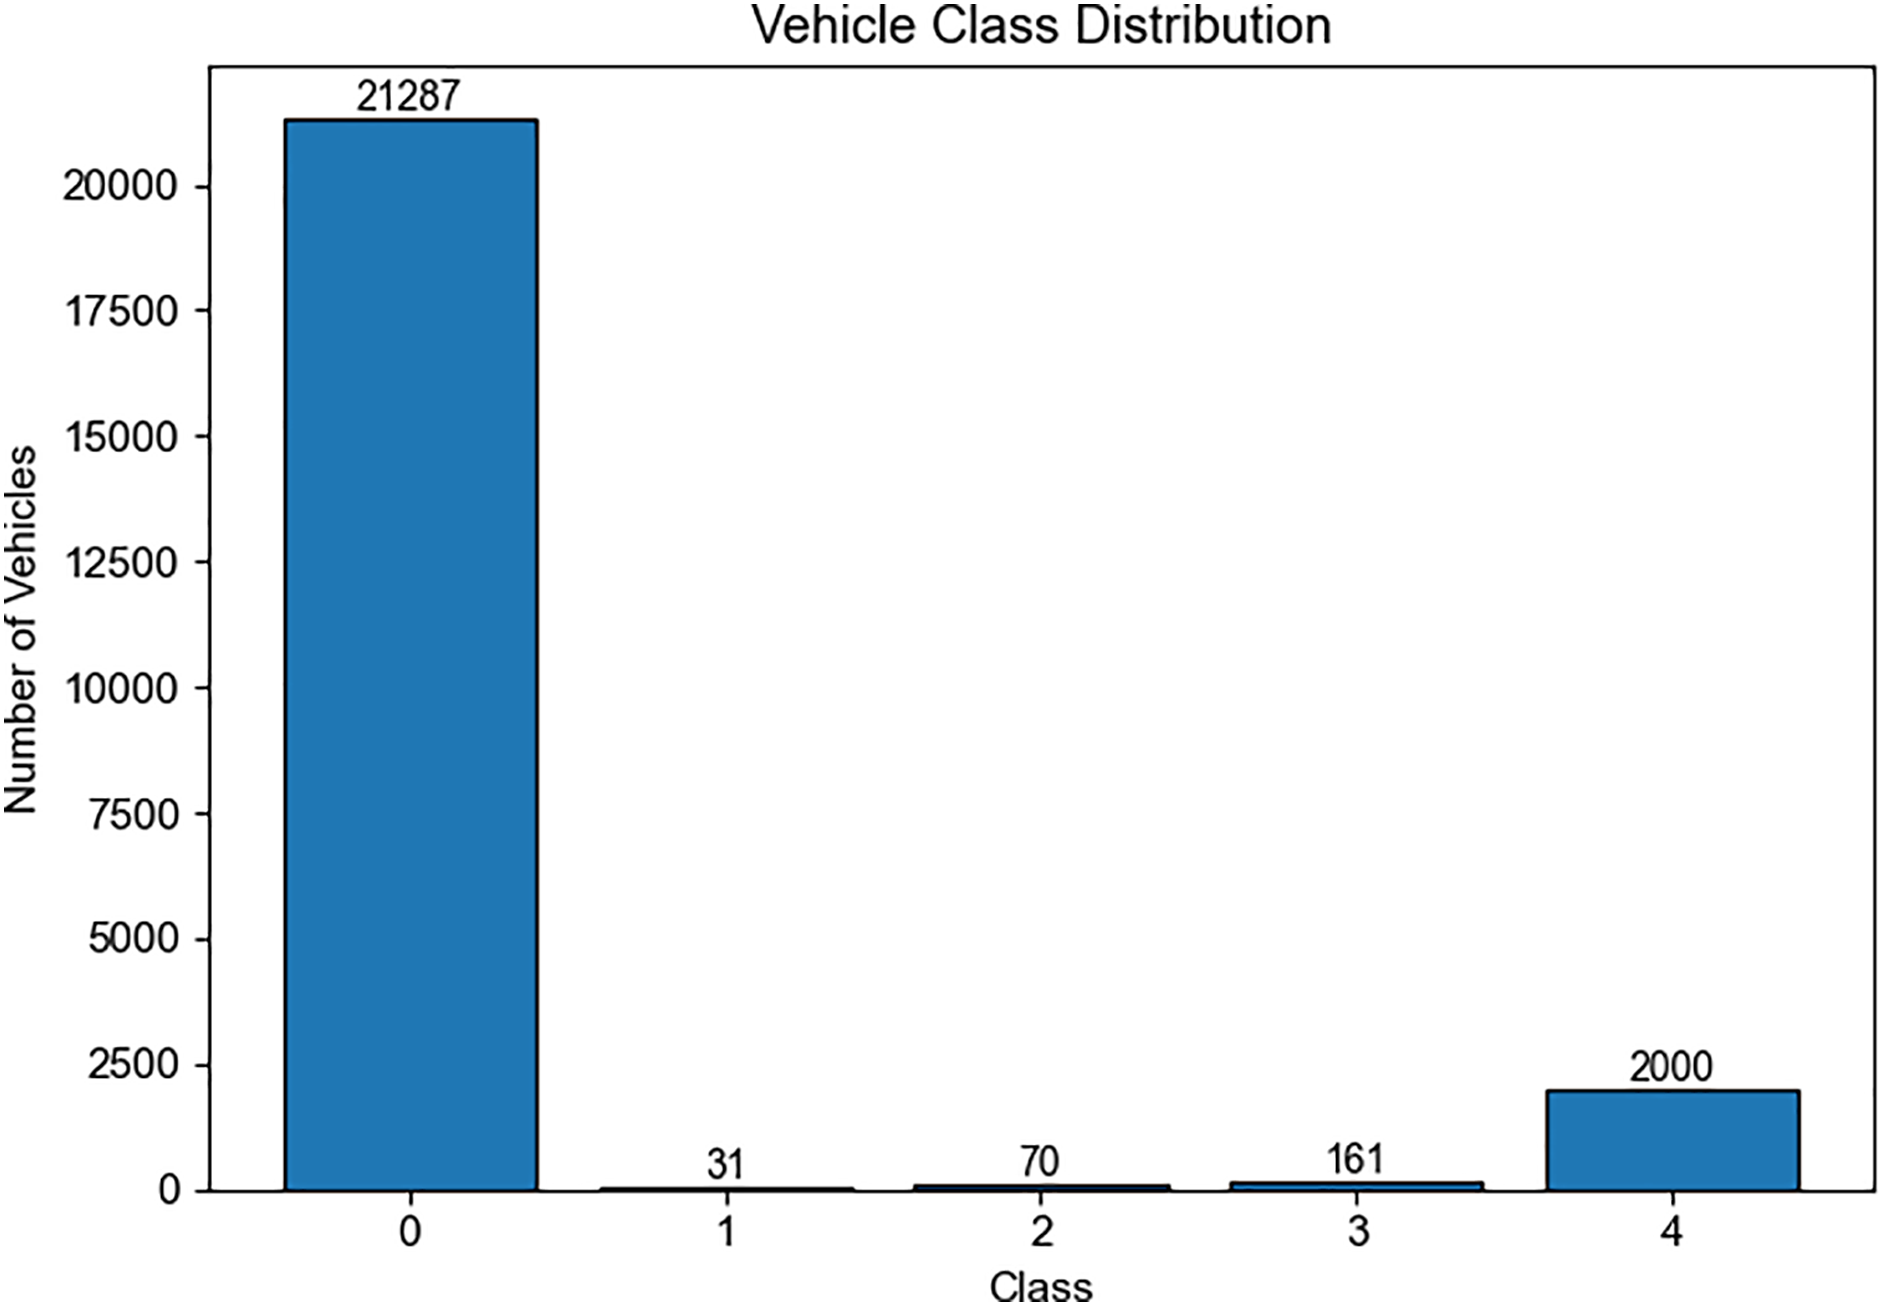
Figure 2: Class imbalance in the training dataset
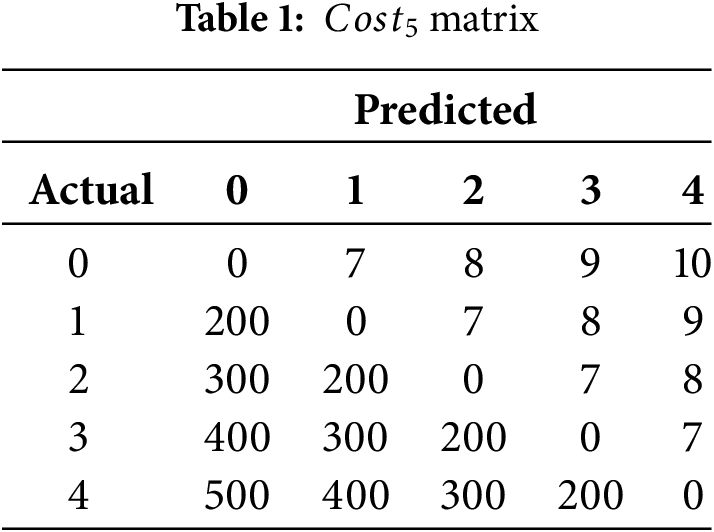
Unlike conventional classification tasks, the challenge employs a cost-sensitive evaluation metric in which each misclassification is assigned a penalty depending on the actual and predicted severity classes. In particular, false negatives, which correspond to predicting class 0 (normal) when the true class is 4 (impending failure), incur the heaviest penalty. The overall cost is then defined as:
When
To construct vehicle-level training data, we integrated three major sources: class labels, operational readouts, and vehicle specifications. The operational readouts are time-series with multiple observations per vehicle. To align these, all signals were merged with vehicle specifications, using the final class label as the reference. Categorical variables were normalized to maintain consistency across training and validation sets.
Missing values accounted for less than 1% of the entire dataset, indicating that their occurrence was relatively limited. rather than applying external imputation or aggregation techniques, we leveraged LightGBM’s inherent capability to handle missing values through dedicated split rules. This design choice preserved the authenticity of the raw telemetry while avoiding potential distortions or artificial discontinuities that may arise from manual preprocessing.
To convert sequences into fixed-length vectors, we employed the last_k_summary method. For each vehicle, the most recent k = 20 observations were extracted, and a variety of statistical and trend-based descriptors were computed. These included basic statistics (mean, standard deviation, minimum, maximum), trend measures (ordinary least-squares slope, robust slope via Theil-Sen estimator, exponentially weighted slope, slope differences between first and second halves), as well as change indicators (deltas and ratios between the first and last observations). The resulting single-row representation per vehicle was concatenated with encoded specifications, yielding the final tabular input for model training. The detailed procedure for constructing these features is presented in Algorithm 1.
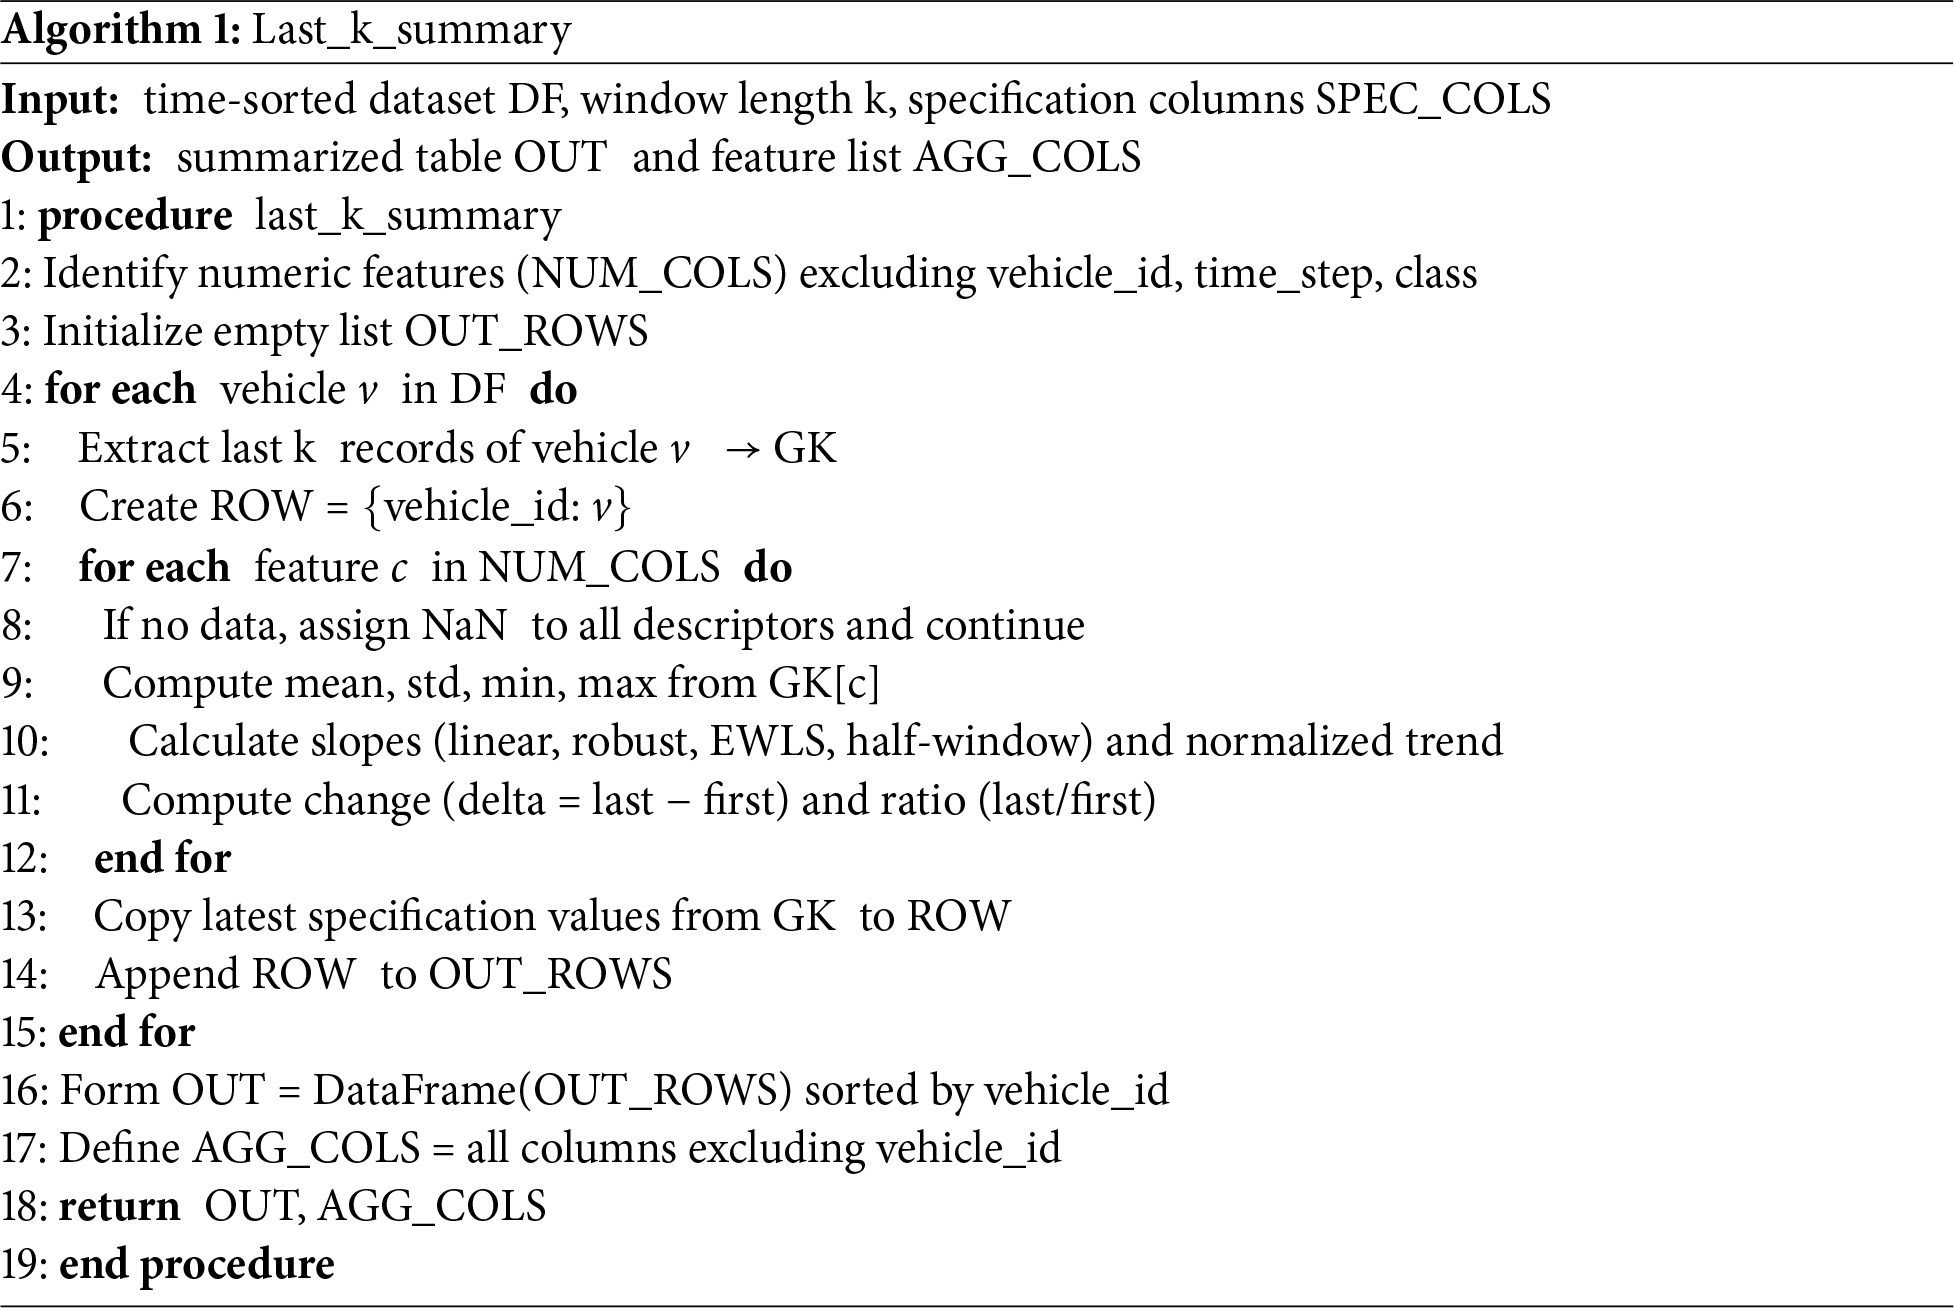
This procedure summarizes the most recent k readings of each numeric signal into a single vehicle-level record, providing a compact yet information-rich representation for subsequent LightGBM modeling. The rationale for adopting the last_k_summary representation is twofold. First, impending-failure signatures are more likely to emerge toward the end of a vehicle’s operational trajectory, and emphasizing the most recent k observations therefore enhances sensitivity to degradation signals. Second, decision tree-based models such as LightGBM are inherently more effective with fixed-dimensional tabular inputs than with raw temporal sequences. In particular, tree ensembles partition the feature space by recursively selecting split points that yield the greatest reduction in loss. Providing multiple aggregated features through last_k_summary enables the model to explore diverse partitioning paths, thereby improving predictive accuracy and interpretability under cost-sensitive conditions. This transformation not only aligns with the inductive bias of LightGBM but also reinforces its ability to capture degradation-relevant structures in high dimensional feature space.
The choice of k = 20 reflects both the empirical distribution of sequence lengths and operational considerations. As shown in Fig. 3, sequence lengths are concentrated in the shorter range (0–40 observations), and very long histories are relatively rare. To avoid excluding vehicles with shorter histories, we summarize the last min (Ti, 20) observations for each vehicle; when Ti < 20, all available records are used without artificial padding.
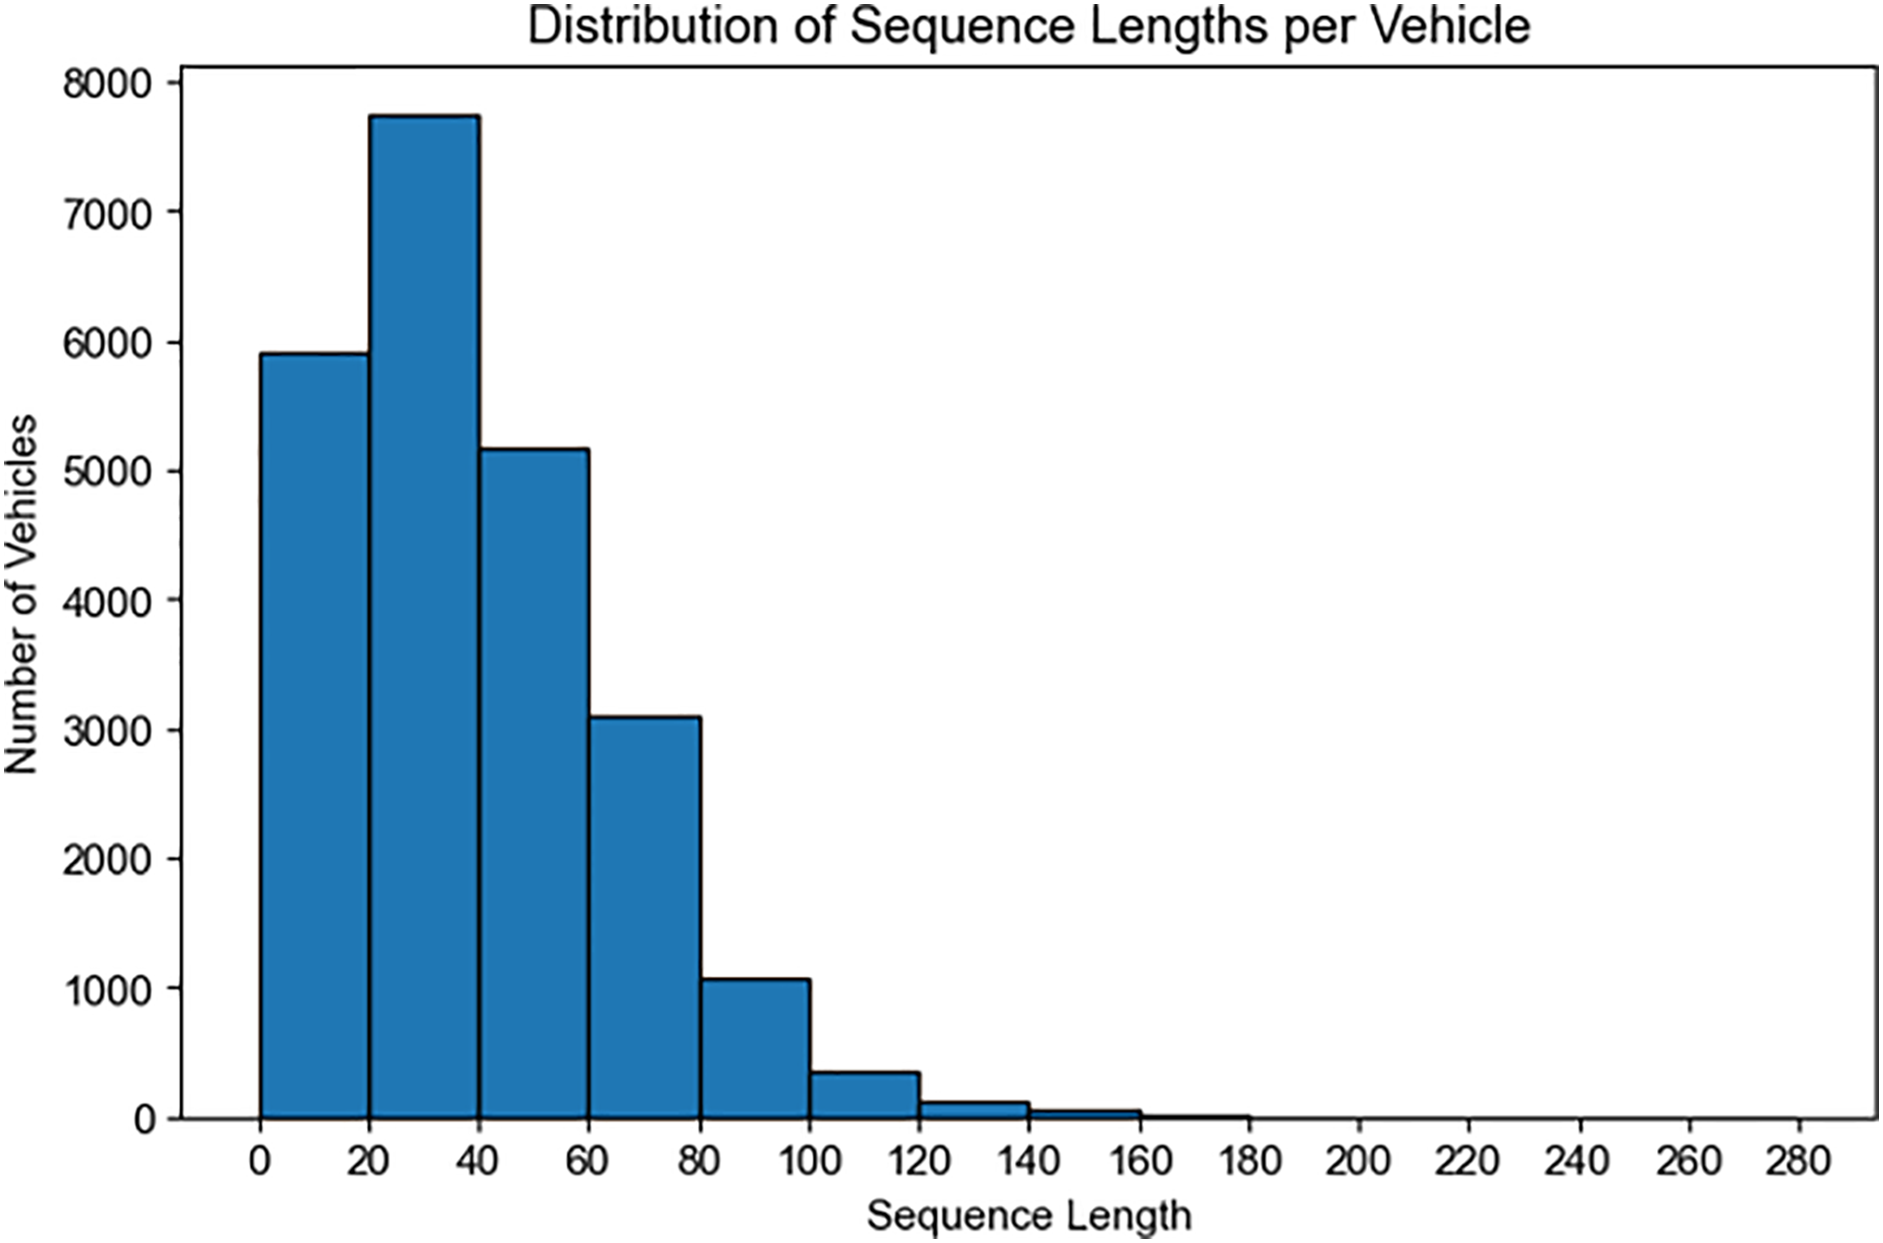
Figure 3: Distribution of sequence lengths in Scania dataset
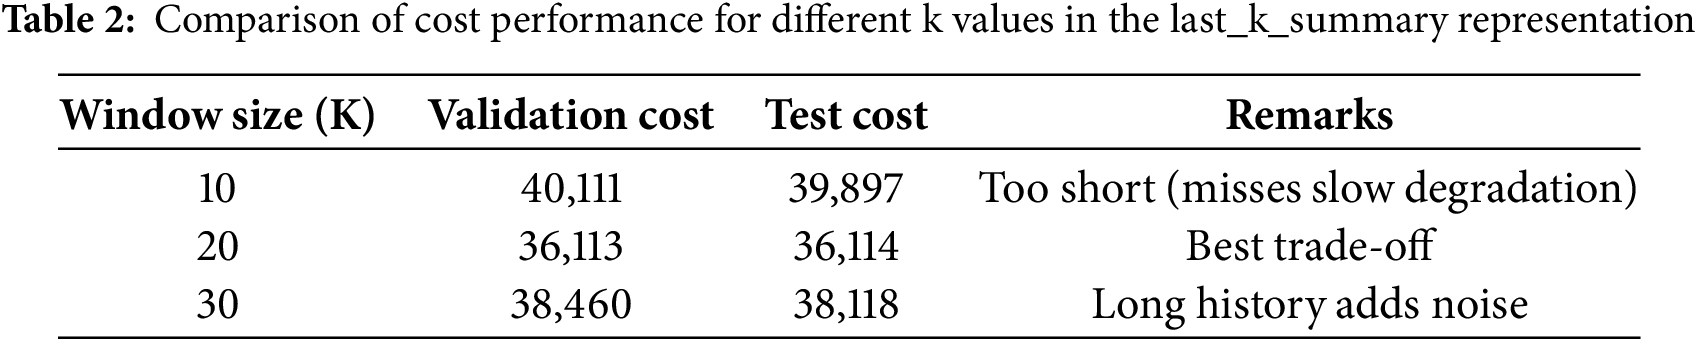
To further validate the choice of k, we compared performance under three settings (k = 10, 20, 30) using the total operational cost (Cost5) as the primary evaluation metric. As summarized in Table 2, the configuration k = 20 achieved the lowest validation and test costs, indicating the best trade-off between responsiveness to degradation trends and robustness against noise. Smaller windows (k = 10) tended to miss gradual degradation cues, while larger windows (k = 30) diluted recent fault-relevant information with redundant history. Therefore, k = 20 was adopted as the default configuration for all subsequent experiments.
Formally, let N denote the number of vehicles and K the number of features derived from last_k_summary and specifications. The dataset can be expressed as:
where each row vector
Equivalently, the dataset can be represented in expanded form as:
Considering the inherent class imbalance and the cost-sensitive evaluation protocol of the Scania Component X dataset, this study proposes a hierarchical Two-stage LightGBM framework tailored for impending-failure prediction. The framework is designed to satisfy two competing requirements by ensuring that impending failures are not overlooked and by simultaneously reducing the overall operational cost.
In Stage A, a binary LightGBM classifier distinguishes normal vehicles (class 0) from faulty vehicles (classes 1–4). The primary objective of this stage is to maximize recall for faulty samples, thereby minimizing false negatives that would otherwise incur prohibitive penalties under the cost-matrix protocol. In Stage B, only vehicles flagged as faulty are further categorized into severity levels (classes 1–4) through a cascaded binary structure. This decomposition alleviates the difficulties of direct multi-class classification under severe class imbalance while refining predictions in a cost-aware manner. In this design, Stage A prioritizes the detection of risky vehicles, whereas Stage B provides fine-grained severity classification to support adaptive maintenance decisions.
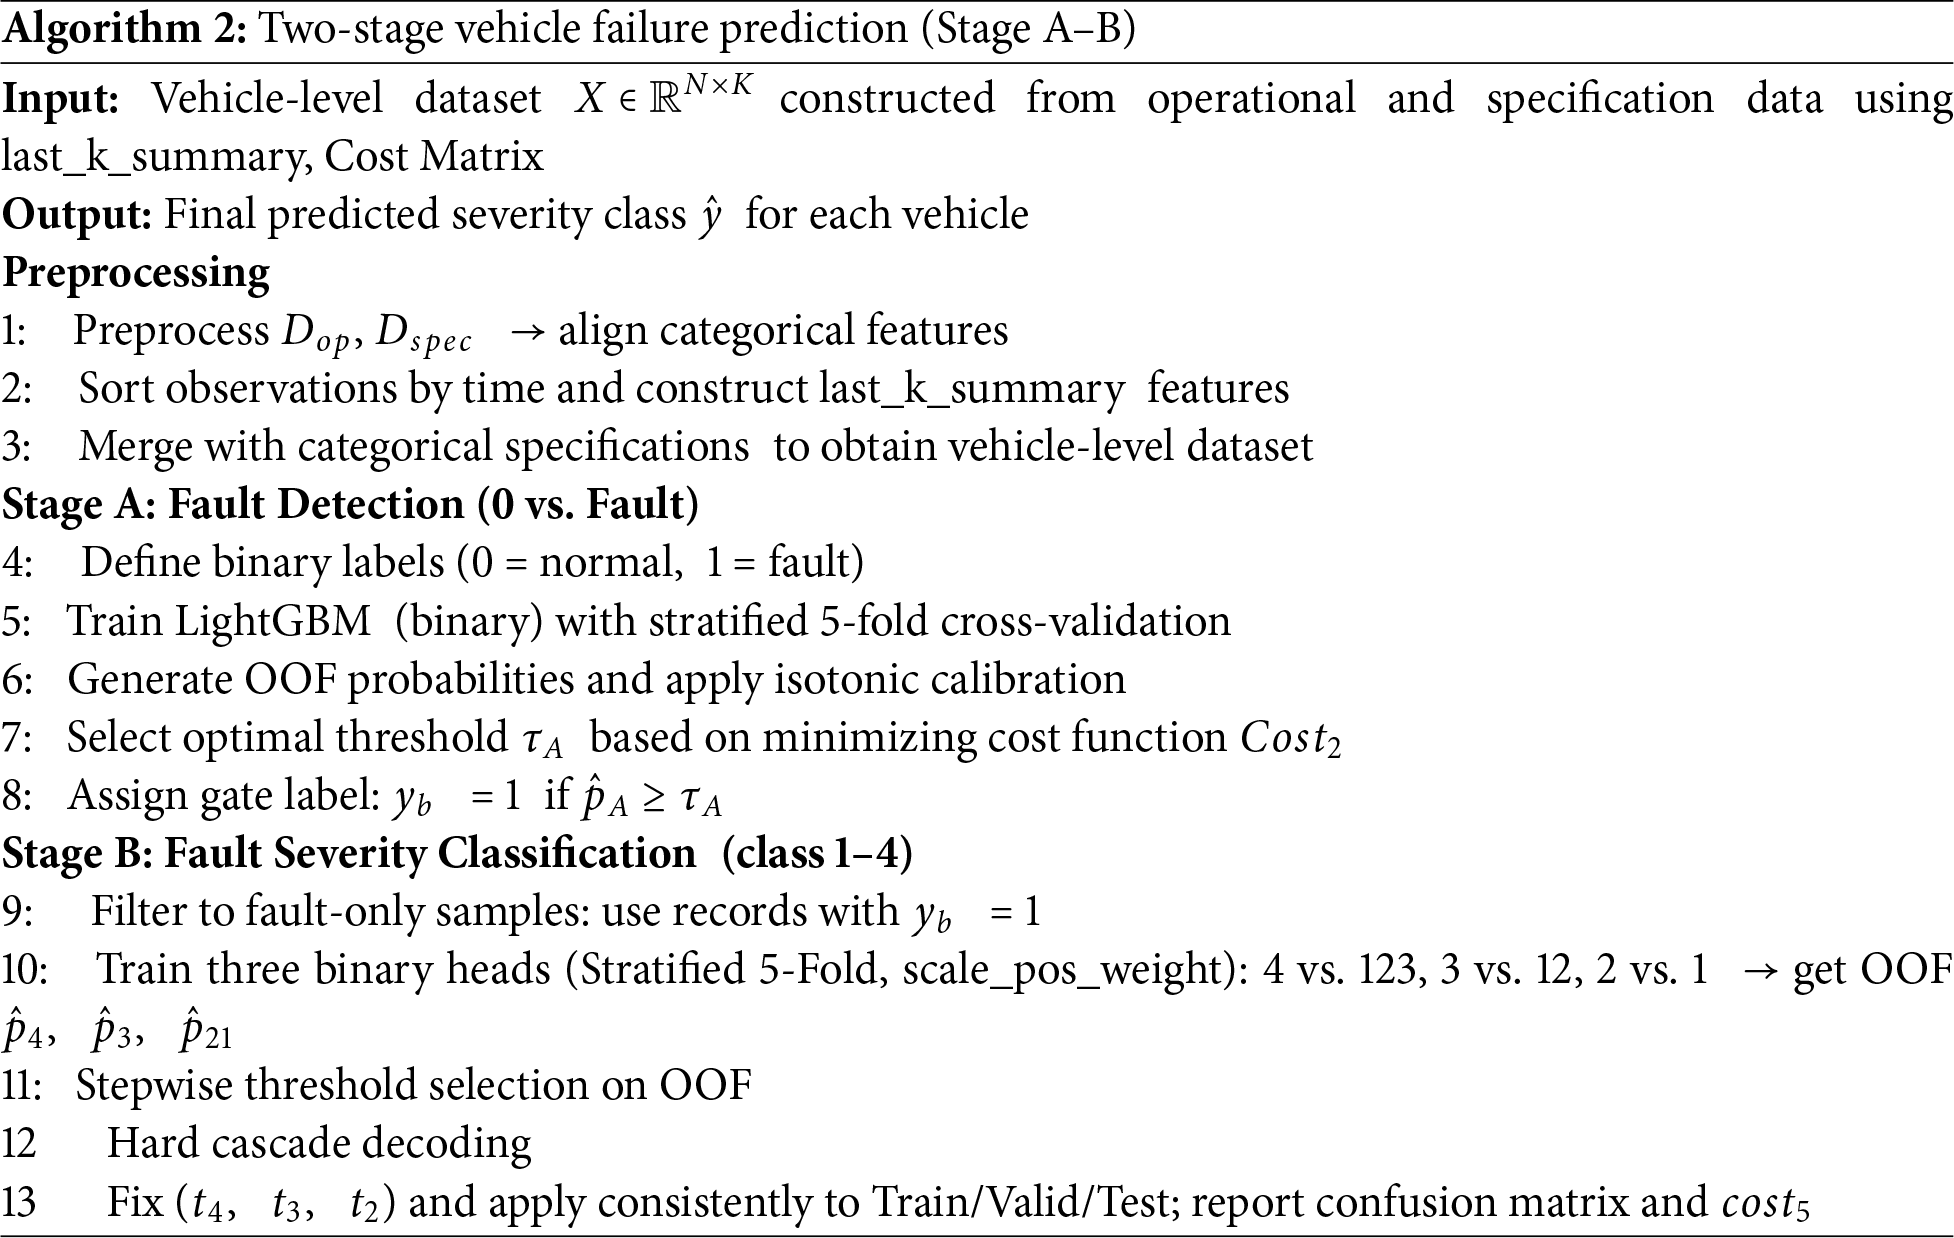
The overall procedure is summarized in Algorithm 2. Preprocessing aligns operational and specification data and constructs last_k_summary features. Stage A performs binary fault detection with calibrated probabilities and an optimized threshold selected under a cost-sensitive objective. Stage B then applies a series of binary heads (4 vs. 123, 3 vs. 12, 2 vs. 1), each trained with stratified folds and class weights, followed by threshold selection via grid search. The cascaded decoding process assigns the final severity level according to the hierarchical sequence.
LightGBM [30] is an advanced implementation of gradient boosted decision trees (GBDT), specifically designed for efficiency and scalability on high-dimensional and large-scale datasets. Similar to other boosting frameworks, LightGBM builds an ensemble of weak learners (CART tress), and the prediction for sample
where
where T is the number of leaves,
LightGBM introduces three key innovations to enhance performance compared to other GBDT implementations.
• Histogram-Based Learning: Instead of sorting raw data to find split points, feature values are discretized into histogram bins, significantly reducing computation and memory usage.
• Gradient-Based One-Side Sampling (GOSS): Samples with large gradients (high prediction errors) are retained, while a subset of small-gradient samples are randomly discarded, accelerating training with minimal information loss.
• Exclusive Feature Bundling (EFB): Sparse and mutually exclusive features are bundled together, reducing dimensionality and improving cache efficiency.
These optimizations allow LightGBM to achieve faster training and better memory efficiency while maintaining competitive predictive accuracy compared to other GBDT-based algorithms.
3.3.2 Stage A: Fault Detection (0 vs. Fault)
Stage A is formulated as a binary classification task that separates normal vehicles (class 0) from faulty vehicles (classes 1–4). The design objective is to maximize recall, thereby reducing the likelihood of overlooking faulty cases.
Training data were partitioned using stratified 5-fold cross-validation to preserve class distribution across folds. Out-of-fold (OOF) probabilities were generated and used for threshold selection to prevent data leakage. Final evaluation on the validation set was conducted only once after threshold decision had been completed.
The classifier is implemented using LightGBM and trained with weighted binary cross-entropy loss:
where
where
The binary decision rule is defined as:
where
where
3.3.3 Stage B: Fault Severity Classification (Class 1–4)
Stage B assigns each vehicle identified as faulty in Stage A to one of four severity levels using a cascaded binary classification framework. The architecture consists of three sequential heads: the first head separates class 4 from {1, 2, 3}, the second head separate class 3 from {1, 2}, and the final head distinguishes class 2 from class 1. Through this hierarchical sequence, each faulty vehicle is ultimately assigned to one of the four severity classes. By prioritizing the separation of the most severe failures, the framework ensures that high-risk cases are identified at an early stage, thereby aligning the classification process with the asymmetric cost structure. This design effectively reduces the overall operational cost while maintaining granularity in fault severity classification.
Each head is independently trained with binary cross-entropy loss:
where
To mitigate class imbalance, LightGBM’s weighting parameter is applied as:
where
This scaling ensures that minority (positive) classes are adequately represented during training by up-weighting their loss contribution. After training, out-of-fold (OOF) predictions are used to determine head-specific thresholds
where
With chain-consistent scores defined as:
where
3.3.4 Hyperparameter Optimization
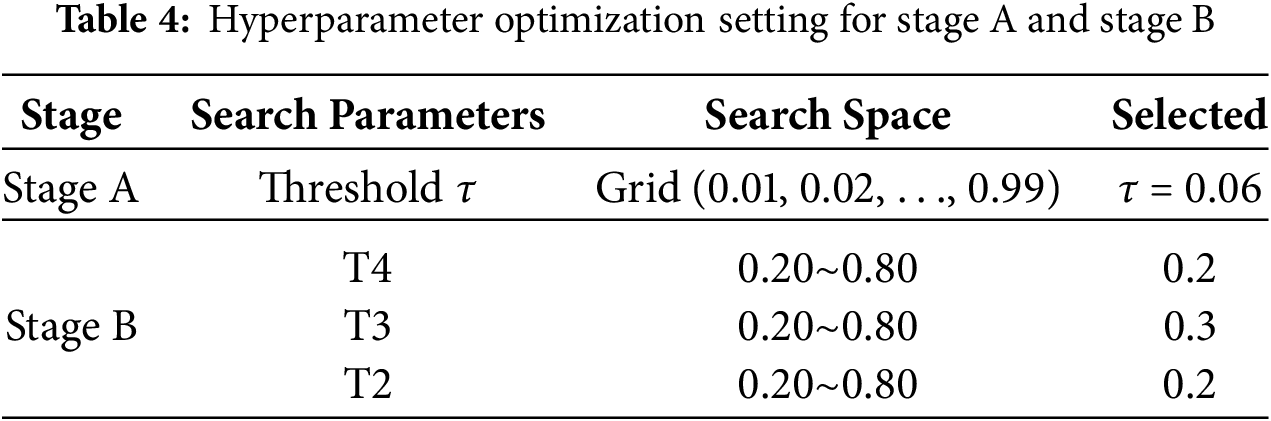
Separate hyperparameter optimization strategies were employed for Stage A and Stage B. For Stage A, the threshold τ was selected via grid search (0.01–0.99) using OOF probabilities from stratified five-fold cross-validation. The objective was to minimize
1.
2. Given the selected
3. With
This hierarchical optimization reflects the asymmetric importance of classes, prioritizing severe failures (classes 4 and 3) before milder ones. The detailed search ranges and selected threshold values for both stages are summarized in Table 4. The thresholds derived from OOF training folds were then fixed and applied consistently across training, validation, and test sets, ensuring fair comparison and robustness.
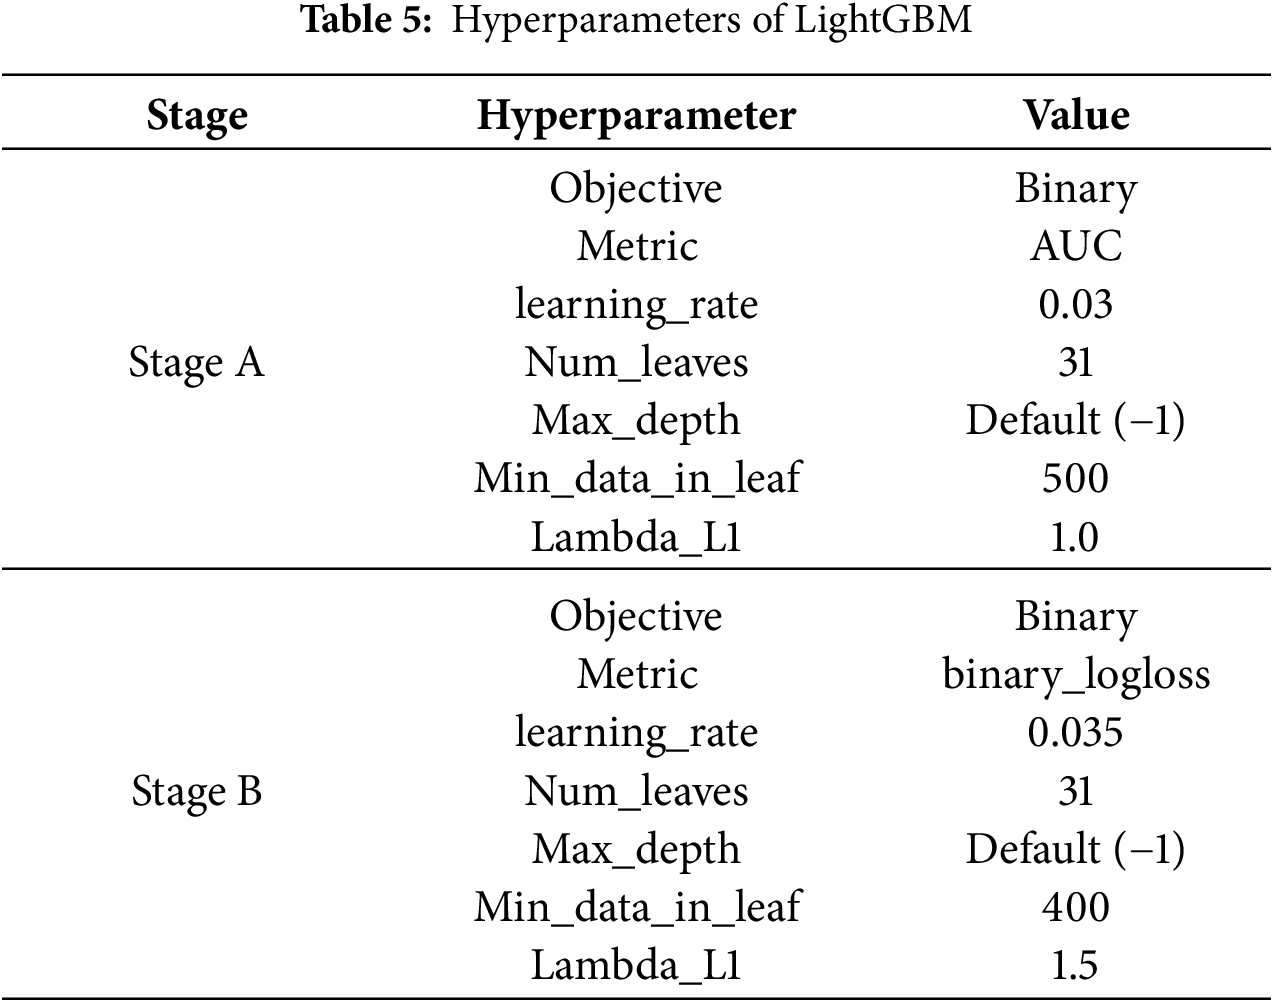
Based on the findings of related literature on tree-based models, most LightGBM hyperparameters were kept at their default settings. A small pilot search was conducted only for a few parameters considered to have significant influence on model performance, such as learning rate, min_data_in_leaf, and regularization terms. The final hyperparameter configurations for Stage A and Stage B are summarized in Table 5.
The performance of the proposed Two-stage LightGBM framework was evaluated on the Scania Component X dataset using the official
Beyond cost minimization, evaluation also emphasized model robustness across data partitions, as high variability between validation and test results would undermine real-world applicability. In addition, class-specific recall, particularly for the most critical class (class 4), was prioritized to verify that the model did not sacrifice safety for cost reduction. These considerations ensured that the evaluation design was consistent with operational priorities in predictive maintenance.
4.1 Validation and Test Data Evaluation
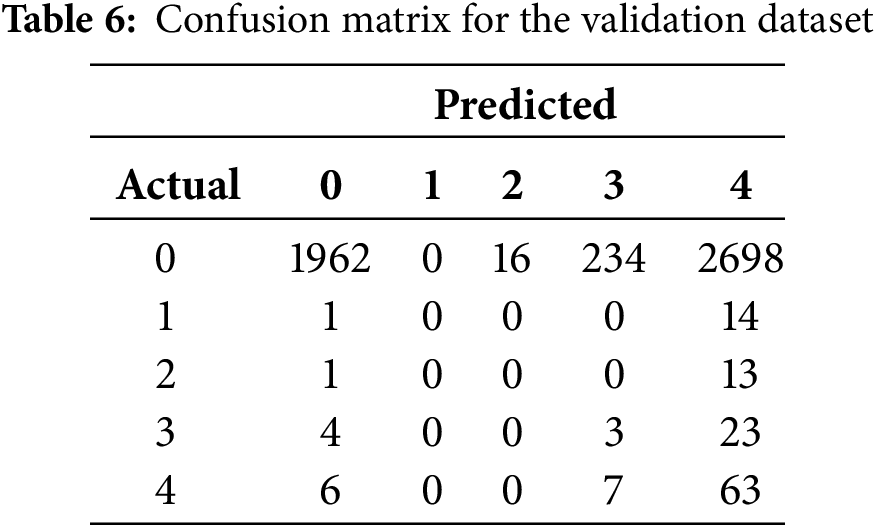
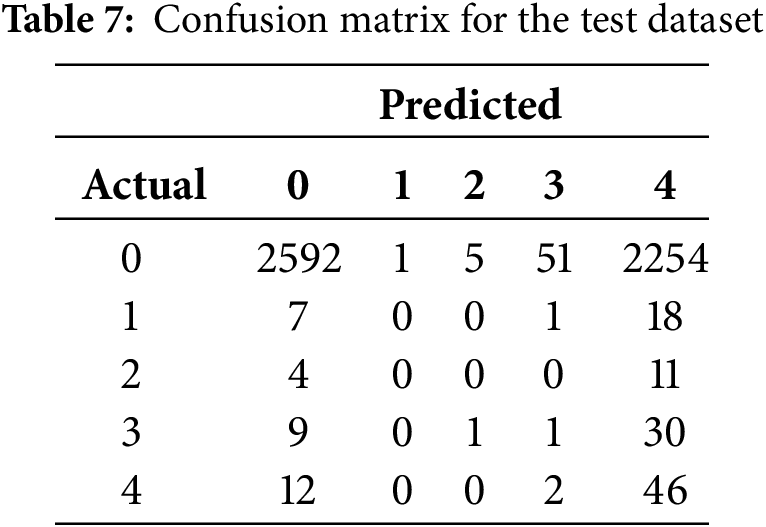
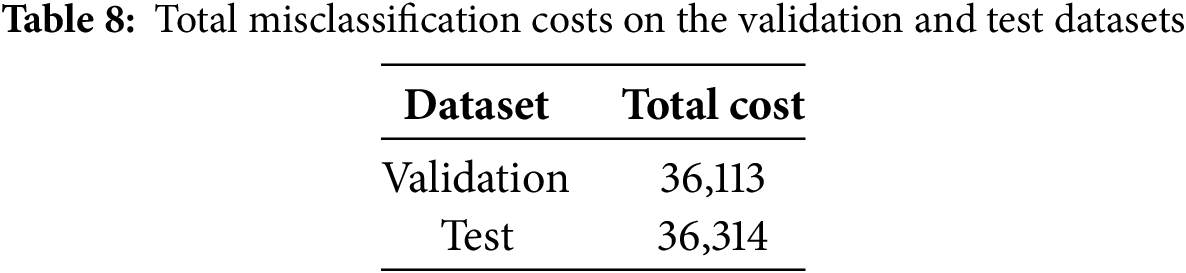
The framework exhibited consistent performance across both validation and test datasets. As shown in Tables 6 and 7, the confusion matrices indicate that the model preserved high recall for class 4 (impending failure), achieving 0.83 on validation and 0.77 on test, while simultaneously reducing overall cost. The total misclassification costs are summarized in Table 8, where the proposed model achieved 36,113 on validation and 36,314 on test. These results demonstrate that the framework effectively satisfied the dual objective of predictive maintenance: minimizing missed detections of high-risk vehicles while controlling maintenance cost.
4.2 Comparison with Other Research
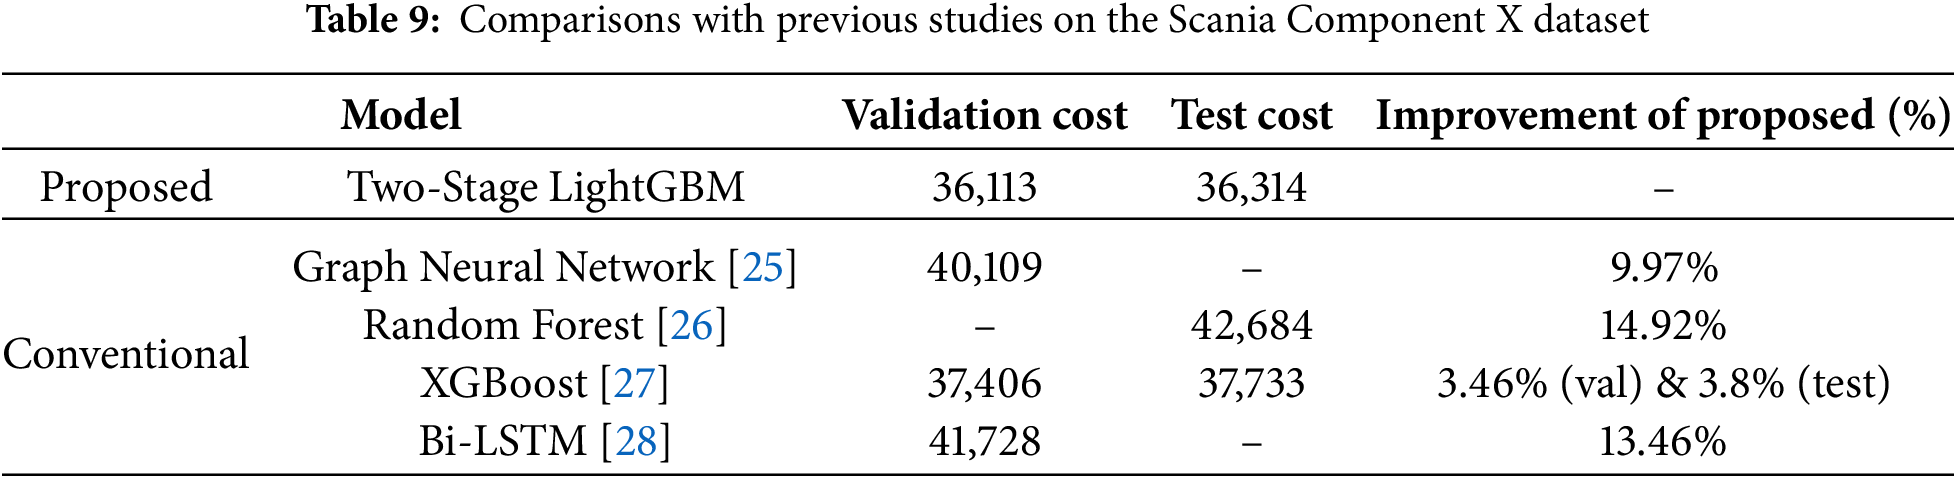
Table 9 compares the proposed framework with representative studies on the same dataset. Among all methods, the proposed Two-stage LightGBM achieved the lowest cost on both validation and test datasets, reducing cost by 3.46% on validation and 3.8% on test compared with XGBoost [26] and by 13.46% compared with Bi-LSTM [27]. Importantly, unlike prior methods that achieved cost reduction at the expense of class 4 recall, the proposed framework maintained consistently high recall for impending failures across both datasets. This indicates that the framework achieved both cost reduction and reliable detection of safety-critical failures simultaneously. Furthermore, the relative improvement over XGBoost and Bi-LSTM is noteworthy because both methods represent widely adopted baselines in predictive maintenance research. XGBoost is known for its strong tabular learning capability, while Bi-LSTM has been favored for its ability to capture temporal dependencies. The fact that the proposed framework outperforms both demonstrates the effectiveness of combining structured feature engineering with a hierarchical classification strategy under cost-sensitive conditions. It is also important to note that the IDA Challenge dataset was officially partitioned into train, validation, and test splits to ensure comparability across studies. In this study, the model was trained exclusively on the training split, with out-of-fold (OOF) probabilities used for internal calibration and subsequently evaluated exactly once on the validation and test splits. This strict evaluation protocol guarantees that the reported results are directly comparable to prior work on the same dataset without risk of information leakage.
These findings reinforce the practical value of cost-based evaluation protocols in predictive maintenance. By jointly achieving lower operational cost and higher reliability in critical-failure detection, the proposed approach provides a more deployable and industry-relevant solution compared to existing methods. This suggests that hierarchical models with tailored decision thresholds may offer a promising direction for future research, especially in scenarios characterized by imbalanced data and asymmetric risks.
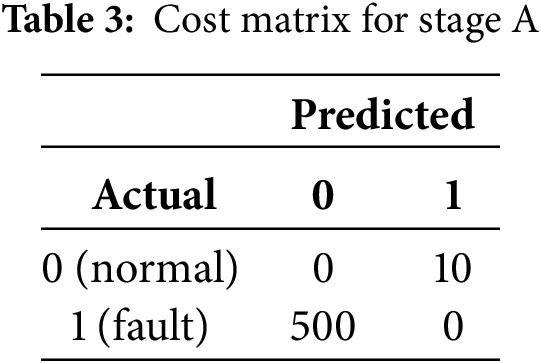
This study is constrained by two structural factors: severe class imbalance and asymmetric misclassification costs. Classes 1–3 represent only a small fraction of the dataset, limiting their discriminability compared with the normal class (0) and the imminent-failure class (4). The official IDA Challenge cost matrix further amplifies this imbalance. For instance, misclassifying a true instance of classes 1–3 as class 4 incurs only a minor penalty of about 10 cost units, while misclassifying a true class 4 instance as classes 1–3 leads to a major penalty exceeding 200 cost units. Under a cost-minimization objective, this strong asymmetry systematically biases the decision rule toward predicting class 4.
This results in a specific limitation: the near-zero recall of classes 1–3 is not merely a general trade-off between cost and performance, but a direct consequence of the asymmetric cost structure. The cost function inherently discourages the model from identifying intermediate severity levels, as the penalty for underestimating class 4 far outweighs that for overestimating classes 1–3. Consequently, the model tends to classify uncertain cases as class 4, thereby sacrificing sensitivity to moderate degradations in favor of minimizing expected cost. This highlights a structural constraint of cost-driven optimization, where operational risk tolerance dominates balanced accuracy.
Despite these limitations, the proposed Two-stage LightGBM framework demonstrates superior cost efficiency compared with both deep learning and ensemble baselines. This advantage can be attributed to several factors. First, LightGBM’s gradient boosting architecture reduces variance through sequential ensemble learning, leading to stable predictions under class imbalance. Second, its leaf-wise tree growth and default histogram-based learning enable the model to capture complex non-linear relationships more efficiently than Bi-LSTM or other level-wise tree-based methods. Third, LightGBM can automatically handle missing values by assigning them to the optimal branch during training, without requiring explicit preprocessing or imputation as in deep learning models such as Bi-LSTM. Finally, the two-stage design strategically separates the “fault vs. normal” decision (Stage A) from the finer severity classification (Stage B), reducing label noise propagation and enhancing cost sensitivity.
From a fleet-management perspective, however, classes 2 and 3 still provide valuable diagnostic signals for preventive maintenance. Future research could thus explore redefining the cost function or employing multi-objective optimization strategies that jointly minimize cost and improve detection of intermediate faults. Another promising direction is the development of adaptive, class-specific thresholds, which could maintain cost sensitivity while improving recall for moderate degradation classes.
This study proposed a Two-stage LightGBM framework to address the cost-sensitive predictive maintenance problem using the Scania Component X dataset. The method integrates statistical and trend-based descriptors extracted via the last_k_summary procedure with categorical vehicle specifications, thereby capturing degradation dynamics beyond terminal snapshots. This preprocessing design allows the model to represent the temporal progression of failures while remaining computationally efficient.
From a modeling perspective, Stage A performs binary fault detection (normal vs. fault) under a cost matrix that heavily penalizes false negatives, reflecting the operational priority of avoiding missed failures. Stage B applies a hierarchical classification strategy, progressively refining fault candidates into severity sub-classes to align predictions with asymmetric risk profiles.
Experimental results demonstrated that the proposed framework achieved total misclassification costs of 36,113 on the validation set and 36,314 on the test set, corresponding to 3.46% and 3.8% cost reductions compared with XGBoost, and 13.46% compared with Bi-LSTM. Importantly, the model maintained high recall for the safety-critical class (class 4), achieving 0.83 on validation and 0.77 on test, thereby demonstrating that the framework successfully balances safety and cost efficiency. Performance for the normal class (class 0) also remained stable, indicating that the commonly reported trade-off between cost minimization and high-risk fault detection can be mitigated. These results highlight the practical value of cost-based evaluation in predictive maintenance applications.
In summary, this study demonstrated that a cost-sensitive and operationally aligned PdM framework can simultaneously enhance safety and reduce maintenance costs in real-world conditions characterized by class imbalance and asymmetric risks. Future work will aim to improve detection of intermediate severity classes (1–3) through advanced data augmentation, refined class-specific cost structures, and hybrid deep learning approaches capable of modeling temporal dependencies more effectively. Additionally, extending the framework to heterogeneous fleets and larger-scale deployments is expected to further validate its robustness and industrial applicability.
Acknowledgement: Not applicable.
Funding Statement: This work was supported by the GRRC program of Gyeonggi province [GRRC KGU 2023-B01, Research on Intelligent Industrial Data Analytics].
Author Contributions: The authors confirm contribution to the paper as follows: conceptualization, Si-Woo Kim; methodology, Si-Woo Kim; validation, Si-Woo Kim; formal analysis, Si-Woo Kim; investigation, Si-Woo Kim; resources, Si-Woo Kim; data curation, Si-Woo Kim; writing—original draft preparation, Si-Woo Kim; writing—review and editing, Si-Woo Kim and Yong Soo Kim; visualization, Si-Woo Kim; supervision, Yong Soo Kim; project administration, Yong Soo Kim; funding acquisition, Yong Soo Kim. All authors reviewed the results and approved the final version of the manuscript.
Availability of Data and Materials: The data that support the findings of this study are openly available in the Swedish National Data Service (SND) repository at https://doi.org/10.5878/jvb5-d390 (accessed on 01 January 2025).
Ethics Approval: Not applicable.
Conflicts of Interest: The authors declare no conflicts of interest to report regarding the present study.
References
1. Duc VN, Steffen L, Yang K, Markus O, Thomas B. Modeling and prediction of remaining useful lifetime for maintenance scheduling optimization of a car fleet. Int J Perform Eng. 2019;15(9):2318. doi:10.23940/ijpe.19.09.p4.23182328. [Google Scholar] [CrossRef]
2. Molęda M, Małysiak-Mrozek B, Ding W, Sunderam V, Mrozek D. From corrective to predictive maintenance—a review of maintenance approaches for the power industry. Sensors. 2023;23(13):5970. doi:10.3390/s23135970. [Google Scholar] [PubMed] [CrossRef]
3. Katreddi S, Thiruvengadam A, Thompson G, Schmid N, Padmanaban V. Machine learning models for maintenance cost estimation in delivery trucks using diesel and natural gas fuels. Front Mech Eng. 2023;9:1201068. doi:10.3389/fmech.2023.1201068. [Google Scholar] [CrossRef]
4. Selcuk S. Predictive maintenance, its implementation and latest trends. Proc Inst Mech Eng Part B J Eng Manuf. 2017;231(9):1670–9. doi:10.1177/0954405415601640. [Google Scholar] [CrossRef]
5. Celestin M. How predictive maintenance in logistics fleets is reducing equipment downtime and operational losses. Brainae J Bus Sci Technol. 2023;7(10):1023–33. [Google Scholar]
6. Mahale Y, Kolhar S, More AS. Enhancing predictive maintenance in automotive industry: addressing class imbalance using advanced machine learning techniques. Discov Appl Sci. 2025;7(4):340. doi:10.1007/s42452-025-06827-3. [Google Scholar] [CrossRef]
7. Bodo R, Bertocco M, Bianchi A. Cost-sensitive fault identification in predictive maintenance applications: a case study. In: Proceedings of the 2021 IEEE International Instrumentation and Measurement Technology Conference (I2MTC); 2021 May 17–20; Vasteras, Sweden. Piscataway, NJ, USA: IEEE; 2021. p. 1–6. doi:10.1109/i2mtc50364.2021.9459829. [Google Scholar] [CrossRef]
8. Chapelin J, Voisin A, Rose B, Iung B, Steck L, Chaves L, et al. Data-driven drift detection and diagnosis framework for predictive maintenance of heterogeneous production processes: application to a multiple tapping process. Eng Appl Artif Intell. 2025;139:109552. doi:10.1016/j.engappai.2024.109552. [Google Scholar] [CrossRef]
9. García-Méndez S, de Arriba-Pérez F, Leal F, Veloso B, Malheiro B, Burguillo-Rial JC. An explainable machine learning framework for railway predictive maintenance using data streams from the metro operator of Portugal. Sci Rep. 2025;15(1):27495. doi:10.1038/s41598-025-08084-1. [Google Scholar] [PubMed] [CrossRef]
10. Nunes P, Santos J, Rocha E. Challenges in predictive maintenance—a review. CIRP J Manuf Sci Technol. 2023;40(1):53–67. doi:10.1016/j.cirpj.2022.11.004. [Google Scholar] [CrossRef]
11. Bashar Fakhri A, Latteef Mohammed S, Khan I, Safaa Sadiq A, Alkazemi B, Pillai P, et al. Industry 4.0: architecture and equipment revolution. Comput Mater Contin. 2021;66(2):1175–94. doi:10.32604/cmc.2020.012587. [Google Scholar] [CrossRef]
12. Pech M, Vrchota J, Bednář J. Predictive maintenance and intelligent sensors in smart factory: review. Sensors. 2021;21(4):1470. doi:10.3390/s21041470. [Google Scholar] [PubMed] [CrossRef]
13. Bousdekis A, Lepenioti K, Apostolou D, Mentzas G. Decision making in predictive maintenance: literature review and research agenda for Industry 4.0. IFAC-PapersOnLine. 2019;52(13):607–12. doi:10.1016/j.ifacol.2019.11.226. [Google Scholar] [CrossRef]
14. Dilawar M, Shahbaz M. A Bayesian optimized stacked long short-term memory framework for real-time predictive condition monitoring of heavy-duty industrial motors. Comput Mater Contin. 2025;83(3):5091–114. doi:10.32604/cmc.2025.064090. [Google Scholar] [CrossRef]
15. Qi R, Zhang J, Spencer K. A review on data-driven condition monitoring of industrial equipment. Algorithms. 2023;16(1):9. doi:10.3390/a16010009. [Google Scholar] [CrossRef]
16. Marti-Puig P, Touhami IA, Perarnau RC, Serra-Serra M. Industrial AI in condition-based maintenance: a case study in wooden piece manufacturing. Comput Ind Eng. 2024;188(1):109907. doi:10.1016/j.cie.2024.109907. [Google Scholar] [CrossRef]
17. Kusumaningrum D, Kurniati N, Santosa B. Machine learning for predictive maintenance. In: Proceedings of the International Conference on Industrial Engineering and Operations Management; 2021 Apr 5–8; Sao Paulo, Brazil. p. 2348–56. doi:10.46254/sa02.20210717. [Google Scholar] [CrossRef]
18. Arena F, Collotta M, Luca L, Ruggieri M, Termine FG. Predictive maintenance in the automotive sector: a literature review. Math Comput Appl. 2022;27(1):2. doi:10.3390/mca27010002. [Google Scholar] [CrossRef]
19. Vollert S, Atzmueller M, Theissler A. Interpretable machine learning: a brief survey from the predictive maintenance perspective. In: Proceedings of the 2021 26th IEEE International Conference on Emerging Technologies and Factory Automation (ETFA); 2021 Sep 7–10; Vasteras, Sweden. Piscataway, NJ, USA: IEEE; 2021. p. 1–8. doi:10.1109/ETFA45728.2021.9613467. [Google Scholar] [CrossRef]
20. Ansari F, Glawar R, Nemeth T. PriMa: a prescriptive maintenance model for cyber-physical production systems. Int J Comput Integr Manuf. 2019;32(4–5):482–503. doi:10.1080/0951192x.2019.1571236. [Google Scholar] [CrossRef]
21. Li Z, He Q, Li J. A survey of deep learning-driven architecture for predictive maintenance. Eng Appl Artif Intell. 2024;133:108285. doi:10.1016/j.engappai.2024.108285. [Google Scholar] [CrossRef]
22. Deng S, Zhou J. Prediction of remaining useful life of aero-engines based on CNN-LSTM-attention. Int J Comput Intell Syst. 2024;17(1):232. doi:10.1007/s44196-024-00639-w. [Google Scholar] [CrossRef]
23. Serradilla O, Zugasti E, Rodriguez J, Zurutuza U. Deep learning models for predictive maintenance: a survey, comparison, challenges and prospects. Appl Intell. 2022;52(10):10934–64. doi:10.1007/s10489-021-03004-y. [Google Scholar] [CrossRef]
24. Cummins L, Sommers A, Ramezani SB, Mittal S, Jabour J, Seale M, et al. Explainable predictive maintenance: a survey of current methods, challenges and opportunities. IEEE Access. 2024;12(4):57574–602. doi:10.1109/ACCESS.2024.3391130. [Google Scholar] [CrossRef]
25. Parton M, Fois A, Vegliò M, Metta C, Gregnanin M. Predicting the failure of component X in the scania dataset with graph neural networks. In: Advances in intelligent data analysis XXII. Cham, Switzerland: Springer Nature; 2024. p. 251–9. doi:10.1007/978-3-031-58553-1_20. [Google Scholar] [CrossRef]
26. Yang Y, Iqbal MZ. Cost-optimised machine learning model comparison for predictive maintenance. Electronics. 2025;14(12):2497. doi:10.3390/electronics14122497. [Google Scholar] [CrossRef]
27. Dimidov V, Jafarnejad S, Frank R. An empirical study on predictive maintenance for component X in heavy-duty scania trucks. In: Proceedings of the 2025 IEEE International Conference on Prognostics and Health Management (ICPHM); 2025 Jun 9–11; Denver, CO, USA. Piscataway, NJ, USA: IEEE; 2025. p. 1–9. doi:10.1109/ICPHM65385.2025.11061822. [Google Scholar] [CrossRef]
28. Zhong J, Wang Z. Implementing deep learning models for imminent component X failures prediction in heavy-duty scania trucks. In: Advances in intelligent data analysis XXII. Cham, Switzerland: Springer Nature; 2024. p. 268–76. doi:10.1007/978-3-031-58553-1_22. [Google Scholar] [CrossRef]
29. Kharazian Z, Lindgren T, Magnússon S, Steinert O, Andersson Reyna O. SCANIA component X dataset: a real-world multivariate time series dataset for predictive maintenance. Sci Data. 2025;12(1):493. doi:10.1038/s41597-025-04802-6. [Google Scholar] [PubMed] [CrossRef]
30. Ke G, Meng Q, Finley T, Wang T, Chen W, Ma W, et al. LightGBM: a highly efficient gradient boosting decision tree. Adv Neural Inf Process Syst. 2017;30:1–9. [Google Scholar]
Cite This Article
 Copyright © 2026 The Author(s). Published by Tech Science Press.
This work is licensed under a Creative Commons Attribution 4.0 International License , which permits unrestricted use, distribution, and reproduction in any medium, provided the original work is properly cited.
 Downloads
 Citation Tools