
 Submit a Paper
 Propose a Special lssue
 Open Access
ARTICLE
Anisotropy of Phase Transformation in Aluminum and Copper under Shock Compression: Atomistic Simulations and Neural Network Model
1 Institute of Mechanics, Lomonosov Moscow State University, Moscow, 119192, Russia
2 Department of General and Theoretical Physics, Chelyabinsk State University, Chelyabinsk, 454001, Russia
* Corresponding Author: Alexander E. Mayer. Email:
Computers, Materials & Continua 2026, 87(1), 18 https://doi.org/10.32604/cmc.2026.071952
Received 16 August 2025; Accepted 23 December 2025; Issue published 10 February 2026
 View Full Text
 Download PDF
Abstract
It is well known that aluminum and copper exhibit structural phase transformations in quasi-static and dynamic measurements, including shock wave loading. However, the dependence of phase transformations in a wide range of crystallographic directions of shock loading has not been revealed. In this work, we calculated the shock Hugoniot for aluminum and copper in different crystallographic directions ([100], [110], [111], [112], [102], [114], [123], [134], [221] and [401]) of shock compression using molecular dynamics (MD) simulations. The results showed a high pressure (>160 GPa for Cu and >40 GPa for Al) of the FCC-to-BCC transition. In copper, different characteristics of the phase transition are observed depending on the loading direction with the [100] compression direction being the weakest. The FCC-to-BCC transition for copper is in the range of 150–220 GPa, which is consistent with the existing experimental data. Due to the high transition pressure, the BCC phase transition in copper competes with melting. In aluminum, the FCC-to-BCC transition is observed for all studied directions at pressures between 40 and 50 GPa far beyond the melting. In all considered cases we observe the coexistence of HCP and BCC phases during the FCC-to-BCC transition, which is consistent with the experimental data and atomistic calculations; this HCP phase forms in the course of accompanying plastic deformation with dislocation activity in the parent FCC phase. The plasticity incipience is also anisotropic in both metals, which is due to the difference in the projections of stress on the slip plane for different orientations of the FCC crystal. MD modeling results demonstrate a strong dependence of the FCC-to-BCC transition on the crystallographic direction, in which the material is loaded in the copper crystals. However, MD simulations data can only be obtained for specific points in the stereographic direction space; therefore, for more comprehensive understanding of the phase transition process, a feed-forward neural network was trained using MD modeling data. The trained machine learning model allowed us to construct continuous stereographic maps of phase transitions as a function of stress in the shock-compressed state of metal. Due to appearance and growth of multiple centers of new phase, the FCC-to-BCC transition leads to formation of a polycrystalline structure from the parent single crystal.Keywords
Understanding the mechanisms of metal deformation under dynamic loading is crucial for improving material strength and mechanical properties, especially for use in extreme conditions [1,2]. Plastic flow, enabled by dislocation slip, is widely regarded as the primary mechanism of stress relaxation in dynamically deformed materials [3,4]. However, the high stress levels achieved under shock wave (SW) compression and other forms of severe dynamic loading can activate alternative stress relaxation mechanisms, including polymorphic phase transformations. For instance, a face-centered cubic (FCC) to body-centered cubic (BCC) phase transformation can lead to significant stress relaxation and has been experimentally observed in shock-compressed copper at pressures above 180 GPa in Ref. [5] and in the range 185–280 GPa in Ref. [6], as well as in molecular dynamics (MD) simulations for aluminum [7–11], copper [12–16] and high-entropy alloys [17,18]. According to MD studies for aluminum, the FCC-to-BCC transition pressure in aluminum under SW loading lies between 30 and 50 GPa [11,16]. Despite extensive experimental and MD studies, including detailed analysis of FCC-to-BCC mechanisms along the [100] crystallographic direction [15,19], a complete picture of phase transformations in aluminum and copper under shock loading including the anisotropy issues remains unexplored, since most studies focus on principal crystallographic directions, such as [100], [110] and [111], for example see Refs. [11,13,20]. FCC-to-BCC transitions can be observed not only for the crystalline matrix, but also for inclusions. In the work [21], a complete FCC-to-BCC transition at elevated temperatures was shown for spherical PdCu clusters; remarkably, the driving force of the structural transition strongly depends on the lattice orientation. In addition, a theoretical analysis of the transition from FCC to BCC structures [22] shows that there is more than one way of reorganizing such structures into each other. Given that copper single crystal has a strong anisotropy of mechanical properties, it is essential to examine a broader set of crystallographic directions. Because the anisotropic response is difficult to capture in SW experiments, MD studies are relevant.
The loading scheme and orientation effects can introduce variation in experimental observations. A substantial difference exists between SW and ramp loading, with the former leading to greater energy dissipation and temperature increase, which promotes phase transitions at lower pressures. For instance, the BCC phase in copper is not observed under ramp loading even at 400 GPa [23], whereas SW loading triggers the FCC-to-BCC transition at about 180 GPa [5,6]. Similarly, the transition to BCC phase in aluminum under ramp loading is experimentally observed at about 320 GPa [24,25], while it is in the range of 30–50 GPa for SW loading according to MD simulations [11,16] without any experimental confirmation to the best of our knowledge. On the one hand, such a decrease in the transition pressure for Al under the action of a SW compared to a ramp wave corresponds to the experimentally confirmed case of copper. On the other hand, MD simulations of Ref. [26] show that transition to BCC phase starts at 76 GPa and completes at 113 GPa under ramp loading contradicting to the experimental findings [24,25], which can be attributed to either issues of the used interatomic potential or to the features of specific implementation of the ramp loading in the MD. These uncertainties motivate further studies in the field. Besides the transition pressure, questions remain regarding the mechanism of phase transformation. In the ramp experiments [24,25] with aluminum, a sequential FCC-to-HCP (hexagonal close-packed) transition was observed, followed by a HCP-to-BCC transition, which was confirmed by MD simulations [26]. The authors of Refs. [5,6] also described the possible influence of plastic deformations and the appearance of stacking faults in crystals on the FCC-to-BCC transition, but this issue was not considered in detail. Our previous studies [14,16] showed that the intermediate HCP phase arises in Al and Cu as a result of dislocation activity, including twining, but it is not a thermodynamically caused phase. The FCC-HCP-BCC pathway is observed in high-entropy alloys [27]: in the Fe45Mn35Cr10Co10 alloy, the phase transition is associated with lattice rearrangement due to the movement of partial dislocations during plastic deformation.
The orientation dependence of FCC-to-BCC phase transition in the shock-wave processes has not yet been sufficiently explored for different crystal orientations, as indicated above, due to the choice of a small number of crystallographic directions for study. The existing MD studies show that a clear FCC-to-BCC transition is observed in copper under shock wave action in the loading directions [100], see Ref. [19], and [110], but not observed for direction [111], see Ref. [20]. Anisotropy of mechanical properties is inherent to single crystals, including the anisotropy of elastic behavior expressed by Young’s modulus [28] and anisotropy of plastic deformation, which leads to an anisotropic response of copper to wear at nanoscale scratching [29]. To address this knowledge gap, we present a detailed MD study of the phase transformations at various stress levels and loading orientations in copper and aluminum single crystals.
In recent years, various machine learning (ML) methods have been increasingly used in materials science to describe complex dependencies in the presence of a sufficient amount of data obtained in numerical or real experiments. Several main areas of application of ML methods for describing phase transitions in metallic materials can be identified. The first one is the description of interatomic potentials, which are capable of describing phase diagrams and the melting process more accurately than generally accepted models such as embedded atom model (EAM) and angle-dependent potential (ADP). For example, artificial neural network (ANN) potentials have been developed for rubidium [30] and Gaussian approximation potential (GAP) for silicon [31] specifically for describing phase transitions in atomistic simulations. The authors of Ref. [32] developed a methodology for training ML potentials using the Stochastic Surface Walking method to obtain data near the transition states of the system. Second, ML can be used to predict phase composition of the material from experimental data [33]. The authors [33] show that it is possible to train different ML models to predict the phase composition (FCC, BCC or FCC+BCC) for high entropy alloys, where the features taken are valence electron concentration, mixing entropy, mixing enthalpy, atomic size difference and electronegativity difference.
To study phase transitions in copper and aluminum across multiple loading orientations within the frames of MD, we use the Hugoniostat approach [34,35]. This method simulates the thermodynamic state behind a shock wave front without explicit consideration of the entire process of SW propagation. Specific realizations of Hugoniostat in MD are somewhat different with two main approaches proposed in [34,35], respectively, but the main idea remains the same–to maintain the MD system in the thermodynamic state determined by the Rankine-Hugoniot relation. The advantage of this method is that the simulated systems can be smaller in size and, simultaneously, more representative than in the case of direct MD simulations of the SW propagation through elongated samples, where only a small part of the system is undergoing SW compression simultaneously leading to extremely high strain rates. Moreover, the results obtained by this method give good agreement with the experiments for metals [36], metal matrix composites [37] and for non-metallic materials, such as silica glasses [38] and polymers [39].
The paper is organized as follows. Section 2 describes the methods used in this study. Results and analysis of MD simulations with Hugoniostat for multiple different loading directions in copper and aluminum are collected in Section 3. Thereafter, Section 4 describes the ML model for the phase transition in copper and stereographic maps plotted with the help of ML model. Section 5 provides some verification of the Hugoniostat-based approach by means of direct MD simulations in elongated copper samples. Section 6 analyzes formation of a polycrystalline structure as a result of shock-induced phase transition in copper single crystal. Finally, Section 7 concludes our study.
In the present study, we perform MD simulations of the compression of aluminum and copper single crystals to the Shock Hugoniot state. The following crystallographic directions of the SW compression are investigated for both metals: [100], [110], [111], [112], [102], [114], [123], [134], [221] and [401]; besides, additional directions are considered for copper having a strong anisotropy to plot stereographic maps discussed in Section 4. Directions [100], [110] and [111] are the main ones for FCC crystals; directions [112], [102], [114], [221] and [401] are on the sides of the stereographic triangle, that is, these directions meet when the crystal rotates from one main direction to another; directions [123] and [134] are in the center of the stereographic triangle. Two variants of MD systems are considered, which we conditionally refer to as “large” and “small” systems. The small simulated crystals contain approximately 500,000 atoms, and large systems contain a number of atoms in the range of 6,000,000–8,000,000. The simulation box dimensions are about 18 × 18 × 18 nm3 (copper) or 20 × 20 × 20 nm3 (aluminum) for small systems and 46 × 46 × 46 nm3 (copper) or 52 × 52 × 52 nm3 (aluminum) for large system. Small systems are employed to study phase transition at different SW pressure, while large systems allow us to study the growth kinetics of crystalline phases in the material.
The modeling using the Constant-stress Hugoniostat method is carried out by means of the LAMMPS software package [40,41]. We used the embedded atom (EAM) potentials: [42] for copper and [43] for aluminum, because these potentials reliably describes the behavior of the system over a wide range of pressures and temperatures and can even outperform modern machine-learning potentials as shown in [44]. Besides, these potentials are widely used for modeling of SW in crystals and reproduce the shock wave structure well [15,19,20,45–47]. Before deformation, Nose–Hoover thermostat and barostat [48] are applied to the crystals to relax stresses at a temperature of 300 K. Thereafter, the pressure tensor component
Using the “Polyhedral template matching” algorithm [49] realized in the Ovito program [50] and LAMMPS package [40], the fractions of crystal structure phases are calculated for each numerical experiment. This algorithm is based on searching of polygonal structures in an atomic system and comparing them to a template for a specific crystal structure. Polyhedral template matching (PTM) is more accurate than Common Neighbor Analysis (CNA) family methods. Using the initial and final pressure and density, one can calculate the velocity of the shock wave
where
In order to generalize MD data on the orientation dependence of phase composition in the SW-compressed states, we construct a neural network model in the form of fully-connected neural network (FCNN). The FCNN approximates the functional dependence
where
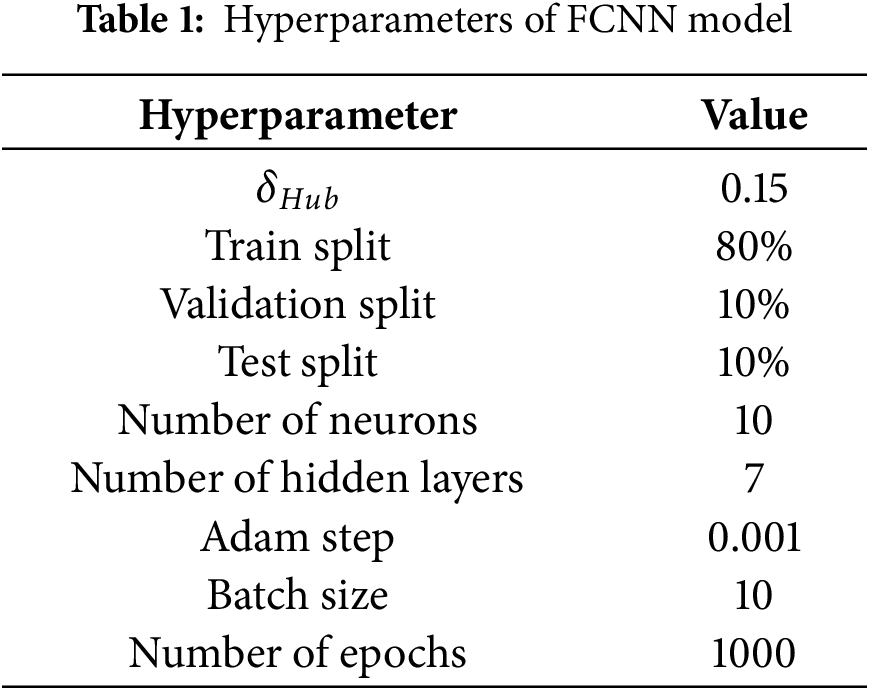
The Huber function was used as the loss function during the model training process:
This function is used because it is less sensitive to outliers in the data: it is quadratic for values of the deviation less than
The PReLU function is used as the activation function on the hidden layers of the neural network:
where
Construction and training of the neural network model was carried out in the Keras environment. Training was performed using the stochastic gradient descent method with the Adam optimizer.
3 Orientation Dependence of Phase Transition
Fig. 1 shows the fractions of crystal phases in shocked aluminum for different compression directions and final pressures of the shock-compressed state. Appearance of HCP phase corresponds not to a real structural phase transformation, but rather arises as a consequence of the dislocation plasticity [16]. For different loading directions in the aluminum single crystal, one can see different ranges of stresses laying typically between 10 and 50 GPa, at which the HCP phase is formed. This process is related to the nucleation of partial Shockley dislocations supplemented by HCP phase (Fig. 1) indicating the formation of stacking faults behind the slipping partial dislocations. The different values of the threshold stresses for the onset of the formation of the HCP phase and the value of the HCP fraction are associated with different projections of stresses on the slip planes and on the Burgers’ vector directions of dislocations in the crystal at different loading directions.
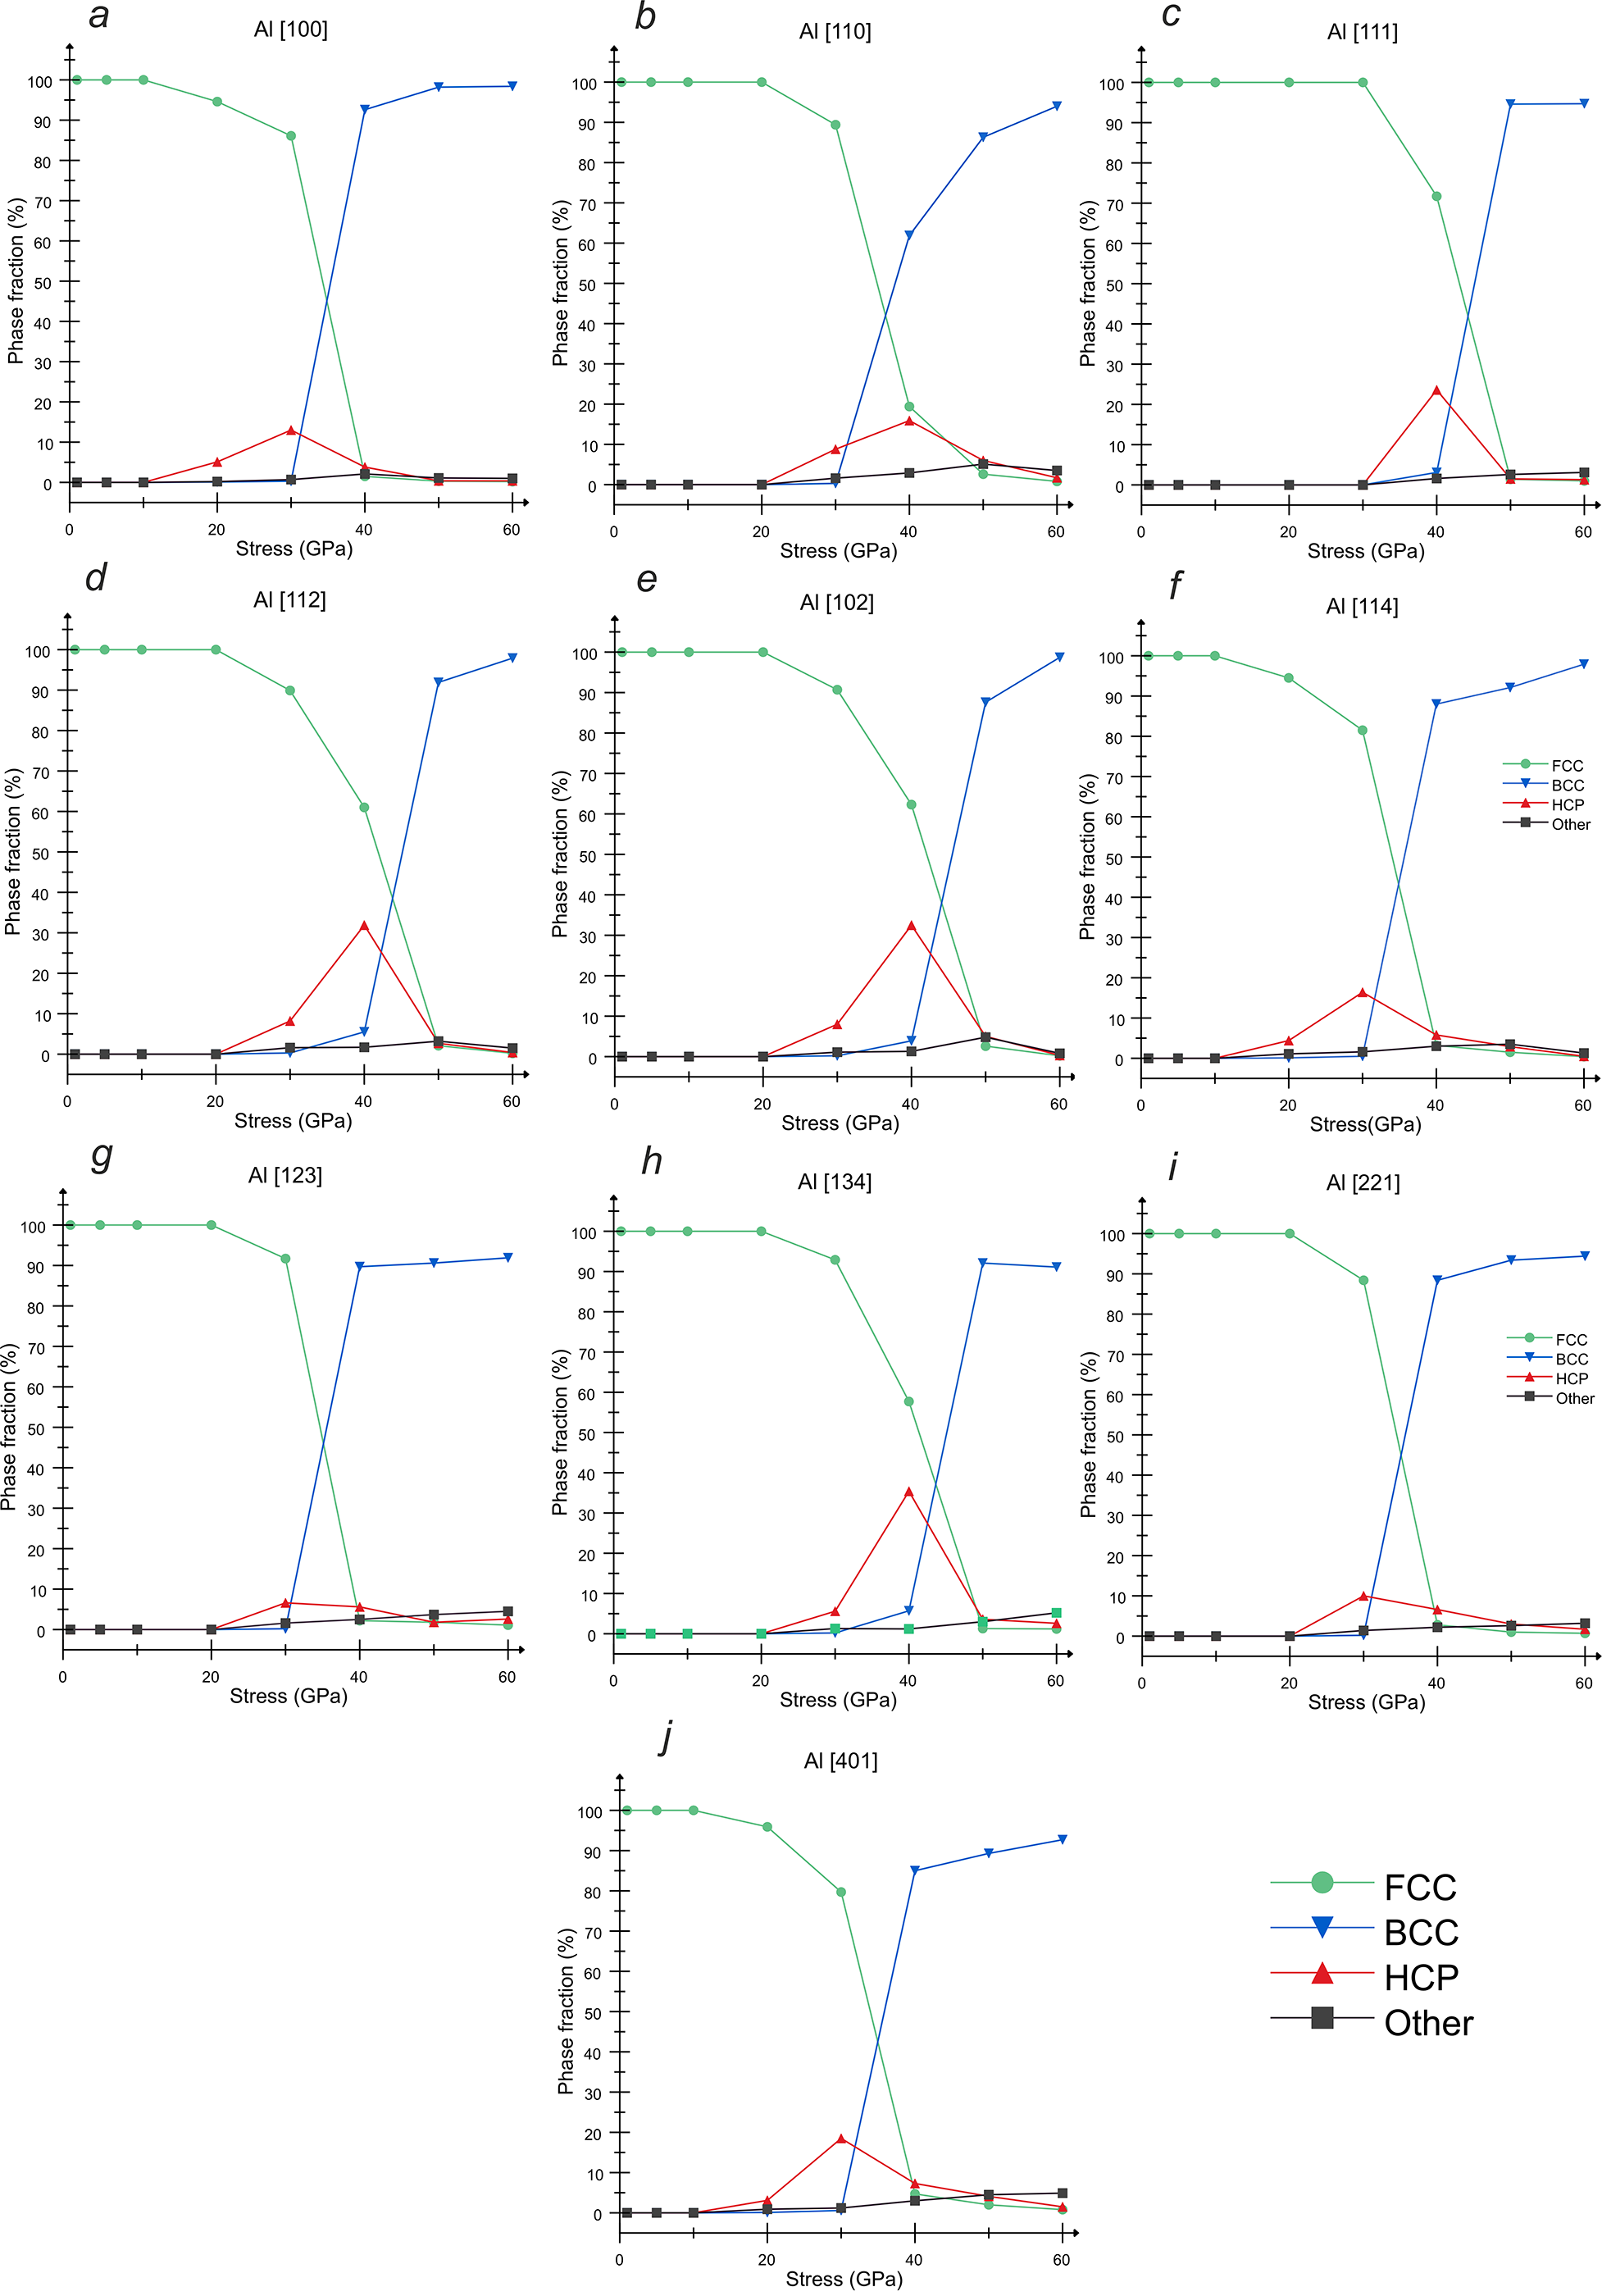
Figure 1: Phase fractions in the SW compressed aluminum vs. normal pressure for the following compression directions of single crystal: (a) [100], (b) [110], (c) [111], (d) [112], (e) [102], (f) [114], (g) [123], (h) [134], (i) [221], and (j) [401]
The onset of the FCC-to-BCC structural phase transition occurs at stresses in the range of 30–40 GPa, and for all crystallographic directions under consideration at a stress of 60 GPa the BCC phase occupies the majority of the system (the fraction of the BCC phase reaches 90%–100%). At the same time, the obtained results evidence that, there is no a smooth dependence of the FCC-to-BCC phase transition on the crystallographic direction in pure aluminum, since, for instance, the directions [111], [112], [102] and [134] with close transition pressure [Fig. 1c-e,h] are scattered in different parts of the stereographic projection of the FCC crystal. The FCC-to-BCC phase transformation under SW loading was previously revealed by means of MD simulations with other interatomic potentials [51–53] as well, but only [100] loading direction [7–9] or [100], [110] and [111] loading directions [11] were considered in these previous works. It is noteworthy that there is no remarkable fraction of Other (unstructured or amorphous) phase in the considered pressure range, although the amorphous phase appears in aluminum at stronger compression [10,11].
The structural transformations occur in such a way to relax both the hydrostatic pressure
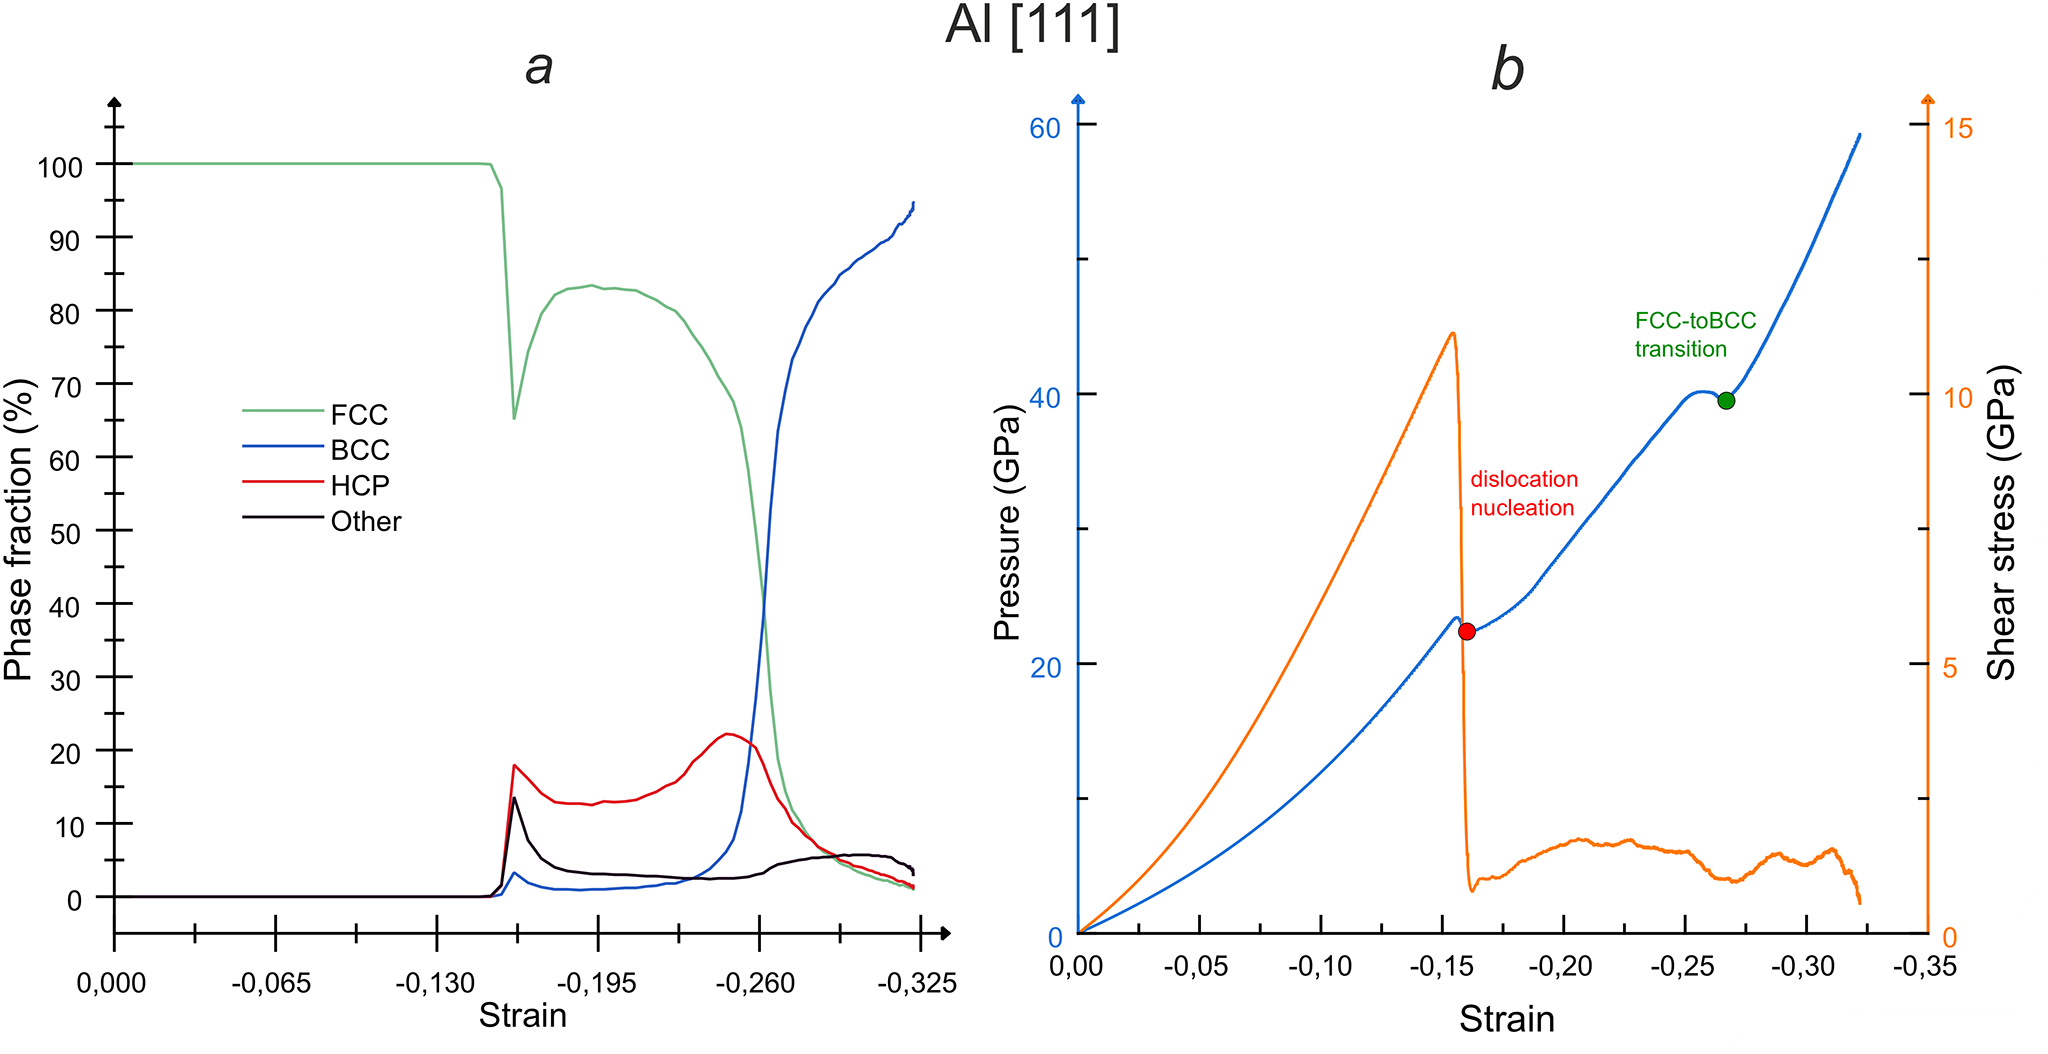
Figure 2: Evolution of (a) phase composition and (b) pressure and shear stress in aluminum single crystal during a Hugoniostat simulation up to a target stress of 60 GPa applied along [111] direction. The red dot in (b) marks the onset of dislocation nucleation (and growth of the HPC phase in (a)), and the green dot marks the FCC-to-BCC phase transition (and growth of the BCC phase in (a))
The phase diagram of aluminum is shown in Fig. 3, where the principle Hugoniot and the melting curve are taken from [55] and were obtained on the basis of DFT (density functional theory) calculations for the SESAME (Standardized Equation-of-State Models and Evaluations, Los Alamos National Laboratory) equation of state. Besides, Fig. 3 shows the transition curves of the FCC-to-BCC phase transformation calculated by means of the nested sampling approach [56] using MD simulations with different EAM potentials [43,57,58]. Our results for a wide range of loading directions shown by symbols in this phase diagram well correlate both with the principle Hugoniot [55] and with the domain of BCC phase determined in [56]. Fig. 3 also supports our conclusion about the absence of “Other” phase in aluminum, because the melting curve passes significantly above the points where we observe the FCC-to-BCC transition.
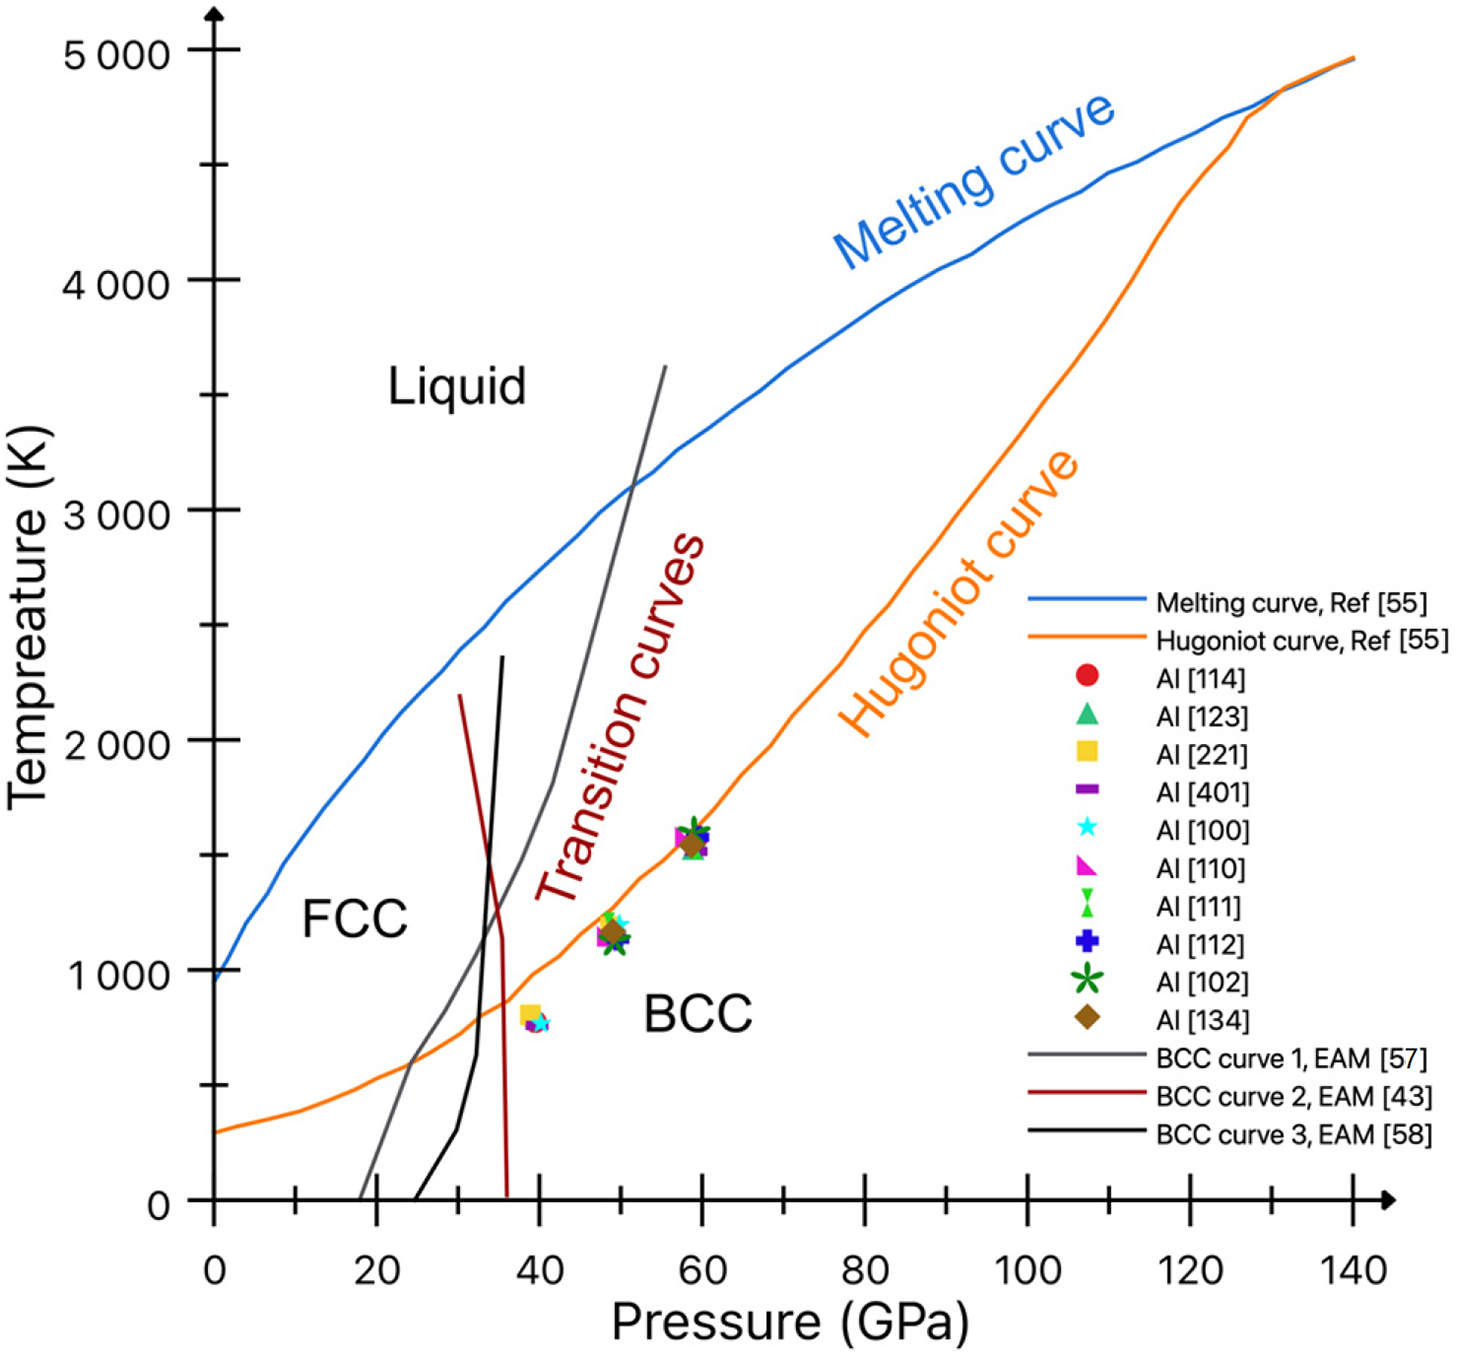
Figure 3: Phase diagram for pure aluminum: comparison of our MD results for different loading directions with the literature data. The melting curve and the principal shock Hugoniot based on DFT calculations combined with SESAME equation of state are taken from [55]; the FCC-to-BCC phase transition boundaries are taken from [56], where they were calculated with three different EAM interatomic potentials: curve1 [57], curve2 [43] and curve3 [58]. The symbols on the phase diagram indicate the pressure and temperature values at which the BCC phase becomes predominant in our MD simulations for different loading directions
The calculation results for copper single crystals presented in Fig. 4 show that copper is more persistent to the structural phase transitions compared to aluminum: the weakest [100] loading direction reveals FCC-to-BCC transition above 100 GPa and even more high transition pressure occurs for other loading directions. Relatively high fraction of HCP phase reaching 20%–50% for [100], [114] and [401] loading directions at lower pressures [Fig. 4a,f,j] indicates the dislocation activity, namely the slip of Shockley partials leaving the stacking faults, which are detected as the HCP phase, but this is not a thermodynamically conditioned structural phase transformation. The dislocation plasticity is first detected at 40 GPa for [100], [110], [114], [123] and [401] directions [Fig. 4a,b,f,g,j] or 60 GPa for [111], [112] and [221] directions [Fig. 4c,e,i] meaning very strong elastic compression till the reaching of plasticity incipience. The distorted crystal lattice is unstable near the point of homogeneous nucleation of dislocations.
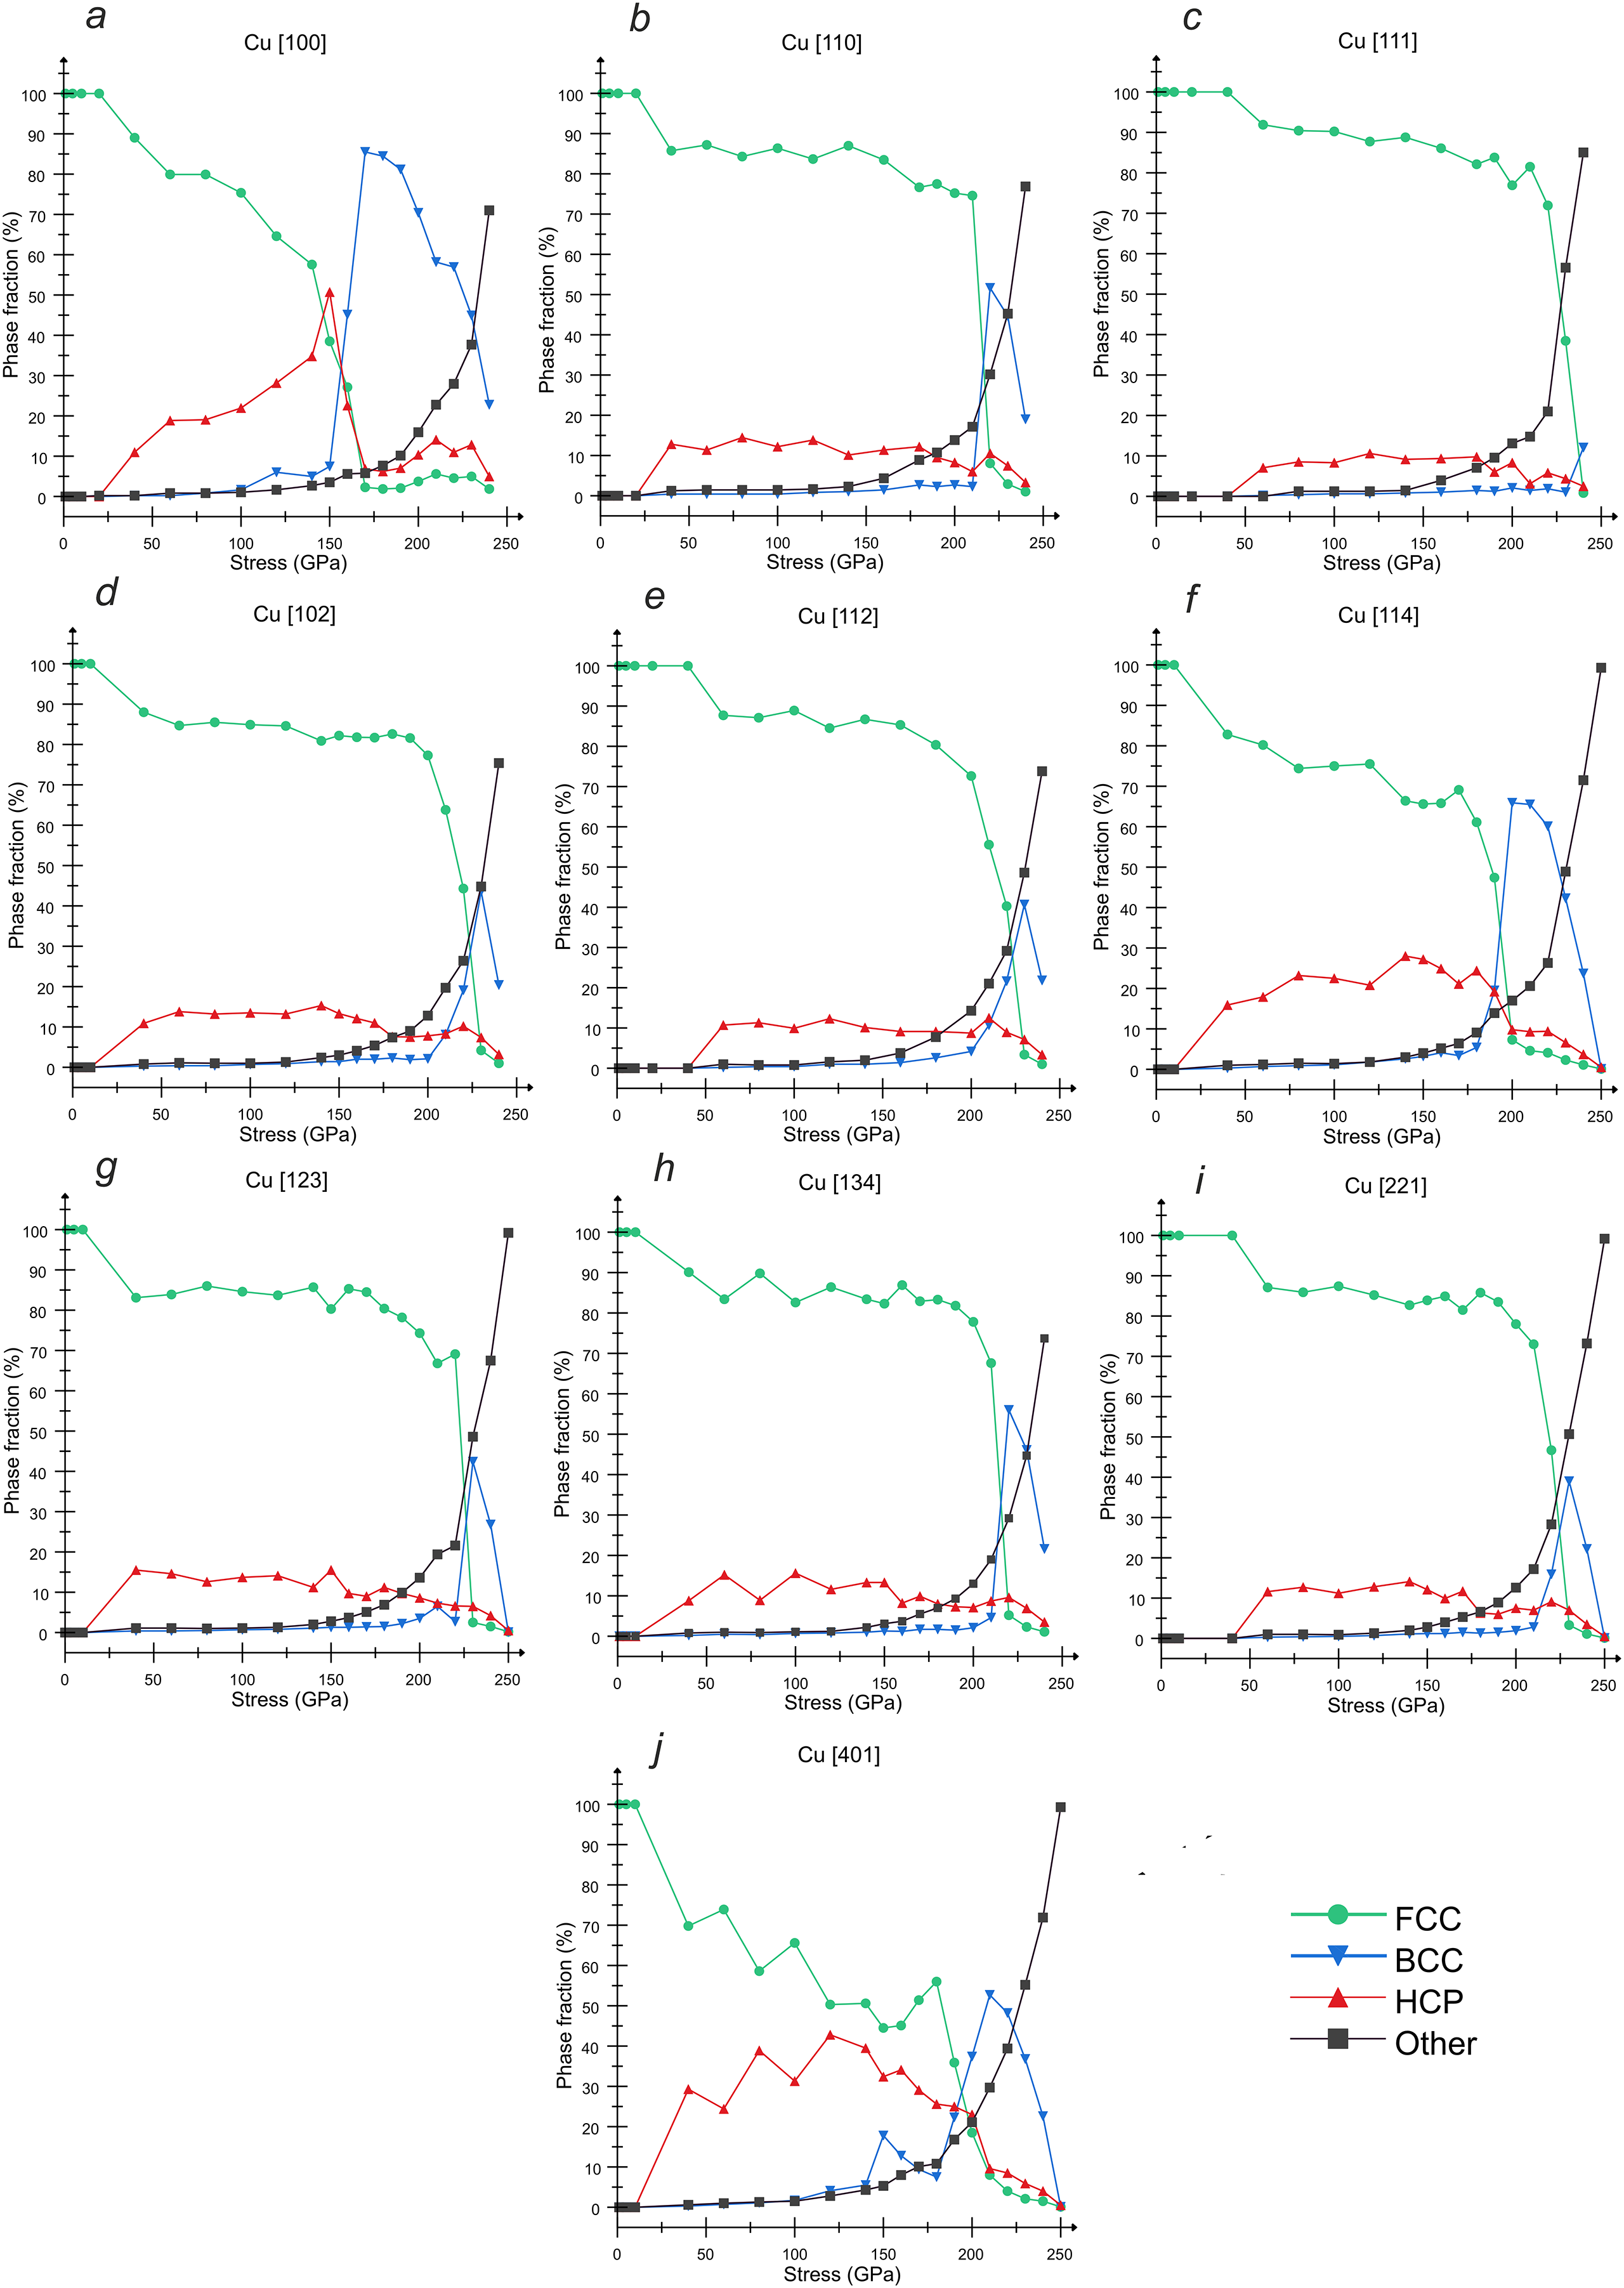
Figure 4: Phase fractions in SW compressed copper vs. normal pressure for the following compression directions: (a) [100], (b) [110], (c) [111], (d) [102], (e) [112], (f) [114], (g) [123], (h) [134], (i) [221], and (j) [401]
Fig. 4 shows a strong dependence of the FCC-to-BCC transition on the crystallographic direction in copper, which reveals much stronger anisotropy of copper compared with aluminum. The [100] direction is the most favorable for the phase transition: the BCC phase dominates in the pressure range of 160–240 GPa with the maximum fraction of about 90% at a stress of 160 GPa [Fig. 4a]. Directions close to [100] in the stereographic projection, namely, [114] and [401], are also more favorable for the phase transition compared to the others [Fig. 4f,j]. The maximum fraction of the BCC phase is about 65% at 200 GPa for [114] direction and about 55% at 210 GPa for [401] loading. The opposite case is the [111] loading direction [Fig. 4c] revealing no FCC-to-BCC transition. The directions close to [111] in the stereographic projection, namely [112] and [221], are less favorable for phase transitions, such that the maximum BCC fraction is restricted by about 40% and occurs at high pressure of 230 GPa in a narrow pressure interval [Fig. 4e,i]. In the third extreme direction [110] one can observe a phase transition with the maximum fraction of BCC phase of about 55% at 220 GPa [Fig. 4b]. All remaining directions, [102], [123] and [134] are quite close to [110] in both the stereographic projection and the features of BCC phase transition [Fig. 4d,g,h]: MD results show the maximum fraction of BCC phase of about 45%, 42% and 58%, respectively, at 230 GPa. This strong anisotropy can explain the revealing of BCC phase in copper in some of compression experiments and unrevealing in other experiments. This anisotropy is especially significant for single crystals or tiny polycrystals with small number of grains. The situation becomes even more complex due to the melting as a competing phase transition at such intensive shock waves as discussed below.
Fig. 5 shows the atomic structures of copper during compression in [100] direction to the final pressure of 180 GPa. After the elastic compression, the dislocation plasticity is developed first with the dislocation density reaching
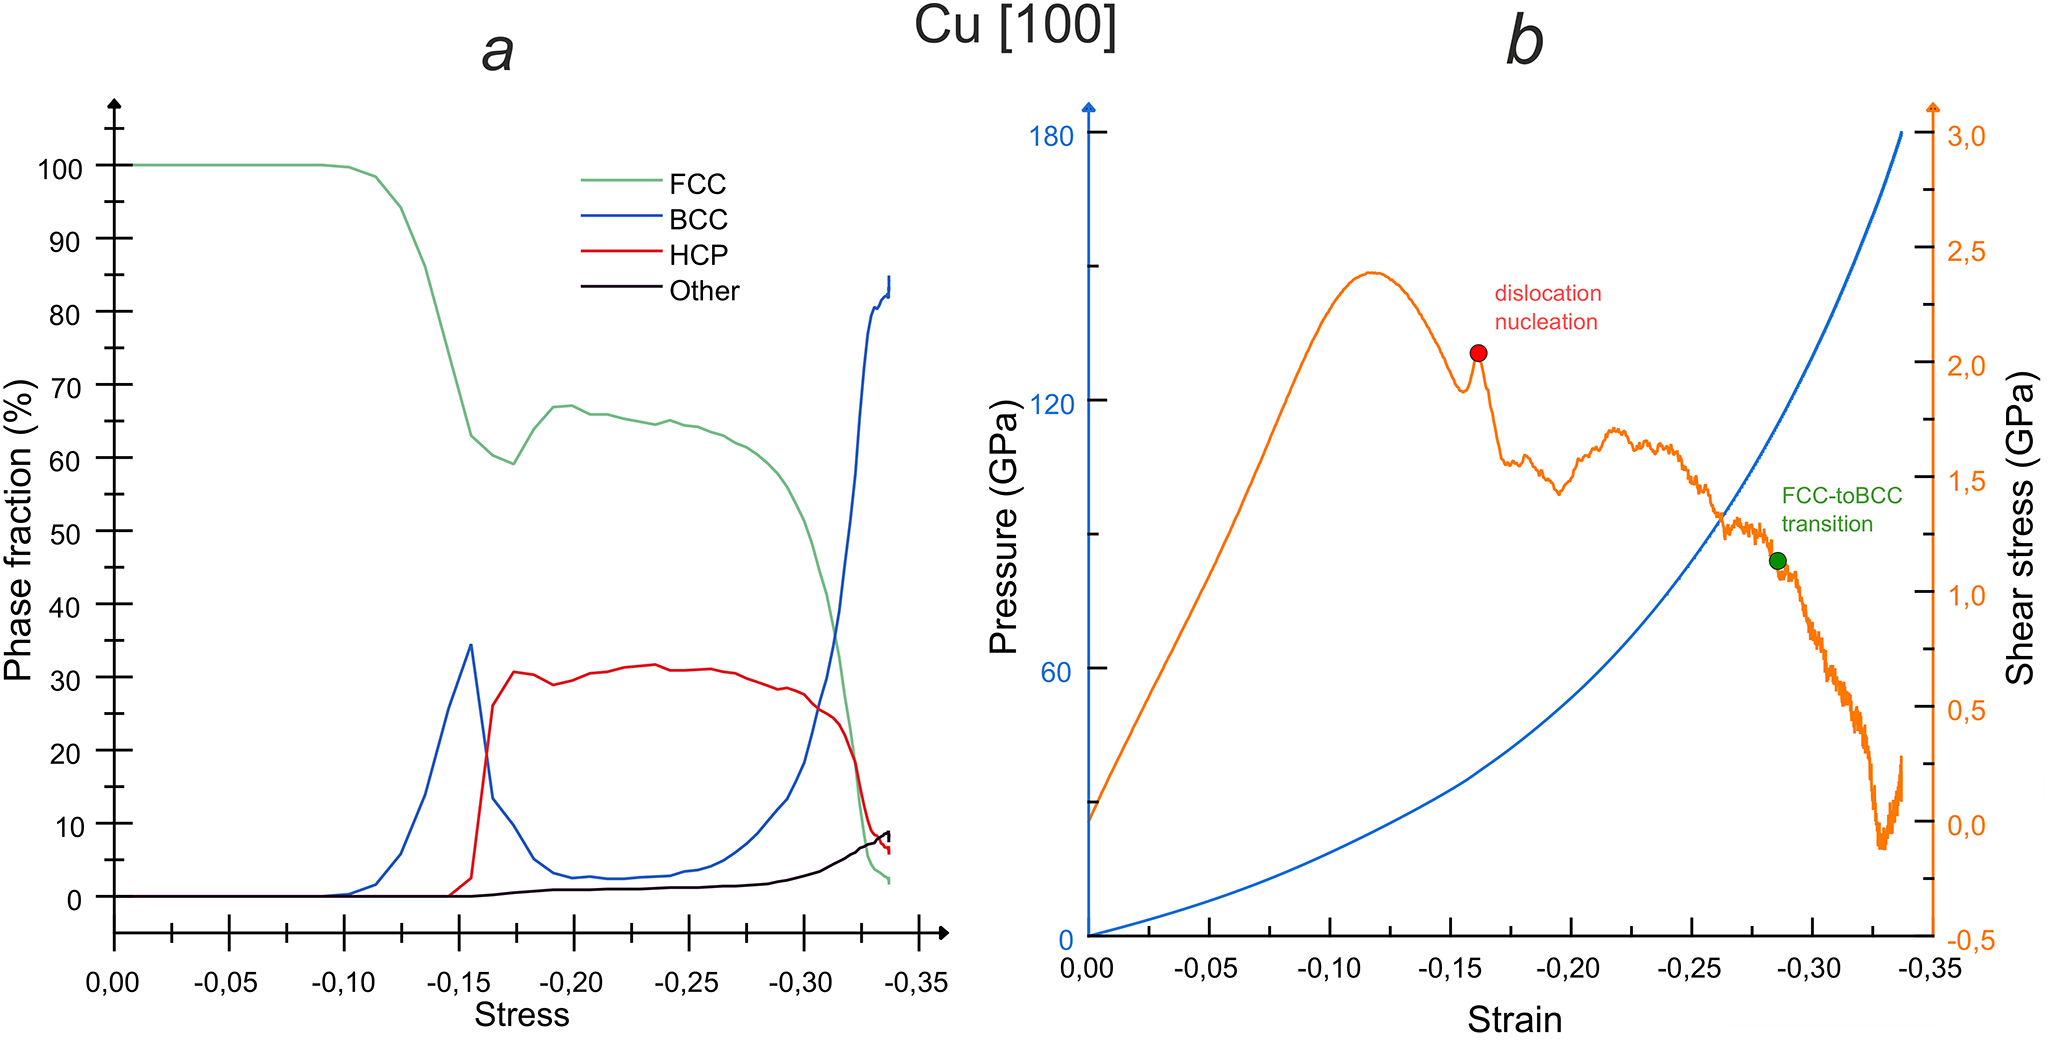
Figure 5: Evolution of (a) phase composition and (b) pressure and shear stress for copper single crystal during a Hugoniostat simulation up to a target stress of 180 GPa applied along [100] direction. The red dot in (b) marks the onset of dislocation nucleation (and growth of the HPC phase in (a)), and the green dot marks the FCC-to-BCC phase transition (and growth of the BCC phase in (a))
Next, we will compare the obtained results of MD simulations for FCC-to-BCC transition with the existing experimental data and theoretical calculations. Quasi-static measurements in diamond anvil cell [59] showed stability of FCC phase till 150 GPa, which completely corresponds to our results for all loading directions: even for the most favorable [100] loading, the growth of BCC phase starts at pressures above 150 GPa. In Ref. [5], using the shock waves induced by a laser irradiation of copper foils, it was shown based on X-ray-diffraction (XRD) data that the FCC-to-BCC phase transition is observed above 180 GPa. A similar experimental study was conducted in the work [6] where at a pressure of 185 GPa both the FCC and BCC phases were observed, while in the stress range of 197–220 GPa only the BCC phase was detected, and, finally, at a stress value of 280 GPa, melting of the material was observed. Our MD simulations show the BCC phase transition at a pressure about 180 GPa for the [100] direction [Fig. 4a] and also for close directions [114] and [401], while for the latter even for stresses of about 200 GPa the BCC and FCC phases coexist. For the majority of loading directions, the maximum of BCC phase occurs at pressures of 220–230 GPa, however, at such pressures, melting of the material begins, which also reduces the fraction of the FCC phase in the crystal and, in fact, molten material and the BCC phase coexist. This fact can explain that, in the experiment [6], in the range of 197–220 GPa only the BCC phase is detected. It is important to mention that, in the experiment, melting may begin at a lower pressure, since experiment unlike MD works with not a perfect single crystal, and existing defects can reduce the melting threshold. According to the melting curves [60–62], the Hugoniot states exceed the melting temperature for SW pressures above 230–250 GPa [23], which is close to our results. In the case of polycrystalline samples, the most favorably oriented grains ([100] orientation) must show the traces of FCC-to-BCC phase transformations at first.
Fig. 6a shows a correspondence of the shock adiabats for BCC—containing states given by our MD simulations at different loading directions with those obtained in the laser shock experiments [5,6]. Our data contain both the points of the maximum fraction of BCC phase and the ranges with a substantial fraction of BCC phase. Fig. 6b shows a phase diagram in the case of copper taken from Ref. [6] with additional points corresponding to the states with the maximum of BCC phase in our MD simulations. Most of our points except those for [100], [114] and [401] loading directions lay above the melting curve, which explains the coexistence of BCC and Other phase in Fig. 4. In the case of the directions [100], [114] and [401], the beginning of melting indicated as the growth of the Other phase in Fig. 4a,f,j occurs at substantially higher pressures than the reaching the maximum of the BCC phase; therefore, we see that the points for these loading directions are below the melting curve on the phase diagram in Fig. 6b.
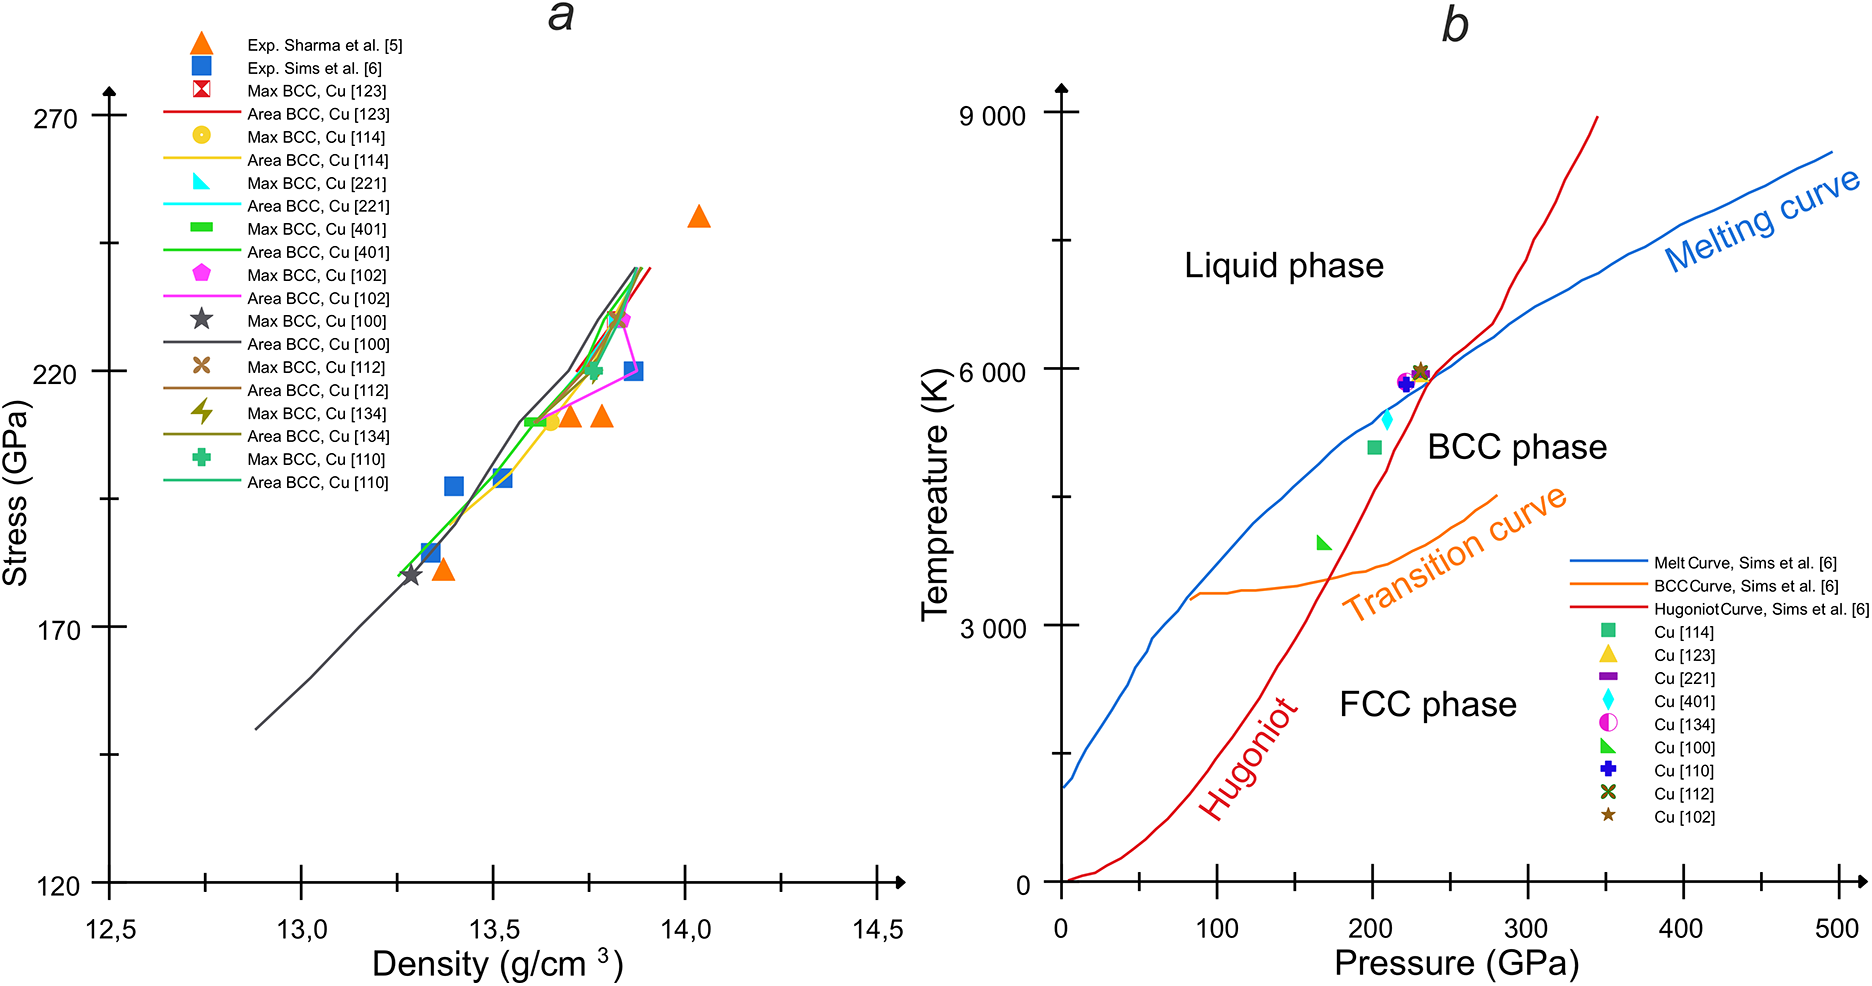
Figure 6: (a) Comparison of the experimental data [5,6] for the BCC phase transition states in copper under the shock-wave loading conditions with our MD simulations for different loading directions: the dots indicate the states of the material in the MD for each direction in which we observe the maximum fraction of the BCC phase, and the lines of the same color indicate the neighborhoods in which we observe the growth and decline of the BCC phase. (b) Phase diagram for copper with the melting curve, the Hugoniot adiabat and the FCC-to-BCC transition curve from Ref. [6] with our MD points for the maximum of the BCC phase for each direction
The absence of BCC phase up to 1150 GPa was reported in [63] based on ramp compression experiments in the approximation of isentropic compression. Later experiments [23] with estimation of temperature confirmed stable FCC phase at 400 GPa, but did not confirm it at 1000 GPa, because the real temperature occurred much higher than that was predicted from the isentropic approximation leading to indistinguishability of FCC- and BCC-produced signals. The higher stability of FCC phase at ramp compression is explained by lower temperatures compared with the SW loading [23]. For instance, our previous MD simulations of isothermal close-to-hydrostatic compressions showed stability of FCC copper up to 500 GPa [14].
As is known, the stability of the crystal lattice can be assessed using the Born stability criterion (in an unloaded material) and the elastic stability criterion (in the case of loading the material) [64]. Both criteria relate lattice stability to elastic moduli. The elastic stability criterion for a cubic lattice under uniaxial compression is as follows [65]:
where
Shock wave velocity and particle velocity for aluminum and copper loaded in different lattice directions are analyzed in Figs. 7 and 8, respectively. At pressures below 20–40 GPa depending on the loading direction, Fig. 7a,c shows the elastic SWs in aluminum, which velocity starts from the longitudinal sound speed in the acoustic limit. Due to the crystal anisotropy, the elastic part of the shock Hugoniot for [100] loading is the lowest, while that for [111] loading is the highest with the difference of about 0.6 km/s (8%) between them in the case of aluminum. Other directions reveal gradual transition between these two opposite cases Fig. 7a,c. The elastic shock Hugoniot for [100] direction in the acoustic limit is close to the longitudinal sound velocity obtained in Ref. [69] using the ultrasonic method as well as to our previous calculations of the elastic shock Hugoniot on the bases of DFT-informed tensor equation of state [44]. At higher pressures, the shock Hugoniots converge to the plastic branch asymptotically outgoing from the bulk sound speed. The plastic branch is substantially the same for all loading directions, because it reflects volumetric compression without considerable shear. This part of shock Hugoniot is in line with the experimental data [70]. The elastic and plastic SWs form characteristic two-wave structure of the shock front in solids with elastic precursor, which amplitude is restricted by the dynamic plastic deformation. In our case, the high threshold of the elastic-plastic transition is explained by the initial perfect structure of single crystal requiring homogeneous nucleation of dislocation as the plasticity incipience; in materials with initial defects, this transition occurs at lower stresses. For the [100], [114] and [401] directions, the dislocation nucleation threshold for aluminum is about 20 GPa, which is significantly lower than that for other compression directions. For the [111] direction, the dislocation nucleation threshold is the highest consisting of 40 GPa, and the dislocation density in the FCC lattice is the highest, because this high dislocation density is necessary to relax the strong accumulated shear stress. For the remaining loading directions, the elastic-plastic transition occurs at a target stress of about 30 GPa. After the FCC-to-BCC phase transformation, the newly formed BCC phase is also subjected to the dislocation plasticity expressed as the non-zero dislocation density in the BCC phase.
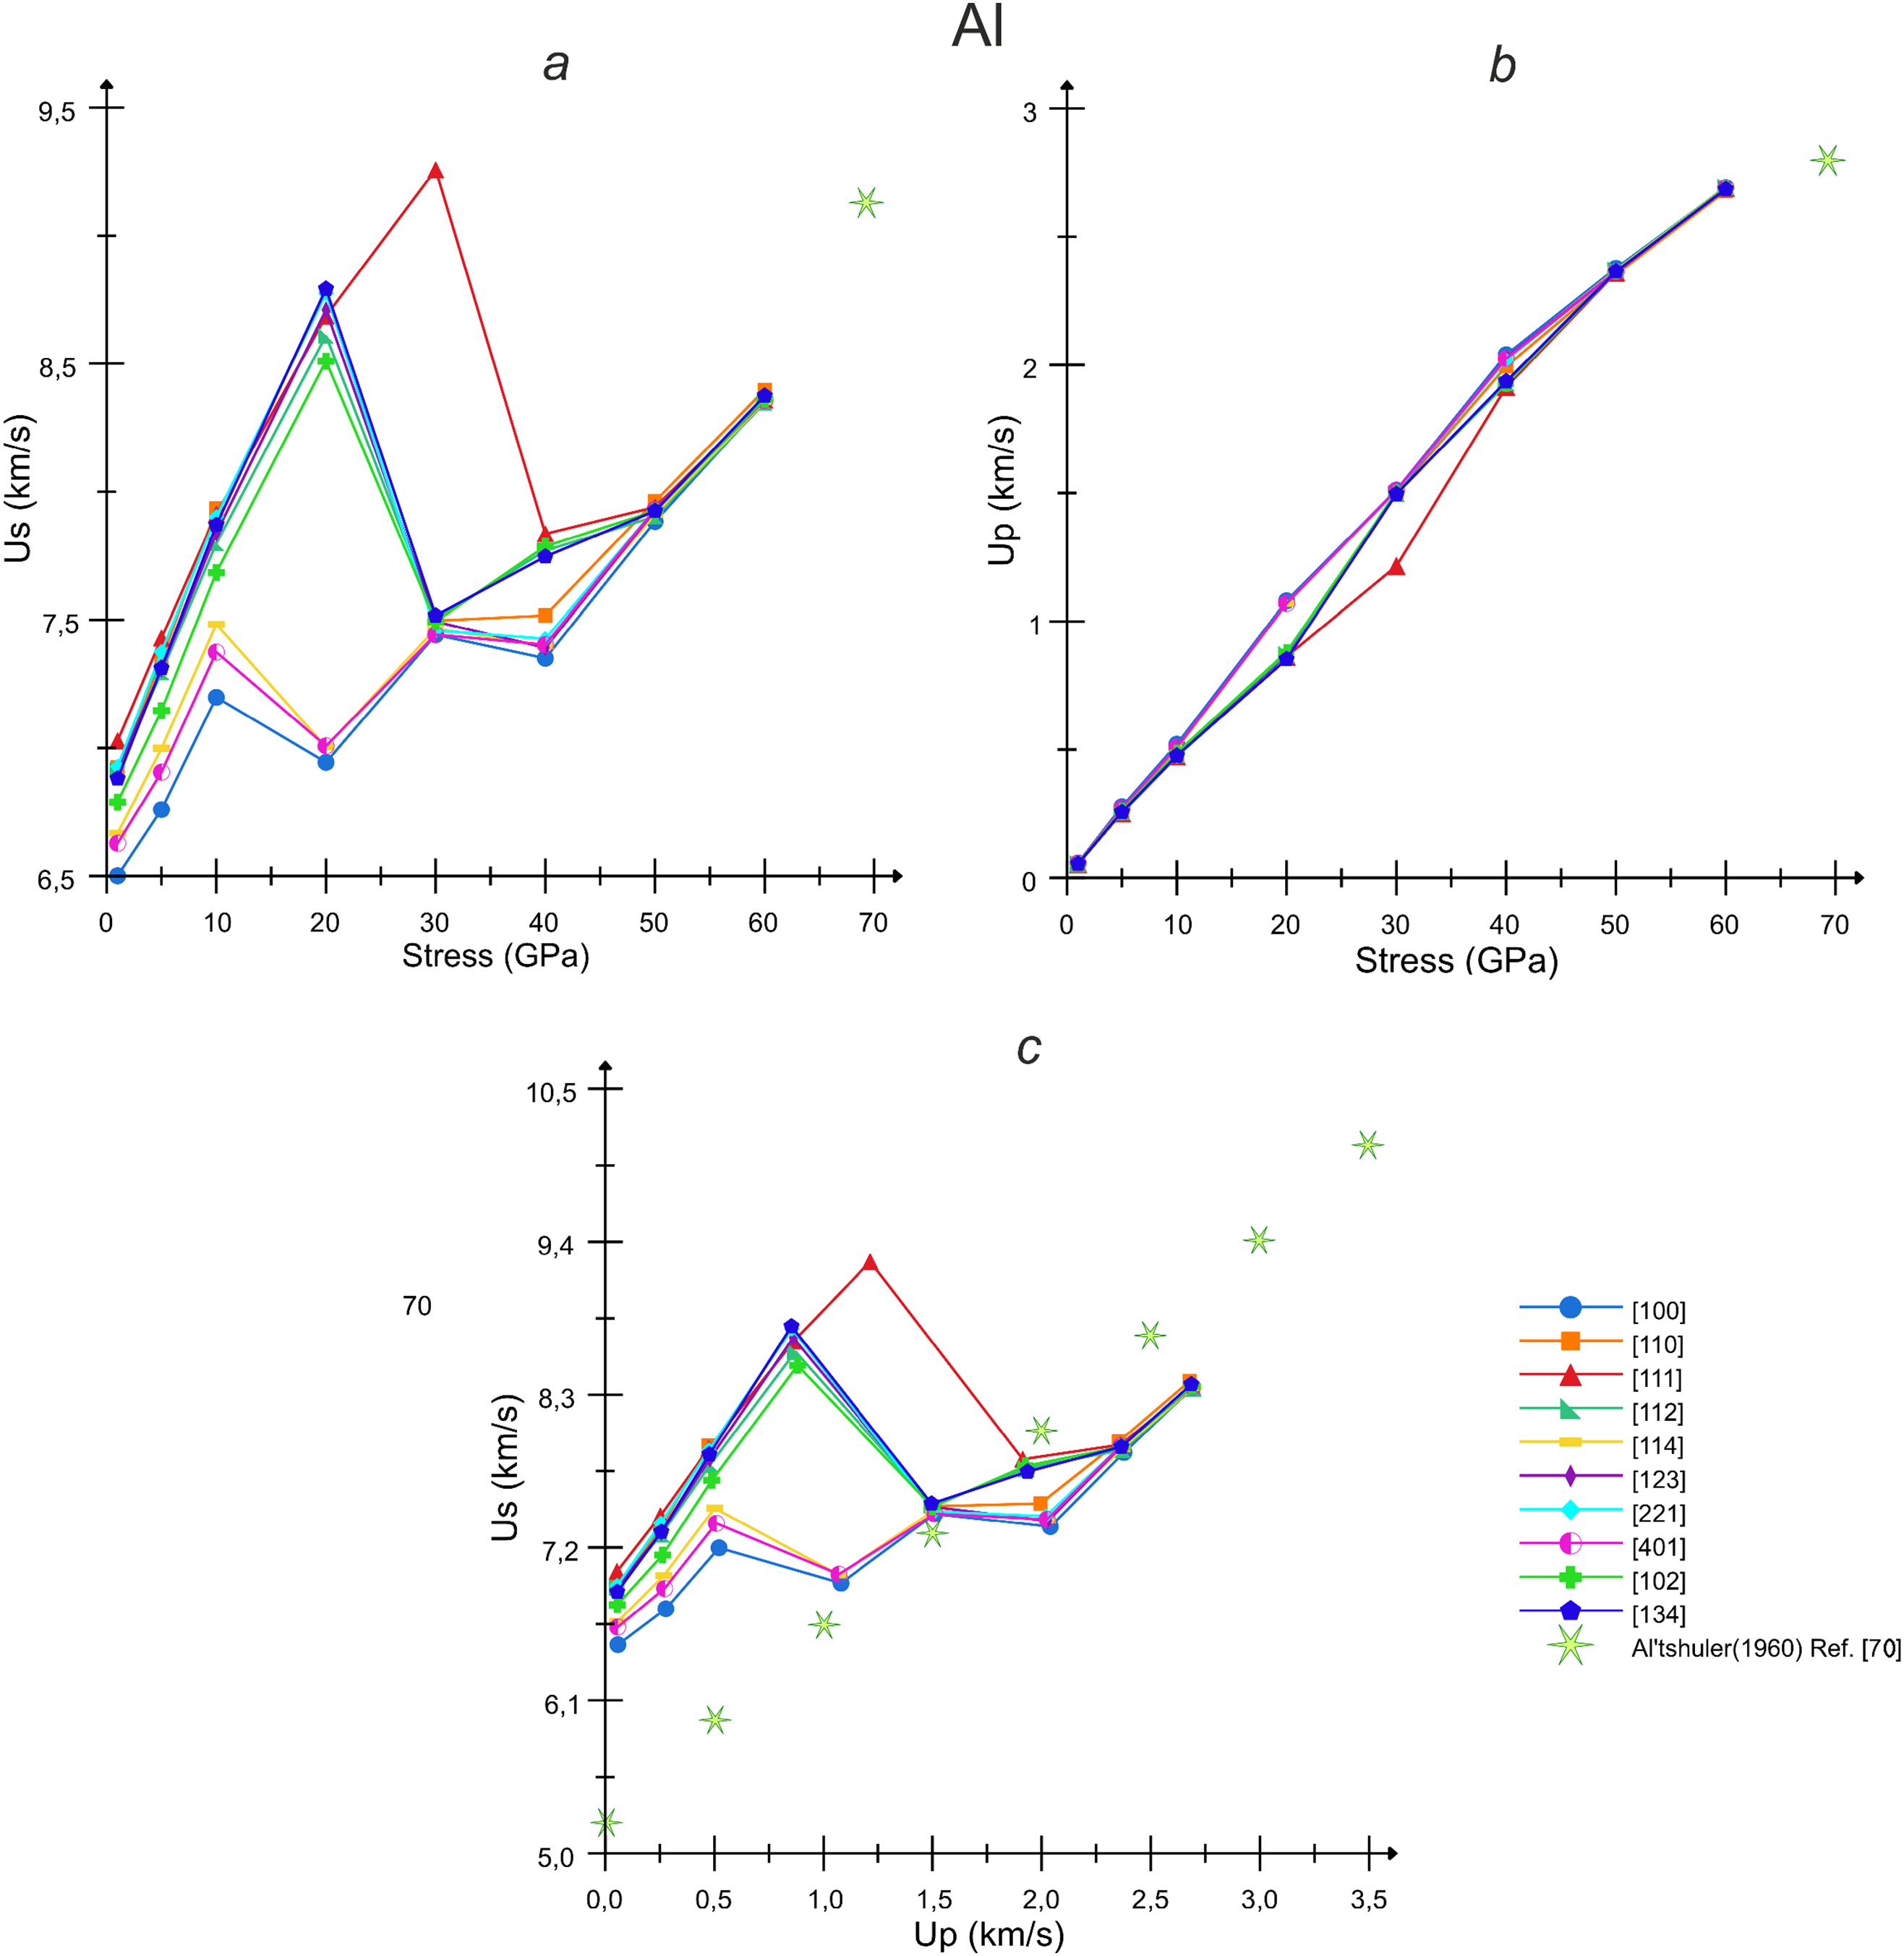
Figure 7: Calculated shock Hugoniots of aluminum for different loading directions in the coordinates: (a) compressive stress–SW velocity, (b) stress–particle velocity and (c) particle velocity–SW velocity. The experimental results are taken from [70]
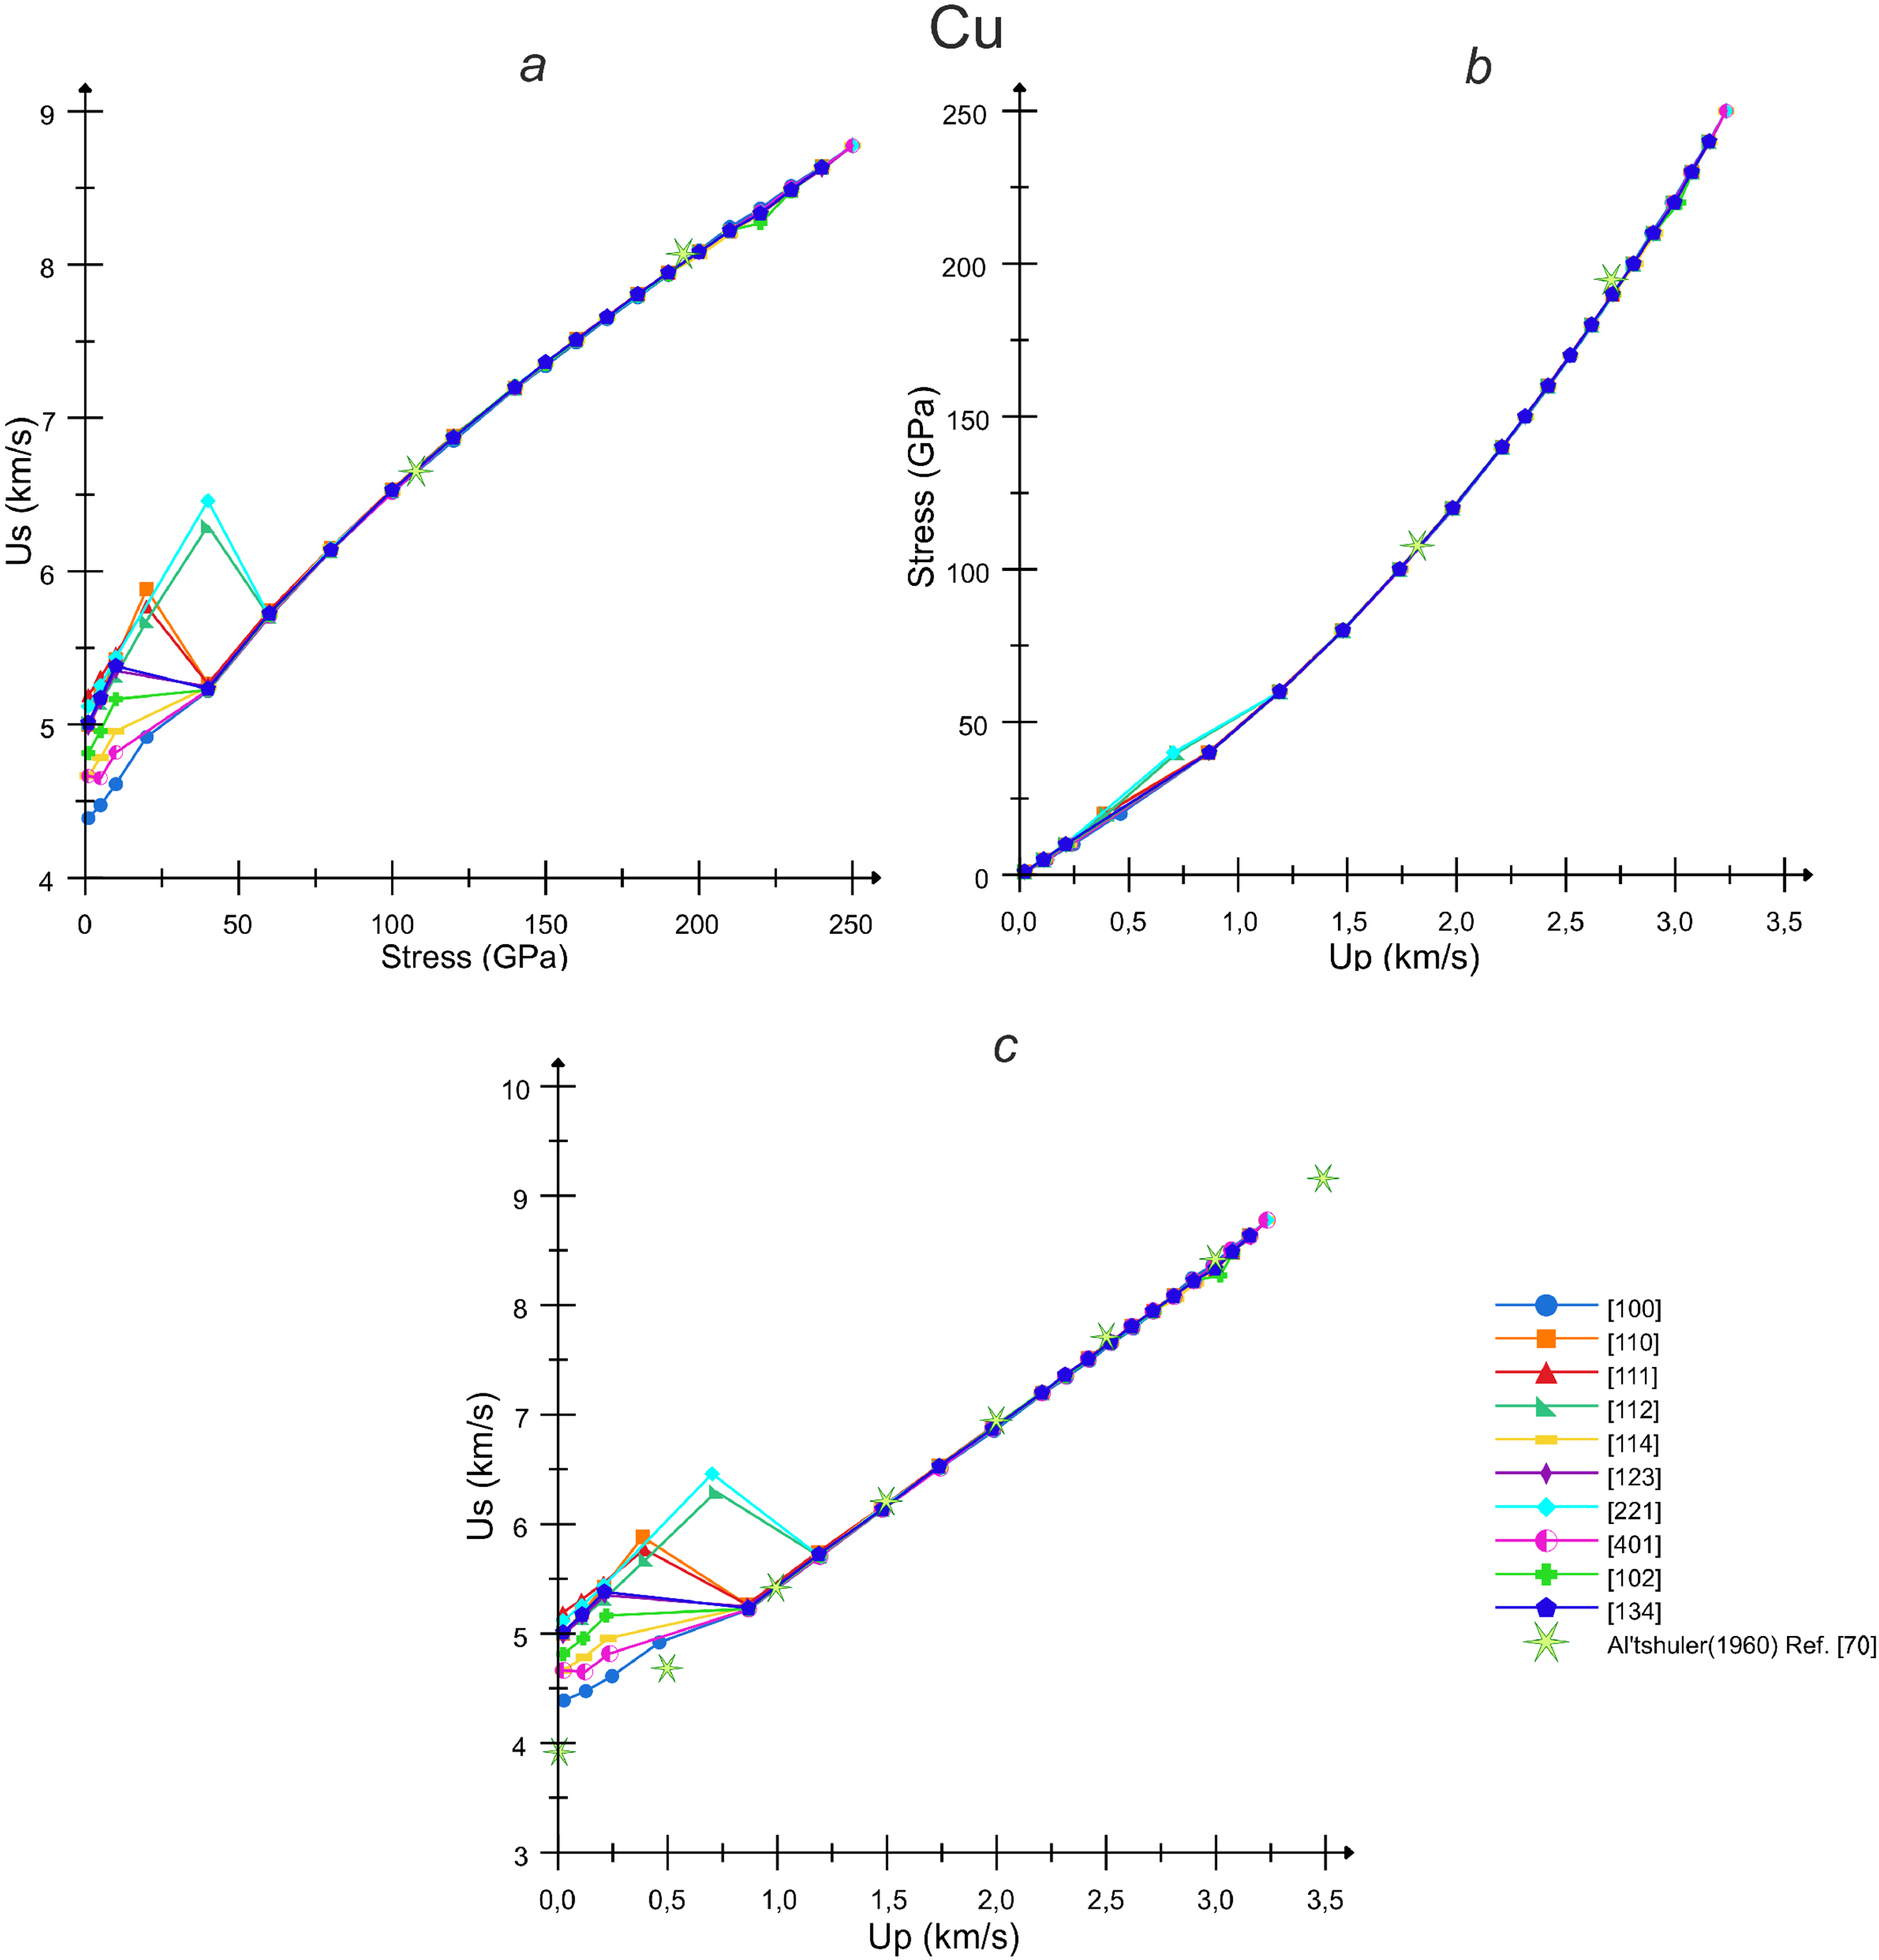
Figure 8: Calculated shock Hugoniots of copper for different loading directions in the coordinates: (a) compressive stress–SW velocity, (b) stress–particle velocity and (c) particle velocity–SW velocity. The experimental results are taken from [70]
Similar to the case of aluminum, the calculated shock Hugoniots of copper in Fig. 8a,c reflects strong anisotropy in the region of elastic SWs. The [100] direction also shows the lowest elastic SW velocity, while the [111] direction and the close ones exhibit the highest deviation from the hydrostatic (plastic) branch. Acoustic limits of the elastic shock Hugoniots for [100], [110] and [111] directions agree well with the experimental longitudinal sound speeds for these crystallographic directions in copper taken from the literature [71]. In contrast with aluminum, the difference between the [100] direction and other directions is much more significant and reaches about 0.8 km/s (15%). Besides, the difference in the elastic shock Hugoniot and the plastic one is only about 0.2 km/s for [100] direction [Fig. 8a,c], which is in line with our calculations with DFT-informed tensor equation of state [44]. Such small shock wave velocity difference leads to a less pronounced elastic precursor in copper single crystals loaded in [100] direction [4,72,73]. The calculated plastic branch of shock Hugoniot matches well with the experimental data from [70] verifying our results. MD simulations show high dislocation activity in the FCC phase of copper, while that in the high pressure BCC phase is revealed only for the [100] loading, because for other loading directions, the BCC phase is quite transitory.
4 Neural Network Model of Phase Composition in Shock-Compressed Copper
This section presents the results of the machine learning model described in Section 2.2. The training parameters are given in Table 1. The accuracy of the trained model in terms of MAE (mean absolute error) is 0.14 on the test data and 0.17 on the training and validation data. The correlation curves of the trained model on the entire data set are shown in Fig. 9 for each output of the neural network. In general, almost all points lie close to the diagonal line. Some outliers are associated with both a limited dataset for training and the fact that the phase composition can differ quite significantly depending on the directions of the loading in copper. During the model training process, we also sought to achieve the lowest possible error on the test data (Fig. 9a), ensuring that the ML model accurately describes data outside the dataset. The model results presented in Fig. 10 show that the model captures the main data trends despite the existing outliers on the training dataset (Fig. 9b).
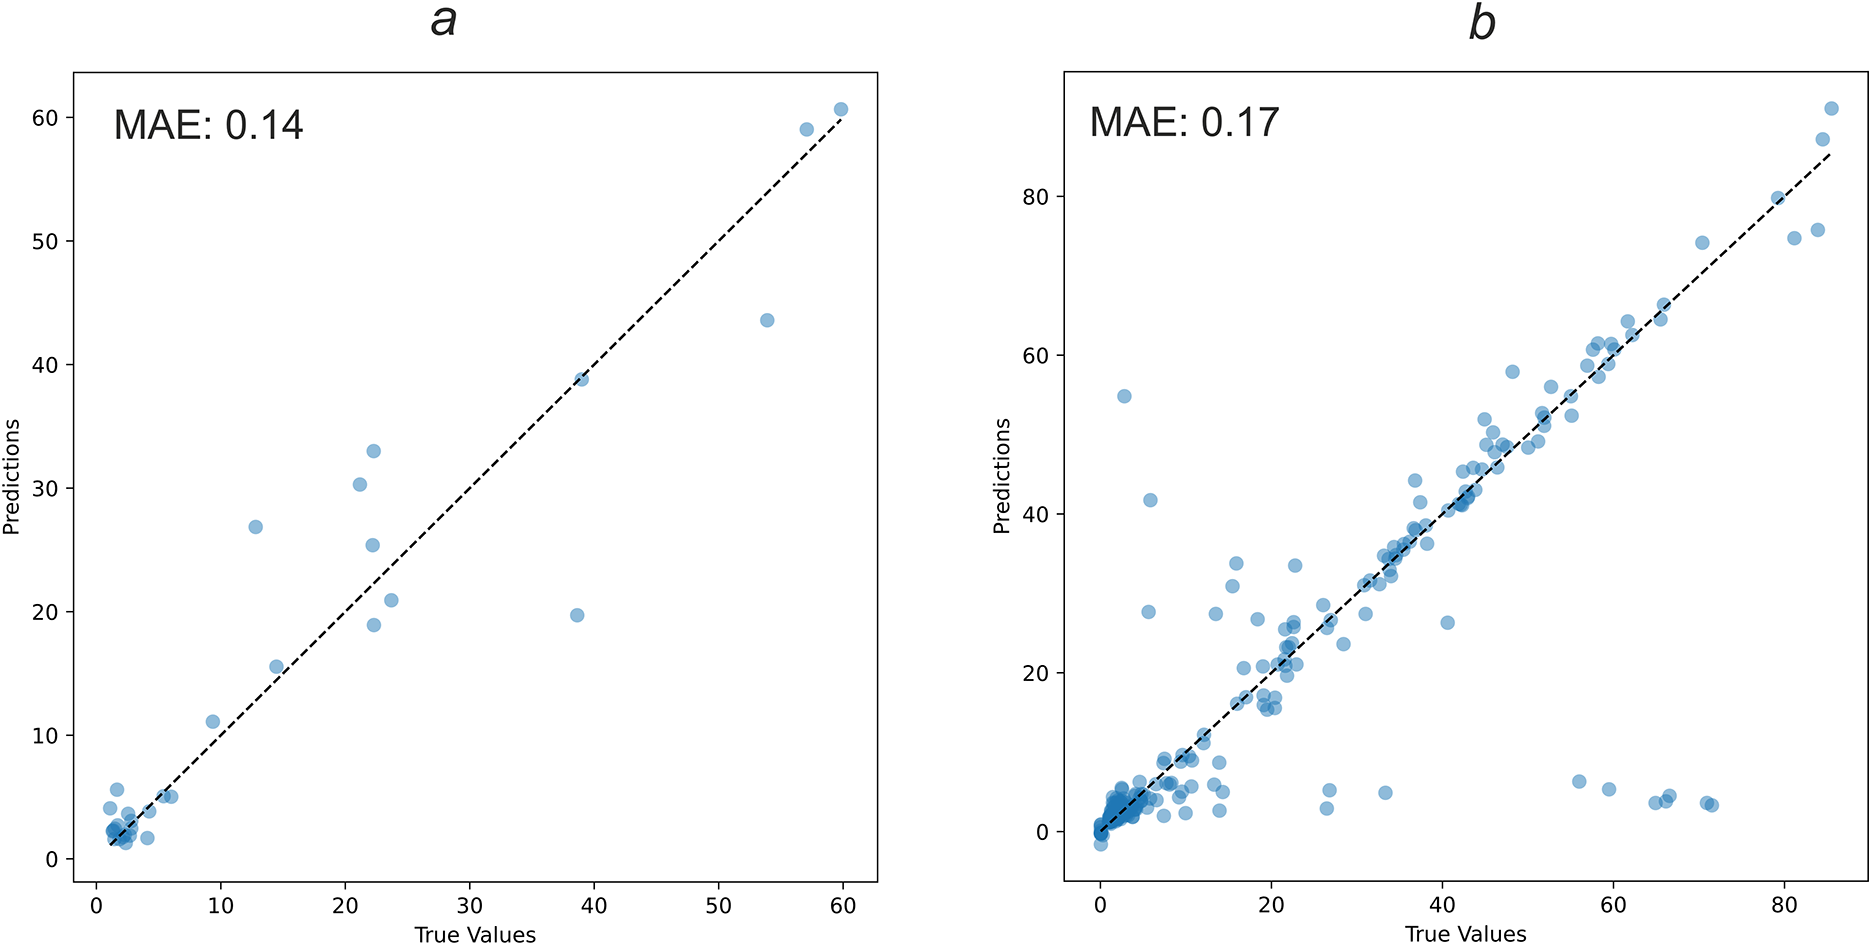
Figure 9: Correlation curve of the trained machine learning model on: (a) test data; (b) training and validation
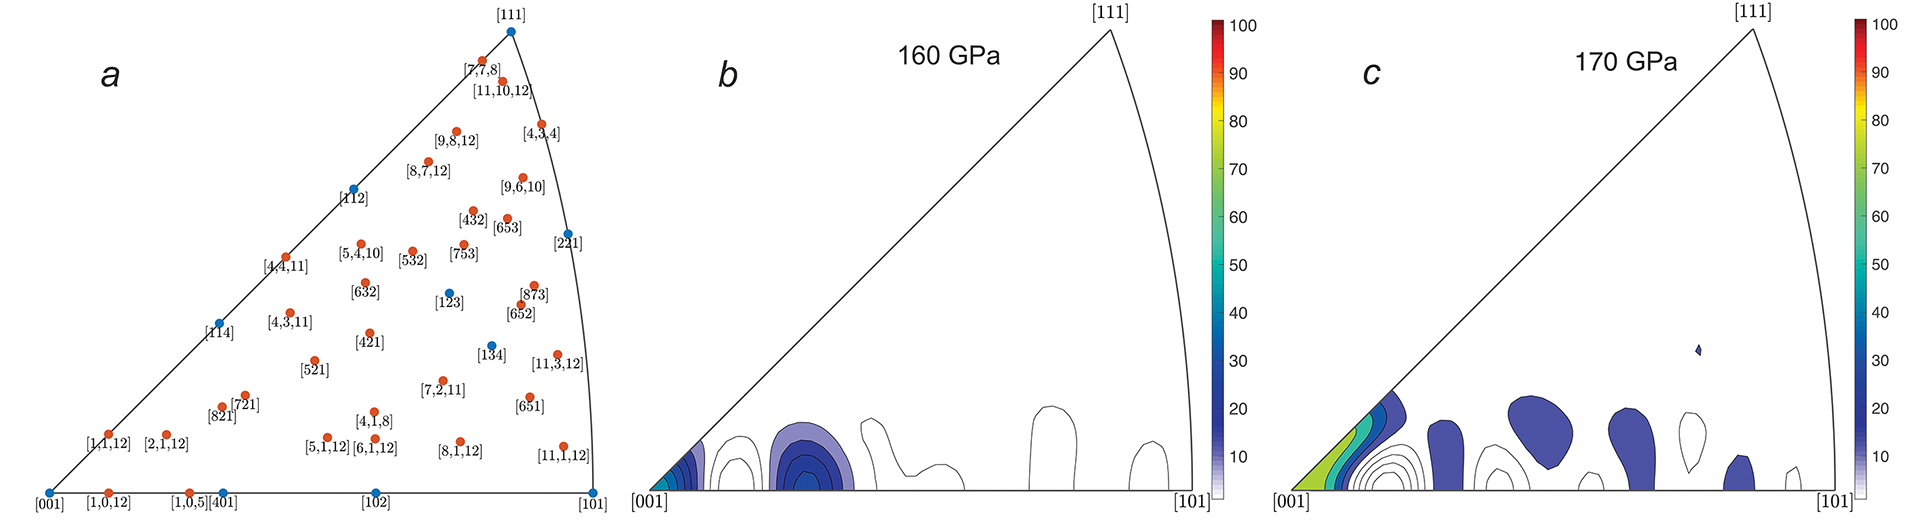
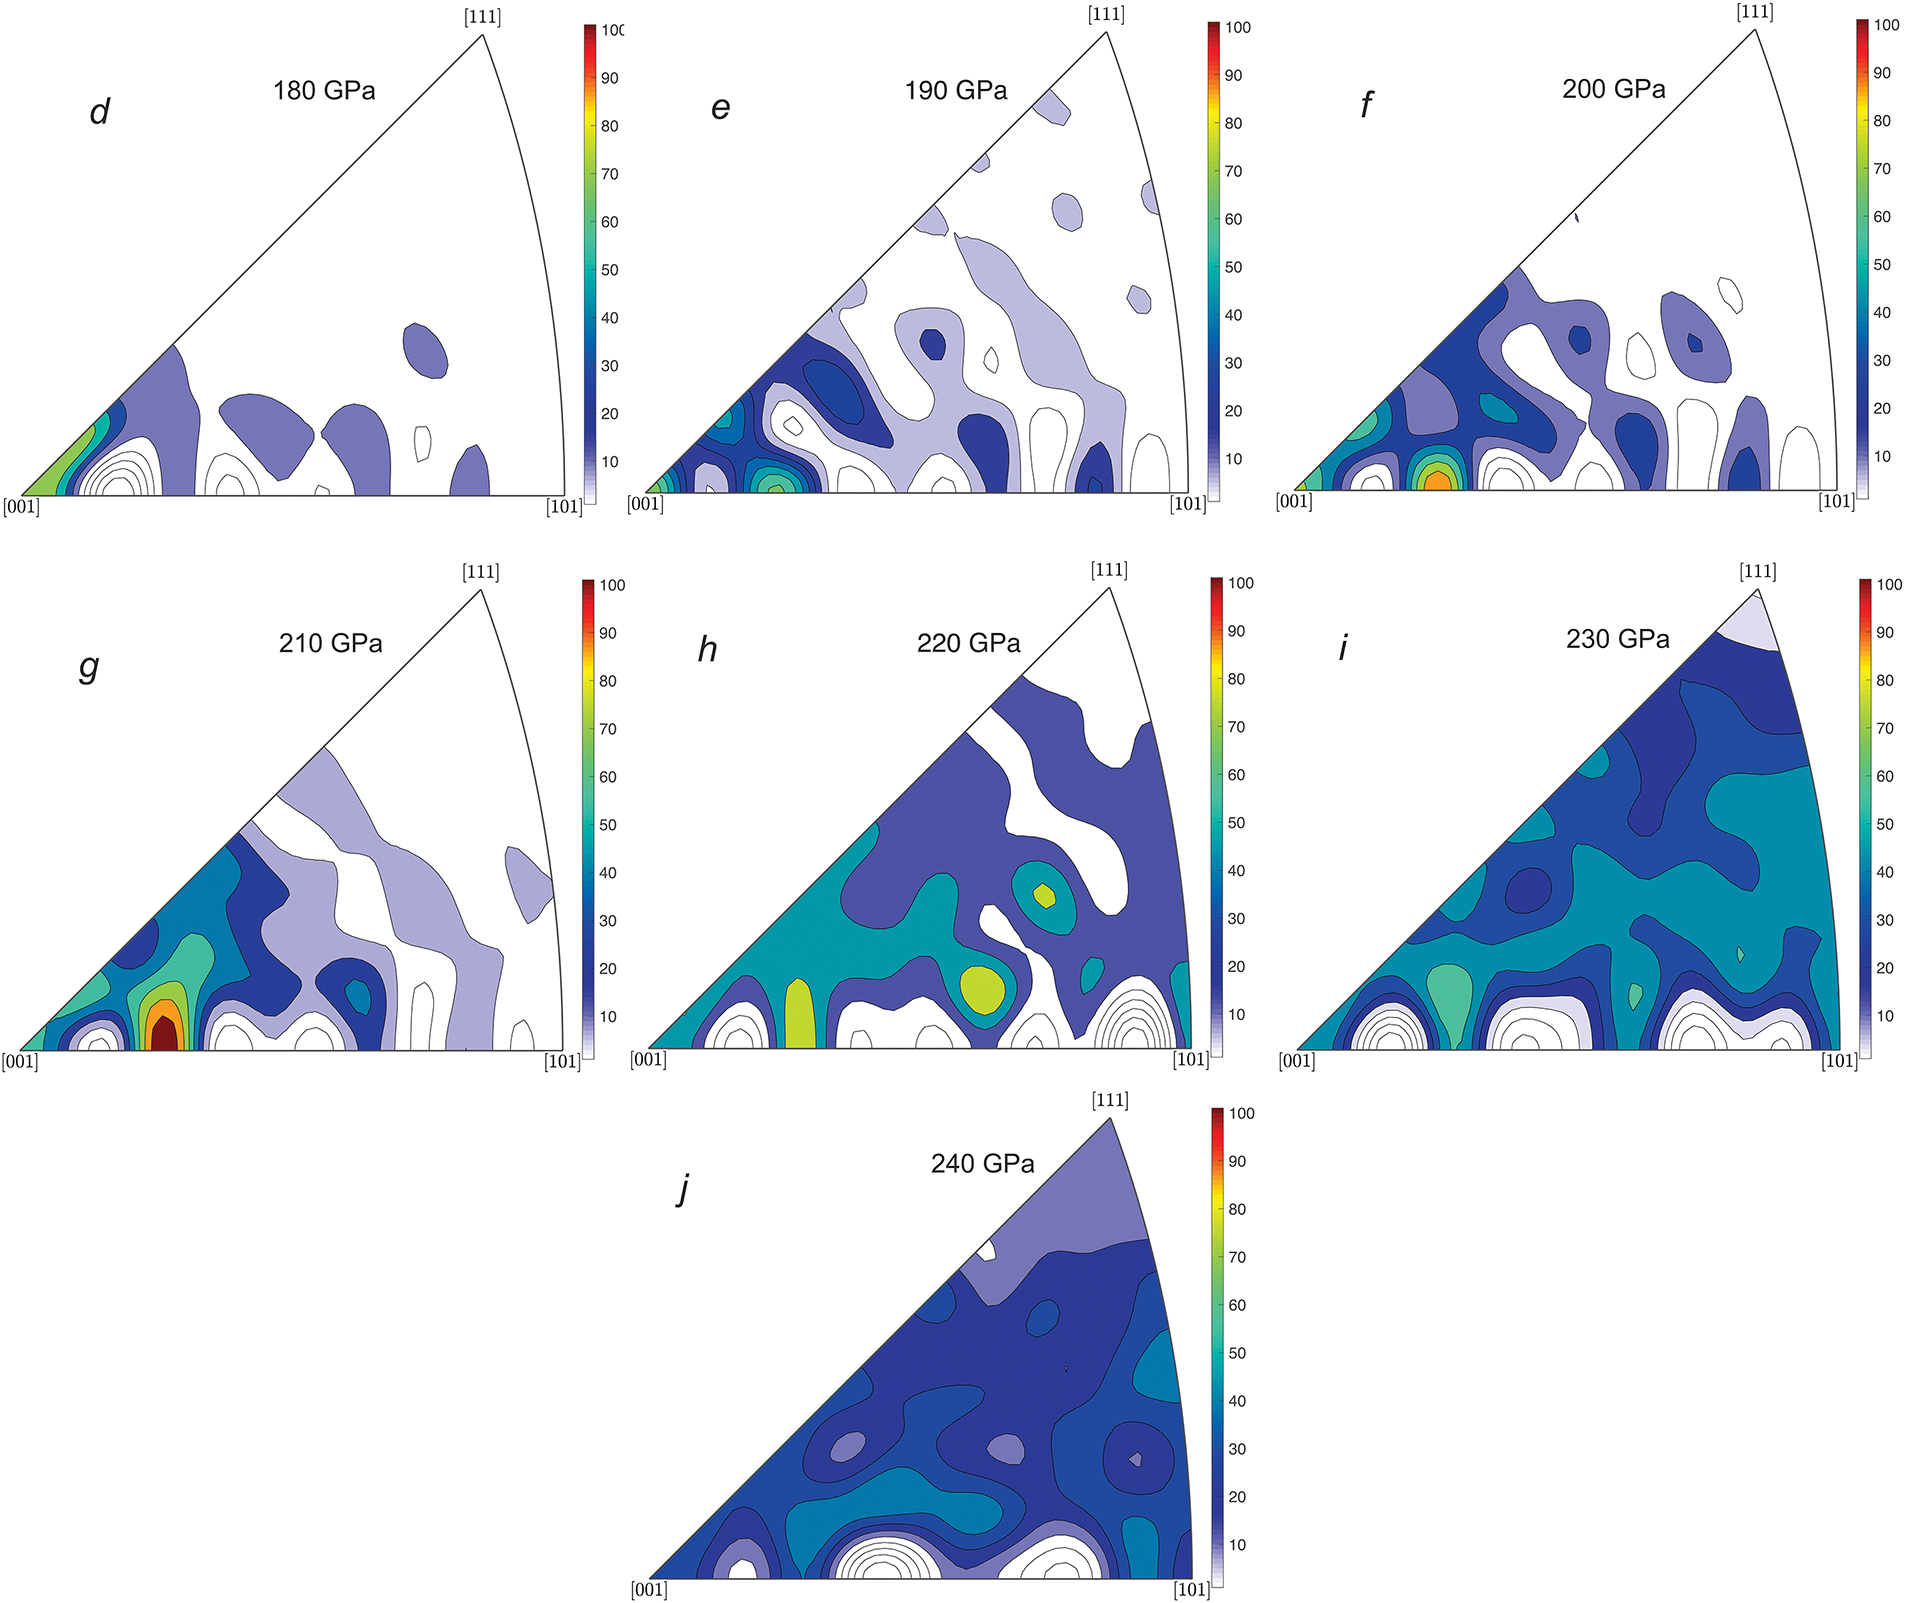
Figure 10: ML-model-predicted stereographic maps of fraction of BCC phase in a copper single crystal compressed by a shock wave to different stress levels as indicated in the figure. Panel (a) shows the crystallographic directions used in the training, validation and testing datasets of the ML model, where the blue dots indicate the directions shown in Fig. 4, and the light blue dots indicate some points from the rest of the data set. Panels (b–j) show the stereographic maps predicted by the machine learning model over the stress range from 160 to 240 GPa with a step size of 10 GPa
Based on the trained machine learning model, stereographic maps are constructed for a copper crystal, which show the distribution of the BCC phase at different stress values: 160, 170, 180, 190, 200, 210, 220, 230 and 240 GPa as shown in Fig. 10. Stereographic projections are constructed using the mtex library (https://mtex-toolbox.github.io) in the Matlab language. To construct the projection, all MD data and an additional dataset of 1000 crystallographic orientations with ML-predicted phase fractions were used. The additional crystallographic orientations were calculated as a combination:
where
5 Direct MD Simulations of Shock Wave in Copper Crystal
The Hugoniostat calculations used in the main part of this paper are obtained as a result of bringing the atomistic system to the energy and stress obtained through the Rankine-Hugoniot relation for the state of the system behind the shock wave front. To compare the results obtained by this method, we also perform direct MD simulations of a shock wave in a copper crystal. The copper crystal is chosen because of interplay between FCC-to-BCC phase transition and melting.
Analysis of the existing works with direct MD simulation of shock wave in copper applying a piston method shows that FCC-to-BCC transition mainly occurs at somewhat lowered stresses, which do not correspond to experimental data of Refs. [5,6] shown in Fig. 6a. For instance, classical non-equilibrium molecular dynamics (NEMD) simulations of Ref. [13] revealed the maximum BCC phase fraction reaching about 80% at the piston velocity of 1.8 km/s for [100] loading and only about 25% at 2.5 km/s for [110] loading, while the BCC phase was almost absent in the simulations for [111] direction. In Ref. [15], based on NEMD and Multi-Scale Shock Technique (MSST) modeling of a shock wave in a copper crystal in the [100] direction, the FCC-to-BCC transition is shown, the maximum of which is observed at a stress of 100 GPa, and melting of the material is also observed starting from this pressure. This work also compares virtual X-ray diffraction technique (XRD) profiles of atomistic systems with experimental data [5]. The profiles agree well, but with a difference in the observed stresses in the range of 20–30 GPa (the stresses in the experiment are higher). The authors of Ref. [20] also used NEMD and MSST techniques to model the shock waves in copper crystals; for [100] loading, a significant fraction of BCC phase was observed at the piston velocity of 1.8 and 2.0 km/s. For [110] loading, this range is displaced to 2.0 and 2.5 km/s, while for [111] loading, the BCC phase was almost not observed. In all these cases, a piston was used to rigidly move the substance on one side of MD system, which leads to formally infinite strain rates at the initial time moment. Such action creates a non-stationary shock wave evolving to a stationary state with a strain rate decreasing with time on the SW front as discussed in Ref. [74]. The FCC-to-BCC transition and the subsequent melting occur throughout the entire volume of the crystal. Somewhat different results are shown by the MD simulations under ramp loading mimicking the action of laser radiation; in this case the piston velocity gradually increases in time up to the maximum value. Because the laser-generated stress waves are mostly of short duration, unloading to the relaxed state is often taken into account as well. Ref. [19] considered propagation of a laser-generated stress wave in [100] direction of copper single crystal by means of MD simulations. The BCC phase was observed only behind the stress wave front at stresses of 130–170 GPa, while the remaining part of the crystal contains only the traces of plastic deformation. All these considered studies used the same interatomic potential of Ref. [35] as we do.
In addition to Hugoniostat simulations, we carry out direct MD simulations of the SW propagation in copper under both abrupt and ramp loading. In the case of ramp loading, the impact pulse is stretched over time, from the minimum to the maximum value. A copper system with a number of atoms of about 80,000,000 and dimensions of 1000 × 30 × 30 nm3 is considered; the coordinate axes are directed along the basic crystallographic orientations [100], [010] and [001]. In the case of abrupt loading, the atoms in a 2-nm-thick left part of the crystal are assigned a constant velocity of 2.7 km/s. In the ramp compression simulations, the velocity of the atoms in this layer is linearly increased from zero to 2.7 km/s over 30, 80 or 150 ps with an increment of 1 ps. The same interatomic potential for copper [35] is used here as in the first part of the work. In order to plot stress, temperature and shear stress distributions, the binning method is used by averaging the parameters in 1-nm-thick layers (bins) along the shock wave propagation axis. The phase composition is calculated using the “Polyhedral template matching” algorithm [42] with the bin size of about 5 nm.
The results of direct MD simulations of ramp loading are presented in Figs. 11–13. The ramp loading is more physically consistent with the laser-induced SWs used for probing extreme properties of materials. The first two figures show the results for the same maximum piston velocity of 2.7 km/s and different pulse rise times: 80 ps in Fig. 11 and 150 ps in Fig. 12. In both cases we see that the formation of BCC phase occurs only in a local region behind the shock wave front [Figs. 11e and 12e]. For the shorter rise time of 80 ps, melting of the material (predominant Other phase) occurs at the distances of 450–650 nm in Fig. 11e and plastic deformation (large fraction of HCP atoms) occurs at the distances of 250–700 nm in Fig. 11e. For the longer rise time of 150 ps, one can see only plastic deformation of the crystal beyond the FCC-to-BCC transition region (Fig. 12). In both cases, the temperature in the crystals is close to the value defined by the Hugoniot adiabat only at the SW front [Figs. 11d and 12d], while in the rest of the crystal it gradually varies. For both systems, we see relaxation of shear stresses in Figs. 11c and 12c behind the SW front. The maximum compressive stress in the system is about 180 GPa [Figs. 11b and 12b], which is sufficient to initiate phase transition under conditions of Hugoniot adiabat. However, according to the phase diagram for copper [Fig. 6b], the BCC transition occurs on the Hugoniot curve at temperatures in the range of 4000–6000 K, but high temperature values in combination with a stress value of about 180 GPa are observed under ramp loading only at the SW front, which may explain why we see the BCC phase transition only in this region. At a somewhat higher impact velocity of 2.9 km/s and a pulse rise time of 150 ps (Fig. 13), the same behavior of the system is observed as in the previously considered cases, only the maximum stress in the material is about 210 GPa.
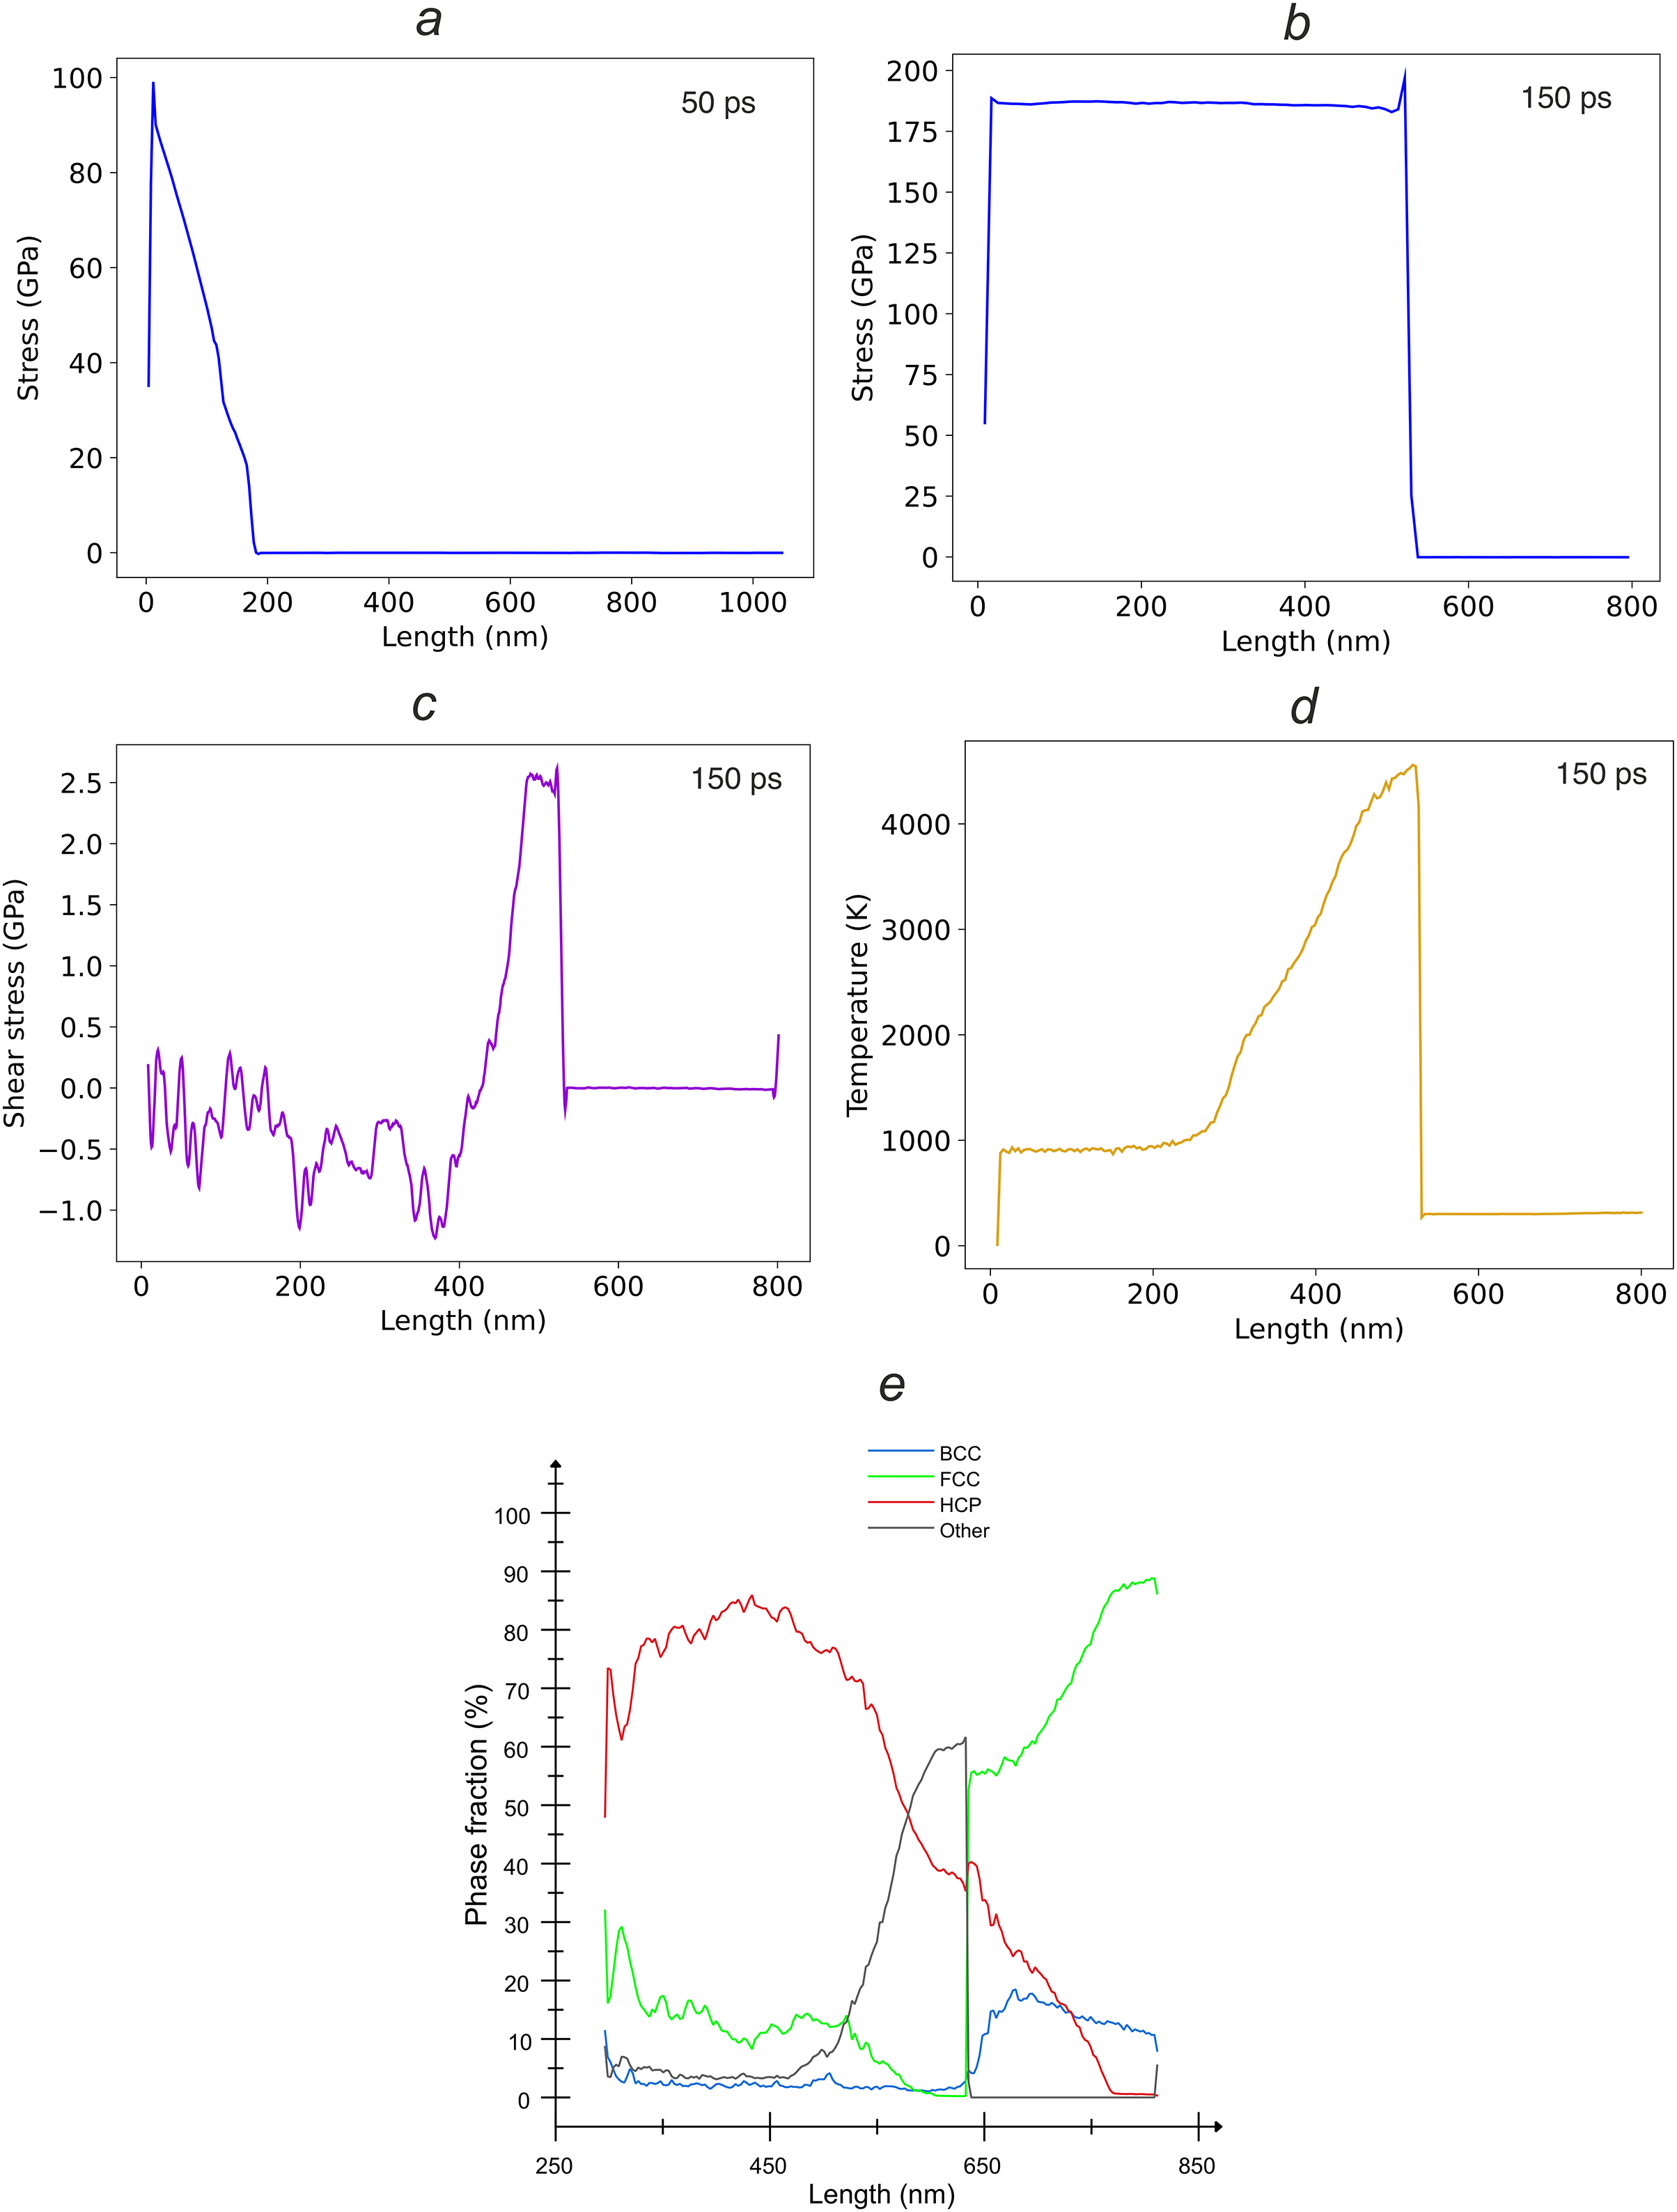
Figure 11: Direct MD simulation of ramp loading of a copper single crystal with [100] orientation, the maximum piston velocity is 2.7 km/s and the pulse rise time is 80 ps: (a) an increase in the stress value in the crystal at a simulation time of 50 ps; (b) the stress profile in the system at 150 ps, when the shock pulse is completely transmitted and further propagation of the shock wave along the crystal occurs; (c) the shear stresses distribution in the shock wave at 150 ps; (d) the temperature distribution at 150 ps; and (e) the phase composition at 150 ps
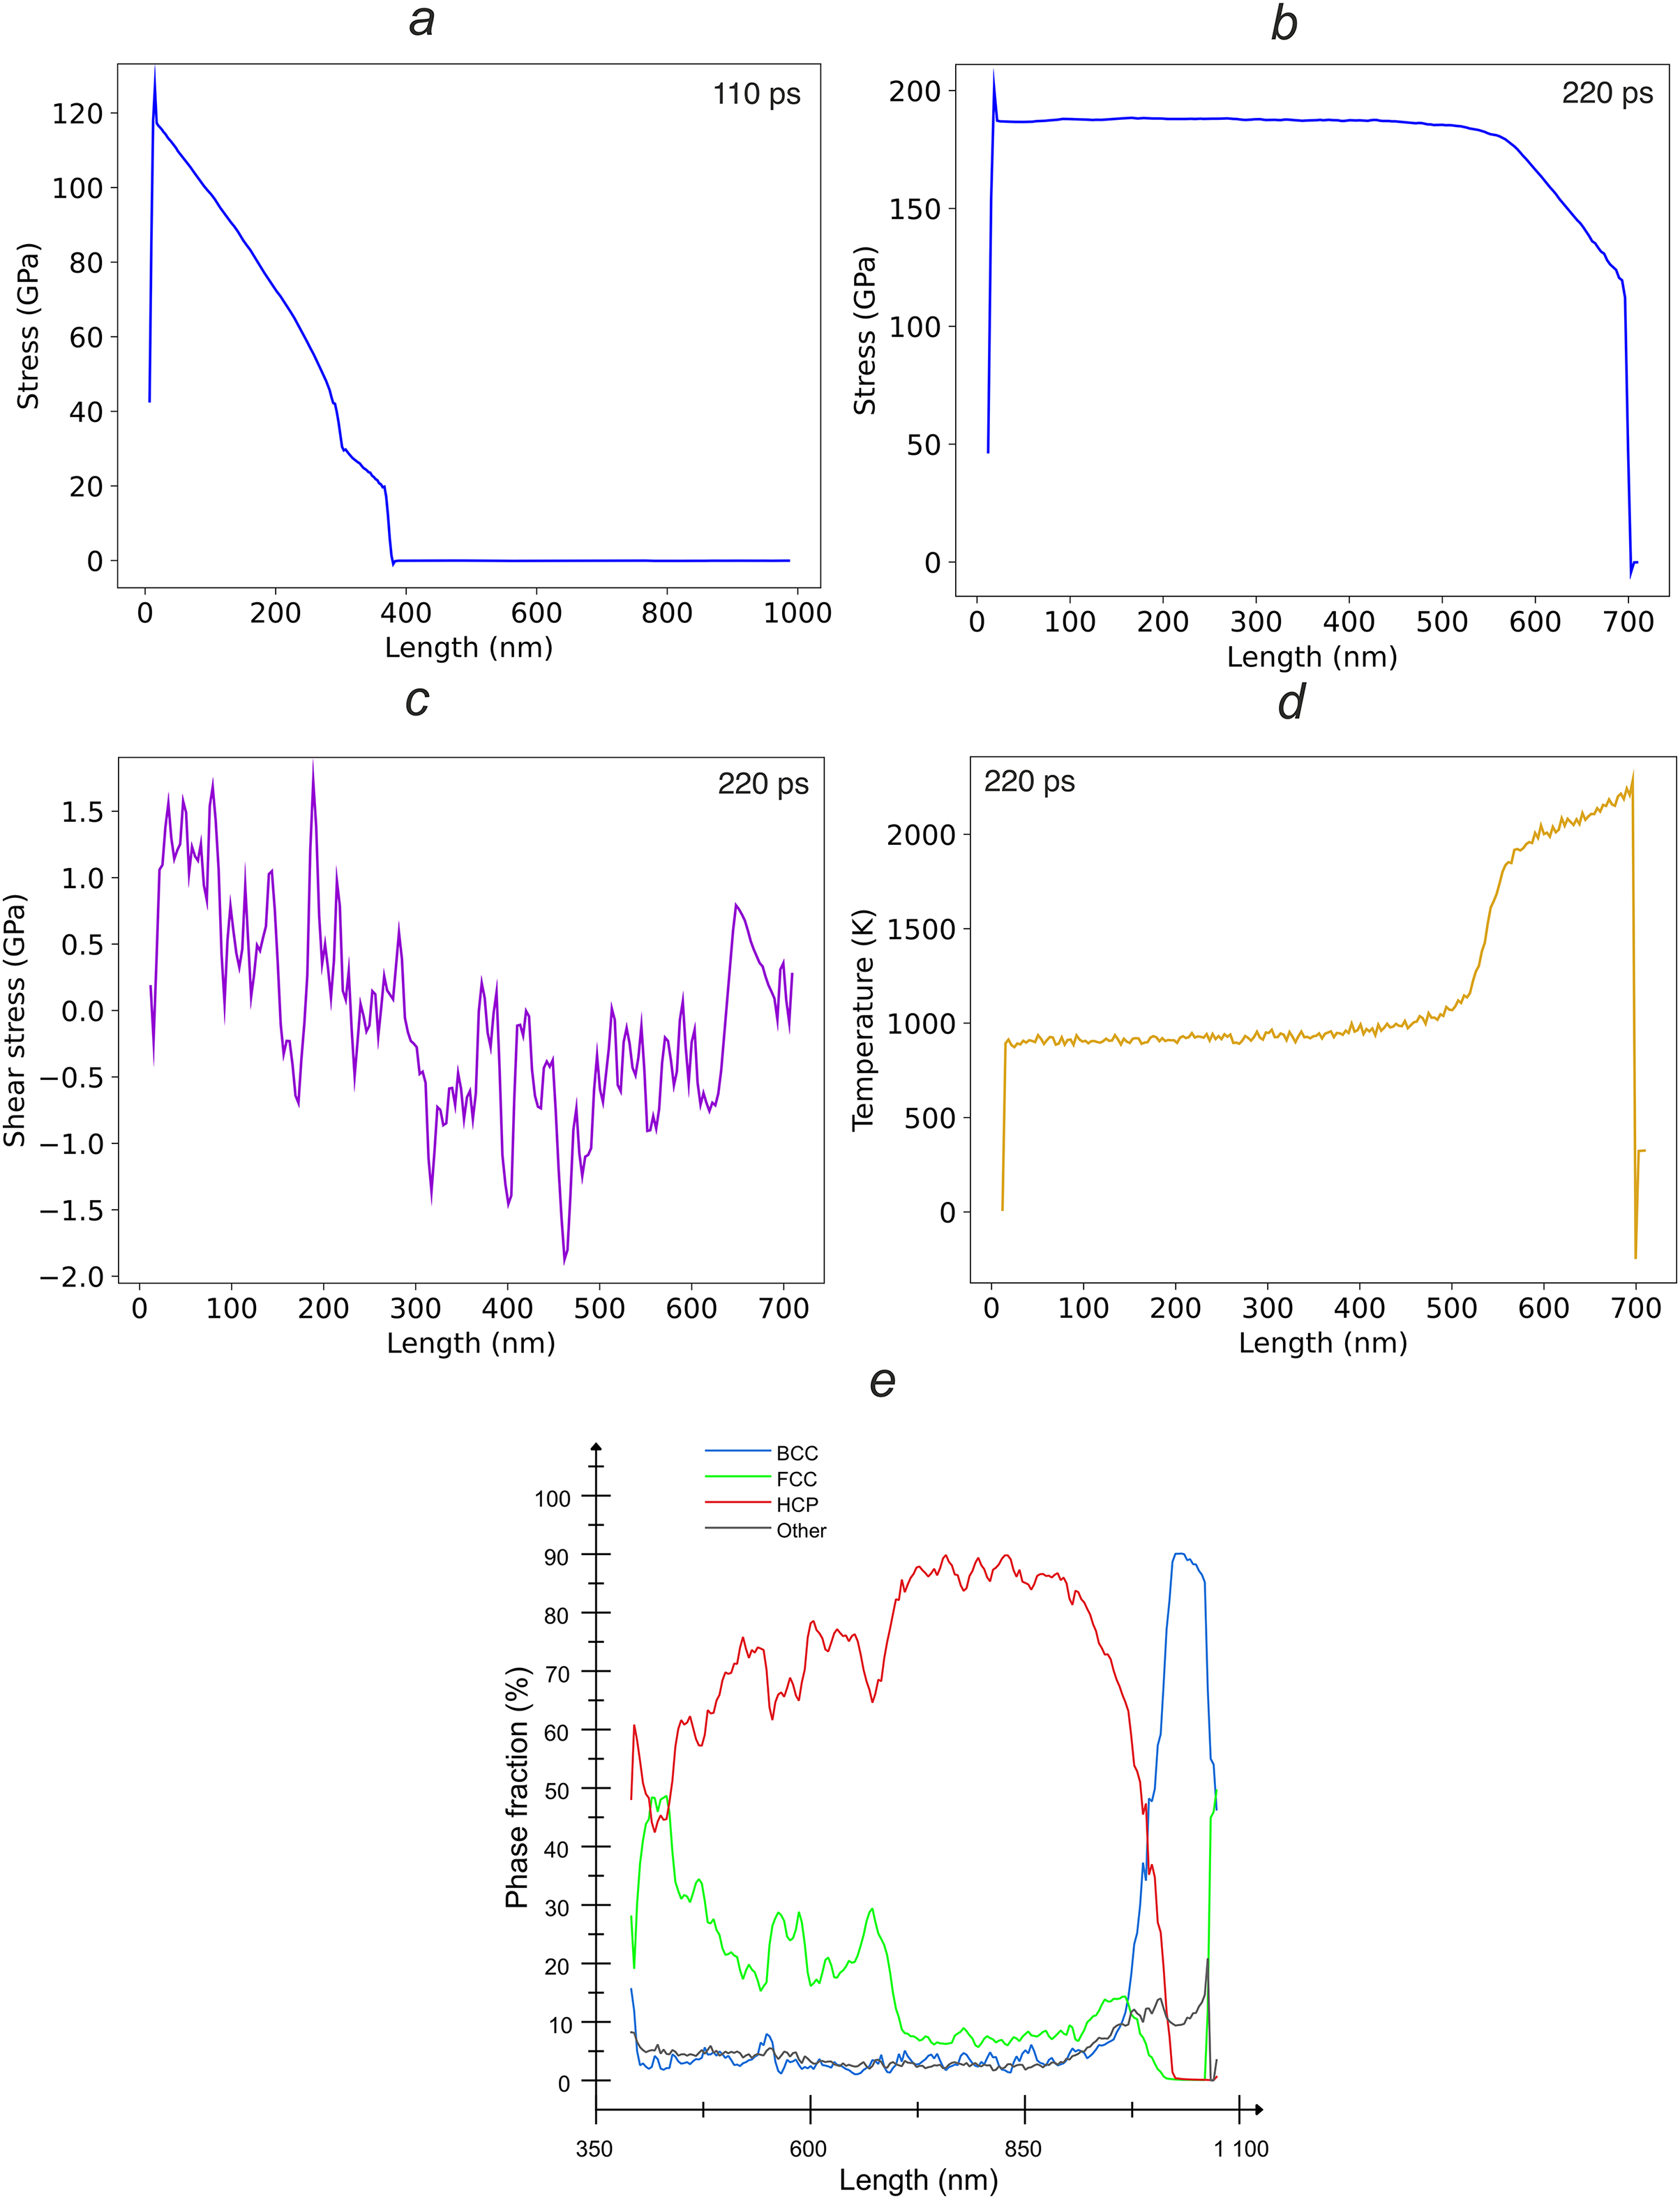
Figure 12: Direct MD simulation of ramp loading of a copper single crystal with [100] orientation, the maximum piston velocity is 2.7 km/s and the pulse rise time is 150 ps: (a) an increase in the stress value in the crystal at a simulation time of 110 ps; (b) the stress profile in the system at 220 ps, when the shock pulse is completely transmitted and further propagation of the shock wave along the crystal occurs; (c) the shear stresses distribution in the shock wave at 220 ps; (d) the temperature distribution at 220 ps; and (e) the phase composition at 220 ps
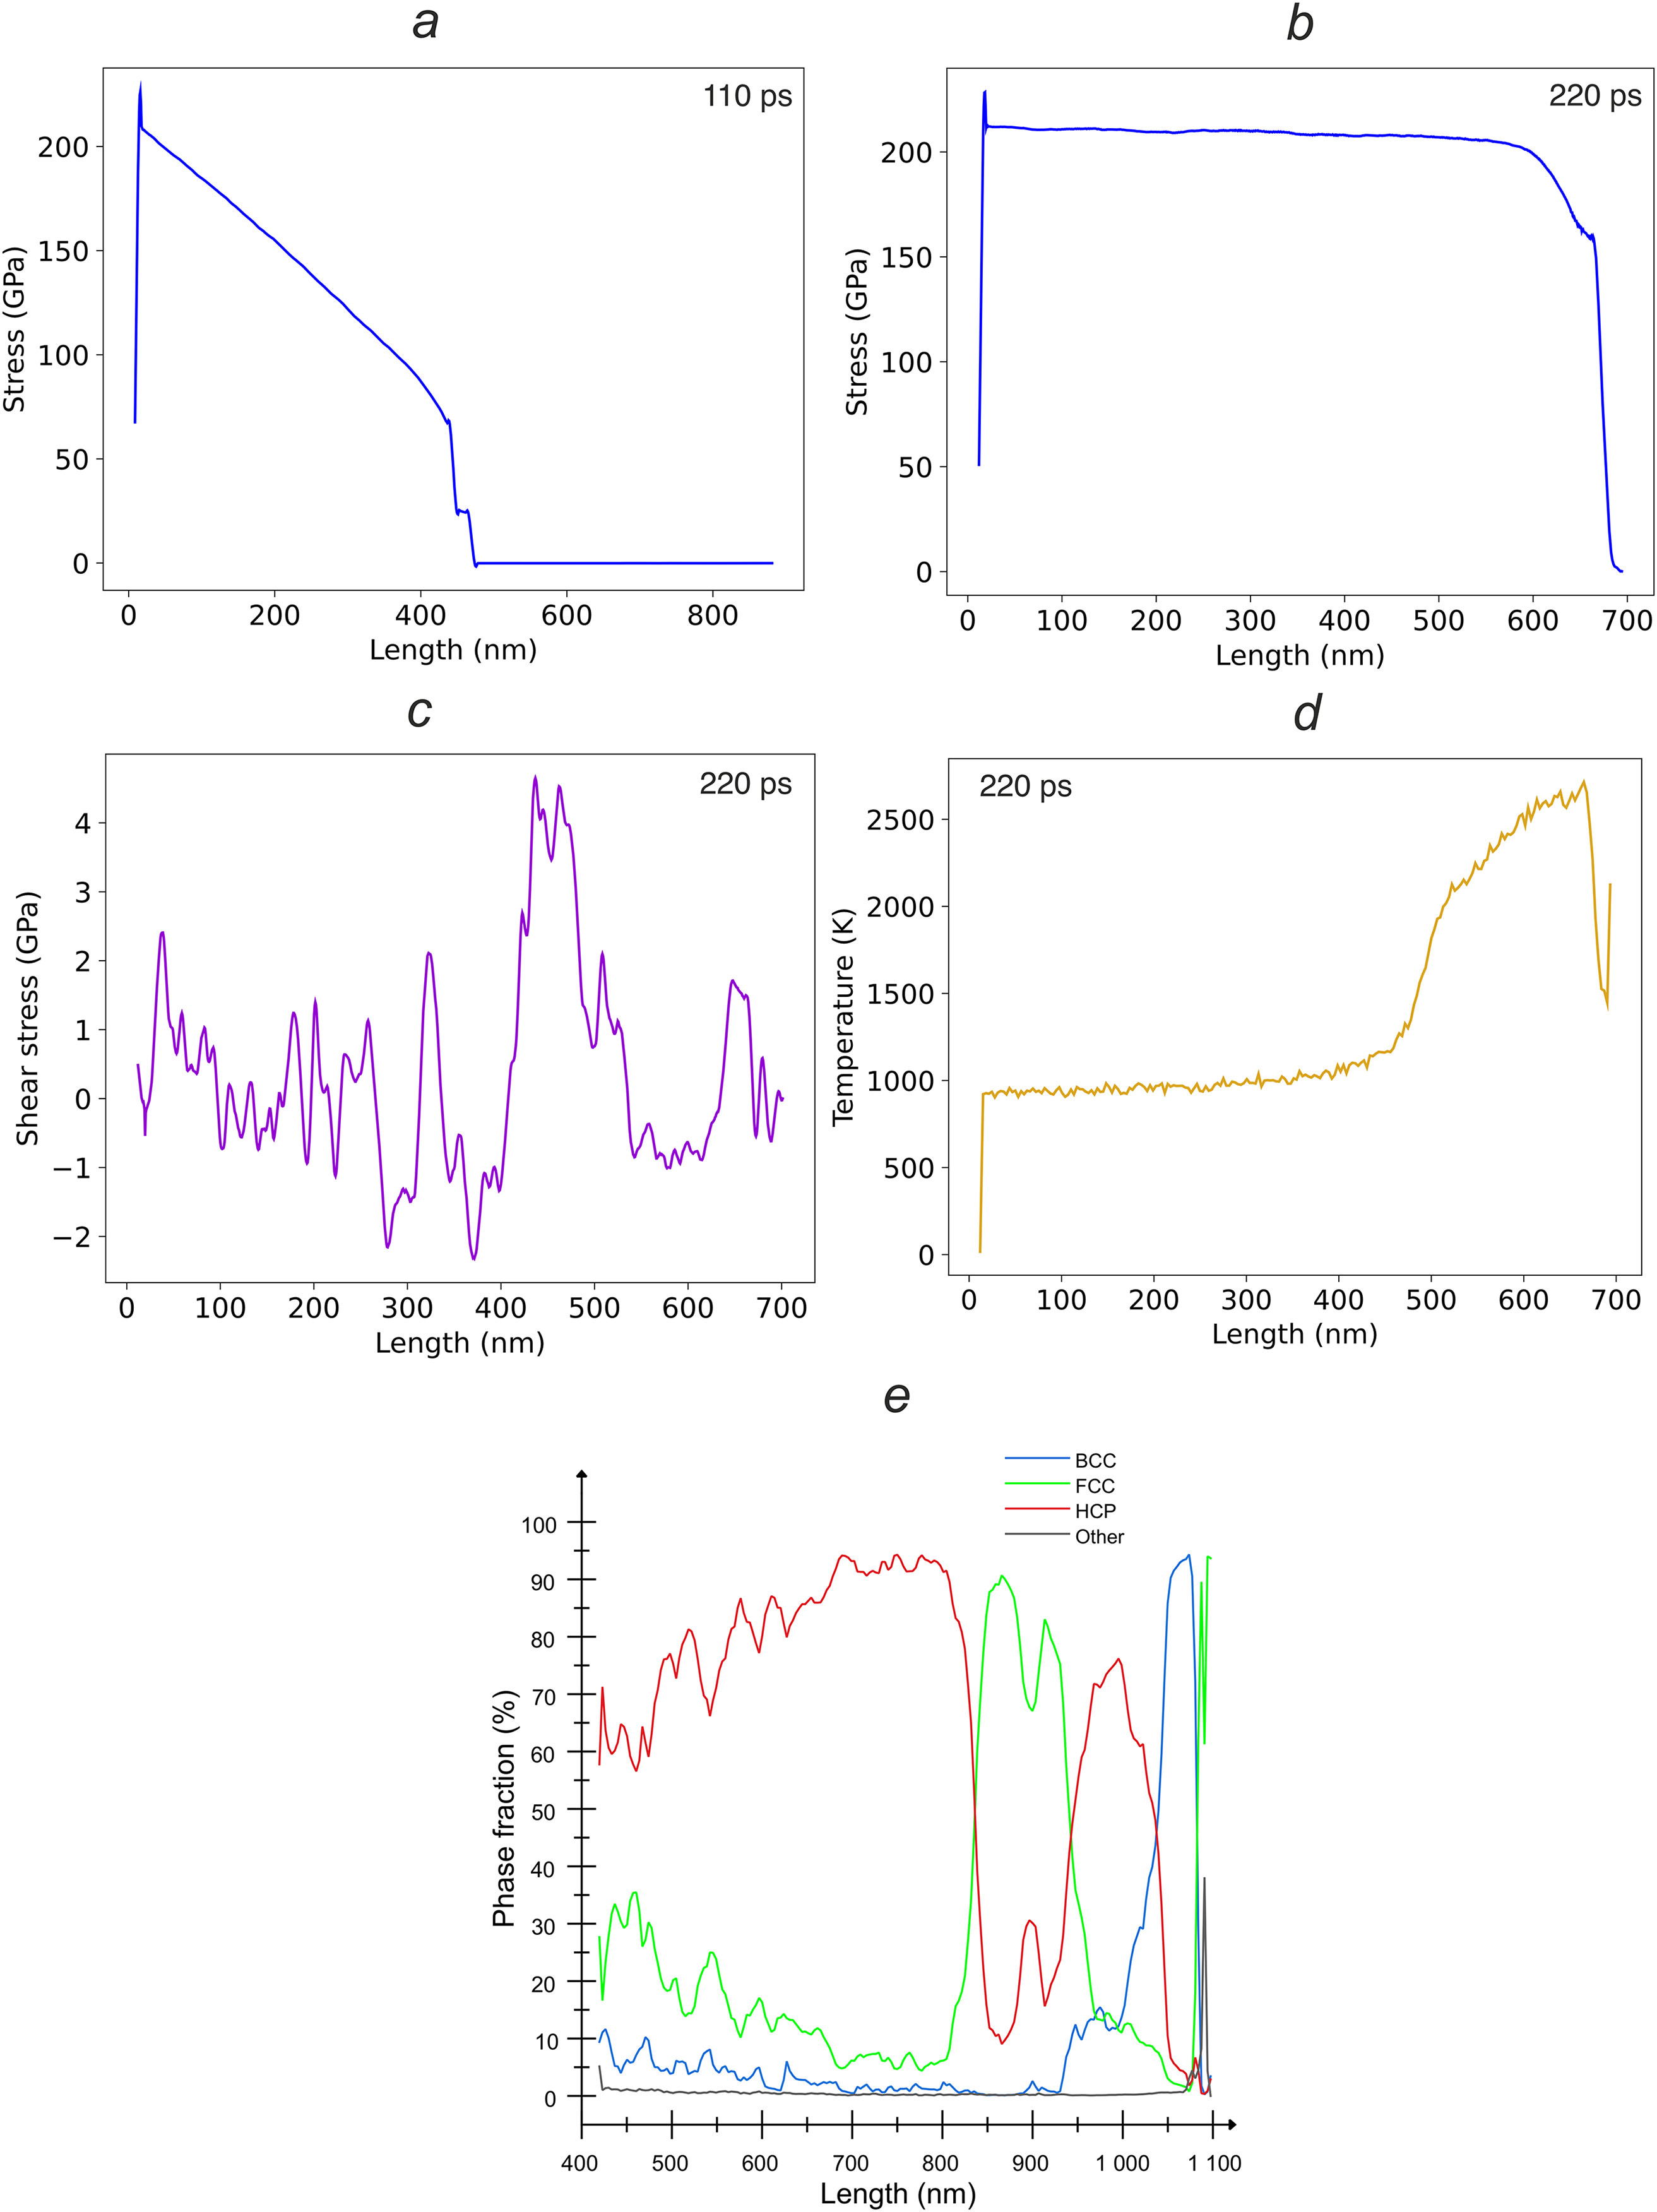
Figure 13: Direct MD simulation of ramp loading of a copper single crystal with [100] orientation, the maximum piston velocity is 2.9 km/s and the pulse rise time is 150 ps: (a) an increase in the stress value in the crystal at a simulation time of 150 ps; (b) the stress profile in the system at 220 ps, when the shock pulse is completely transmitted and a SW reflection from rear surface begins; (c) the shear stresses distribution in the shock wave at 220 ps; (d) the temperature distribution at 220 ps; and (e) the phase composition at 220 ps
Let us summarize all the results of direct modeling of SW in copper, discussed above in comparison with the Hugonostat method. The disadvantage of the Hugonostat method is that we do not obtain information about the wave structure, but in fact only study the shock-compressed state at a certain stress level, in contrast to direct simulation of the SW. As is shown in Section 3, the system in the process of Hugostat simulations goes through all the main stages of deformation, but these stages cannot be directly related to some areas of SW front. On the other hand, direct MD modeling of SW propagation may underestimate the phase transition stress by tens of Gigapascals, which is rather connected with unrealistically high strain rates at the fronts of such SWs far beyond the experimental ones. When simulating laser-driven shocks by means of ramp loading, we see a phase transition only in a small region behind the SW front, while in the rest of the crystal typical processes of plastic deformation and melting occur. At the same time, Hugonostat method gives reasonable values of stress and temperature at which the FCC-to-BCC transition is observed in comparison with the experiment (Fig. 6); besides, the computational time is orders of magnitude shorter in comparison with direct SW modeling. However, the kinetics of the processes is influenced by the value of the Hugoniostat parameter; the smaller it is, the faster the system reaches its final state, the higher the strain rates; therefore, the appearance of a phase transition also depends on the value of the Hugoniostat parameter in the frames of this method.
6 Formation of Polycrystalline Structure at Phase Transition
In the Hugoniostat simulation, the system consequently goes through all states from elastic deformation, plasticity and, at large deformations of the system corresponding to a high particle velocity behind the SW front, the FCC-to-BCC lattice transition. In Fig. 14, we can see the nucleation of dislocation loops [Fig. 14a], the evolution of the dislocation ensemble [Fig. 14b,c] and the beginning of the FCC-to-BCC transition [Fig. 14d]. Thus, with this modeling method, the system goes through the typical stages of metal deformation. We can see from the MD simulation results that the BCC phase (Figs. 14 and 15) begins to appear next to the HCP phase, so it is also possible that such a transition is associated with a lattice rearrangement due to dislocation activity, as was observed for FCC-HCP-BCC transitions in high-entropy alloys [27].
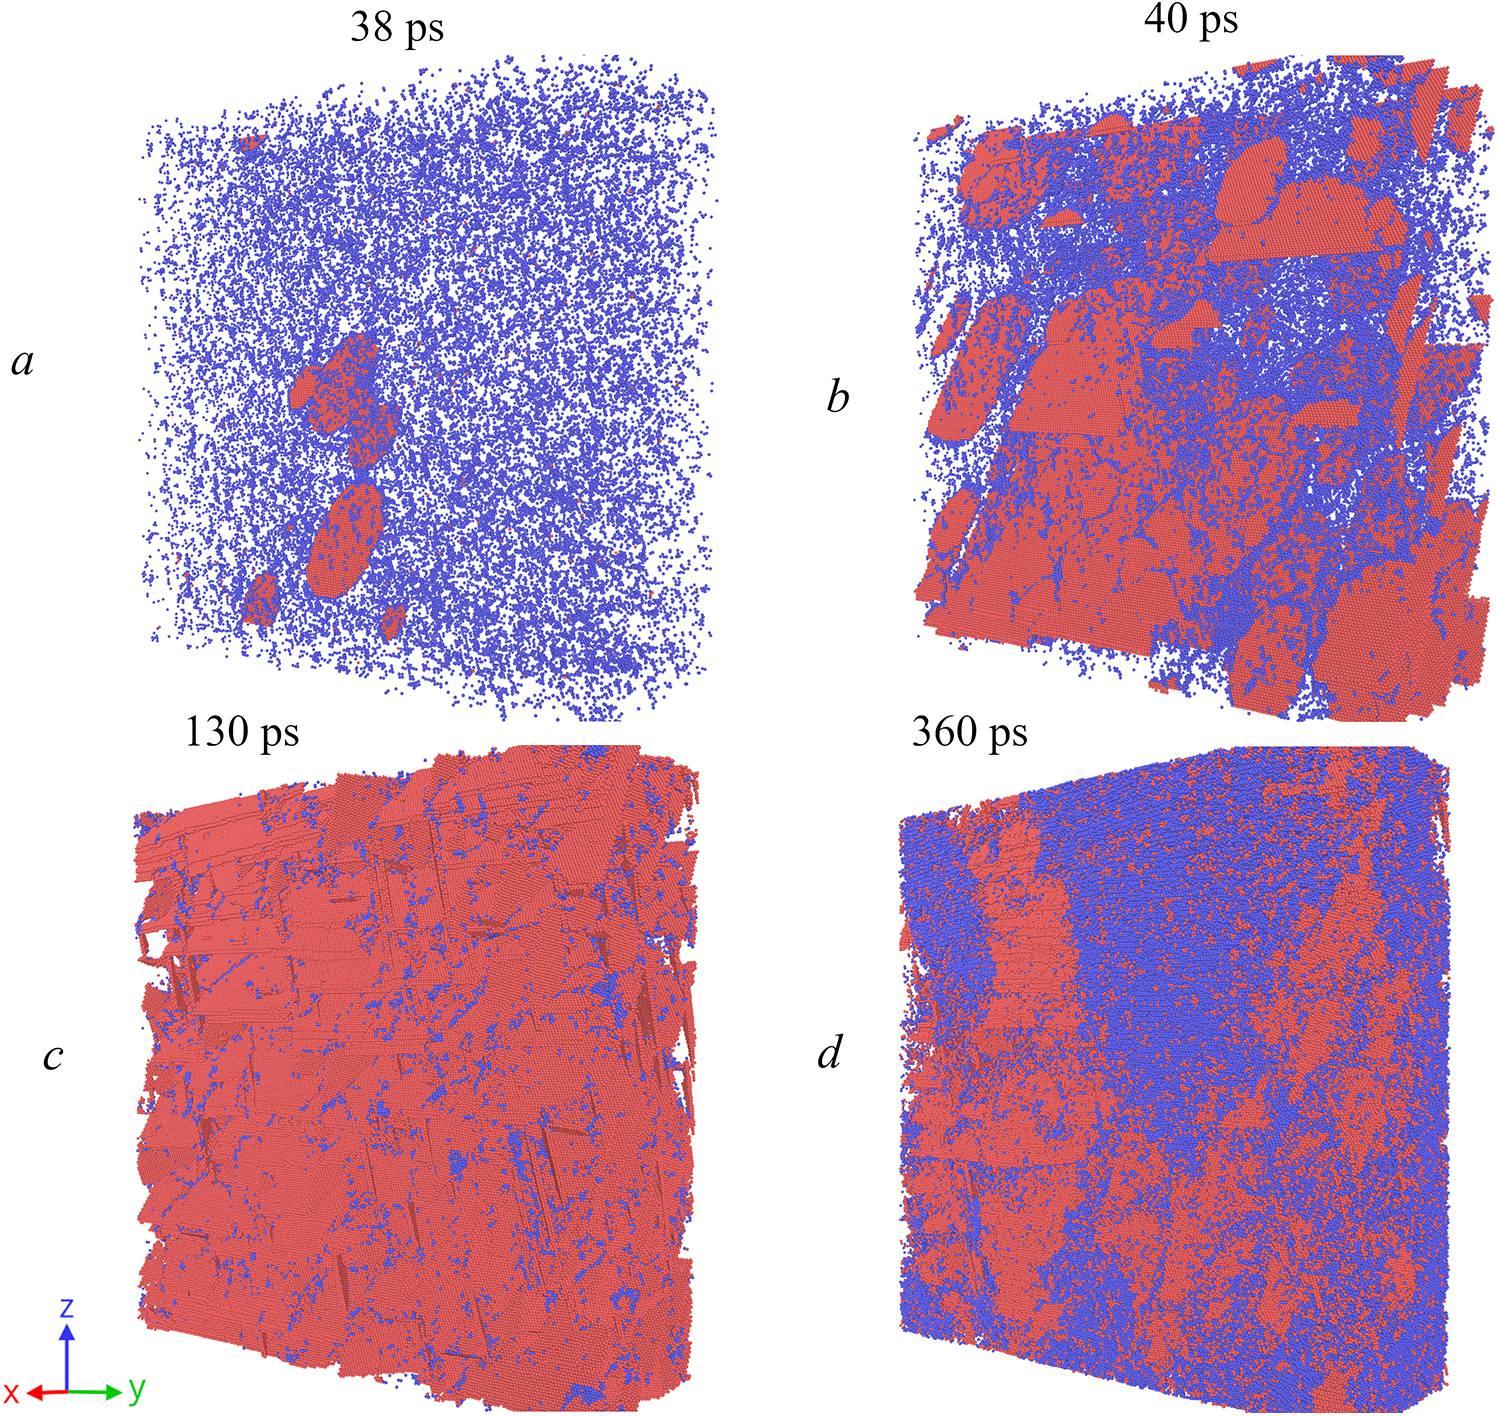
Figure 14: Development of plastic deformation and FCC-to-BCC phase transition in copper single crystal under loading along the [114] orientation to a target stress of 210 GPa. Red atoms belong to HCP structure and show stacking faults behind the partial dislocations in the parent FCC phase, blue atoms belong to BCC phase, while FCC atoms are not shown. Panels: (a) homogeneous nucleation of partial dislocation loops, (b) expansion of multiple dislocation loops, (c) intersection of stacking faults in multiple slip systems and (d) onset of the FCC-to-BCC phase transition
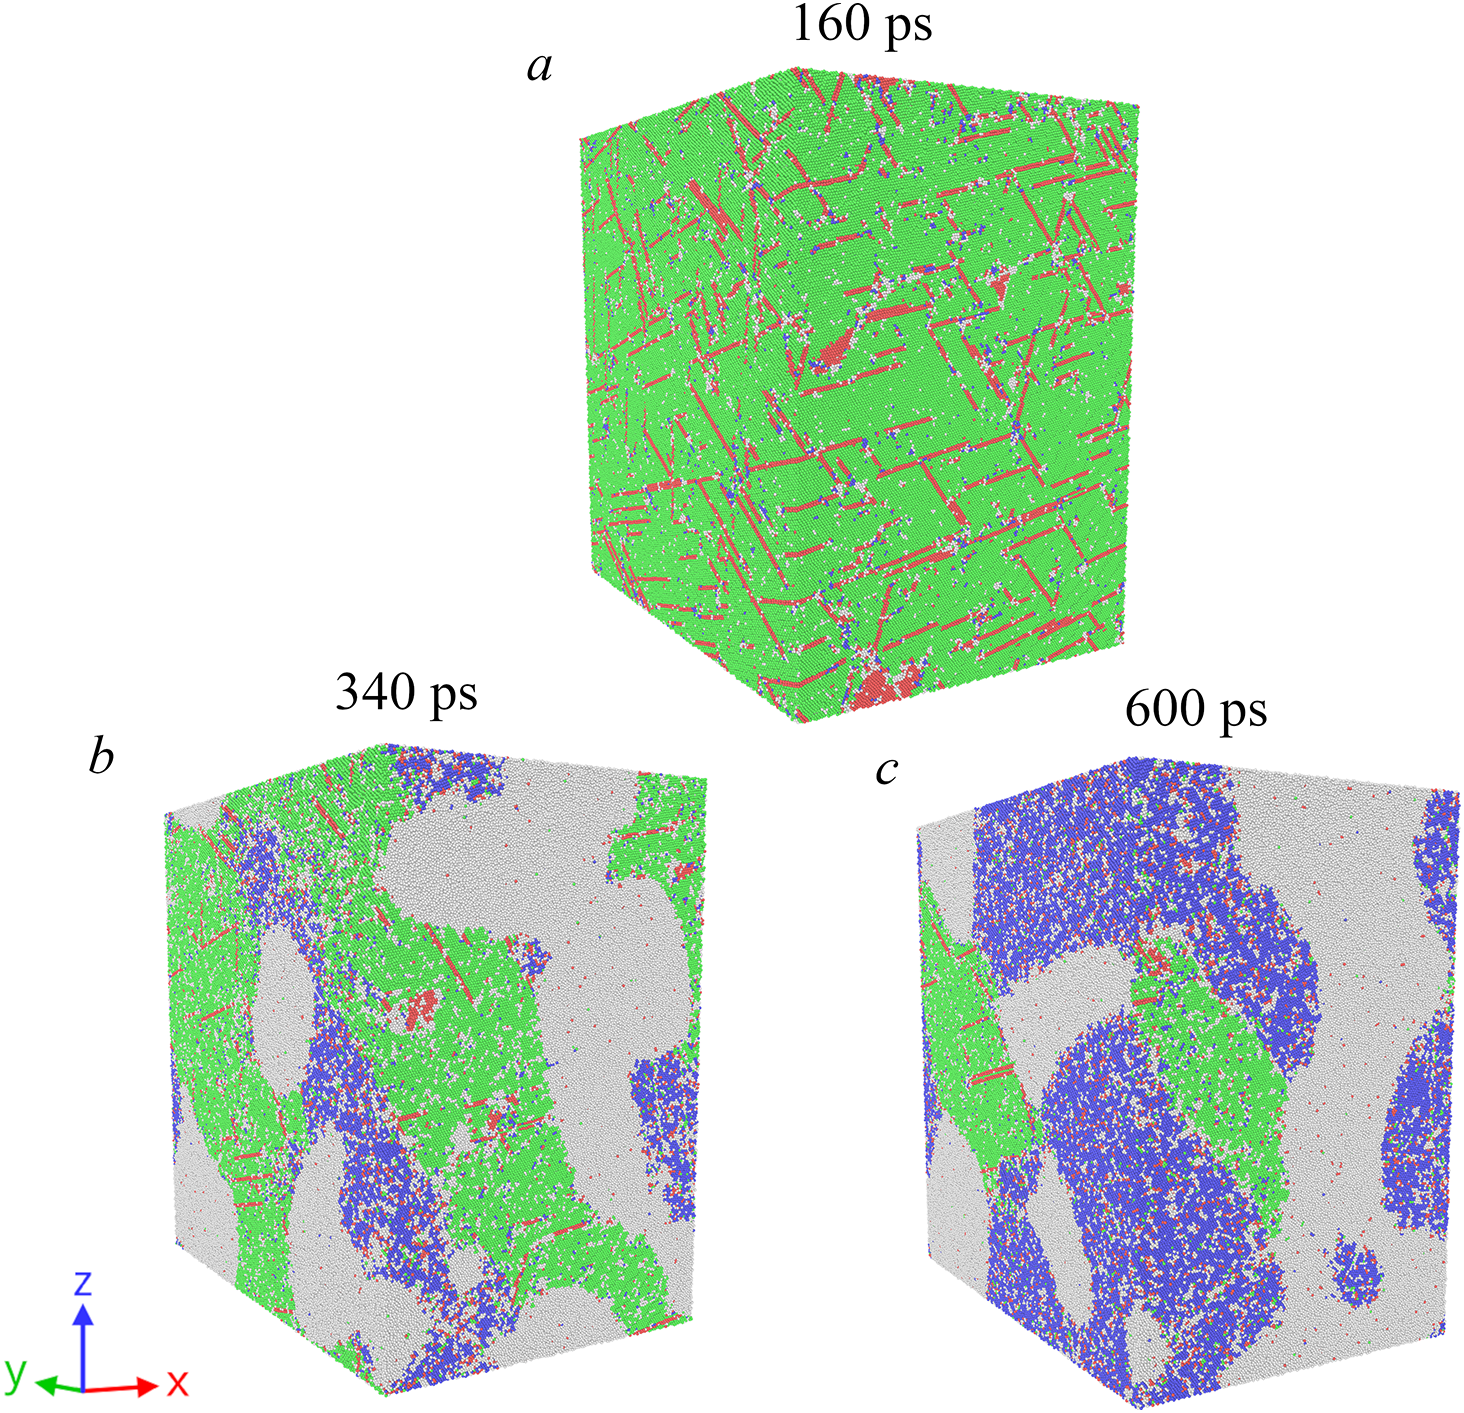
Figure 15: Evolution of crystalline phases in copper single crystal under loading along the [114] crystalline orientation to a target stress of 230 GPa: green atoms represent FCC phase, red atoms–HCP phase (stacking faults), blue atoms–BCC phase and white atoms correspond to unstructured (molten) areas. Panels: (a) plastic deformations in the material with the formation of stacking faults (HCP phase) as the traces of sliding of partial dislocations, (b) onset of the FCC-to-BCC phase transition and simultaneous melting of the material, and (c) the final state of the material at target stress of 230 GPa
As described in Section 3 and shown in the phase diagram for copper in Fig. 6b, the FCC-to-BCC transition occurs mainly at the melting boundary, except for the [100] crystal orientation, where the transition is observed earlier. Fig. 15 shows the evolution of the phase structure on the “large system” of copper under loading in [114] direction: after the plasticity processes [Fig. 15a], nuclei of material melting and BCC phase transition arise in the crystal [Fig. 15b], which then continue to grow and occupy a large part of the system [Fig. 15c].
In the course of the FCC-to-BCC phase transition, a polycrystalline sample is formed from the initial single crystal (Fig. 16). Using the example of an aluminum crystal under [114] loading, it is seen that the BCC phase nucleates at multiple different locations in the crystal volume [Fig. 16a]. As the atomic system reaches the target stress of 50 GPa in the Hugoniostat simulation, we see that the BCC phase grows with a specific crystal orientation from each of the nucleation sites [Fig. 16b]. The BCC grains then continue to grow and join, eventually forming polycrystalline BCC aluminum [Fig. 16c]. Noteworthy, the number of different grains in the final state in Fig. 16d is substantially reduced compared with the intermediate states [Fig. 16b,c], which can be explained by absorption of the less-favorably oriented grains by the more-favorably oriented ones in order to reduce the grain boundary energy.
Figure 16: Growth of the BCC phase and formation of a polycrystalline structure in an aluminum crystal with orientation [114] and a target stress of 50 GPa. Atoms are colored according to their belonging to different grains using the “Grain segmentation” algorithm in the Ovito package [43]. Panels: (a) the beginning of the FCC-to-BCC phase transition and crystallite growth centers, (b) growth of crystallites of the BCC phase from different foci in the volume of the system during deformation (c) joining of crystallites of the BCC phase with different lattice orientations, and (d) the final polycrystalline structure of aluminum with a reduced number of grains at a target stress of 50GPa
This study provides a systematic investigation into the anisotropic mechanical response and polymorphic phase transformations in aluminum and copper single crystals under shock compression. Through molecular dynamics simulations employing the Hugoniostat method, we have characterized the shock Hugoniot states across a comprehensive range of crystallographic loading directions. The results reveal fundamentally distinct behaviors between the two materials. Aluminum undergoes a uniform FCC-to-BCC phase transition across all orientations, initiating within a narrow pressure range of 30–40 GPa and achieving near-complete conversion to the BCC structure by 60 GPa. In contrast, copper exhibits delayed and highly orientation-dependent transformation behavior, with the BCC phase forming at approximately 160 GPa for the [100] direction while requiring substantially higher pressures for other orientations. This transition in copper competes directly with shock-induced melting, leading to complete suppression of the solid-state transformation along the crystallographically strong [111] direction. A pronounced crystallographic anisotropy characterizes both the onset of plasticity and the phase transition pressures in both metals. The [100] direction emerges as mechanically weakest, demonstrating the earliest yield and phase transformation, while the [111] orientation proves most resistant. This anisotropic effect manifests with significantly greater magnitude in copper compared to aluminum. To extend the predictive capability of our findings, we have developed a neural network model capable of generalizing simulation data to forecast the phase composition of shock-compressed states, successfully demonstrated for the highly anisotropic case of copper. Furthermore, our analysis reveals that BCC phase formation proceeds through nucleation and growth mechanism of multiple grains, resulting in polycrystalline microstructure despite the initial single-crystal configuration.
Acknowledgement: The research is carried out using the equipment of the shared research facilities of HPC computing resources and the MSU-270 supercomputer at Lomonosov Moscow State University [75].
Funding Statement: Study of the orientation dependence of the phase transition of copper in Section 3, construction of the neural network model (Section 4) and direct MD simulation of SW (Section 5) were founded by the Ministry of Science and Higher Education of the Russian Federation, State assignments for research, registration No. 1024032600084-8-1.3.2. Study of the grain growth and the formation of polycrystalline structure as a result of phase transition (Section 6) was founded by the Russian Science Foundation, Project No. 24-71-00078, https://rscf.ru/en/project/24-71-00078/, (accessed on 01 December 2025). Study of the orientation dependence of the phase transition of aluminum in Section 3 was founded by the Russian Science Foundation, Project No. 24-19-00684, https://rscf.ru/en/project/24-19-00684/, (accessed on 01 December 2025).
Author Contributions: Evgenii V. Fomin: Conceptualization, methodology, formal analysis, investigation, software, data curation, writing—original draft, writing—review & editing, funding acquisition, project administration; Ilya A. Bryukhanov: Methodology, formal analysis, investigation, writing—review & editing; Natalya A. Grachyova: Methodology, formal analysis, investigation, data curation, visualization, validation, writing—original draft; Alexander E. Mayer: Conceptualization, funding acquisition, methodology, project administration, supervision, validation, writing—review & editing. All authors reviewed the results and approved the final version of the manuscript.
Availability of Data and Materials: The data that support the findings of this study are available upon request.
Ethics Approval: Not applicable.
Conflicts of Interest: The authors declare no conflicts of interest to report regarding the present study.
References
1. Tolias P, De Angeli M, Ripamonti D, Ratynskaia S, Riva G, Daminelli G, et al. Wall cratering upon high velocity normal dust impact. Fusion Eng Des. 2023;195:113938. doi:10.1016/j.fusengdes.2023.113938. [Google Scholar] [CrossRef]
2. Nitta K, Adachi H, Higashide M. Initial study for the response of Ti-6Al–4V plate used in tank material. Acta Astronaut. 2023;211:920–5. doi:10.1016/j.actaastro.2023.06.037. [Google Scholar] [CrossRef]
3. Hu J, Liu Z, Chen K, Zhuang Z. Investigations of shock-induced deformation and dislocation mechanism by a multiscale discrete dislocation plasticity model. Comput Mater Sci. 2017;131:78–85. doi:10.1016/j.commatsci.2017.01.035. [Google Scholar] [CrossRef]
4. Bryukhanov IA. Role of temperature and preexisting dislocation network on the shock compression of copper crystals. Int J Plast. 2023;165:103599. doi:10.1016/j.ijplas.2023.103599. [Google Scholar] [CrossRef]
5. Sharma SM, Turneaure SJ, Winey JM, Gupta YM. Transformation of shock-compressed copper to the body-centered-cubic structure at 180 GPa. Phys Rev B. 2020;102(2):020103. doi:10.1103/physrevb.102.020103. [Google Scholar] [CrossRef]
6. Sims M, Briggs R, Volz TJ, Singh S, Hamel S, Coleman AL, et al. Experimental and theoretical examination of shock-compressed copper through the FCC to BCC to melt phase transitions. J Appl Phys. 2022;132(7):075902. doi:10.1063/5.0088607. [Google Scholar] [CrossRef]
7. Jiang DD, Shao JL, Wu B, Wang P, He AM. Sudden change of spall strength induced by shock defects based on atomistic simulation of single crystal aluminum. Scr Mater. 2022;210:114474. doi:10.1016/j.scriptamat.2021.114474. [Google Scholar] [CrossRef]
8. Zhao K, Li Y, Zhao F. Dynamic deformation of Al under shock loading. Comput Mater Sci. 2022;209:111406. doi:10.1016/j.commatsci.2022.111406. [Google Scholar] [CrossRef]
9. Zhu Y, Hu J, Wei Q, Zhang J, Sun Y, Luo G, et al. Enhanced spall strength of single crystal aluminum by temperature rise mitigation and structural phase transition under shock pulse. Mech Mater. 2023;186:104809. doi:10.1016/j.mechmat.2023.104809. [Google Scholar] [CrossRef]
10. Mayer AE. Influence of preliminary compressive deformation on the spall strength of aluminum single crystal. Scr Mater. 2024;242:115905. doi:10.1016/j.scriptamat.2023.115905. [Google Scholar] [CrossRef]
11. Basavaraj K, Ray A. Phase transition lowering in shock compressed single-crystal aluminum: atomistic insights. Phys Rev B. 2024;109(10):104101. doi:10.1103/physrevb.109.104101. [Google Scholar] [CrossRef]
12. Bolesta AV, Fomin VM. Molecular dynamics simulation of shock-wave loading of copper and titanium. In: Proceedings of the XXV Conference on High-Energy Processes in Condensed Matter (HEPCM 2017); 2017 Jun 5–9; Novosibirsk, Russia. Melville, NY, USA: AIP Publishing LLC; 2017. p. 020008. doi:10.1063/1.5007446. [Google Scholar] [CrossRef]
13. Neogi A, Mitra N. A metastable phase of shocked bulk single crystal copper: an atomistic simulation study. Sci Rep. 2017;7:7337. doi:10.1038/s41598-017-07809-1. [Google Scholar] [PubMed] [CrossRef]
14. Mayer AE, Lekanov MV, Grachyova NA, Fomin EV. Machine-learning-based model of elastic—plastic deformation of copper for application to shock wave problem. Metals. 2022;12(3):402. doi:10.3390/met12030402. [Google Scholar] [CrossRef]
15. Ling W, Chen B, Zeng Q, Yu X, Zhang S, Zhao Z, et al. Atomic insight into phase transition lowering in shock compressed copper. Front Phys. 2022;10:838316. doi:10.3389/fphy.2022.838316. [Google Scholar] [CrossRef]
16. Grachyova N, Fomin E, Mayer A. Theoretical model of structural phase transitions in Al-Cu solid solutions under dynamic loading using machine learning. Dynamics. 2024;4(3):526–53. doi:10.3390/dynamics4030028. [Google Scholar] [CrossRef]
17. Wu YC, Shao JL. FCC-BCC phase transformation induced simultaneous enhancement of tensile strength and ductility at high strain rate in high-entropy alloy. Int J Plast. 2023;169:103730. doi:10.1016/j.ijplas.2023.103730. [Google Scholar] [CrossRef]
18. Xie H, Ma Z, Zhang W, Zhao H, Ren L. Phase transition in shock compressed high-entropy alloy FeNiCrCoCu. Int J Mech Sci. 2023;238:107855. doi:10.1016/j.ijmecsci.2022.107855. [Google Scholar] [CrossRef]
19. Xiong QL, Kitamura T, Li Z. Transient phase transitions in single-crystal coppers under ultrafast lasers induced shock compression: a molecular dynamics study. J Appl Phys. 2019;125(19):194302. doi:10.1063/1.5088371. [Google Scholar] [CrossRef]
20. Neogi A, Mitra N. Shock induced deformation response of single crystal copper: effect of crystallographic orientation. Comput Mater Sci. 2017;135:141–51. doi:10.1016/j.commatsci.2017.04.009. [Google Scholar] [CrossRef]
21. Jiang Y, Duchamp M, Ang SJ, Yan H, Tan TL, Mirsaidov U. Dynamics of the FCC-to-BCC phase transition in single-crystalline PdCu alloy nanoparticles. Nat Commun. 2023;14:104. doi:10.1038/s41467-022-35325-y. [Google Scholar] [PubMed] [CrossRef]
22. Leineweber A. Structure relationships between the binary FCC and BCC superstructures. Z Für Kristallogr Cryst Mater. 2025;240(7–8):249–66. doi:10.1515/zkri-2025-0015. [Google Scholar] [CrossRef]
23. Sio H, Krygier A, Braun DG, Rudd RE, Bonev SA, Coppari F, et al. Extended X-ray absorption fine structure of dynamically-compressed copper up to 1 terapascal. Nat Commun. 2023;14(1):7046. doi:10.1038/s41467-023-42684-7. [Google Scholar] [PubMed] [CrossRef]
24. Polsin DN, Fratanduono DE, Rygg JR, Lazicki A, Smith RF, Eggert JH, et al. Measurement of body-centered-cubic aluminum at 475 GPa. Phys Rev Lett. 2017;119(17):175702. doi:10.1103/PhysRevLett.119.175702. [Google Scholar] [PubMed] [CrossRef]
25. Fiquet G, Narayana C, Bellin C, Shukla A, Estève I, Ruoff AL, et al. Structural phase transitions in aluminium above 320 GPa. Comptes Rendus Geosci. 2019;351(2–3):243–52. doi:10.1016/j.crte.2018.08.006. [Google Scholar] [CrossRef]
26. He L, Polsin D, Zhang S, Collins GW, Abdolrahim N. Phase transformation path in aluminum under ramp compression; simulation and experimental study. Sci Rep. 2022;12:18954. doi:10.1038/s41598-022-23785-7. [Google Scholar] [PubMed] [CrossRef]
27. Yang W, Qian L, Luo J, Yang XS. A novel atomic mechanism of FCC → HCP → BCC phase transition in a gradient nanostructured compositionally complex alloy. Mater Res Lett. 2024;12(12):929–38. doi:10.1080/21663831.2024.2405228. [Google Scholar] [CrossRef]
28. Armstrong DEJ, Wilkinson AJ, Roberts SG. Measuring anisotropy in young’s modulus of copper using microcantilever testing. J Mater Res. 2009;24(11):3268–76. doi:10.1557/jmr.2009.0396. [Google Scholar] [CrossRef]
29. Zhu J, Li X, Zhou Q, Aghababaei R. On the anisotropic scratching behavior of single crystalline copper at nanoscale. Tribol Int. 2022;175:107794. doi:10.1016/j.triboint.2022.107794. [Google Scholar] [CrossRef]
30. Oren E, Kartoon D, Makov G. Machine learning-based modeling of high-pressure phase diagrams: anomalous melting of Rb. J Chem Phys. 2022;157(1):014502. doi:10.1063/5.0088089. [Google Scholar] [PubMed] [CrossRef]
31. Corradini A, Marini G, Calandra M. Scalable machine learning approach to light induced order disorder phase transitions with ab initio accuracy. npj Comput Mater. 2025;11(1):151. doi:10.1038/s41524-025-01614-5. [Google Scholar] [PubMed] [CrossRef]
32. Wang F, Yang Z, Li F, Shao JL, Xu LC. Strategic sampling with stochastic surface walking for machine learning force fields in iron’s BCC-HCP phase transitions. RSC Adv. 2023;13(45):31728–37. doi:10.1039/d3ra04676a. [Google Scholar] [PubMed] [CrossRef]
33. He Z, Zhang H, Cheng H, Ge M, Si T, Che L, et al. Machine learning guided BCC or FCC phase prediction in high entropy alloys. J Mater Res Technol. 2024;29:3477–86. doi:10.1016/j.jmrt.2024.01.257. [Google Scholar] [CrossRef]
34. Ravelo R, Holian B, Germann T, Lomdahl P. Constant-stress Hugoniostat method for following the dynamical evolution of shocked matter. Phys Rev B. 2004;70:014103. doi:10.1103/physrevb.70.014103. [Google Scholar] [CrossRef]
35. Maillet JB, Stoltz G. Sampling constraints in average: the example of hugoniot curves. Appl Math Res Express. 2008;2008(1):abn004. doi:10.1093/amrx/abn004. [Google Scholar] [CrossRef]
36. Guan YL, Shao JL, Song WD. Molecular dynamics study on dynamic response of void-included aluminum under different loading patterns. Int J Mech Sci. 2020;181:105707. doi:10.1016/j.ijmecsci.2020.105707. [Google Scholar] [CrossRef]
37. Tavakol M, Mahnama M, Naghdabadi R. Shock wave sintering of Al/SiC metal matrix nano-composites: a molecular dynamics study. Comput Mater Sci. 2016;125:255–62. doi:10.1016/j.commatsci.2016.08.032. [Google Scholar] [CrossRef]
38. Renou R, Soulard L, Lescoute E, Dereure C, Loison D, Guin JP. Silica glass structural properties under elastic shock compression: experiments and molecular simulations. J Phys Chem C. 2017;121(24):13324–34. doi:10.1021/acs.jpcc.7b01324. [Google Scholar] [CrossRef]
39. Lecoutre G, Lemarchand CA, Soulard L, Pineau N. Hugoniostat and direct shock simulations in cis-1,4-polybutadiene melts. Macromol Theory Simul. 2021;30(2):2000068. doi:10.1002/mats.202000068. [Google Scholar] [CrossRef]
40. Plimpton S. Fast parallel algorithms for short-range molecular dynamics. J Comput Phys. 1995;117(1):1–19. doi:10.1006/jcph.1995.1039. [Google Scholar] [CrossRef]
41. Thompson AP, Aktulga HM, Berger R, Bolintineanu DS, Brown WM, Crozier PS, et al. LAMMPS—a flexible simulation tool for particle-based materials modeling at the atomic, meso, and continuum scales. Comput Phys Commun. 2022;271:108171. doi:10.1016/j.cpc.2021.108171. [Google Scholar] [CrossRef]
42. Mishin Y, Mehl MJ, Papaconstantopoulos DA, Voter AF, Kress JD. Structural stability and lattice defects in copper: ab initio, tight-binding, and embedded-atom calculations. Phys Rev B. 2001;63(22):224106. doi:10.1103/physrevb.63.224106. [Google Scholar] [CrossRef]
43. Mishin Y, Farkas D, Mehl MJ, Papaconstantopoulos DA. Interatomic potentials for monoatomic metals from experimental data and ab initio calculations. Phys Rev B. 1999;59(5):3393–407. doi:10.1103/physrevb.59.3393. [Google Scholar] [CrossRef]
44. Panchenko BA, Fomin EV, Mayer AE. Tensor equation of state for copper and aluminum. Comput Mater Sci. 2025;253:113845. doi:10.1016/j.commatsci.2025.113845. [Google Scholar] [CrossRef]
45. Sichani MM, Spearot DE. A molecular dynamics study of dislocation density generation and plastic relaxation during shock of single crystal Cu. J Appl Phys. 2016;120(4):045902. doi:10.1063/1.4959075. [Google Scholar] [CrossRef]
46. Latypov FT, Fomin EV, Krasnikov VS, Mayer AE. Dynamic compaction of aluminum with nanopores of varied shape: MD simulations and machine-learning-based approximation of deformation behavior. Int J Plast. 2022;156:103363. doi:10.1016/j.ijplas.2022.103363. [Google Scholar] [CrossRef]
47. Gracheva NA, Lekanov MV, Mayer AE, Fomin EV. Application of neural networks for modeling shock-wave processes in aluminum. Mech Solids. 2021;56(3):326–42. doi:10.3103/S0025654421030031. [Google Scholar] [CrossRef]
48. Hoover W. Canonical dynamics: equilibrium phase-space distributions. Phys Rev A Gen Phys. 1985;31(3):1695–7. doi:10.1103/physreva.31.1695. [Google Scholar] [PubMed] [CrossRef]
49. Larsen PM, Schmidt S, Schiøtz J. Robust structural identification via polyhedral template matching. Model Simul Mater Sci Eng. 2016;24(5):055007. doi:10.1088/0965-0393/24/5/055007. [Google Scholar] [CrossRef]
50. Stukowski A. Visualization and analysis of atomistic simulation data with OVITO-the Open Visualization Tool. Model Simul Mater Sci Eng. 2010;18(1):015012. doi:10.1088/0965-0393/18/1/015012. [Google Scholar] [CrossRef]
51. Zhakhovskii VV, Inogamov NA, Petrov YV, Ashitkov SI, Nishihara K. Molecular dynamics simulation of femtosecond ablation and spallation with different interatomic potentials. Appl Surf Sci. 2009;255(24):9592–6. doi:10.1016/j.apsusc.2009.04.082. [Google Scholar] [CrossRef]
52. Mendelev MI, Kramer MJ, Becker CA, Asta M. Analysis of semi-empirical interatomic potentials appropriate for simulation of crystalline and liquid Al and Cu. Philos Mag. 2008;88(12):1723–50. doi:10.1080/14786430802206482. [Google Scholar] [CrossRef]
53. Winey JM, Kubota A, Gupta YM. Thermodynamic approach to determine accurate potentials for molecular dynamics simulations: thermoelastic response of aluminum. Modelling Simul Mater Sci Eng. 2010;18(2):029801. doi:10.1088/0965-0393/18/2/029801. [Google Scholar] [CrossRef]
54. Mayer AE, Krasnikov VS, Pogorelko VV. Dislocation nucleation in Al single crystal at shear parallel to (111) plane: molecular dynamics simulations and nucleation theory with artificial neural networks. Int J Plast. 2021;139:102953. doi:10.1016/j.ijplas.2021.102953. [Google Scholar] [CrossRef]
55. Sjostrom T, Crockett S, Rudin S. Multiphase aluminum equations of state via density functional theory. Phys Rev B. 2016;94(14):144101. doi:10.1103/physrevb.94.144101. [Google Scholar] [CrossRef]
56. Baldock RJN, Pártay LB, Bartók AP, Payne MC, Csányi G. Determining pressure-temperature phase diagrams of materials. Phys Rev B. 2016;93(17):174108. doi:10.1103/physrevb.93.174108. [Google Scholar] [CrossRef]
57. Liu XY, Ercolessi F, Adams JB. Aluminium interatomic potential from density functional theory calculations with improved stacking fault energy. Model Simul Mater Sci Eng. 2004;12(4):665. doi:10.1088/0965-0393/12/4/007. [Google Scholar] [CrossRef]
58. Jasper AW, Schultz NE, Truhlar DG. Analytic potential energy functions for simulating aluminum nanoparticles. J Phys Chem B. 2005;109(9):3915–20. doi:10.1021/jp044805v. [Google Scholar] [PubMed] [CrossRef]
59. Dewaele A, Loubeyre P, Mezouar M. Equations of state of six metals above 94 GPa. Phys Rev B. 2004;70(9):094112. doi:10.1103/physrevb.70.094112. [Google Scholar] [CrossRef]
60. Wu YN, Wang LP, Huang YS, Wang DM. Melting of copper under high pressures by molecular dynamics simulation. Chem Phys Lett. 2011;515(4–6):217–20. doi:10.1016/j.cplett.2011.08.097. [Google Scholar] [CrossRef]
61. Wang S, Zhang G, Liu H, Song H. Modified Z method to calculate melting curve by molecular dynamics. J Chem Phys. 2013;138(13):134101. doi:10.1063/1.4798225. [Google Scholar] [PubMed] [CrossRef]
62. Liu ZL, Zhang XL, Cai LC. Shock melting method to determine melting curve by molecular dynamics: Cu, Pd, and Al. J Chem Phys. 2015;143(11):114101. doi:10.1063/1.4930974. [Google Scholar] [PubMed] [CrossRef]
63. Fratanduono DE, Smith RF, Ali SJ, Braun DG, Fernandez-Pañella A, Zhang S, et al. Probing the solid phase of noble metal copper at terapascal conditions. Phys Rev Lett. 2020;124(1):015701. doi:10.1103/PhysRevLett.124.015701. [Google Scholar] [PubMed] [CrossRef]
64. Grimvall G, Magyari-Köpe B, Ozoliņš V, Persson KA. Lattice instabilities in metallic elements. Rev Mod Phys. 2012;84(2):945–86. doi:10.1103/revmodphys.84.945. [Google Scholar] [CrossRef]
65. Wang J, Yip S, Phillpot S, Wolf D. Crystal instabilities at finite strain. Phys Rev Lett. 1993;71(25):4182–5. doi:10.1103/PhysRevLett.71.4182. [Google Scholar] [PubMed] [CrossRef]
66. Clavier G, Desbiens N, Bourasseau E, Lachet V, Brusselle-Dupend N, Rousseau B. Computation of elastic constants of solids using molecular simulation: comparison of constant volume and constant pressure ensemble methods. Mol Simul. 2017;43(17):1413–22. doi:10.1080/08927022.2017.1313418. [Google Scholar] [CrossRef]
67. Gerlich D, Fisher ES. The high temperature elastic moduli of aluminum. J Phys Chem Solids. 1969;30(5):1197–205. doi:10.1016/0022-3697(69)90377-1. [Google Scholar] [CrossRef]
68. Overton WC, Gaffney J. Temperature variation of the elastic constants of cubic elements. I Copper Phys Rev. 1955;98(4):969–77. doi:10.1103/physrev.98.969. [Google Scholar] [CrossRef]
69. Garkushin GV, Savinykh AS, Razorenov SV, Rasposienko DY, Brodova IG. The mechanical response of pre-strained [100] aluminium single crystals under plane impact. Tech Phys. 2023;68(11):1468–75. doi:10.61011/TP.2023.11.57497.181-23. [Google Scholar] [CrossRef]
70. Al’tshuler LV, Kormer SB, Bakanova AA, Trunin RF. Equation of state for aluminum, copper, and lead in the high pressure region. Sov Phys JETP. 1960;11(3):573–9. [Google Scholar]
71. Thomas SA, Hixson RS, Hawkins MC, Strand OT. Wave speeds in single-crystal and polycrystalline copper. Int J Impact Eng. 2020;139:103506. doi:10.1016/j.ijimpeng.2020.103506. [Google Scholar] [CrossRef]
72. Jones OE, Mote JD. Shock-induced dynamic yielding in copper single crystals. J Appl Phys. 1969;40(12):4920–8. doi:10.1063/1.1657314. [Google Scholar] [CrossRef]
73. Bryukhanov IA. Atomistic simulation of the shock wave in copper single crystals with pre-existing dislocation network. Int J Plast. 2022;151:103171. doi:10.1016/j.ijplas.2021.103171. [Google Scholar] [CrossRef]
74. Khishchenko KV, Mayer AE. High- and low-entropy layers in solids behind shock and ramp compression waves. Int J Mech Sci. 2021;189:105971. doi:10.1016/j.ijmecsci.2020.105971. [Google Scholar] [CrossRef]
75. Sadovnichy V, Tikhonravov A, Voevodin V, Opanasenko V. “Lomonosov”: supercomputing at Moscow state university. In: Vetter JS, editor. Contemporary high performance computing: from petascale toward exascale. Philadelphia, PA, USA: CRC Press; 2013. p. 283–307. doi:10.1201/9781351104005-11. [Google Scholar] [CrossRef]
Cite This Article
 Copyright © 2026 The Author(s). Published by Tech Science Press.
This work is licensed under a Creative Commons Attribution 4.0 International License , which permits unrestricted use, distribution, and reproduction in any medium, provided the original work is properly cited.
 Downloads
 Citation Tools