
 Submit a Paper
 Propose a Special lssue
 Open Access
ARTICLE
Explainable Hybrid AI Model for DDoS Detection in SDN-Enabled Internet of Vehicle
1 Department of Information Systems, College of Computer and Information Sciences, Princess Nourah bint Abdulrahman University, P.O. Box 84428, Riyadh, 11671, Saudi Arabia
2 Department of Computer Science, Abdul Wali Khan University Mardan, Mardan, 23200, KPK, Pakistan
3 School of Computing, Gachon University, Seongnam-si, 13120, Republic of Korea
4 School of Digital Engineering, Narxoz University, Almati, 050000, Kazakhstan
5 Faculty of Computer and Artificial Intelligence, Fayoum University, Fayoum, 63514, Egypt
6 Department of Applied Statistics and Econometrics, Faculty of Graduate Studies for Statistical Research, Cairo University, Giza, 12613, Egypt
7 Department of Economics, College of Business, Imam Mohammad Ibn Saud Islamic University (IMSIU), P.O. Box 90950, Riyadh, 11623, Saudi Arabia
8 Department of Informatics and Computer System, College of Computer Science, King Khalid University, Abha, 61421, Saudi Arabia
* Corresponding Author: Ateeq Ur Rehman. Email:
Computers, Materials & Continua 2026, 87(2), 20 https://doi.org/10.32604/cmc.2025.072772
Received 03 September 2025; Accepted 14 November 2025; Issue published 12 March 2026
 View Full Text
 Download PDF
Abstract
The convergence of Software Defined Networking (SDN) in Internet of Vehicles (IoV) enables a flexible, programmable, and globally visible network control architecture across Road Side Units (RSUs), cloud servers, and automobiles. While this integration enhances scalability and safety, it also raises sophisticated cyberthreats, particularly Distributed Denial of Service (DDoS) attacks. Traditional rule-based anomaly detection methods often struggle to detect modern low-and-slow DDoS patterns, thereby leading to higher false positives. To this end, this study proposes an explainable hybrid framework to detect DDoS attacks in SDN-enabled IoV (SDN-IoV). The hybrid framework utilizes a Residual Network (ResNet) to capture spatial correlations and a Bi-Long Short-Term Memory (BiLSTM) to capture both forward and backward temporal dependencies in high-dimensional input patterns. To ensure transparency and trustworthiness, the model integrates the Explainable AI (XAI) technique, i.e., SHapley Additive exPlanations (SHAP). SHAP highlights the contribution of each feature during the decision-making process, facilitating security analysts to understand the rationale behind the attack classification decision. The SDN-IoV environment is created in Mininet-WiFi and SUMO, and the hybrid model is trained on the CICDDoS2019 security dataset. The simulation results reveal the efficacy of the proposed model in terms of standard performance metrics compared to similar baseline methods.Keywords
The Internet of Vehicles (IoV) has revolutionized vehicular communication by providing instant vehicle functioning and connectivity. IoV, a class of Internet of Things (IoT), extends device and infrastructure communication beyond simple internet access, enhancing traffic management, road safety, and passenger comforts by allowing seamless exchange of data between smart devices and other components in the transportation ecosystem [1]. IoV involves heterogeneous networks, high mobility, and massive data traffic, posing significant challenges in terms of scalability, optimal routing, resource allocation, flexibility, and centralized control. To address these challenges, SDN, when integrated into IoV, provides an efficient solution. SDN enables a global view of the vehicular network through programmable and centralized control, making informed decisions about data routing, traffic management, congestion control, and service provisioning in real-time [2,3]. SDN-IoV revolutionizes the Intelligent Transportation System (ITS), improving network reliability, scalability, flexibility, and responsiveness to unpredictable topology changes.
SDN-IoV architecture consists of three layers, i.e., (i) infrastructure layer forms the data plane of the network where vehicular nodes, network switches, and RSUs are located, (ii) control layer contains the SDN controller that manages network intelligence and makes informed decisions via programmable configuration, and (iii) application layer contains applications and services that utilize network capabilities. SDN utilizes an OpenFlow communication protocol that enables the programmable and centralized nature of SDN, making it essential for dynamic configuration and intelligent traffic and mobility management in the IoV environment [4,5].
The integration of SDN into IoV offers numerous benefits, including scalability, dynamic configuration, and intelligent management. However, because of centralized control, it exposes the system to a new set of vulnerabilities and security challenges, particularly Distributed Denial of Service (DDoS) attacks. SDN-IoV systems are vulnerable to DDoS attacks at multiple levels (e.g., Southbound API attacks, Northbound API attacks, etc.) [6,7]. The malicious user can target the SDN controller by flooding too many fake emergency messages, also called Packet-in messages, to prevent legitimate users from accessing controller resources (e.g., memory and CPU). Moreover, the attacker can use the flow table saturation or flow rule exhaustion by injecting a high volume of malicious flow rules to switches, which are then forwarded to the controller, rendering the network unresponsive to the legitimate IoV devices. This can cause unauthorized traffic redirection, compromising vehicle-to-infrastructure communications. These issues reflect the vulnerability of the SDN-IoV architecture to DDoS attacks.
Conventional threshold and rule-based intrusion detection methods may struggle to detect emerging intrusions in modern dynamic networks. These methods rely on predefined patterns, making it difficult to detect variant attacks that do not match any signature. Traditional methods are unable to understand contextual understanding and long temporal dependencies of input patterns [8].
Various Deep Reinforcement Learning (DRL) based intrusion detection methods have been proposed in the literature to detect emerging DDoS attacks [9–11]. Among other DRL methods, the Convolutional Neural Network (CNN) has shown remarkable performance in various tasks, such as image classification, object detection, and intrusion detection. However, as network depth increases, traditional CNNs face significant challenges, including the vanishing or exploding gradients problem, which can lead to unstable training and hinder convergence. Upon increasing the network depth, CNN can result in higher training error due to optimization difficulties. They operate on fixed-size inputs and rely on local convolutional operations, which limit their ability to learn long-term dependencies in sequential data, especially in evolving DDoS attack flows.
To address these challenges, the ResNet model is introduced in [12] that uses the concept of residual learning and identity shortcut connections. ResNet learns a residual function instead of learning a direct mapping, and then reconstructs the desired output, encouraging the network to learn only modifications to the input, which is easier to optimize. With the help of identity shortcuts, also called skip connections, ResNet allows gradients to bypass one or more layers. This mitigates a vanishing gradient problem, facilitating the training of very deep networks (e.g., 50, 101, 152 layers).
The presence of skip connections and shortcut paths enhances the flow of information and gradient during training, resulting in faster convergence, lower training error, and improved generalization performance. Moreover, ResNet can be scaled to 100 or even 1000 layers without suffering from optimization issues. These characteristics make the ResNet model suitable for real-time DDoS attacks in an SDN-IoV environment.
In this study, we utilized a ResNet neural network model to extract deep spatial features from network traffic data by employing its deep residual learning architecture without performance degradation. This enables the model to capture complex patterns and hierarchical dependencies in the input sequence indicative of DDoS behavior. However, the behavior of most of the DDoS attacks changes over time, showing different behavior at different times. Therefore, a ResNet model alone cannot effectively identify long-term dependencies and contextual relationships across input sequences. To this end, we integrate BiLSTM into the ResNet architecture to capture the temporal dynamics of input sequences in both forward and backward directions. BiLSTM can remember both past (forward pass) and future (backward pass) information for each time step. This significantly improves the model’s understanding of temporal dynamics, especially when the current output depends on both preceding and succeeding events. In a DDoS attack, malicious traffic exhibits dependencies across various time intervals. BiLSTM can provide a comprehensive temporal representation.
The resultant hybrid model (ResNet + BiLSTM) can significantly improve the detection accuracy. However, the predicted decisions of the hybrid model are not fully trustworthy due to a lack of interoperability and explainability. Hence, the decision cannot be used to optimize the algorithm’s behavior. Moreover, the predicted decision is not standardized, making it very difficult for the administrator to interpret and analyze the output in terms of the most contributing features.
To address the issue, this study utilizes an Explainable AI (XAI) framework, specifically SHapley Additive exPlanation (SHAP), to provide clear, systematic, and standardized reasoning for model-predicted decisions, thereby improving user understanding and interoperability. The integration of SHAP enables domain experts to gain insight into which features contribute most significantly to attack detection, facilitating model validation and optimization.
Unlike traditional hybrid models (e.g., CNN + LSTM) that mainly focus on sequential data patterns, the proposed hybrid model processes multi-dimensional traffic features to extract deeper hierarchical spatial correlations by introducing residual connections. Additionally, the BiLSTM captures both past and future dependencies, improving the temporal understanding of DDoS traffic flows in the SDN-IoV network. Furthermore, the integration of SHAP-based explainability sets this work apart by offering transparency and interpretable insights into model output decisions, helping system experts understand why certain traffic flows are flagged as malicious. To the best of our knowledge, this is the first effort to use the explainable hybrid ResNet + BiLSTM framework for DDoS detection in SDN-enabled IoV networks.
The smart SDN-IoV environment is developed using Mininet-WiFi and SUMO. The proposed hybrid model is implemented in Python 3.10 using the TensorFlow 2.12.0 framework and is trained on the CICDDoS2019 and BoT-IoT security dataset to validate the performance of the proposed model in terms of standard performance metrics, i.e., accuracy, precision, recall, and F1 score. The experiments were conducted on a laptop equipped with an 11th-generation 2.6 GHz Intel Core i9 processor, 1 TB hard drive, and 16 GB RAM. The simulation results demonstrate that the proposed model offers superior resilience in detecting DDoS attacks in the SDN-IoV environment compared to baseline methods. Additionally, the proposed model is highly robust against variations in the input data and effectively captures complex correlations in network traffic through deep convolutional architectures. This makes it particularly suitable for dynamic and unpredictable network topologies like vehicular networks, thereby enhancing overall network reliability. The workflow of the proposed model is given in Fig. 1.

Figure 1: Workflow of the proposed hybrid model
The main contributions of the article are given below:
• We employ a hybrid model to detect DDoS attacks in SDN-enabled IoV networks. The model utilizes a ResNet neural network to learn high-level abstract features through residual learning and shortcut connections without suffering from performance degradation, and a BiLSTM to classify temporal dynamics in both forward and backward directions, providing a more comprehensive understanding of traffic behavior over time.
• We used an XAI framework i.e., SHAP, to increase the trustworthiness and transparency of the model’s predicted decision by identifying the most contributing features in the attack detection. This helps the security analyst to understand the rationale behind the attack classification decision.
• Comprehensive simulations are performed to evaluate the efficiency of the hybrid model on the CICDDoS2019 security dataset in terms of designated performance metrics.
The rest of the article is organized as follows: Section 2 covers recent studies on DDoS attacks in SDN-IoV environment, Section 3 describes the proposed hybrid model, detailing mathematical modeling and model layer-wise flow structure. Section 4 contains the experimental setup and the results discussion. Finally, in Section 5, we conclude our paper with future directions.
In this section, we discuss the most recent studies on DDoS attack detection in SDN-enabled IoT networks. Various DRL-based intrusion detection methods have been proposed in the literature, but there is a gap that needs to be filled with high detection accuracy and low false positives. In [13], the authors proposed a machine learning (ML) approach to combat DDoS attacks in SDN-enabled IoT. The approach utilized three ML models, i.e., logistic regression, Naive Bayes, and random forest to classify the network traffic as benign or malicious. The results are then forwarded to the SDN controller to take action accordingly. Bhale et al. [14] proposed a lightweight, transparent, and optimally placed distributed intrusion detection system for IoT networks. The objective was to mitigate mixed-rate DDoS attacks while minimizing energy overhead and concealing of IDS nodes from attackers. In [15], the authors proposed an SDN-based pseudo-honeypot strategy for DDoS detection in Industrial IoT. The algorithm utilizes an SDN to dynamically redirect potentially malicious traffic from legitimate devices to decoy nodes that mimic target behavior, deceiving attackers while preserving system integrity. The results exemplify the efficiency of the proposed algorithm in terms of low overhead, invisibility, and resource optimization compared to similar baseline methods.
In [16], a Learning-driven detection mitigation (LEDEM) mechanism is introduced to detect and mitigate DDoS attacks on IoT servers. The proposed scheme leverages a semisupervised machine learning algorithm deployed over an SDN-cloud framework to distinguish malicious traffic from benign flows. Upon detection, the mitigation process is executed via cloud-assisted SDN control, filtering malicious traffic and preserving legitimate communication. Albishi et al. [17] proposed a DDoS detection mechanism using a machine learning model for IoV. The proposed scheme addresses the most popular type of DDoS attacks, i.e., User Datagram Protocol (UDP) Lag and SYN Flood. To detect UDP Lag attack, ML models such as Decision Tree (DT), Random Forest (RF) obtained efficient results up to 99.9% in terms of precision, recall, and F1 score. While in the SYN Flood attack, K-Nearest Neighbor (KNN) and decision tree demonstrated superior results.
An efficient and lightweight attack detection and mitigation scheme is proposed in [18]. The proposed scheme utilizes entropy and flow rate analysis to identify anomalous incoming traffic patterns, while an adaptive threshold based on payload length is applied to filter malicious flows. Specific flow rules are placed only if the payload falls below the threshold. The scheme dynamically computes flow rate, entropy, and payload length to adjust to real-time traffic conditions. In [19], the authors proposed trust-based DDoS detection in a software-defined vehicular network. The misbehavior of a vehicle is detected using the trustworthiness of a vehicle, which is computed from a trust value. The trust value of a vehicle is derived from an evaluator node that decides whether the vehicle is malicious or not.
The authors in [20], proposed a graph neural network-based collaborative deep reinforcement learning model that dynamically generates resource provisioning and mitigation strategies to ensure MEC servers maintain normal operation under DDoS attacks. The model evaluates the trustworthiness of a vehicle to assess potential threat sources. GNN captures the structural relationship among MEC servers to support task migration and balancing. The model assumes only specific types of DDoS attacks and does not consider variants, making it vulnerable to slow-rate DDoS attacks.
Wazid et al. [21], proposed an explainable deep learning-based malware detection for IoT-enabled ITS. The authors utilize a deep neural network to detect and classify intrusions by analyzing IoT devices’ behavior within ITS infrastructure. The scheme employs an XAI mechanism to explain decisions made by the model, enhancing trust and interoperability. A Deep Learning-based XAI method is proposed in [22] for malware detection in IoV. The scheme utilizes a hybrid model, i.e., BiLSTM and a multi-head self-attention for the malware classification process. To extract spatial features within network traffic, the model employs the reptile search algorithm (RSA). The parameter tuning process is performed using the Pelican optimization algorithm (POA) to improve model classification performance. Finally, to escalate the decision-making process of a model, the SHAP framework is used.
Despite significant advancements in the field of ITS security, many of the existing studies suffer from critical limitations. They often neglect the essential requirement of explainability, which is vital for the domain expert to trust, validate, and act upon the model’s decision. Moreover, by employing conventional machine learning schemes, the model typically exhibits limited generalization capabilities, resulting in degraded performance when faced with variant attack patterns.
To address the challenge of detecting DDoS attacks in SDN-IoV networks, we propose an explainable hybrid model that combines the architectures of convolutional neural networks and recurrent neural networks. This hybrid model leverages the strength of ResNet and BiLSTM to extract both deep spatial and temporal features from input sequences, respectively, enabling robust, accurate, and resilient detection of DDoS attacks. Moreover, the model’s predicted decision is analyzed using SHAP-based values, which identify the most significant features contributing to the model’s prediction.
The proposed algorithm contains four phases. In the first phase, we normalized the data to convert it into a standard format, making it ready for smooth training by eliminating unnecessary values in the datasets. The second phase involves training the ResNet and BiLSTM neural networks separately. In the third phase, we combined the learned features of each neural network to improve model detection accuracy and generalization capability. In the last phase, the model’s predicted decision is analyzed using an XAI framework, i.e., SHAP, enabling the domain expert to understand the rationale behind the attack classification decision.
A comprehensive data preprocessing is employed to enhance the effectiveness and reliability of the proposed hybrid model in detecting DDoS attacks. This process is necessary to convert the data into an analyzable format by eliminating inconsistent and anomalous data from the dataset. In this step, we used min-max normalization to scale each feature to a predefined range, typically 0 (indicating benign data) and 1 (indicating malicious data), ensuring uniformity in the magnitude of input values. Normalization prevents features from disproportionately influencing the learning process. Moreover, normalizing the network traffic into a reducible format accelerates convergence and mitigates the risks of the vanishing gradient problem. Mathematically, the equation below is used to perform data pre-processing.
where
3.2 Extracting Deep Spatial Features Using the ResNet Model
ResNet is a deep neural network architecture which is introduced to combat high training error occurs due to the vanishing/exploding gradient problem. Traditional deep learning architectures, such as CNN, suffer from performance degradation when the number of layers increases. ResNet solves this problem by introducing a concept called residual blocks learning, which uses the skip connection technique to connect activations of a layer to further layers by skipping some layers in between. In a ResNet, the skip connection adds the input of a layer to the output of the residual block, allowing each layer to learn a residual mapping instead of directly trying to learn the target output. The shortcut connection allows gradient to bypass certain convolutional layers during backpropagation, facilitating the training of large deep networks.
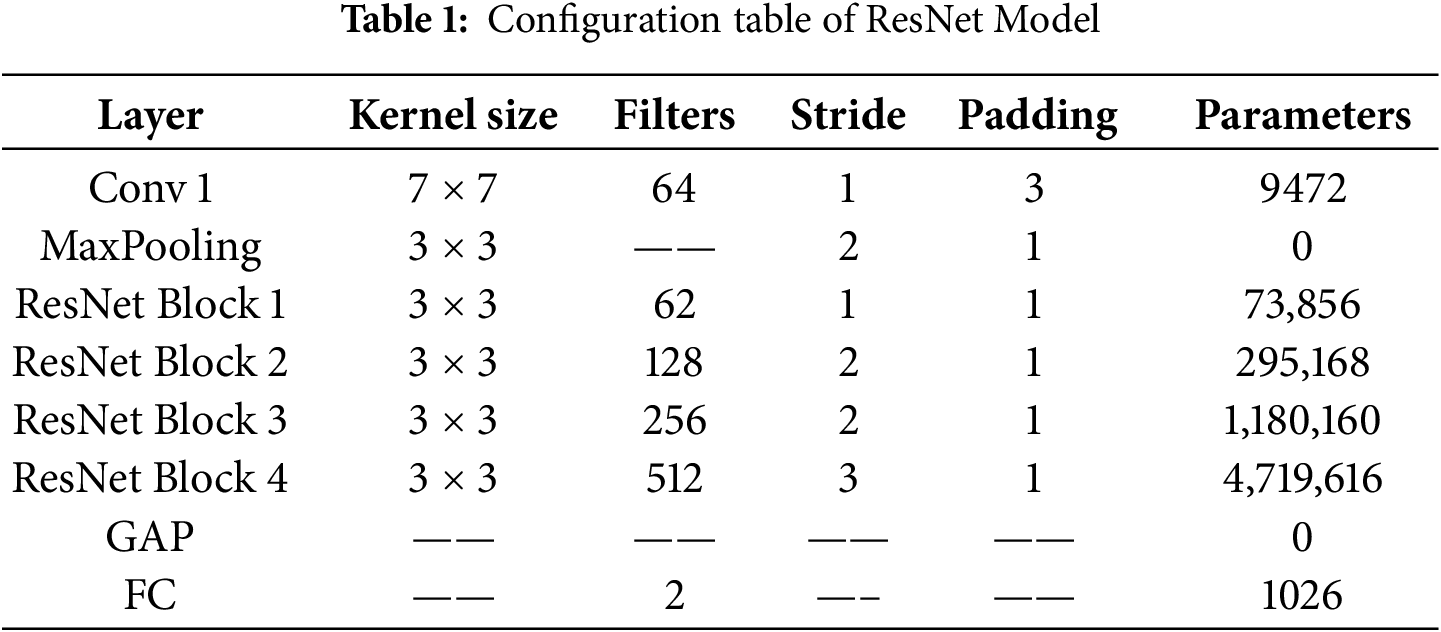
In this study, we used the ResNet architecture to extract deep spatial features from the dataset, capturing subtle patterns associated with each attack type. ResNet offers an optimal balance between computational complexity and feature extraction capability, making it well-suited for DDoS attack detection in SDN-IoV. The architecture consists of initial convolutional layers followed by four residual blocks. Each block has two convolutional layers, followed by batch normalization and the Rectified Linear Unit (ReLU) activation function.
Initial Convolutional layer: The initial convolutional layer utilizes 64 filters of 7 × 7 kernel size, acts as an edge detector for network traffic, and identifies low-level features such as packet rate fluctuations and abnormal flag distributions, etc. It moves across the input with a stride of 1 to preserve spatial resolution while detecting fundamental traffic anomalies. Following this, the architecture uses a 3 × 3 max pooling layer with a stride of 2 to perform the first-down sampling to reduce the dimensionality by 50% while preserving the most silent traffic anomalies. This is particularly valuable for DDoS detection as they maintain the strongest DDoS indicators. Mathematically, low-level feature extraction is performed as below:
where
Residual Blocks: Each residual block consists of two 3 × 3 convolutional layers that progressively extract hierarchical features. The first residual block identifies local traffic deviations like flow surges, the second block extracts mid-level patterns such as SYN-ACK imbalance, the third captures high-level correlations, and the fourth discerns global attack signatures. The number of filters in each subsequent block increases to 64, 128, then 256, and finally 512, allowing the network to extract more complex features at deeper layers. This increase enables the detection of more intricate and complex patterns, which are crucial for detecting DDoS attacks. Mathematically, the function of residual blocks is represented as below:
where
where
Global Average Pooling (GAP): At the end, the feature maps are then passed to the average pooling layer to compute the average of the feature maps, reducing each feature to a single value. This creates a 512-dimensional vector, which is less prone to overfitting and significantly reduces the number of trainable parameters. The GAP layer effectively summarizes the spatial information of each feature map while preserving the most silent attributes of each feature. The resultant output vector is then finally passed to the fully connected layer, followed by a sigmoid activation function to map high-level features to binary classification, identifying whether the network represents a normal behavior or a DDoS attack. Mathematically, it is computed as below:
where R and C indicate the number of rows and columns. The phases of residual learning are illustrated in Fig. 2. The configuration table with parameter counts of the ResNet model is given in Table 1.
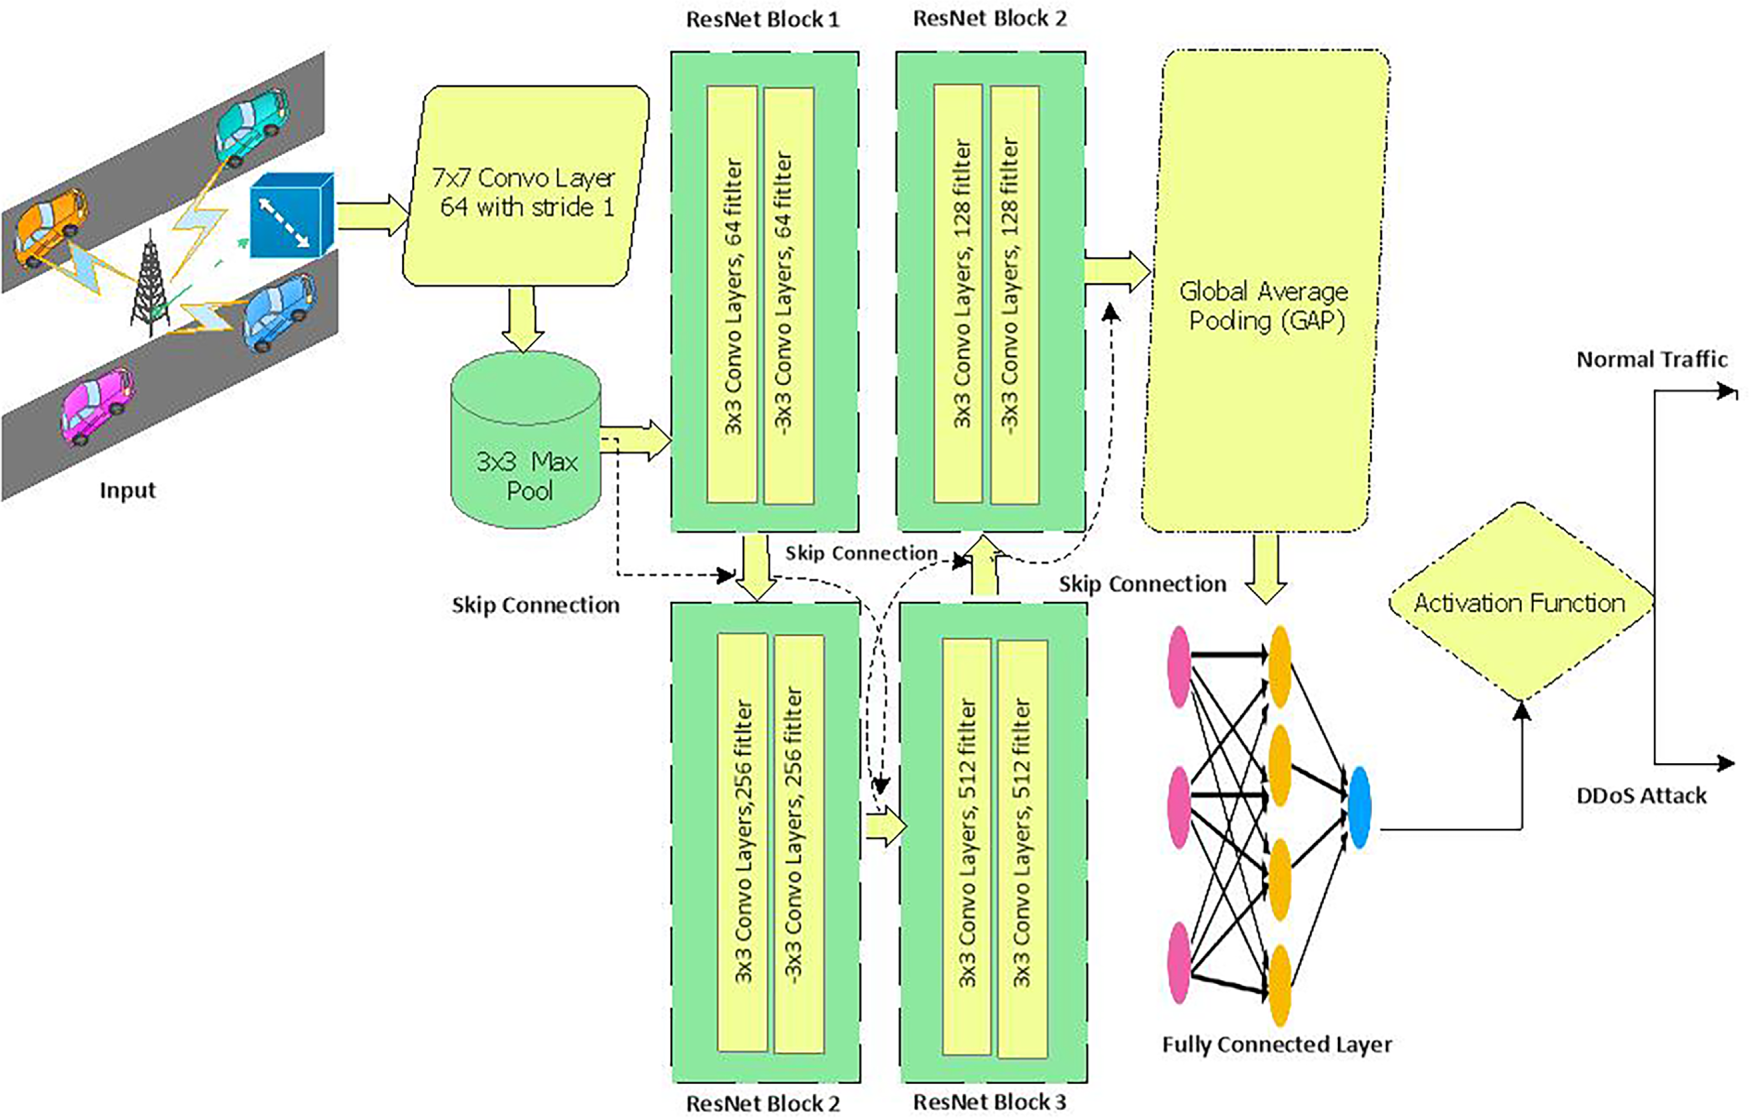
Figure 2: Phases of residual learning
3.3 Temporal Sequence Modeling Using BiLSTM
The detection of DDoS attacks in SDN-IoV requires advanced temporal pattern recognition due to complex network traffic anomalies. BiLSTM offers enhanced temporal feature extraction by processing information in both forward and backward directions, enabling the model to capture both past and future contextual relationships within network traffic. BiLSTM architecture consists of two parallel LSTM layers, i.e., forward layer and backward layer. The forward layer processes network traffic from past to future (T1→Tn) and can detect early attack indicators (e.g., rising SYN packets), while the backward layer processes input sequence from future to past (Tn→T1), identifies post-attack threats. The output of these layers is merged into a rich feature vector that encapsulates complete temporal dynamics. Each layer performs gated operations on sequential data of the SDN-IoV environment to determine whether the information in the cell state is required to be retained, removed or pass it to the next cell. The following gated operations is performed in each LSTM layer.
The forward LSTM computes the hidden state as below:
And the backward LSTM compute hidden state as below:
3.4 Hybrid ResNet + BiLSTM Model
The hybrid model is collaboratively trained to detect DDoS attacks by integrating the strengths of deep spatial feature extraction from ResNet with the temporal sequence modeling of BiLSTM. The ResNet model extracts deep spatial features within network traffic, such as packet structure anomalies. ResNet model receives a rich high-level features vector at time t, after a series of convolutional layers and residual learning blocks, it reduces the spatial feature dimensions using GAP. Mathematically, it is represented as below:
A sequence of output is constructed over a time window T:
The final output is then fed to the BiLSTM to process input sequences both in forward and backward direction in search of dynamic temporal anomalies.
The output of BiLSTM is concatenated and passed through a fully connected layer, followed by a sigmoid activation function for traffic classification. Mathematically, it is represented as below:
The objective of the hybrid model is to minimize classification loss using a loss function. Since the detection of DDoS attacks is often a binary classification problem, we used a binary cross-entropy loss function to compare the predicted score with the actual label and compute the error.
where S is the number of samples,
3.5 Explainable AI for Hybrid Model
Most AI models are considered black box models, making it difficult for system analysts to understand how the model reaches a specific result. XAI is a method that allows domain experts to understand, trust, and interpret the results and outputs generated by AI models. When XAI is incorporated into a hybrid model, it enhances the reliability and trustworthiness of the system by providing thorough reasoning for the model output. It scans the model for potential biases, enhancing fairness and system robustness. Moreover, it analyzes the predicted decision of a hybrid model and identifies the most contributing features to the decision.
To achieve the objectives, this study employs the SHAP XAI model to interpret the decision of a model by identifying the most contributing features. SHAP computes the importance score of each feature, thereby explaining the contribution of each feature to a decision. Mathematically, it is represented as below:
where
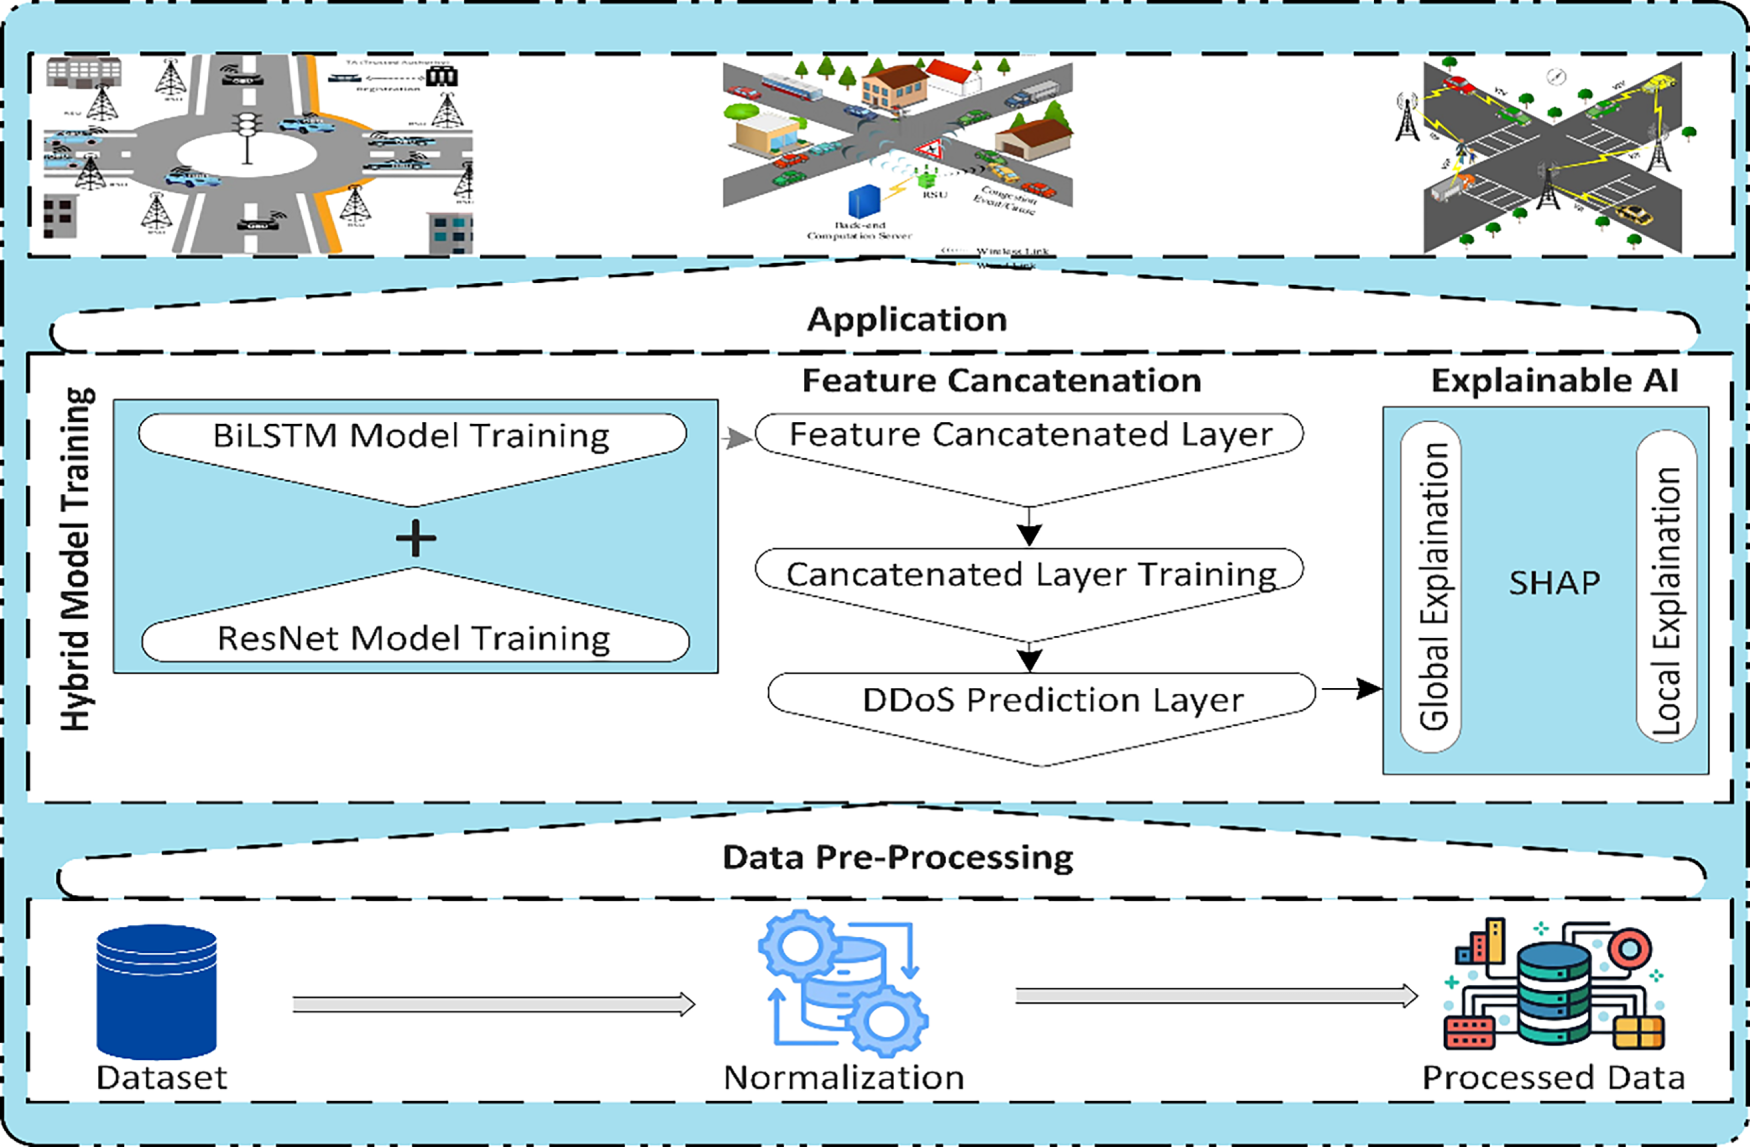
Figure 3: Layered architecture of the proposed hybrid model
3.6 Computational Cost and Training Time Analysis
In this section, we assess the scalability and computational efficiency of the proposed hybrid model against baseline methods. To this end, several computational parameters are taken into consideration, such as Floating-point Operation (FLOPs), number of parameters (number of trainable weights and biases in the model, expressed in millions (M)), model size (measured in megabytes), inference time, and training time. FLOPs represent the number of floating-point arithmetic operations required to process one input sample. These parameters collectively reflect the scalability and efficiency of the proposed model. The results in Table 2 show that the proposed model achieves a balanced trade-off between computational efficiency and accuracy. It demonstrates a moderate computational demand (2.24 × 10⁹ FLOPs and 7.9 million parameters) compared to other deeper hybrid models such as MLP + LSTM (4.10 × 10⁹ FLOPs) and LGBM + LSTM (4.82 × 10⁹ FLOPs). This indicates that the proposed model requires nearly 45% fewer operations, resulting in reduced computational overhead and faster convergence.
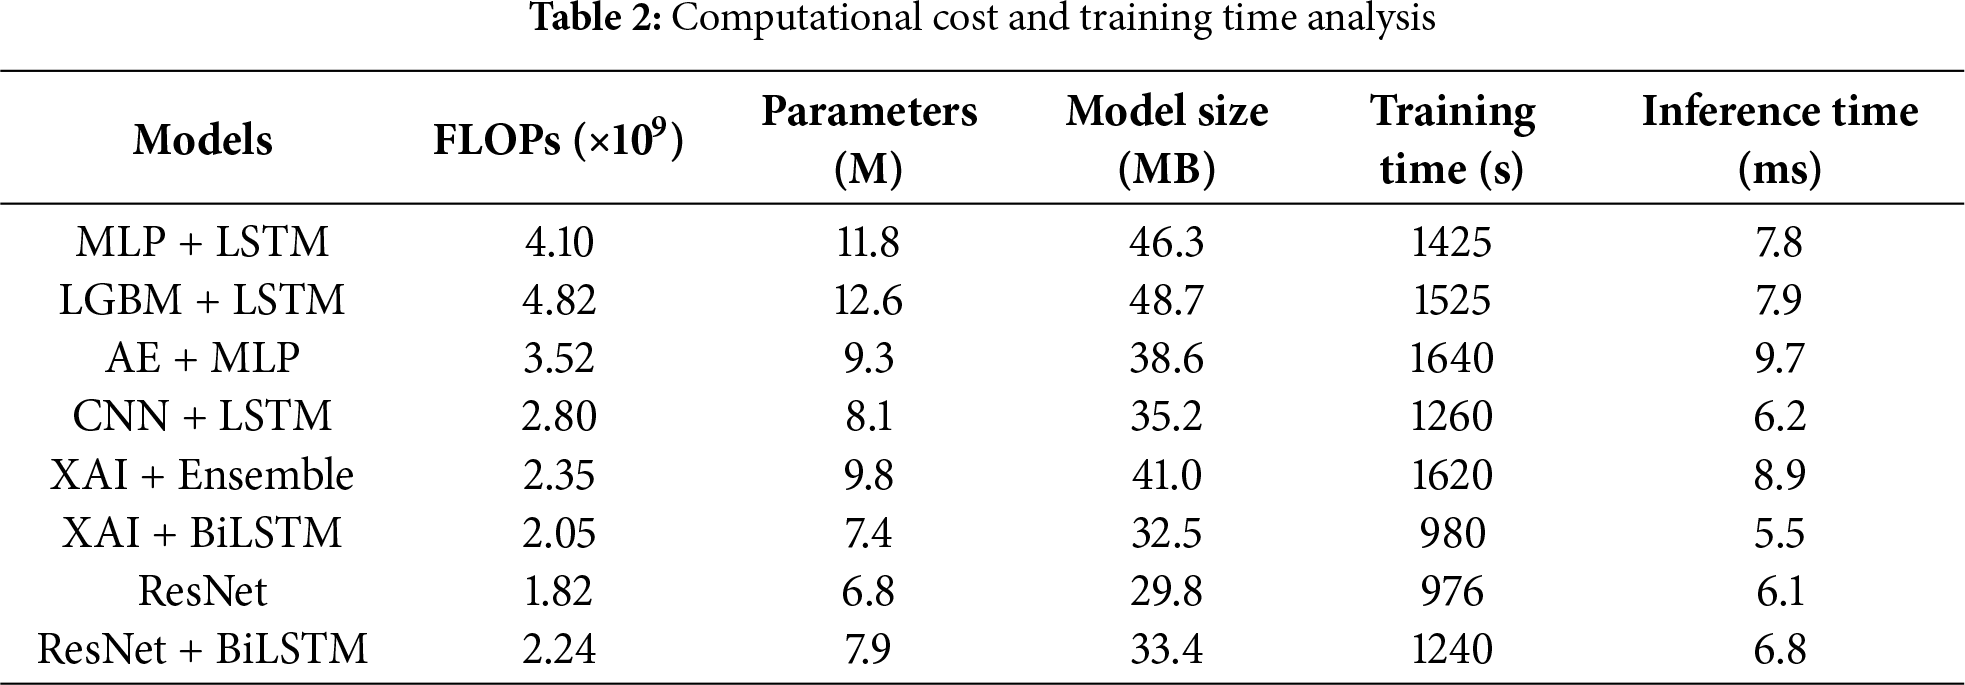
Regarding model size, the proposed model (33.4 MB) is lighter than benchmark hybrid models, reflecting its suitability for deployment in resource-constrained IoT devices such as fog or edge nodes. Moreover, the training time (1240 s) and inference time (6.8 ms) of the proposed model is also shorter than other deep hybrid models e,g, MLP + LSTM and AE + MLP require 1425 and 1640 s to train a model, respectively.
4 Experimental Setup and Results Discussion
This section describes the experimental setup, performance metrics, particulars of the datasets used, and comparative analysis of the proposed algorithm with the state-of-the-art baseline methods. We used Mininet-WiFi and the SUMO simulation tool to design the smart SDN-IoV environment. The proposed hybrid model is implemented in Python 3.10 using the TensorFlow 2.12.0 framework. The simulation is performed on an HP laptop equipped with an 11th-generation 2.6 GHz Intel Core i9 processor, 1 TB hard drive, and 16 GB RAM.
The proposed model is trained on two datasets separately: CICDDoS2019 and the BoT-IoT security dataset, to ensure adaptability and generalization across diverse IoV traffics. Both datasets were independently preprocessed and normalized using Min-Max normalization. The CICDDoS2019 dataset contains one normal class and various DDoS-related attack classes. This dataset provides a rich collection of real-world network traffic scenarios, capturing various types of attacks, including DoS and DDoS attacks. These attack classes are categorized into exploitation-based attacks and reflection-based attacks. The reflection-based attacks are subcategorized into TCP-based attacks, UDP-based attacks, and TCP/UDP-based attacks. The TCP-based attacks consist of MSSQL and SSDP, which represent amplification-based DDoS traffic that exploits specific service protocols, not purely transport-level floods. UDP-based attacks include NTP and TFTP attacks, while TCP/UDP-based attacks include LDAP, DNS, WebDDoS, and SNMP attacks. Exploitation-based attacks can be conducted through application-layer protocols using the transport layer. This study utilizes 12 DDoS attacks. The BoT-IoT dataset also contains two sets of data, i.e., one benign class and various malicious traffic, which is related to different attacks such as Reconnaissance attack, information theft, DoS attack, and DDoS attack. The DDoS attacks are divided into TCP-based DDoS attacks, UDP-based DDoS attacks, and HTTP-based DDoS attacks.
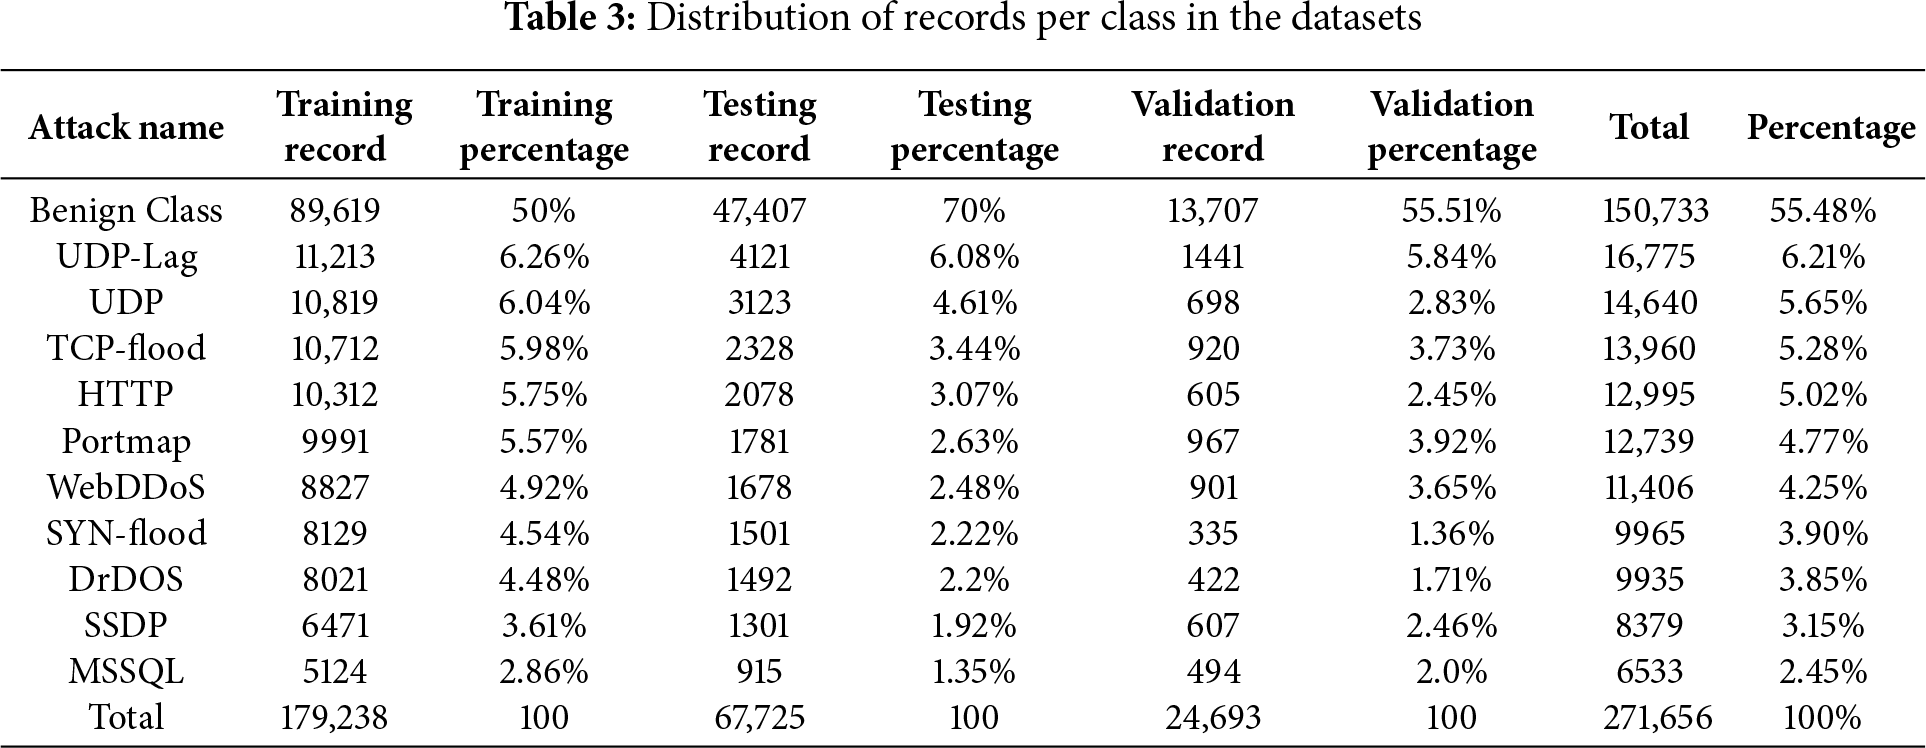
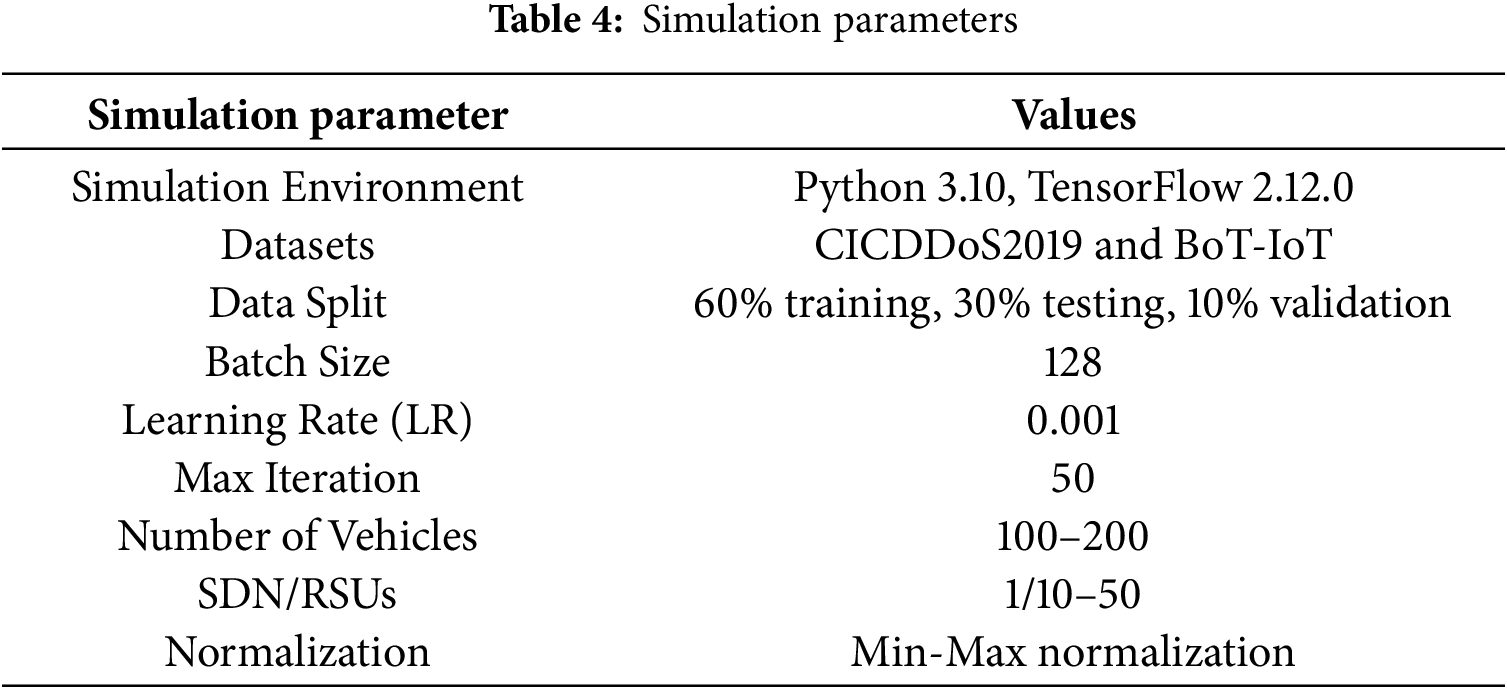
To address the class imbalance within the datasets, a weighted cross-entropy function is applied, where we assigned higher weights to minority attack classes to ensure balanced model learning across all attack categories. The details of each dataset regarding training, validation, and testing records are given in Table 3. 10% of the data is used for validation, 30% is used for testing, and 60% is used for training. We performed a 10-fold cross-validation technique entirely on the training part of the dataset to ensure robust evaluation and prevent data leakage. In each iteration, the training dataset is divided into 10 equal parts, in which 9 parts are used for model training and one part of the dataset is used for internal validation. On the other hand, the testing dataset remained unchanged and was reserved for final model evaluation. This guarantees that no data is used for training or parameter selection overlaps with the testing samples, ensuring fair and unbiased performance assessment. The simulation parameters and baseline model configurations are given in Tables 4 and 5, respectively.
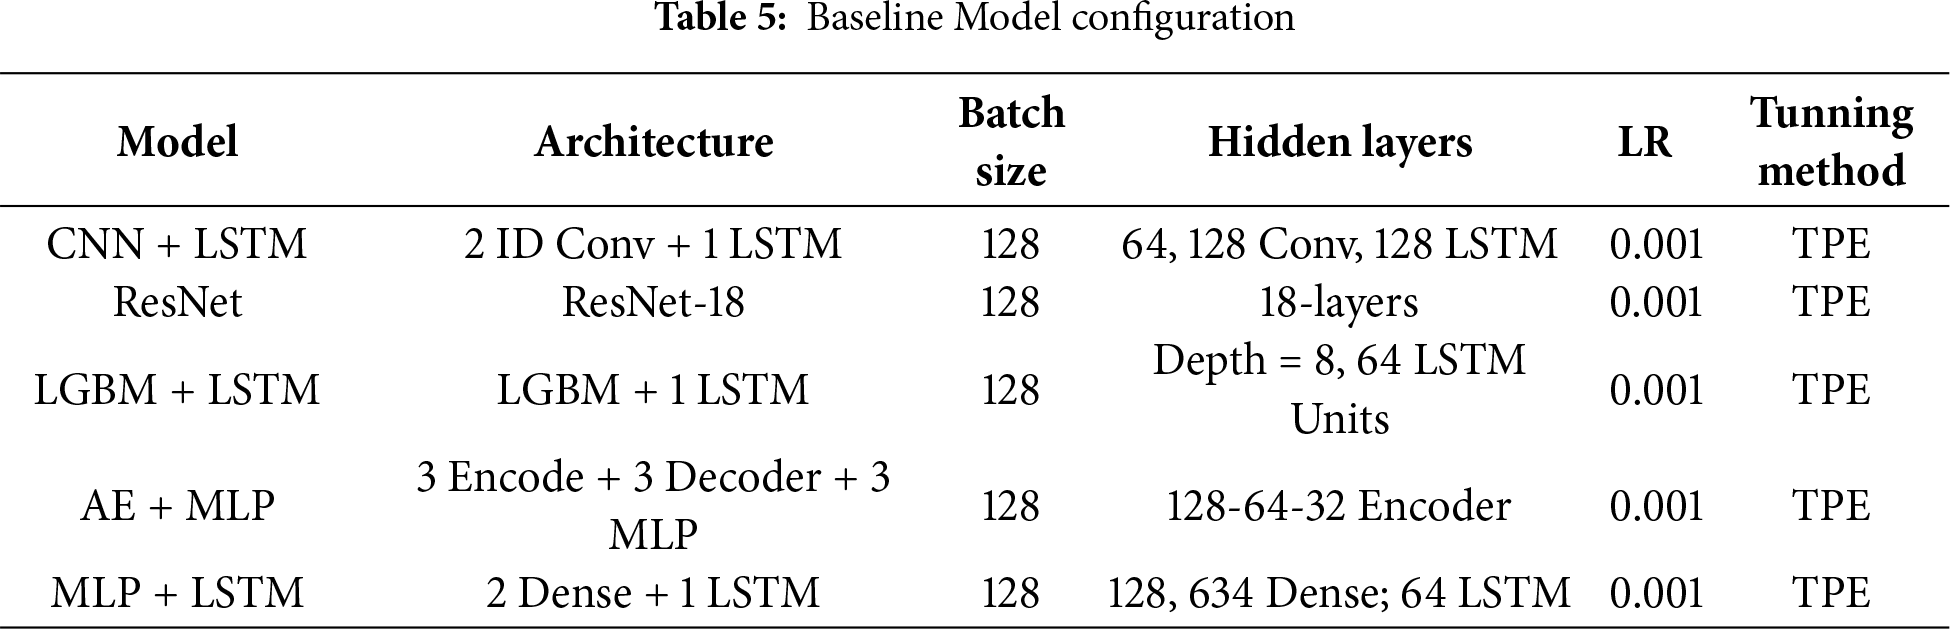
All the baseline models were trained for 50 iterations with a learning rate of 0.001 using the cross-entropy loss function. To ensure optimal performance and fair comparison, the hyperparameters were fine-tuned using Tree-structured Parzen Estimator (TPE).
4.1 SDN-IoV Testbed Configuration
To create a realistic vehicular environment, the SDN-IoV testbed was developed using Mininet-WiFi v2.3.0d and Simulation of Urban Mobility (SUMO) v1.18.0 traffic simulator. A 3 km × 3 km road map was configured as the simulation area with multiple intersection points and bidirectional lanes to simulate vehicular mobility. Within a defined simulation area, 100–200 vehicles and 10–50 RSUs are deployed to maintain connectivity and robustness. The Ryu controller v4.34 was used to manage the SDN control layer with the OpenFlow v1.3 protocol for flow rule installation and traffic management. Each RSU acted as an OpenFlow-enabled switch, forwarding packets between vehicles and RSUs. We have used the Iperf3 and hping3 tools to generate benign and malicious traffic, respectively. The normal traffic followed SUMO-driven mobility traces, while the attack traffic was simulated with varying packets between 100–1000 pps per malicious node.
The proposed model is compared with the baseline methods in terms of standard performance metrics, i.e., accuracy, precision, F1 score, recall, and confusion matrix. These metrics offer a comprehensive evaluation of classification performance, particularly in imbalanced data scenarios such as DDoS detection. Accuracy measures the ratio of correctly predicted observations to the total number of observations. This includes both positive and negative predicted observations. In general, it provides an overall measure of the model’s correctness. Precision measures the proportion of correctly predicted positive observations to the total number of positive observations present in the dataset. Recall quantifies the ability of a model to correctly identify all related positive instances. F1-score is the mean of precision and recall, providing a single metric that balances both concerns. The confusion matrix is a fundamental tool used to compare the performance of a model by comparing actual vs. predicted labels. It assesses the model’s ability in terms of accuracy, precision, recall, and F1 score by identifying true positives (
4.3 Performance Measurement on CICDDoS2019 and BoT-IoT Datasets
This simulation setup evaluates performance using standard performance metrics, with the analysis conducted on the CICDDoS2019 and BoT-IoT datasets. To validate the proposed model’s effectiveness, we used 10-fold cross-validation. The validation results for the proposed hybrid model, compared with the baseline methods, over the CICDDoS2019 and BOT-IoV datasets are presented in Tables 6 and 7, respectively. The outcomes presented in Figs. 4 and 5 demonstrate the proposed model’s efficacy in achieving high detection accuracy (98.29%, 98.84%), precision (98.67%, 98.76%), recall (98.43%, 98.43%), and F1 score (98.42%, 98.57%) on the CICDDoS2019 and BoT-IoT datasets, respectively, outperforming the benchmark methods. This efficiency is attributed to the integration of the ResNet model, which effectively extracts spatial features via deep convolutional layers, and the BiLSTM network, which processes network traffic both in forward and backward directions. This combination allows the model to capture both short-term and long-term dependencies within network traffic data, enhancing its ability to distinguish between benign traffic and malicious traffic.
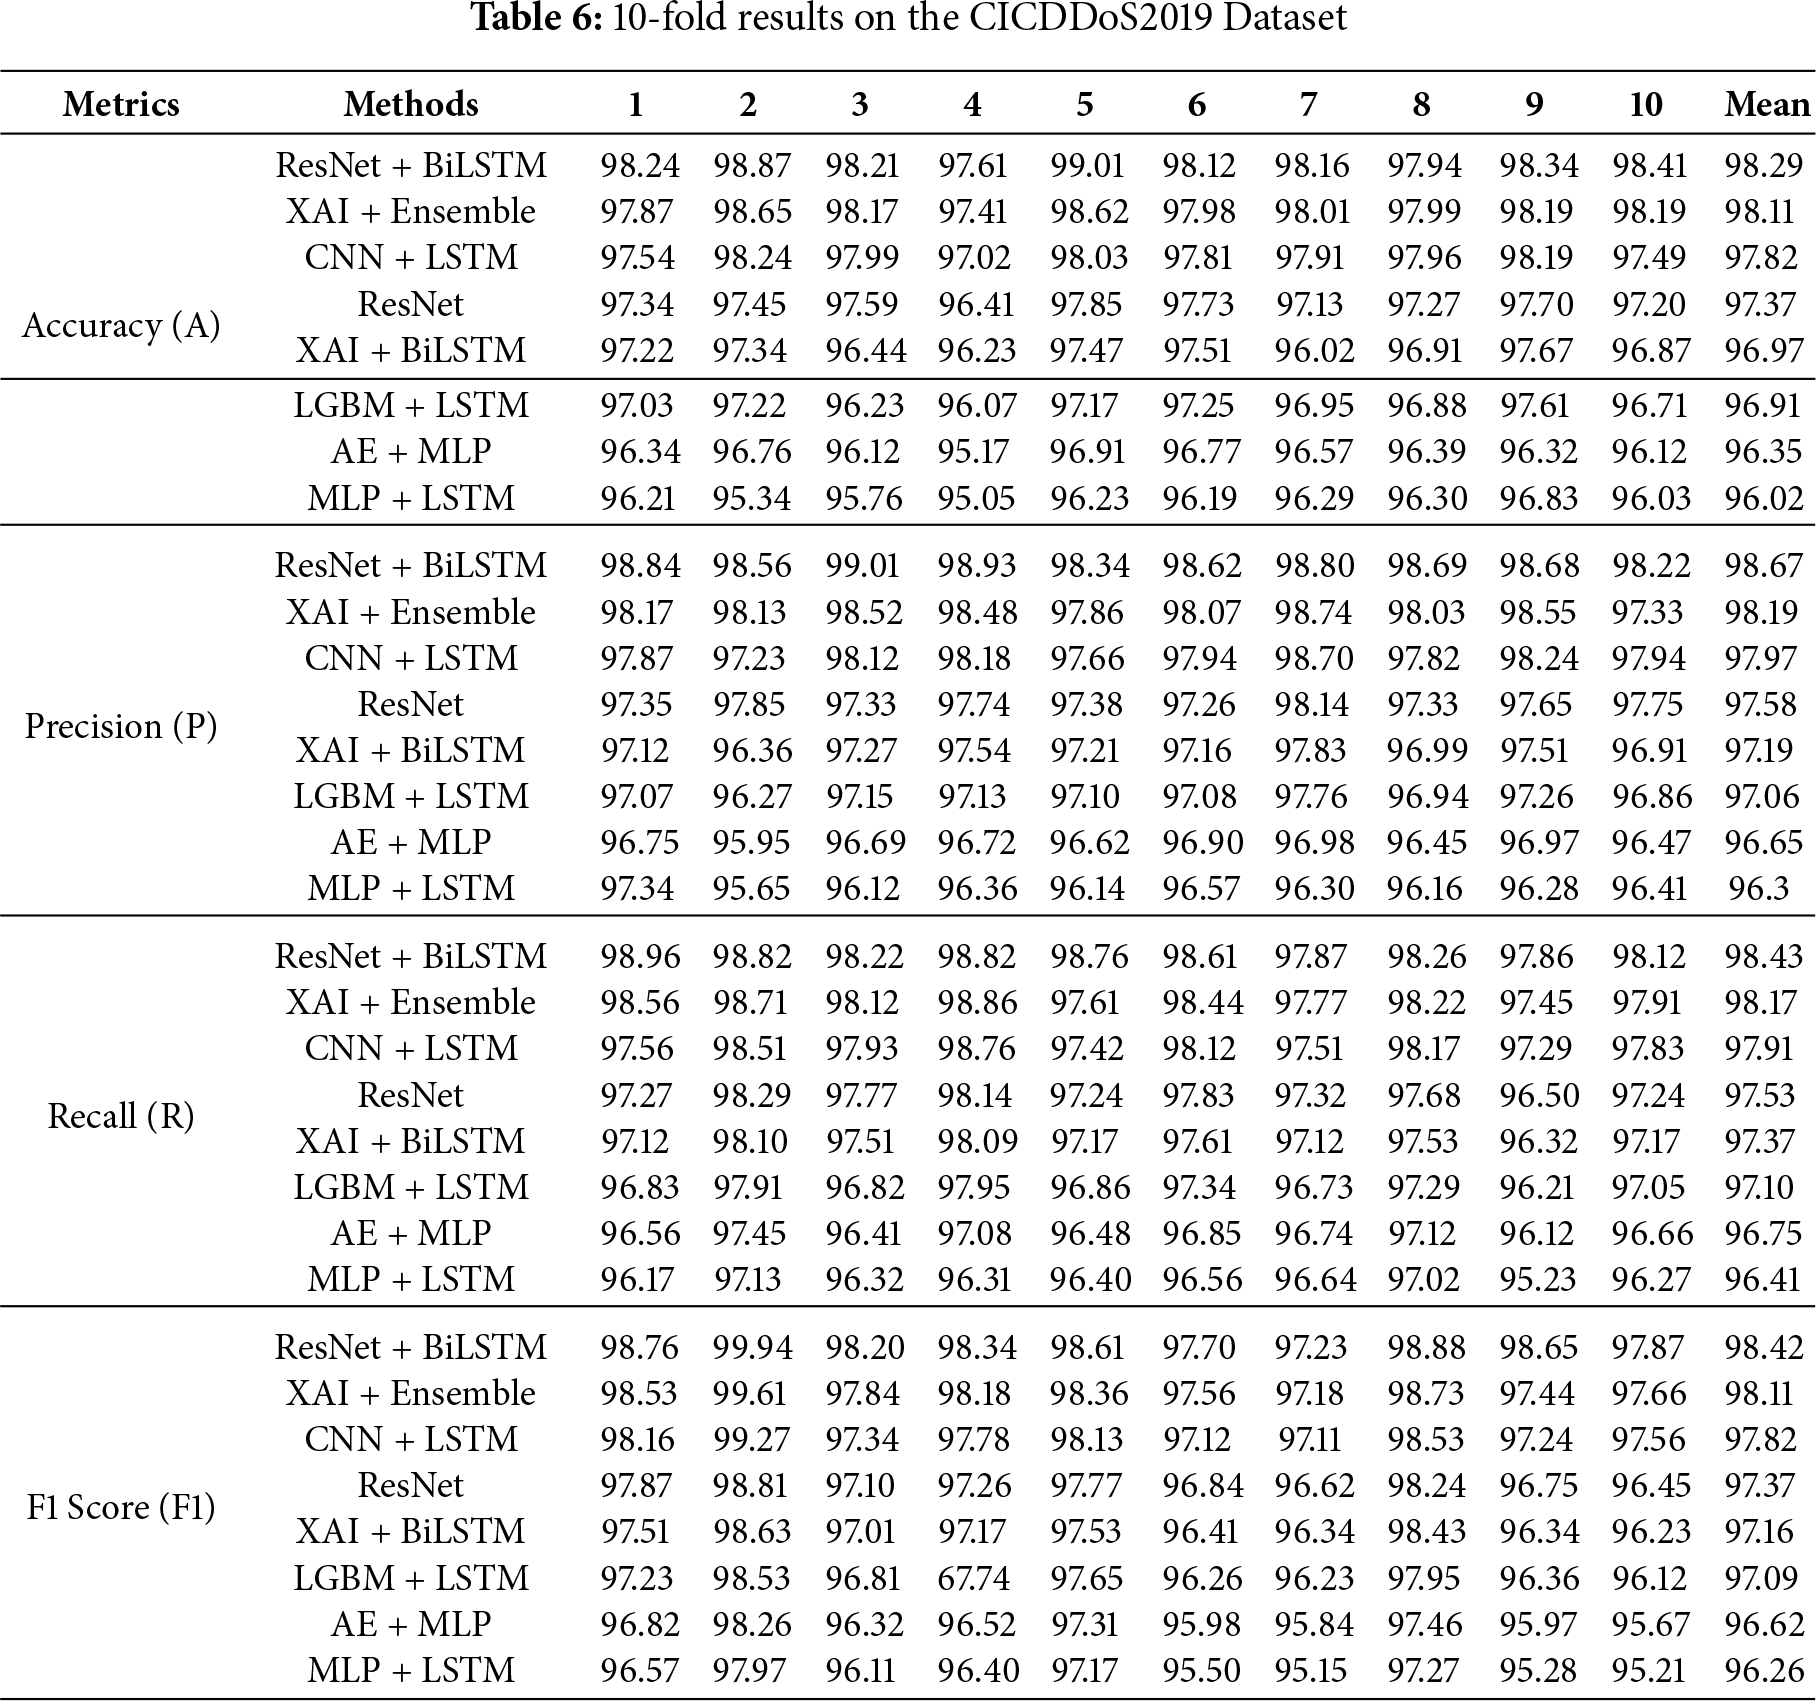
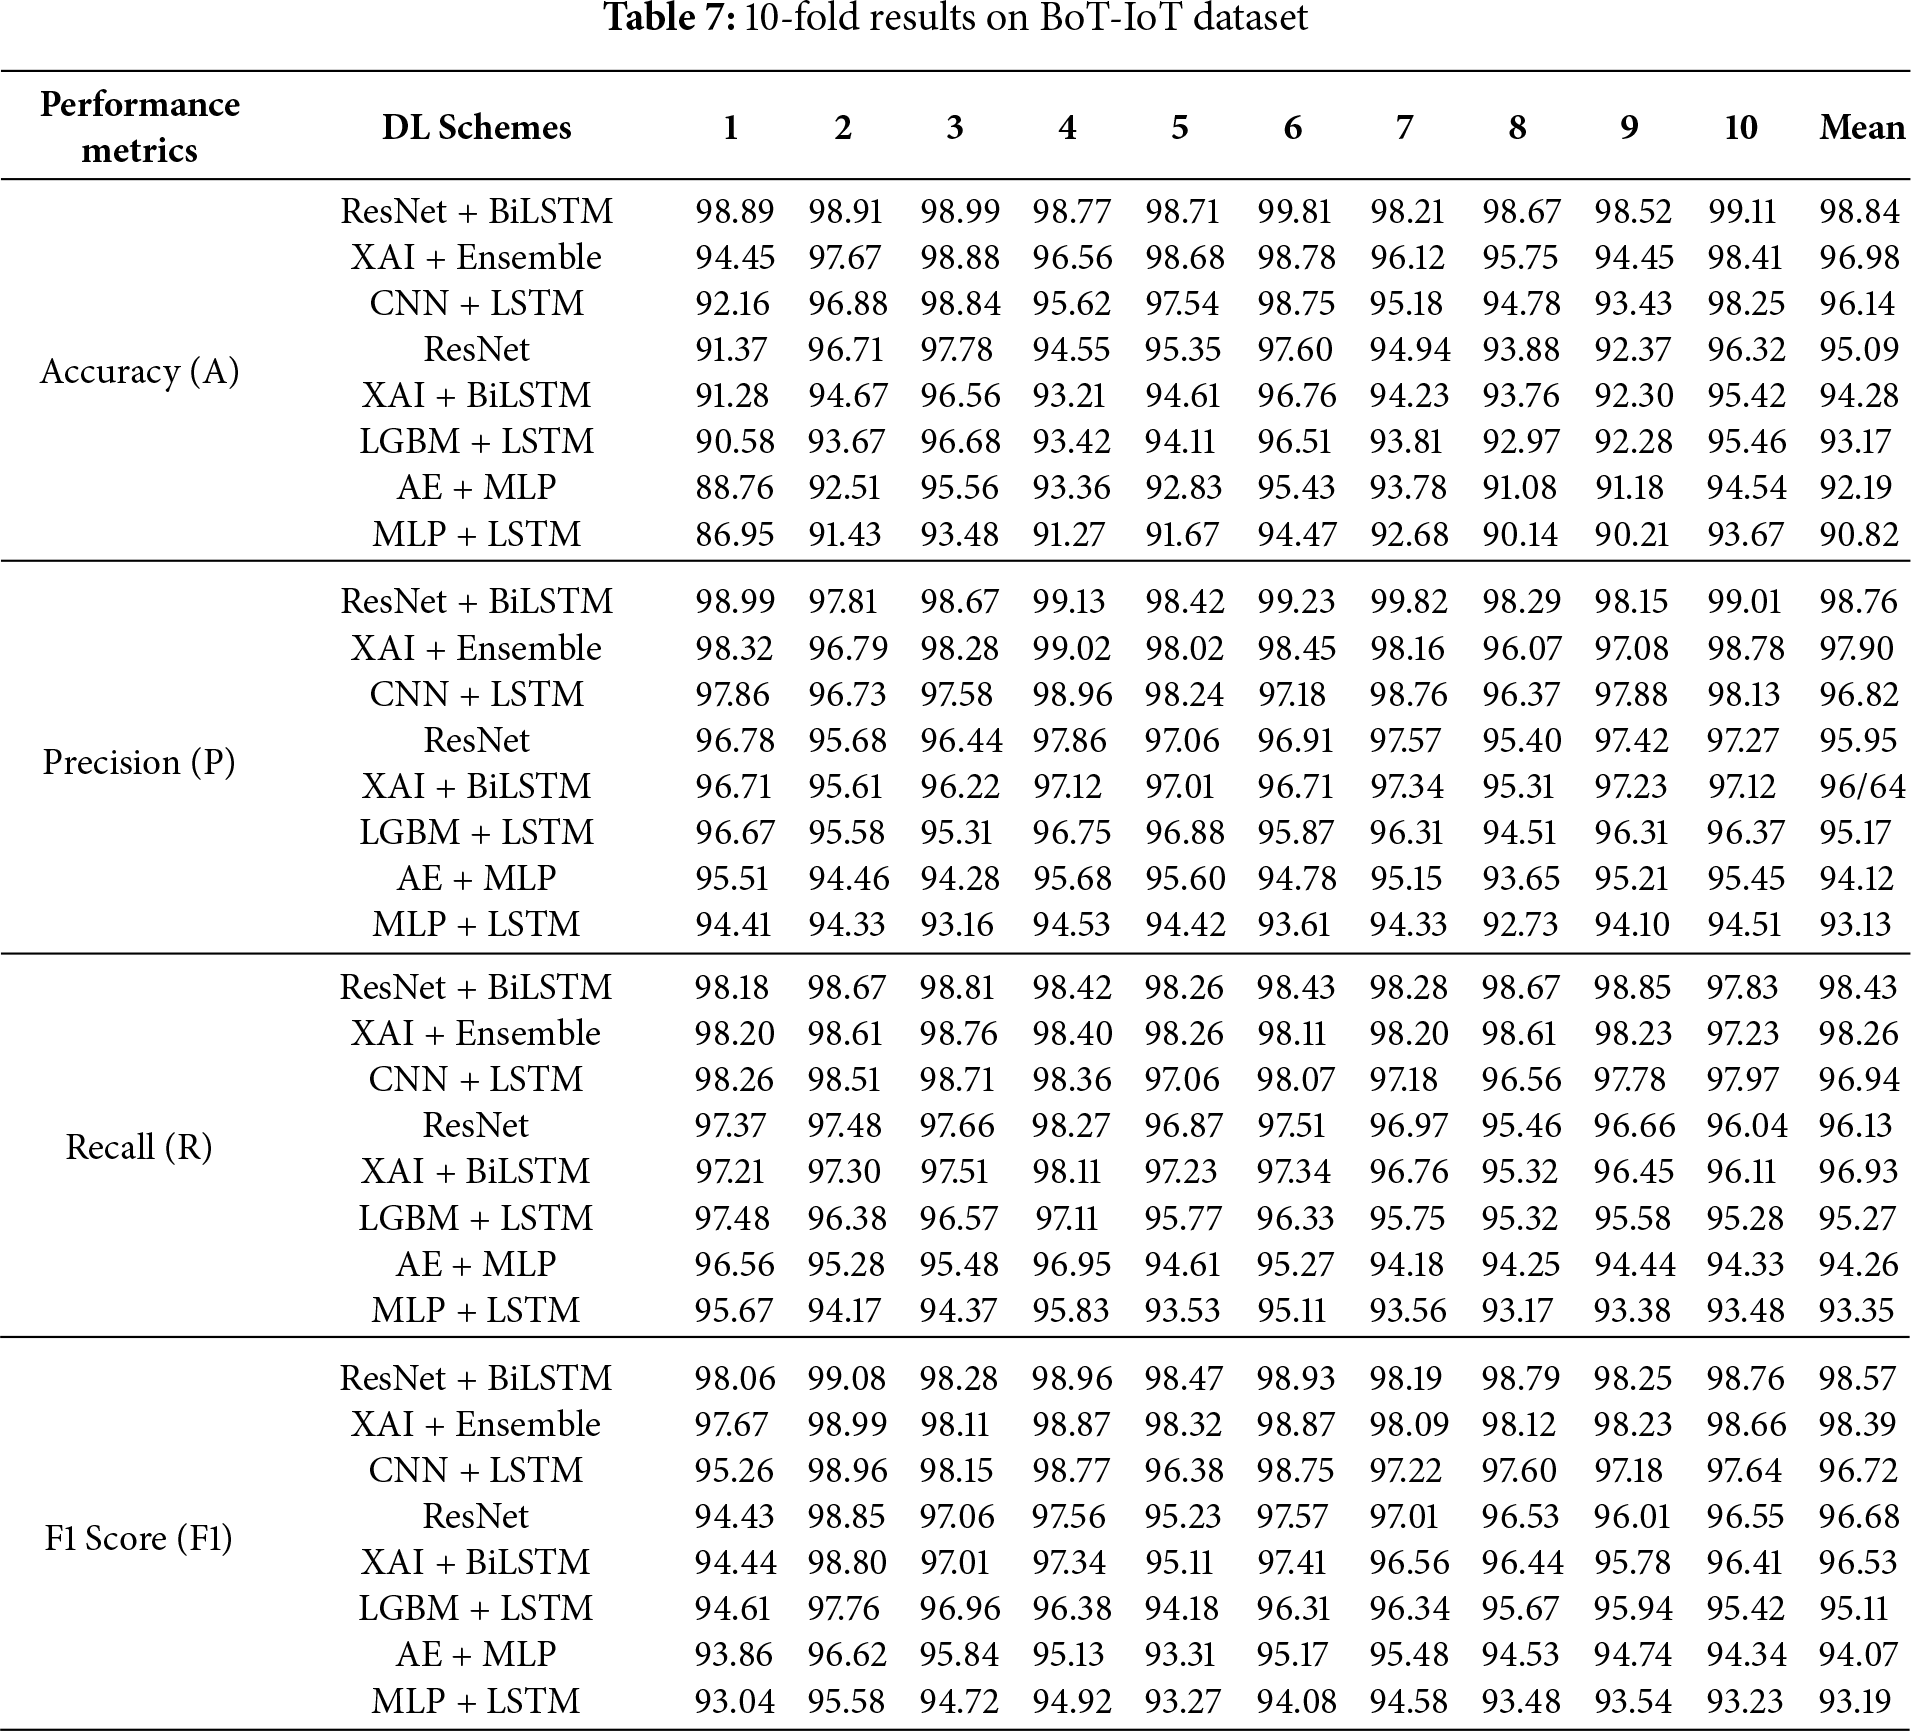
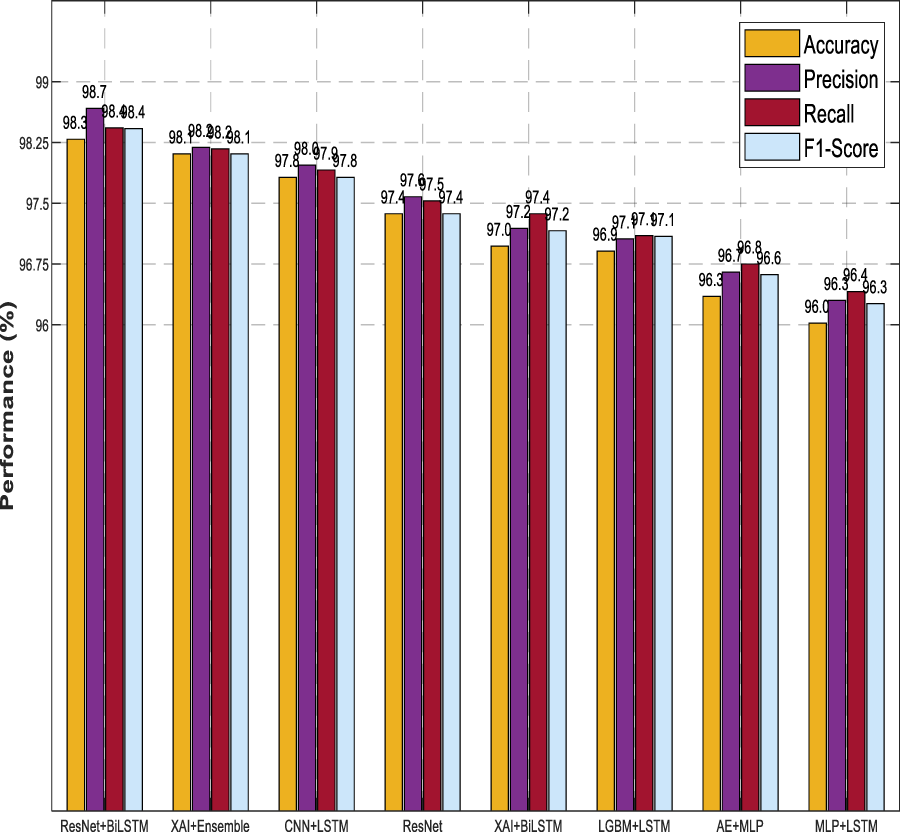
Figure 4: Analysis of performance metrics on metrics on CICDDoS2019 dataset
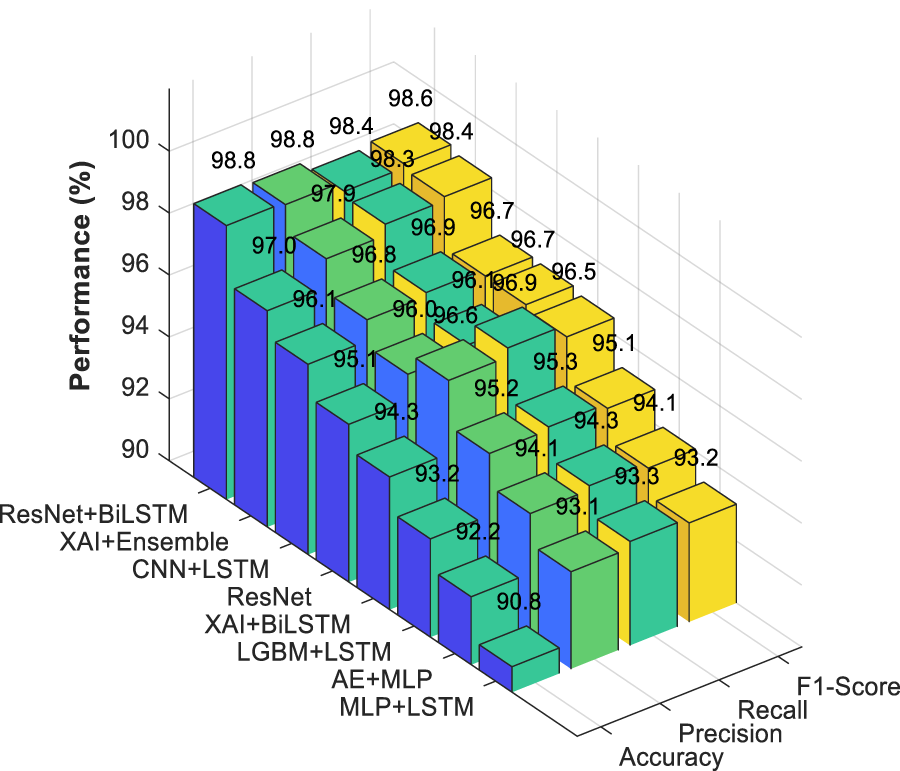
Figure 5: Analysis of performance BoT-IoT dataset
The results in Fig. 6 represent the confusion matrix of a proposed model over the CICDDoS2019 dataset.
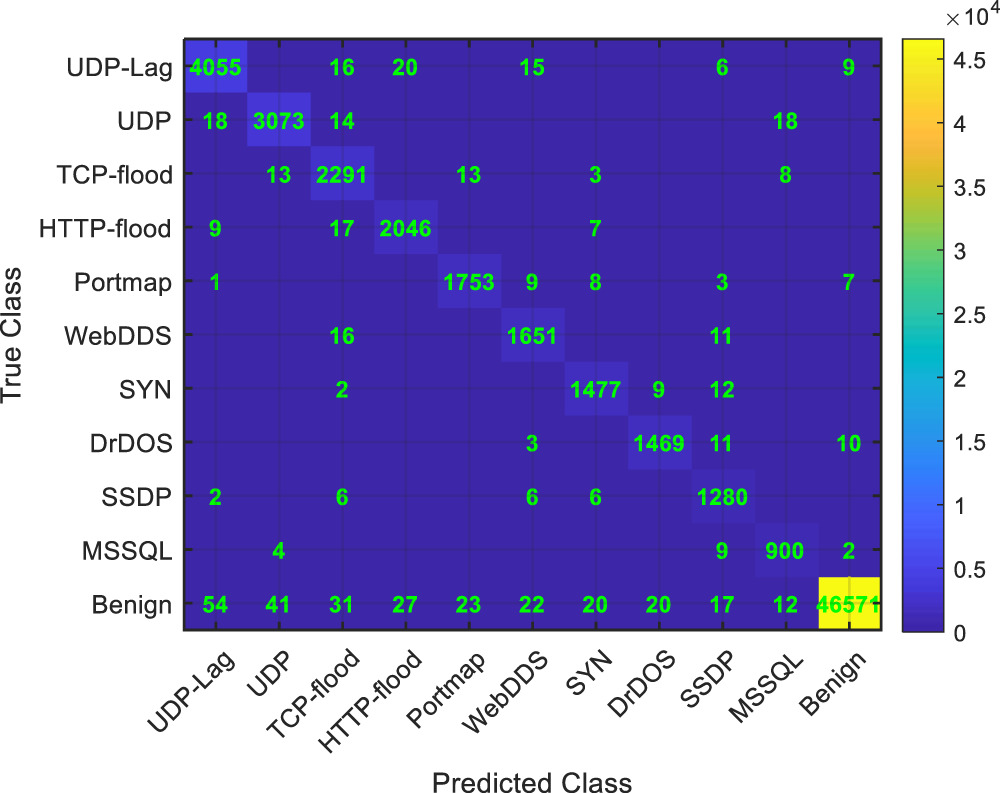
Figure 6: Confusion matrix of hybrid model on CICDDoS2019 dataset
The model exhibits a high true positive rate, indicating strong capability for detecting attack classes. The cell indicates the number of the model’s predictions for each actual class against the predicted class. The diagonal cells represent the correct predictions, while off-diagonal cells indicate the number of misclassifications, showing the model’s deviations from the actual class. We can see that out of all 47,407 normal traffic records, 46,571 were classified correctly, and only a few were misclassified. In the attack classes, the proposed model also correctly identifies malicious traffic while maintaining a low false positive rate, thereby minimizing the misclassification of benign traffic as malicious. Notably, the false negative rate remains relatively low, suggesting that the model effectively reduces undetected attacks. Per class model performance of the proposed hybrid method is presented in Table 8.
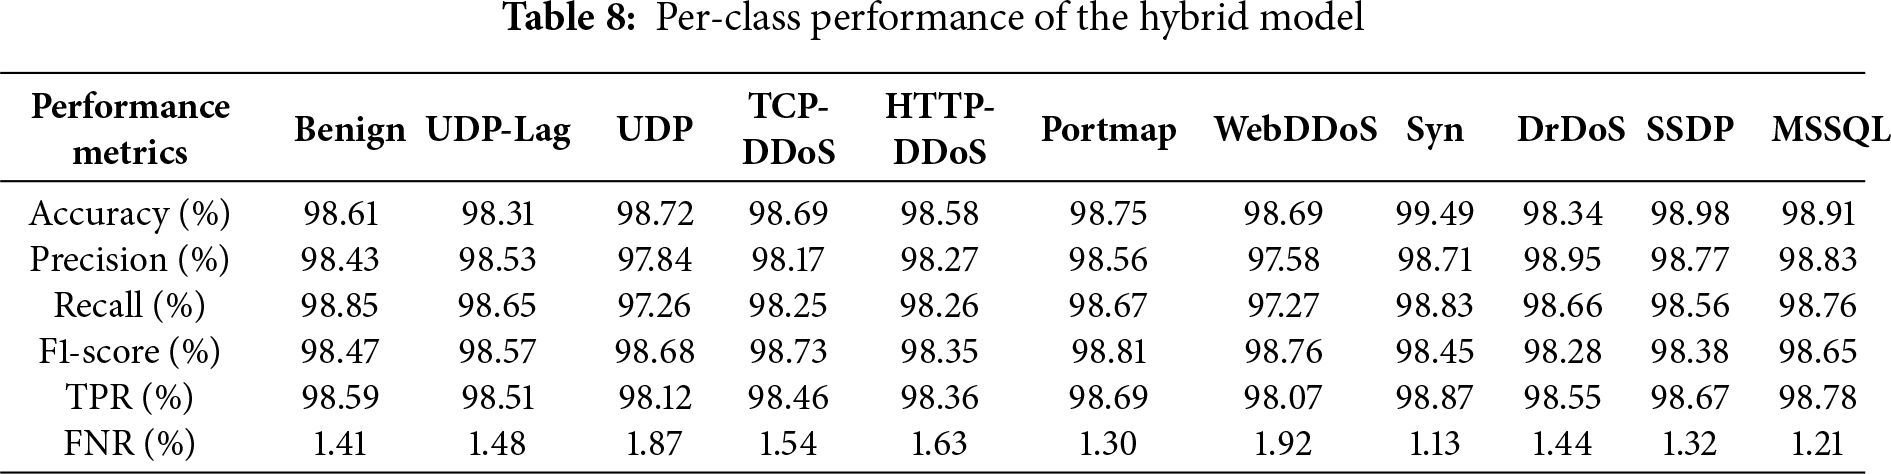
Fig. 7 represents the confusion matrix of the proposed model on the BoT-IoT dataset. Here again, the results reveal the efficiency of the model’s performance in correctly predicting the attack labels, while maintaining low false positives and negatives, thereby improving the model’s capability in distinguishing between normal traffic and attack traffic. The performance across varied datasets validates the ability of the proposed approach in producing precise and balanced predictions under a highly dynamic vehicular network.
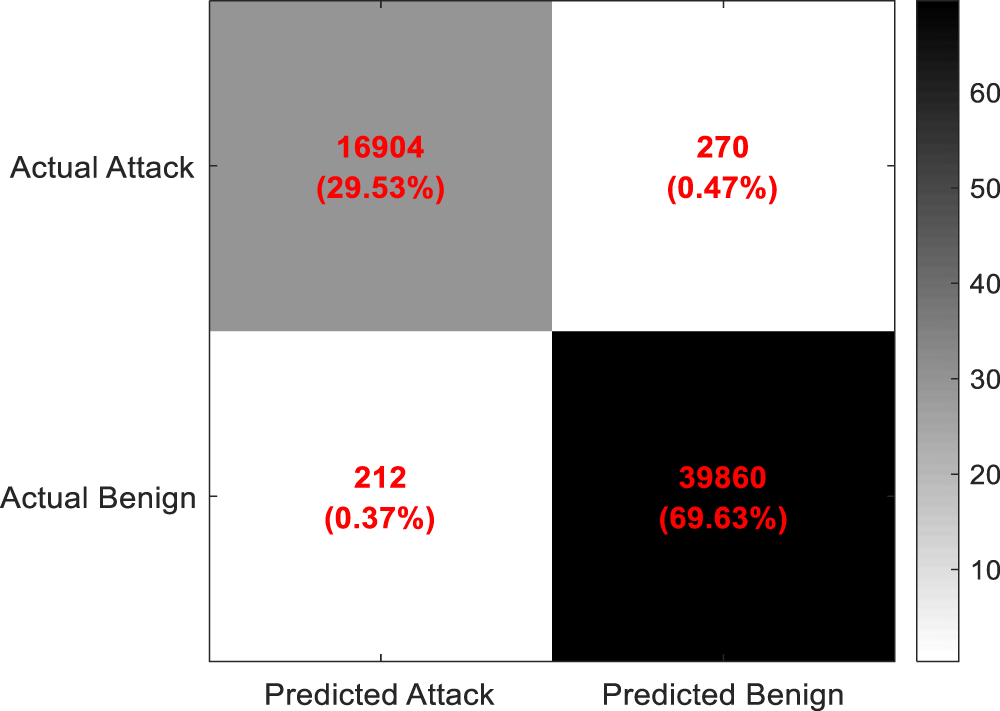
Figure 7: Confusion matrix of the hybrid model on the BoT-IoT dataset
4.4 Statistical Analysis Using Paired t-Test
Table 9 shows the statistical significance of the proposed hybrid model compared to the benchmark models across all performance metrics on both datasets. The analysis reveals that the proposed model achieved higher mean values across all metrics on both datasets. Columns 5 and 8 of Table 6 display the paired t-test values for each dataset, respectively, which indicate whether the difference in mean performance between two models is statistically significant. A higher value (p > 0.05) indicates that the difference between the mean performance of the proposed and baseline models is not statistically significant, while a lower value (p < 0.05) confirms that this difference is likely to be real and not due to chance. The paired t-test shows that p-values for all baseline models were less than 0.05, indicating statistically significant improvements. The t-statistics further suggest that the performance difference between the proposed and baseline models is not only consistent but also strongly significant.
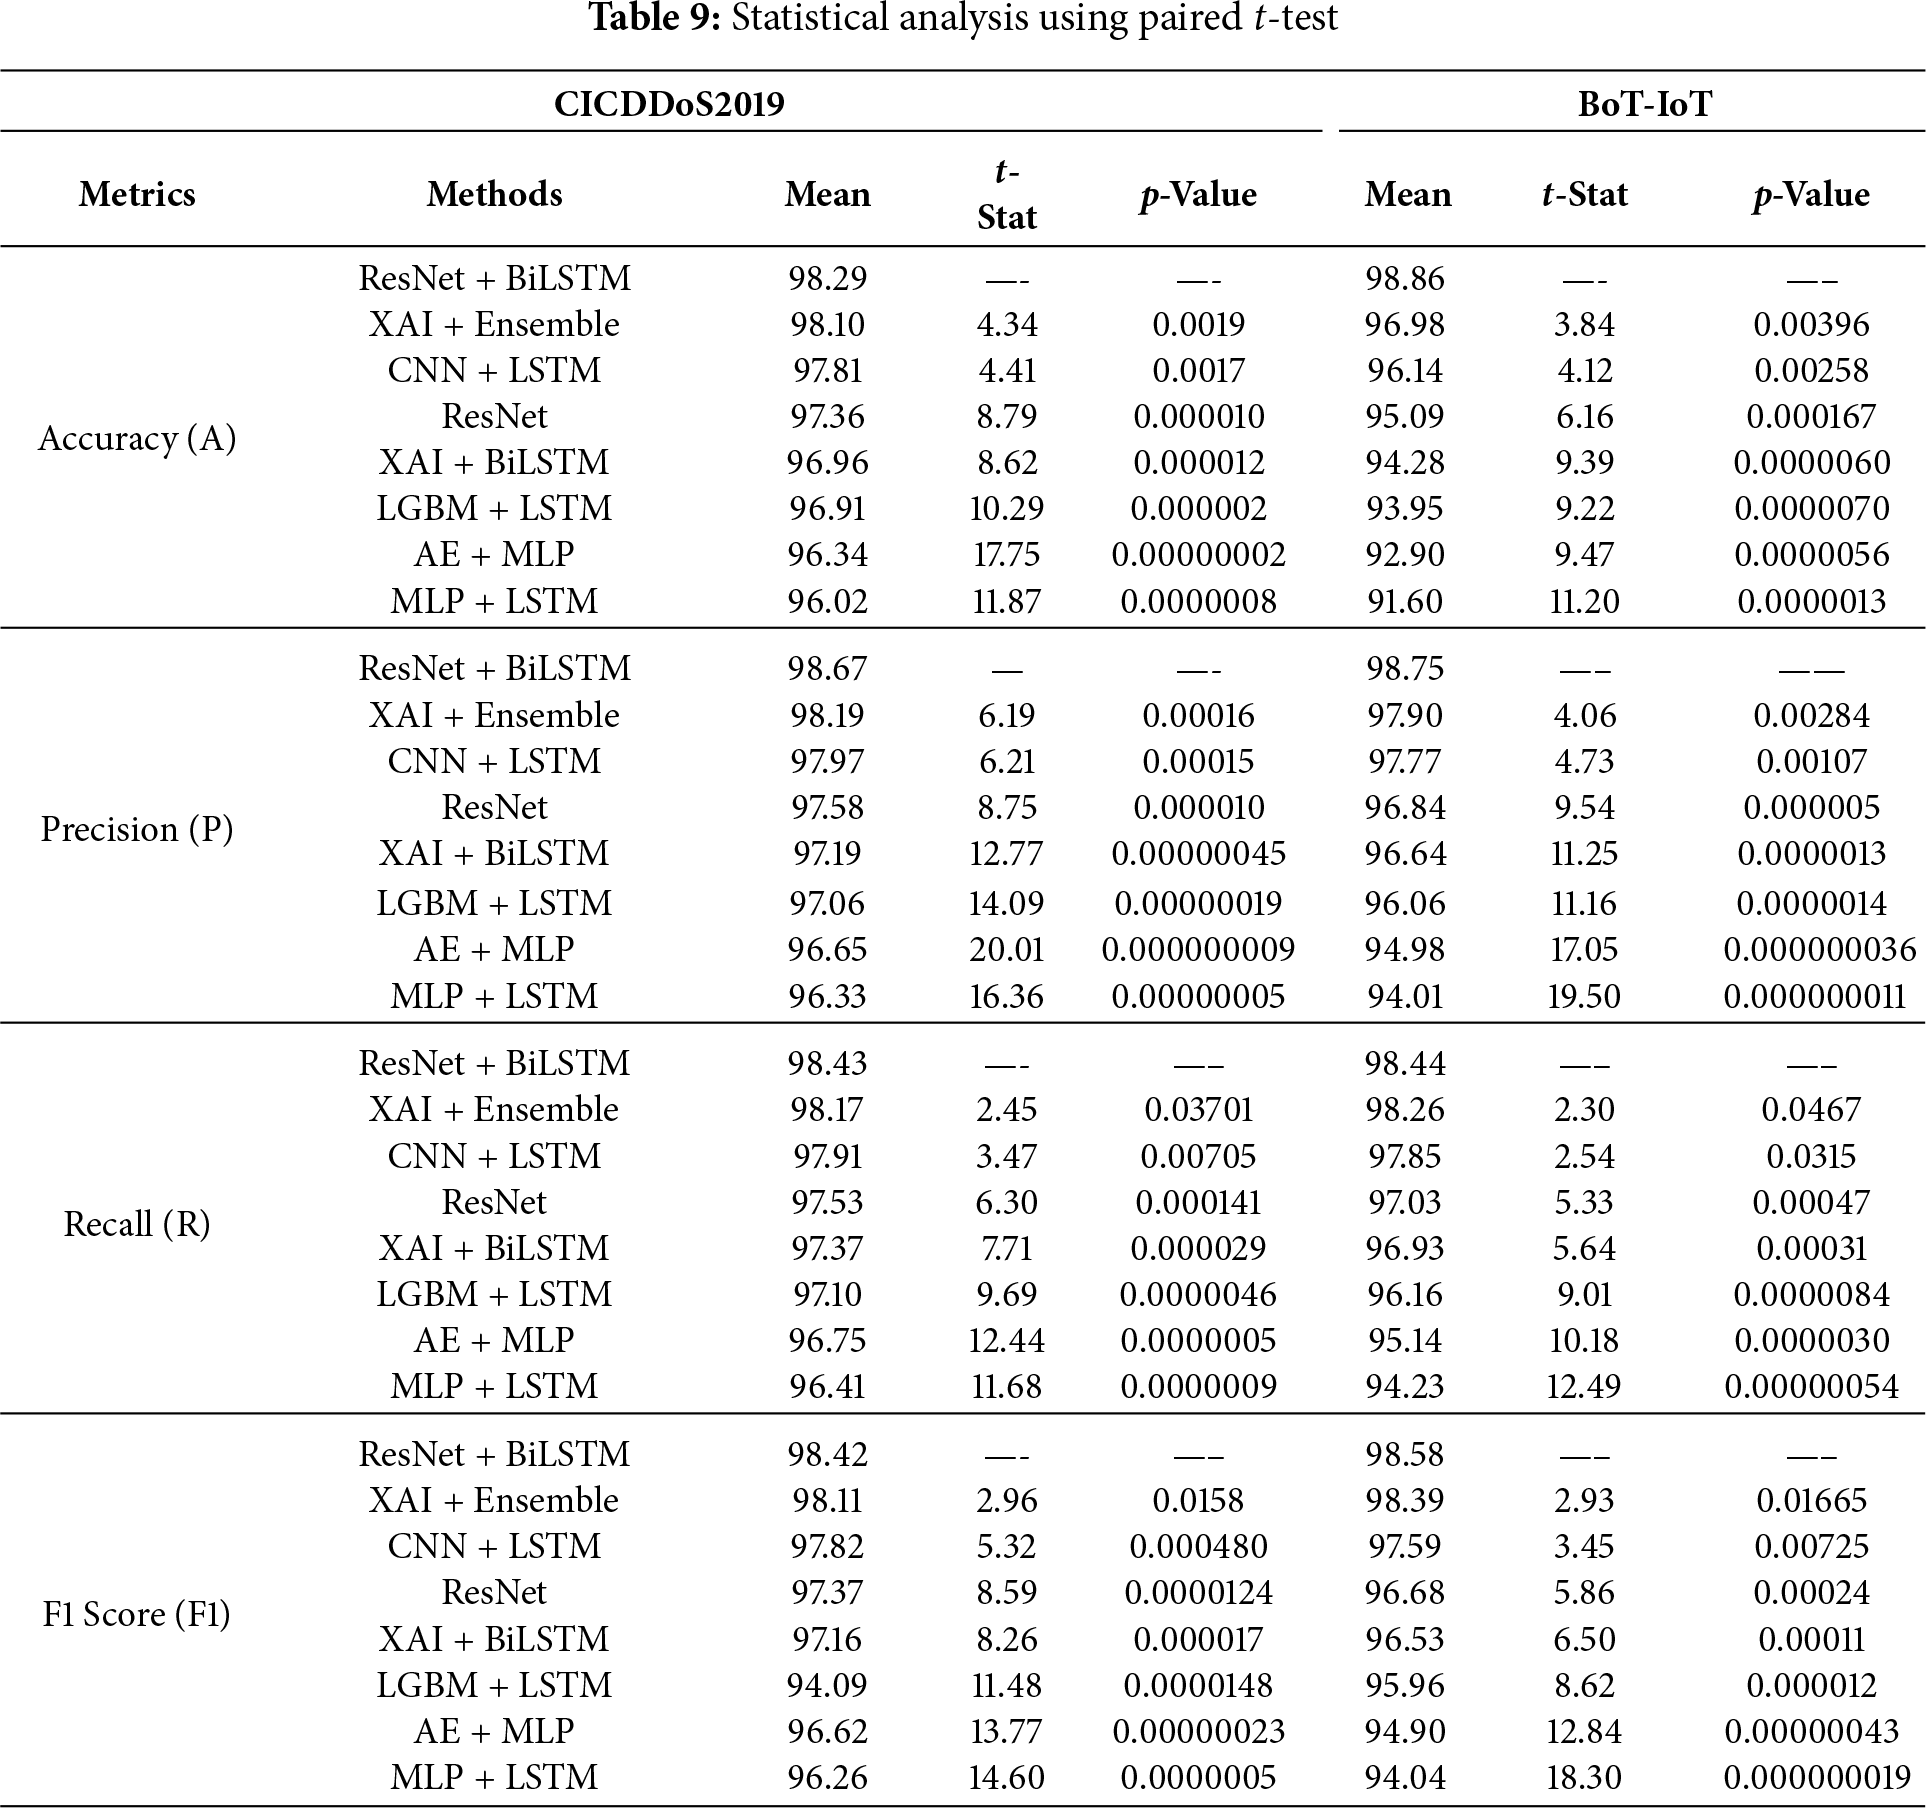
The analysis confirms that the proposed hybrid model delivers systematic and reproducible gains rather than just random fluctuations or dataset-specific. The results enable the proposed model to effectively generalize across heterogeneous DDoS datasets, providing statistical proven robustness, reliability, and practical significance for DDoS detection in SDN-IoV networks.
SHAP is a game-theoretic approach that interprets and explains the predictions of deep learning models on both a local and global scale. It describes the relationship between the feature and the predictions of a model. With a local scale explanation, it explains a single event by computing the contribution of each feature to the model’s predictions, while the global scale explanation sheds light on how features affect the model’s decision using the complete dataset. SHAP uses various visualization tools to clarify the model’s decision, i.e., decision plot, waterfall plot, summary plot, and force plot.
In this experimental setup, we use a waterfall, summary, dependence plot, and decision plot to show the contribution of features across all instances of a model’s decision. We use the SHAP DeepExplainer method to analyze the hybrid model output. It computes the feature contribution by propagating SHAP values through the network layers, making it suitable for gradient-based models. To compute the SHAP values, 2000 sample records (a balance between benign and attack classes) from the training dataset are selected, ensuring statistical representativeness without excessive computational overhead. Fig. 8 represents the SHAP decision plot that visualizes how different input features contribute to the model’s single prediction. The figure illustrates the commutative contribution of features to the model’s prediction for a specific instance of network traffic. Positive shift towards the right increases the likelihood of malicious classification, while a negative shift towards the left increases the likelihood of a benign classification. For instance, “Total Length of Fwd Packets” and “Subflow Fwd Bytes” features have the most significant impact on the model prediction, followed by packet length and segment size statistics such as “Fwd Packet Length Mean” and “Bwd Packet Length Min”. These features identify the traffic intensity and asymmetry between forward and backward packet flows, reflecting key indicators of DDoS activity in a real SDN-IoV environment. A malicious node can transmit a high volume of forward bytes with low backward acknowledgments, resulting in network congestion and control overhead. A feature like “Packet Length Mean” indicates the average packet size in a flow. The malicious nodes can transmit high-volume packets with either minimal or constant lengths, resulting in abnormal uniformity that deviates from normal vehicular data patterns. In contrast, features like “URG Flag count” and “Flow IAT Mean” have a negligible impact on the model’s prediction. This comprehensive analysis demonstrates the model’s reliance on specific flow-level attributes, providing transparency and interoperability in the decision-making process for DDoS detection in SDN-IoV networks.
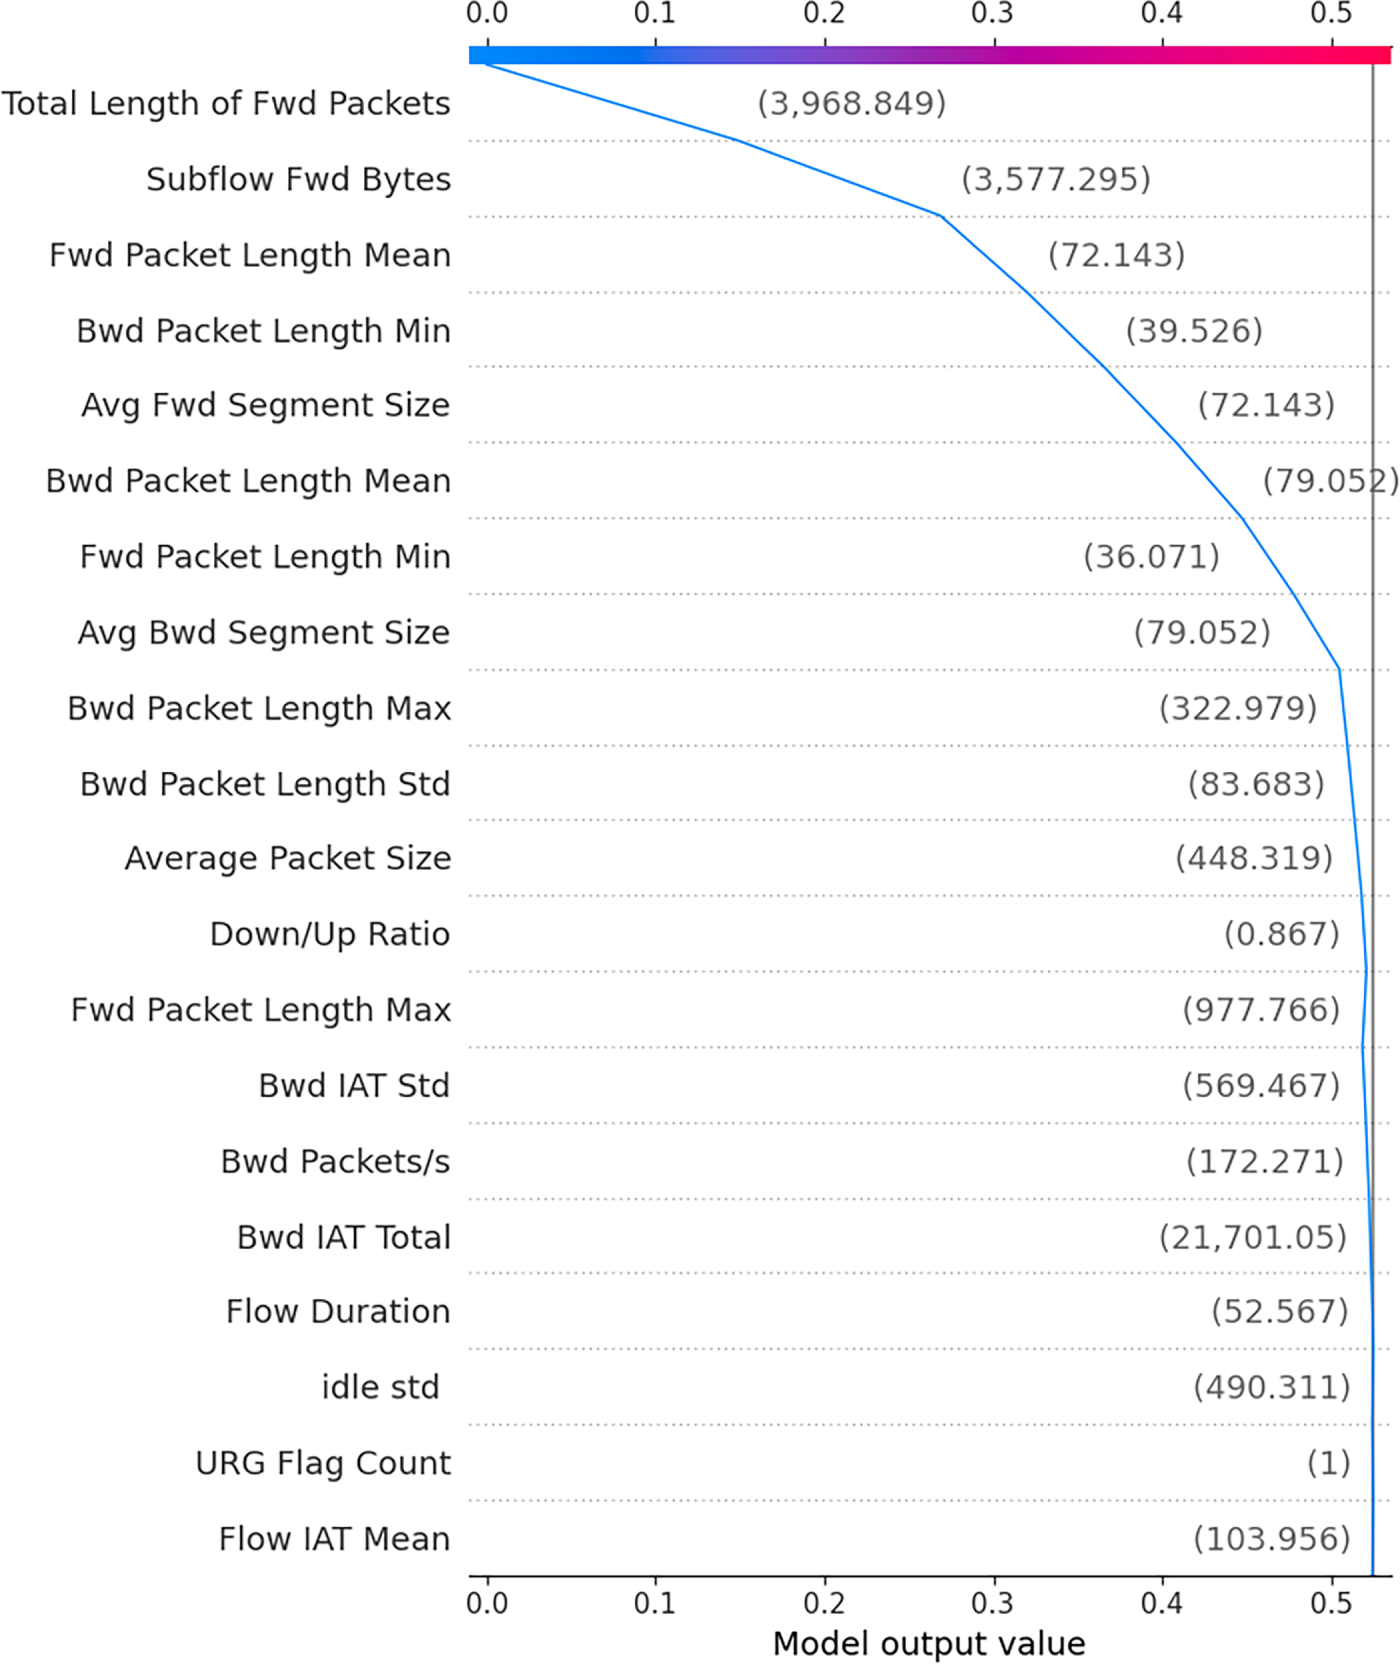
Figure 8: SHAP decision plot on CICDDoS2019 dataset
Fig. 9 indicates the global impact of each feature on the model’s predicted decision. In this figure, the x-axis represents the SHAP value that explains the influence of features (either positive or negative) on the model’s decision. The importance of the feature is represented by a color scale where red indicates high feature value and blue indicates low feature value. Key features like “Total length of fwd packets”, “Subflow Fwd Bytes”, and “Fwd Packet Length Mean” dominate the top 3 positions, indicating the strong impact both with positive and negative contributions in the model’s decision-making process. Features like “Bwd IAT Total” and “Idle std”, etc., are relatively low influential in the model’s decision-making process. Overall, the figure provides a comprehensive view of the feature importance on the model’s predictions across the dataset.
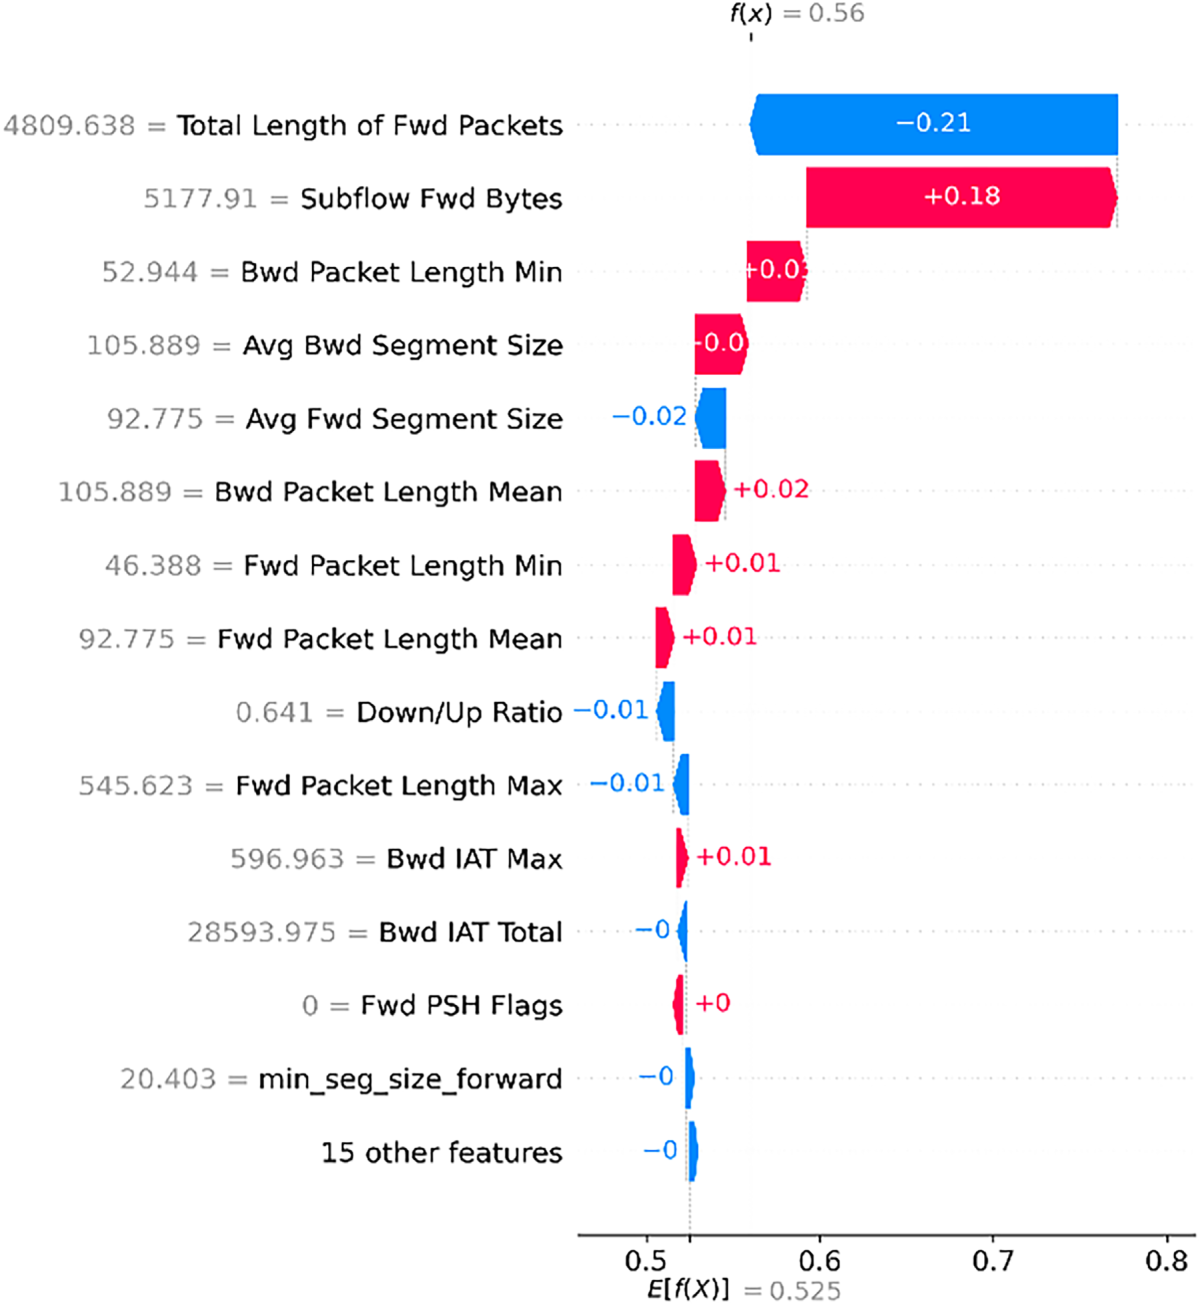
Figure 9: SHAP Summary plot on CICDDoS2019 dataset
Fig. 10 depicts a SHAP waterfall plot, which quantifies the contribution of each feature to the model’s prediction for a specific network traffic instance. The x-axis represents the model output value, ranging from the base value to the final predicted value. The red bar indicates the positive contribution of a feature towards the model’s prediction, while the blue bar indicates the negative contribution of a feature towards the model’s prediction. The figure shows that “Total length of fwd packets” has the largest negative contribution (−0.21), reducing the prediction probability toward benign classification, while “Subflow Fwd Bytes” exerts the most significant positive impact, pushing the model toward attack classification. Some of the features, like “Avg Fwd segment size” and “Bwd IAT Total” have small negative contributions. This analysis highlights the dominant role of related features in influencing the model’s classification decision for a specific network traffic instance, offering valuable explainability and transparency for DDoS detection in SDN-enabled IoV networks.
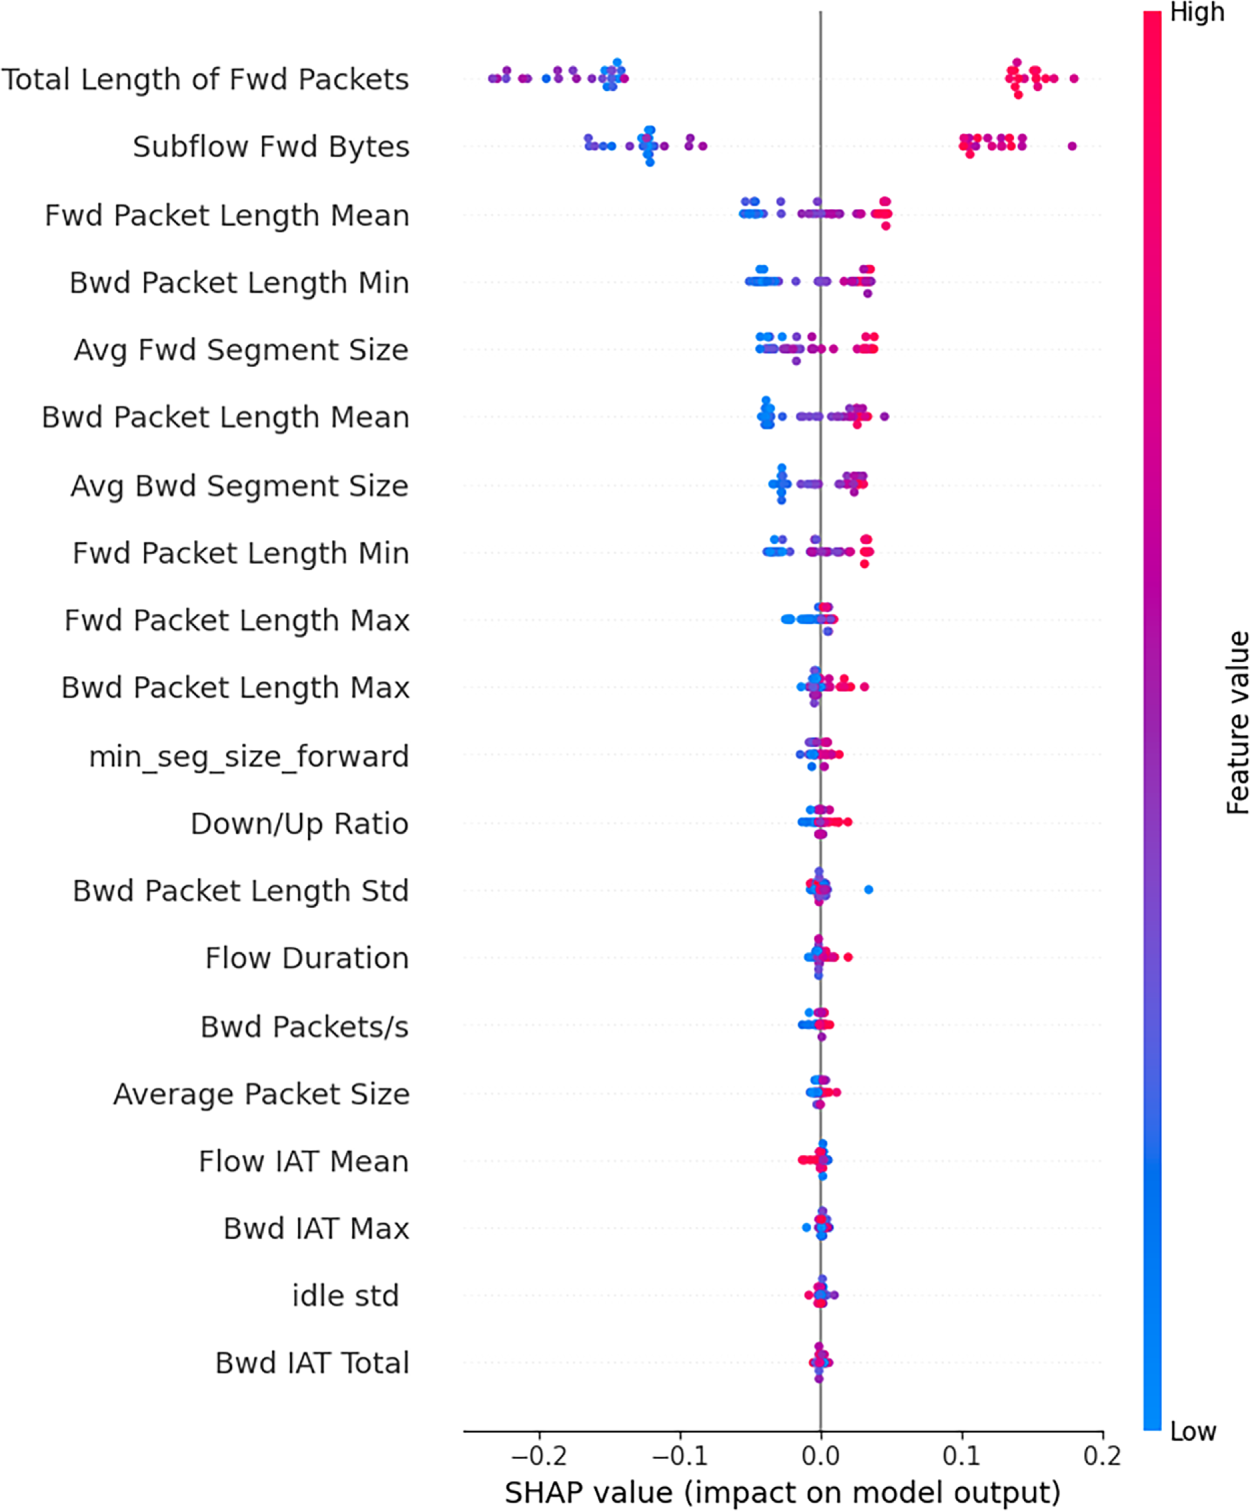
Figure 10: SHAP Waterfall plot on CICDDoS2019 dataset
The SHAP dependence plot is presented in Fig. 11, which illustrates the relationship between the highest contributing feature and its SHAP values.
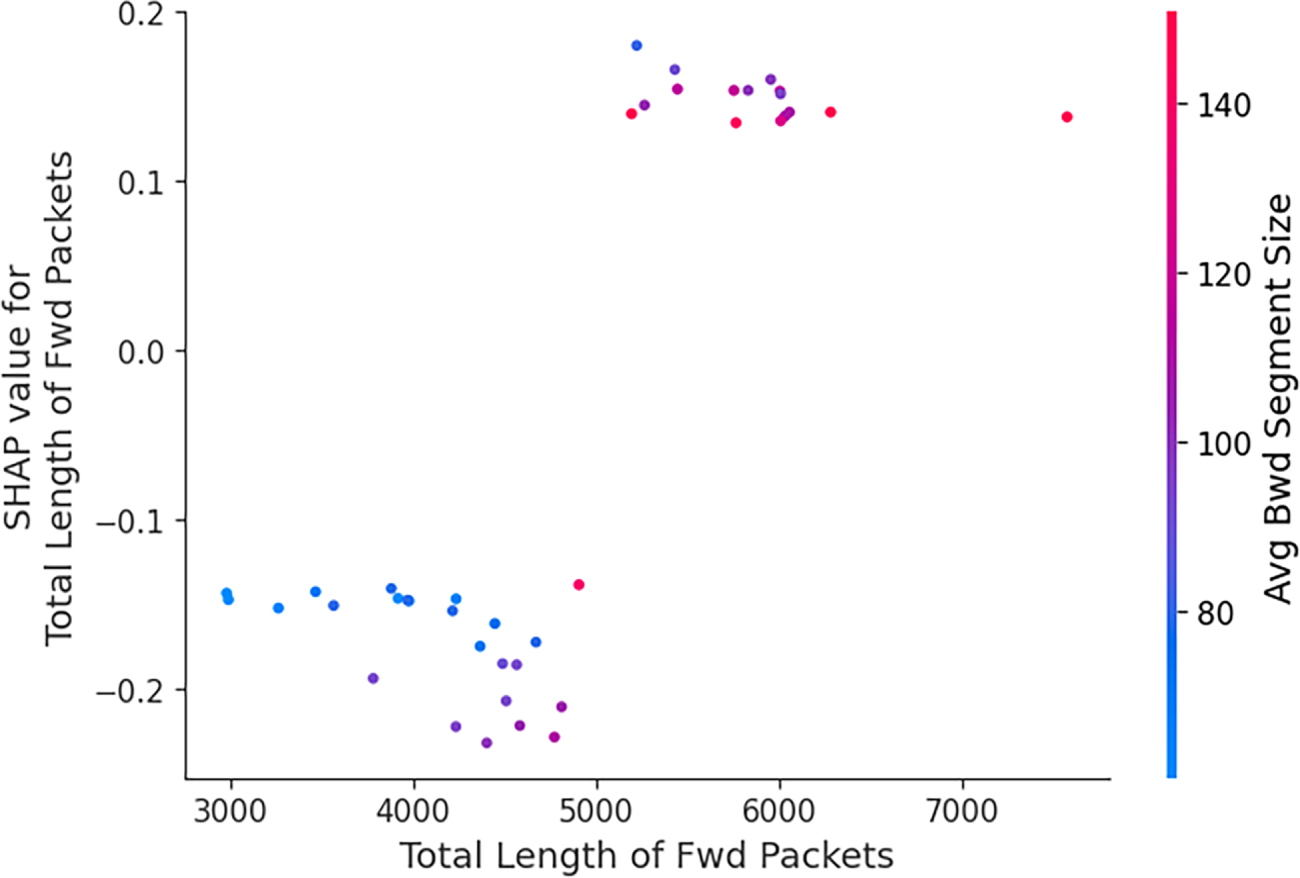
Figure 11: SHAP dependence plot on CICDDoS2019 dataset
It shows how variations in this feature affect the model’s predicted decision in conjunction with other features. The x-axis represents the feature value of “Total length of fwd packets”, while the y-axis indicates the corresponding SHAP values. The plot reveals that for a lower value of “Total length of fwd packets”, the corresponding SHAP values are negative (−0.2), pushing the model’s prediction towards the benign class. In contrast, higher feature values have positive SHAP values (0.1, 0.2), increasing the probability of attack classification. The gradient color reveals that instances with larger “Average Bwd Segment Size” align with positive contributions, while lower “Average Bwd Segment Size” reinforce positive contributions.
The SHAP dependence plot, decision plot, summary plot, and waterfall plot over the BoT-IoT dataset are presented in Figs. 12–15, respectively.
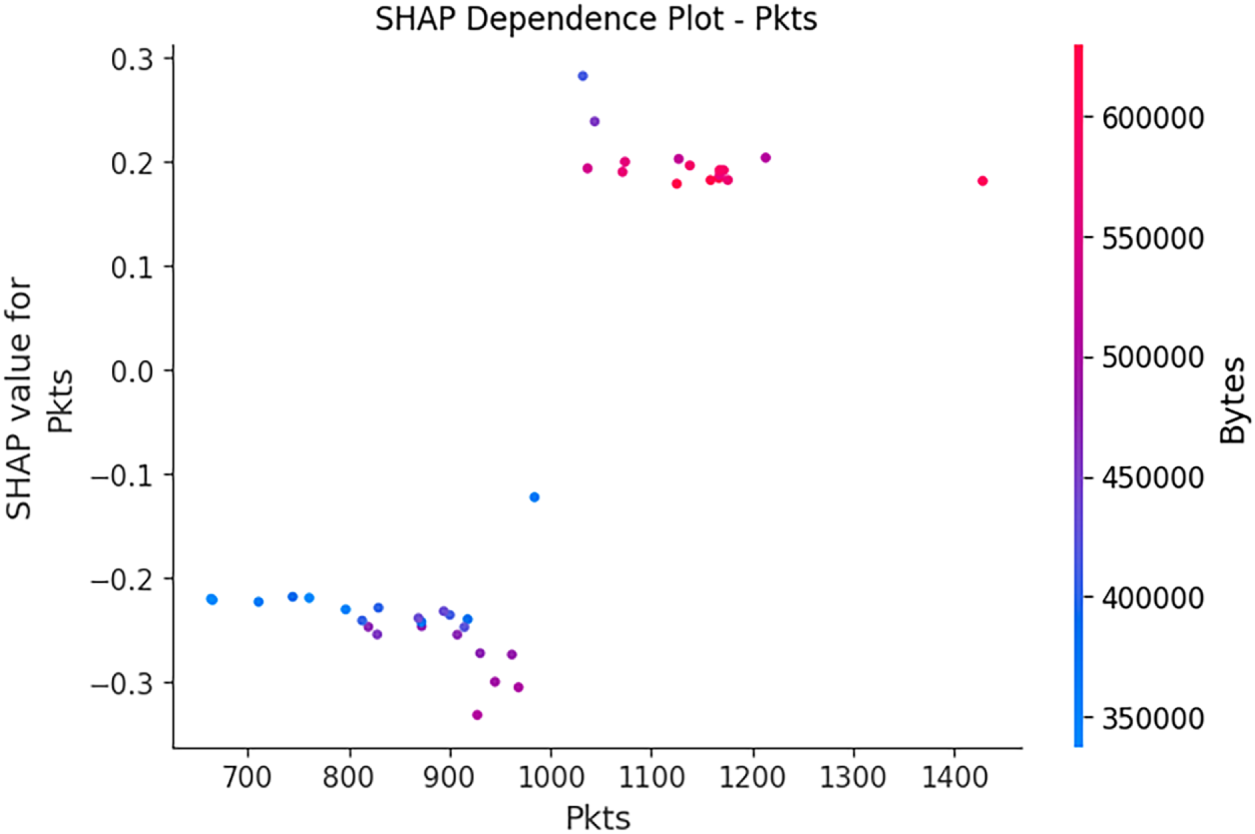
Figure 12: SHAP dependence plot on BoT-IoT dataset
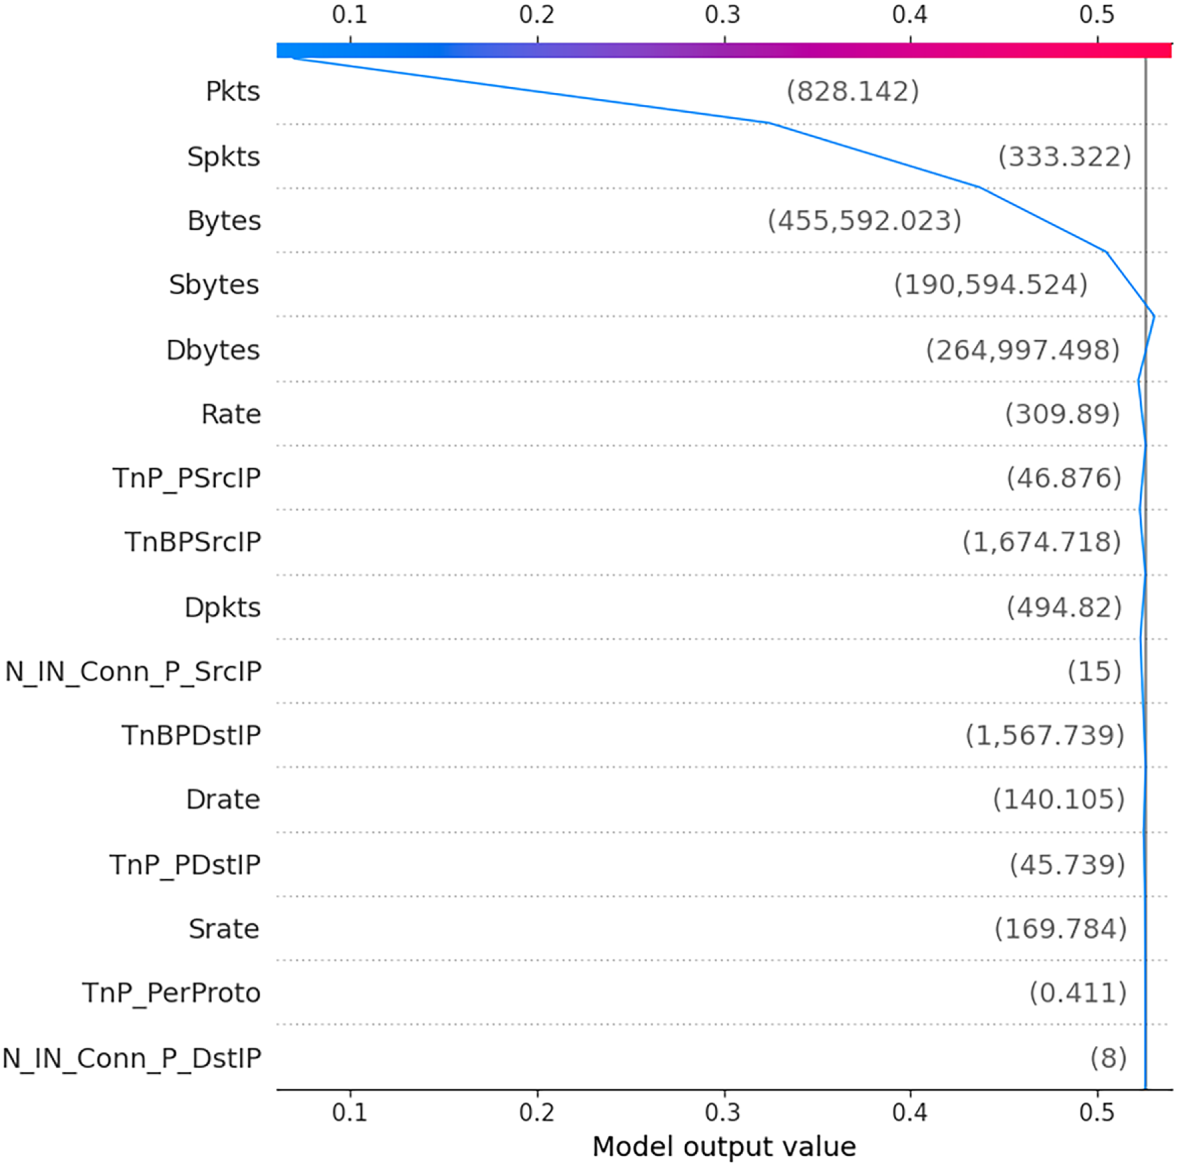
Figure 13: SHAP Decision plot on BOT-IoT dataset
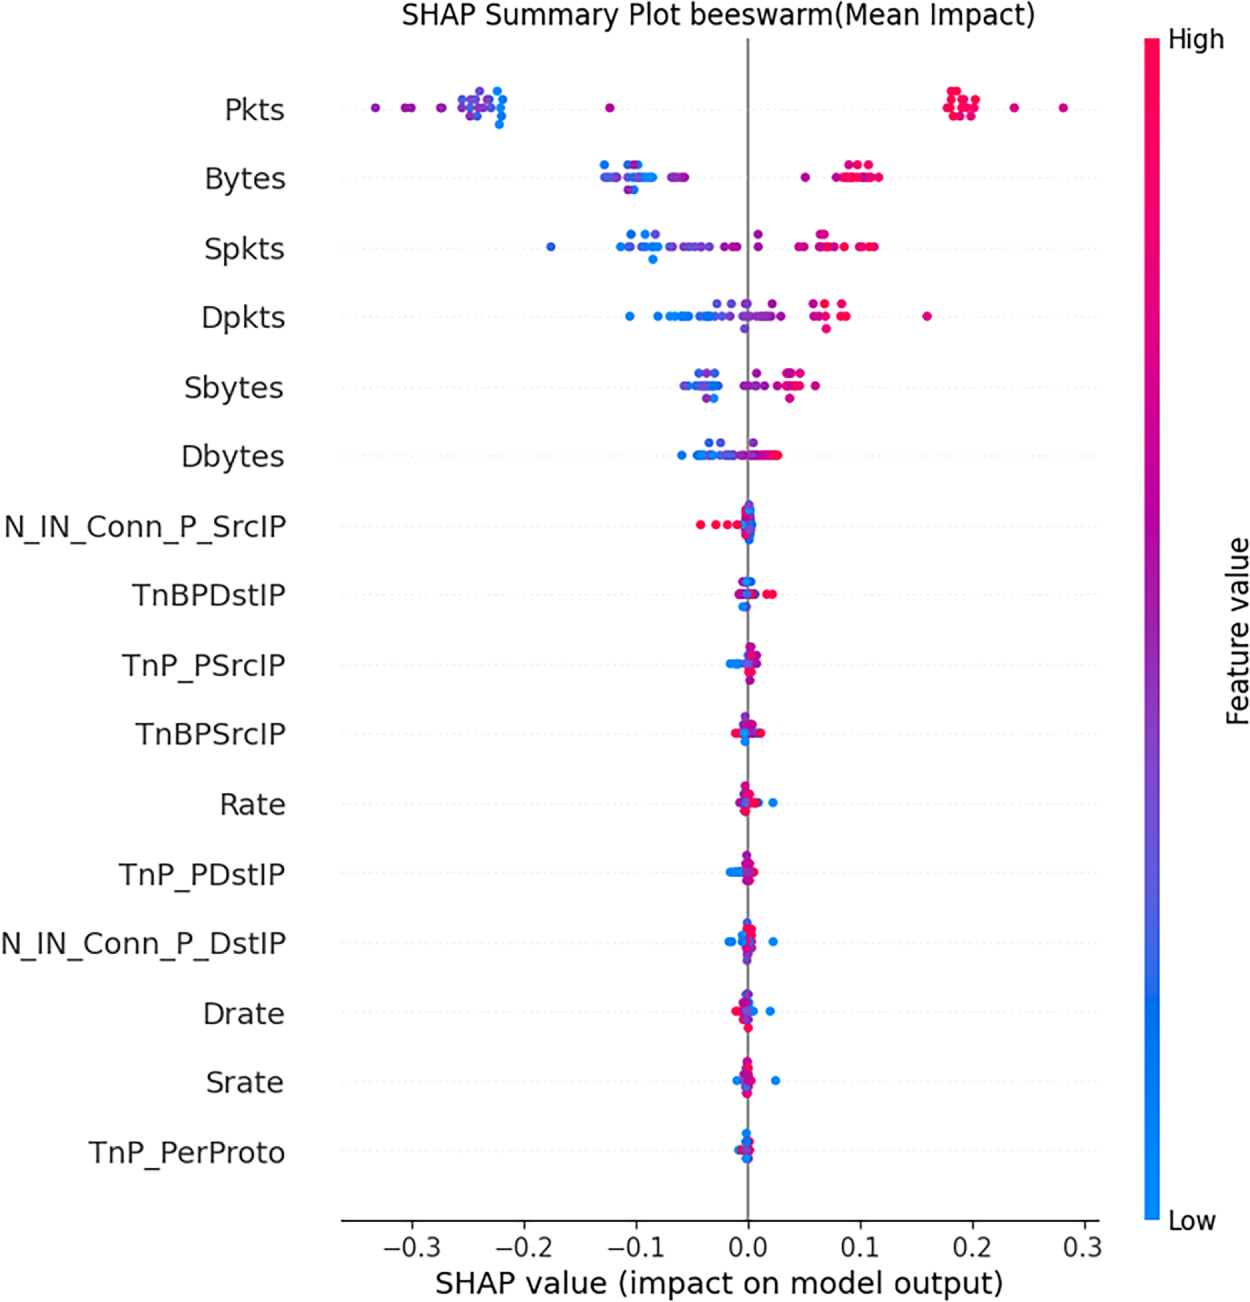
Figure 14: SHAP summary plot on BOT-IoT dataset
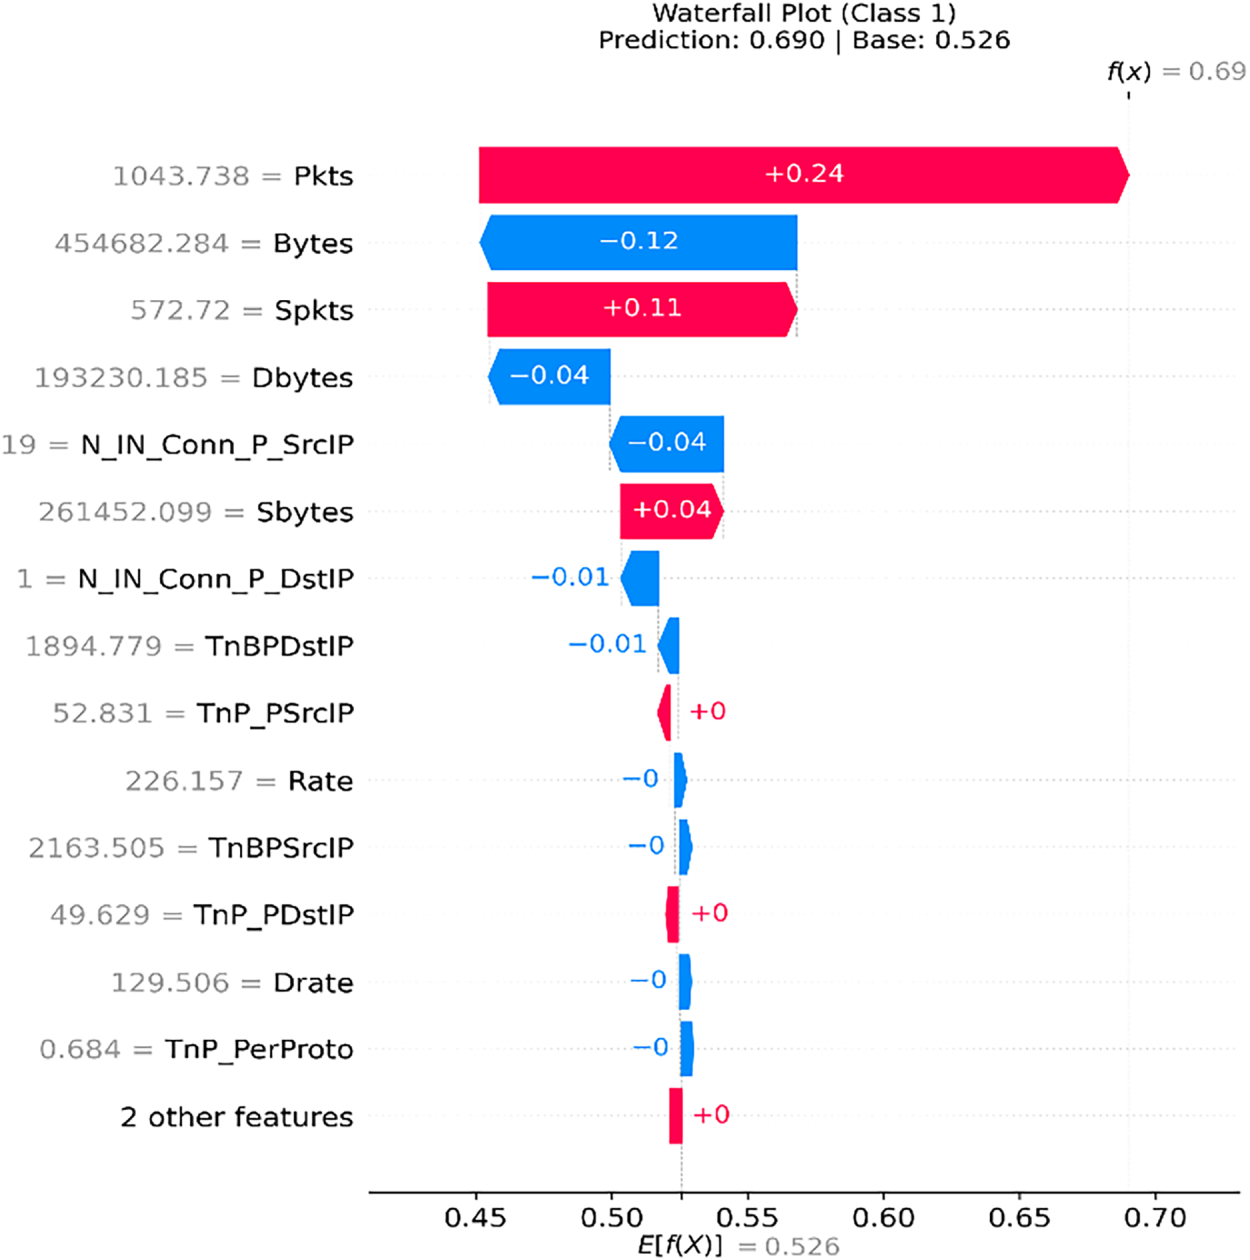
Figure 15: SHAP waterfall plot on BOT-IoT dataset
Based on the SHAP plots for the CICDDoS2019 and BoT-IoT datasets, we quantitatively analyze the top ten influential features that have a significant influence on the model output. The analysis is conducted both at the local and global levels. The features are ranked according to their SHAP mean values, standard deviations, and relative importance. The feature ranking for CICDDoS2019 and BoT-IoT datasets, along with their means, standard deviations, and relative importance, is presented in the Table 10. For the CICDDoS2019 dataset, the top-most influential feature is Total Length of Fwd Packets, with a mean, standard deviation value, and relative importance percentage is 0.164%, 0.0281%, and 32.63%, respectively. This indicates that a more variable forward packet length has the strongest influence on attack classification. This suggests that a sudden surge in the forward packet length is a dominant signature of a DDoS activity. Similarly, Subflow Forward bytes is the second influential feature, with a mean, standard deviation value, and relative importance percentage is 0.124%, 0.0204%, and 24.78%, respectively. This feature reflects the cumulative bytes sent in a flow. High values typically correspond to aggressive packet bursts, reflecting a potential flood-based attack. The top two features collectively contribute over 57% of the total model explainability, demonstrating that forward-direction traffic-related metrics dominate in the attack classification.
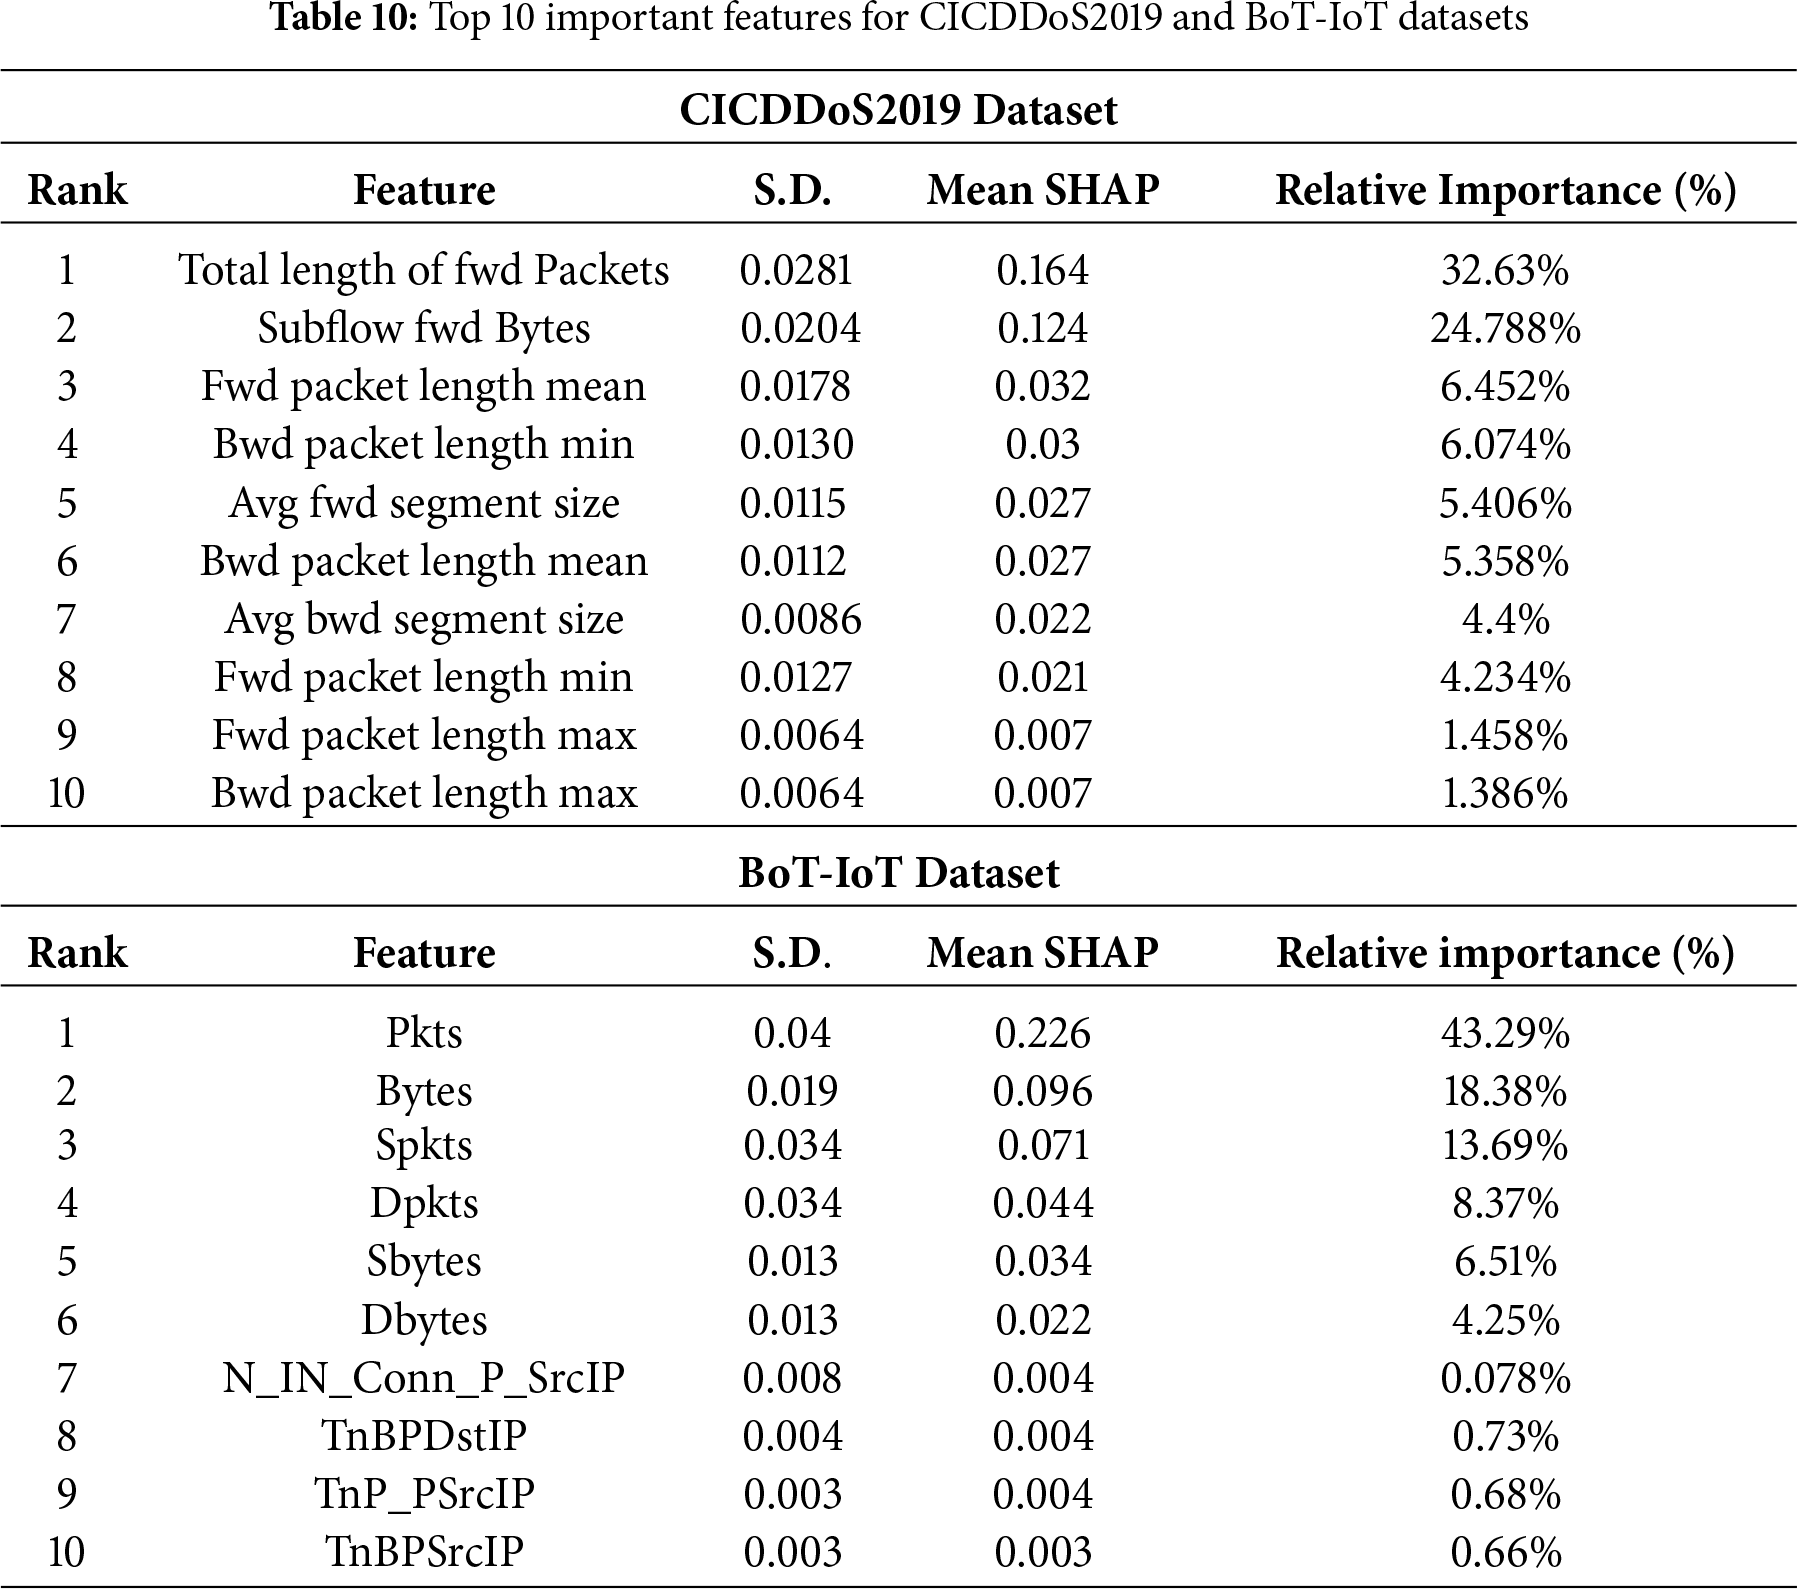
For the BoT-IoT dataset, Pkts, or the total number of packets, is the top-most influential feature, which significantly contributes to the model output. The mean SHAP, standard deviation value, and relative importance percentage of the most-influential feature are 0.226%, 0.04%, and 43.28%, respectively. This reflects the strong relation between the number of packets and attack behavior. Malicious nodes often initiate large-scale packet transmission to flood the targeted services. The second influential feature is Bytes, which contributed 18.38% to the overall prediction importance, suggesting abnormal changes in the traffic volume as a distinguishing factor between benign and malicious activity. Features like Spkts (Source Packets) and Dpkts (Destination Packets) contributed notably (13.69% and 8.37%, respectively), confirming that directional asymmetry in packet flow also plays a significant role in identifying attack classification.
SHAP insights for both datasets significantly improve model interoperability by quantifying and ranking the importance of each feature, validating the model’s logical alignment with known attack patterns, and allowing network analysts to focus on the most critical indicators while designing explainable and trustworthy IDS.
This study presents an explainable hybrid model for DDoS detection in SDN-enabled IoV networks. The model employs ResNet architecture to extract deep spatial features within the network traffic and BiLSTM to find long-term temporal dependencies. The model excels in achieving high detection accuracy while analyzing complex data patterns within the input sequences. The hybrid model employs the SHAP XAI framework to explain and interpret the model’s predicted decision, thereby enabling system analysts to trust and act on the model’s output transparently.
The SDN-IoV environment is created in Mininet-WiFi and SUMO, and the hybrid model is trained on the CICDDoS2019 and BoT-IoT datasets, partitioned into 60% training, 30% testing, and 10% validation, ensuring robust performance evaluation. The simulation results reveal the model’s high classification accuracy alongside strong precision, recall, and F1 score, thereby increasing network availability and minimizing service disruptions critical for vehicular safety and communication reliability. The hybrid model enables the SDN control plane for rapid mitigation policies, improving network resilience for high-volume and low-rate attack scenarios.
In the future, we aim to integrate federated learning into the hybrid model to enable collaborative model training across multiple domains without sharing raw traffic data, thereby preserving privacy while maintaining detection performance. Moreover, the model could be integrated with multi-access edge computing nodes in 5G/6G-based IoV infrastructure to enable ultra-low latency attack detection at the network edge.
Acknowledgement: The authors extend their appreciation to the Princess Nourah bint Abdulrahman University Researchers Supporting Project number (PNURSP2026R760), Princess Nourah bint Abdulrahman University, Riyadh, Saudi Arabia. The authors also extend their appreciation to the Deanship of Research and Graduate Studies at King Khalid University for funding this work through small group research under grant number RGP2/714/46.
Funding Statement: The authors extend their appreciation to the Princess Nourah bint Abdulrahman University Researchers Supporting Project number (PNURSP2026R760), Princess Nourah bint Abdulrahman University, Riyadh, Saudi Arabia.
Author Contributions: Conceptualization, Oumaima Saidani and Nazia Azim; data curation, Hala AbdelHameed Mostafa, Ehab Ebrahim Mohamed Ebrahim and Mohamed R. Abonazel; formal analysis, Ehab Ebrahim Mohamed Ebrahim and Sarah Abu Ghazalah; funding acquisition, Oumaima Saidani; investigation, Akbayan Bekarystankyzy and Mohamed R. Abonazel; methodology, Oumaima Saidani and Ateeq Ur Rehman; software, Akbayan Bekarystankyzy, Hala AbdelHameed Mostafa and Ehab Ebrahim Mohamed Ebrahim; validation, Sarah Abu Ghazalah and Ateeq Ur Rehman; writing—original draft, Nazia Azim and Oumaima Saidani; writing—review & editing, All authors. All authors reviewed the results and approved the final version of the manuscript.
Availability of Data and Materials: CICDDoS2019 Dataset available at https://www.unb.ca/cic/datasets/ddos-2019.html, BoT-IoT Dataset available at: https://research.unsw.edu.au/projects/bot-iot-dataset.
Ethics Approval: This research did not involve human participants, animals, or any personally identifiable information. All datasets used in this study (CICDDoS2019 and BoT-IoT) are publicly available and ethically compliant under their respective licenses.
Conflicts of Interest: The authors declare no conflicts of interest to report regarding the present study.
References
1. Yan G, Liu K, Liu C, Zhang J. Edge intelligence for Internet of Vehicles: a survey. IEEE Trans Consum Electron. 2024;70(2):4858–77. doi:10.1109/TCE.2024.3378509. [Google Scholar] [CrossRef]
2. Sedaghat S, Conti M. CFEA-IoV: an SDN-enabled IoV architecture for time-critical accident notification in automated vehicles. IEEE Trans Intell Veh. 2025;10(2):752–61. doi:10.1109/TIV.2024.3418307. [Google Scholar] [CrossRef]
3. Zabeehullah, Haq QMU, Arif F, Khan NA, Anwar MS, Alhalabi W. A secure AI framework for intelligent traffic prediction and routing in SDN-based consumer Internet of Things. IEEE Trans Consum Electron. 2025;71(2):6294–306. doi:10.1109/TCE.2025.3552609. [Google Scholar] [CrossRef]
4. Mudgal A, Verma A, Singh M, Sahoo KS, Elmroth E, Bhuyan M. FloRa: flow table low-rate overflow reconnaissance and detection in SDN. IEEE Trans Netw Serv Manag. 2024;21(6):6670–83. doi:10.1109/TNSM.2024.3446178. [Google Scholar] [CrossRef]
5. Riggs H, Khalid A, Sarwat AI. An overview of SDN issues—a case study and performance evaluation of a secure OpenFlow protocol implementation. Electronics. 2025;14(16):3244. doi:10.3390/electronics14163244. [Google Scholar] [CrossRef]
6. Ma X, Li X, He Y, Qi Q, Li H. BDTM: bidirectional detection and traceability mitigation of LDoS attacks in SDN. IEEE Trans Inf Forensics Secur. 2025;20:6826–39. doi:10.1109/TIFS.2025.3584638. [Google Scholar] [CrossRef]
7. Aizaz Ul Haq S, Imran M, Shah N, Muntean GM. SDN-based edge computing in vehicular communication networks: a survey of existing approaches. IEEE Access. 2025;13:74252–87. doi:10.1109/ACCESS.2025.3561083. [Google Scholar] [CrossRef]
8. Javanmardi S, Nascita A, Pescapè A, Merlino G, Scarpa M. An integration perspective of security, privacy, and resource efficiency in IoT-Fog networks: a comprehensive survey. Comput Netw. 2025;270:111470. doi:10.1016/j.comnet.2025.111470. [Google Scholar] [CrossRef]
9. Ali A, Assam M, Khan FU, Ghadi YY, Nurdaulet Z, Zhibek A, et al. An optimized multilayer perceptron-based network intrusion detection using gray wolf optimization. Comput Electr Eng. 2024;120:109838. doi:10.1016/j.compeleceng.2024.109838. [Google Scholar] [CrossRef]
10. Li Z, Kong Y, Jiang C. A transfer double deep Q network based DDoS detection method for Internet of Vehicles. IEEE Trans Veh Technol. 2023;72(4):5317–31. doi:10.1109/TVT.2022.3233880. [Google Scholar] [CrossRef]
11. Vivek Menon U, Babu Kumaravelu V, Vinoth Kumar C, Rammohan A, Chinnadurai S, Venkatesan R, et al. AI-powered IoT: a survey on integrating artificial intelligence with IoT for enhanced security, efficiency, and smart applications. IEEE Access. 2025;13:50296–339. doi:10.1109/ACCESS.2025.3551750. [Google Scholar] [CrossRef]
12. Zhu Z, Zhai W, Liu H, Geng J, Zhou M, Ji C, et al. Juggler-ResNet: a flexible and high-speed ResNet optimization method for intrusion detection system in software-defined industrial networks. IEEE Trans Ind Inform. 2022;18(6):4224–33. doi:10.1109/TII.2021.3121783. [Google Scholar] [CrossRef]
13. Kumari P, Jain AK. SDN-enabled IoT to combat the DDoS attacks. In: Communication and intelligent systems. Singapore: Springer; 2023. p. 23–33. doi:10.1007/978-981-99-2100-3_3. [Google Scholar] [CrossRef]
14. Bhale P, Chowdhury DR, Biswas S, Nandi S. OPTIMIST: lightweight and transparent IDS with optimum placement strategy to mitigate mixed-rate DDoS attacks in IoT networks. IEEE Internet Things J. 2023;10(10):8357–70. doi:10.1109/JIOT.2023.3234530. [Google Scholar] [CrossRef]
15. Du M, Wang K. An SDN-enabled pseudo-honeypot strategy for distributed denial of service attacks in industrial Internet of Things. IEEE Trans Ind Inform. 2020;16(1):648–57. doi:10.1109/TII.2019.2917912. [Google Scholar] [CrossRef]
16. Ravi N, Shalinie SM. Learning-driven detection and mitigation of DDoS attack in IoT via SDN-cloud architecture. IEEE Internet Things J. 2020;7(4):3559–70. doi:10.1109/JIOT.2020.2973176. [Google Scholar] [CrossRef]
17. Albishi OA, Abdullah M. DDoS attacks detection in IoV using ML-based models with an enhanced feature selection technique. Int J Adv Comput Sci Appl. 2024;15(2):814–23. doi:10.14569/ijacsa.2024.0150282. [Google Scholar] [CrossRef]
18. Alemu BT, Muhammed AJ, Belachew HM, Beyene MY. A comprehensive detection and mitigation mechanism to protect SD-IoV systems against controller-targeted DDoS attacks. Clust Comput. 2024;27(10):14295–313. doi:10.1007/s10586-024-04660-8. [Google Scholar] [CrossRef]
19. Nayak RP, Sethi S, Bhoi SK, Sahoo KS, Jhanjhi N, Tabbakh TA, et al. TBDDoSA-MD: trust-based DDoS misbehave detection approach in software-defined vehicular network (SDVN). Comput Mater Contin. 2021;69(3):3513–29. doi:10.32604/cmc.2021.018930. [Google Scholar] [CrossRef]
20. Deng Y, Jiang H, Cai P, Wu T, Zhou P, Li B, et al. Resource provisioning for mitigating edge DDoS attacks in MEC-enabled SDVN. IEEE Internet Things J. 2022;9(23):24264–80. doi:10.1109/JIOT.2022.3189975. [Google Scholar] [CrossRef]
21. Wazid M, Singh J, Pandey C, Sherratt RS, Das AK, Giri D, et al. Explainable deep learning-enabled malware attack detection for IoT-enabled intelligent transportation systems. IEEE Trans Intell Transp Syst. 2025;26(5):7231–44. doi:10.1109/TITS.2025.3525505. [Google Scholar] [CrossRef]
22. Alohali MA, Alahmari S, Aljebreen M, Asiri MM, Ben Miled A, Albouq SS, et al. Two stage malware detection model in Internet of Vehicles (IoV) using deep learning-based explainable artificial intelligence with optimization algorithms. Sci Rep. 2025;15(1):20615. doi:10.1038/s41598-025-00269-y. [Google Scholar] [PubMed] [CrossRef]
Cite This Article
 Copyright © 2026 The Author(s). Published by Tech Science Press.
This work is licensed under a Creative Commons Attribution 4.0 International License , which permits unrestricted use, distribution, and reproduction in any medium, provided the original work is properly cited.
 Downloads
 Citation Tools