
 Submit a Paper
 Propose a Special lssue
 Open Access
REVIEW
A Deep Dive into Anomaly Detection in IoT Networks, Sensors, and Surveillance Videos in Smart Cities
1 Department of Information Technology, Faculty of Computer Sciences, Lahore Garrison University, Lahore, 54000, Pakistan
2 Graduate School of Engineering Science and Technology, National Yunlin University of Science and Technology, Douliu, 64002, Taiwan
3 School of Informatics & Robotics, Institute for Art and Culture, Thokar Niaz Baig, Main Raiwand Road, Lahore, 54000, Pakistan
4 Graduate School of Intelligent Data Science, National Yunlin University of Science and Technology, Douliu, 64002, Taiwan
5 Department of Computer Science, Tunghai University, Taichung, 407224, Taiwan
6 School of Computing and Engineering, University of Huddersfield, Huddersfield, HD1 3DH, UK
7 The Faculty of Electrical and Electronics Engineering, Ton Duc Thang University, Ho Chi Minh City, 70000, Vietnam
8 Department of Information Systems, College of Computer and Information Sciences, Princess Nourah bint Abdulrahman University, P.O. Box 84428, Riyadh, 11671, Saudi Arabia
* Corresponding Author: Khalid Mahmood. Email:
Computers, Materials & Continua 2026, 87(2), 4 https://doi.org/10.32604/cmc.2025.073188
Received 12 September 2025; Accepted 15 December 2025; Issue published 12 March 2026
 View Full Text
 Download PDF
Abstract
The Internet of Things (IoT) is a new model that evolved with the rapid progress of advanced technology and gained tremendous popularity due to its applications. Anomaly detection has widely attracted researchers’ attention in the last few years, and its effects on diverse applications. This review article covers the various methods and tools developed to perform the task efficiently and automatically in a smart city. In this work, we present a comprehensive literature review (2011 onwards) of three major types of anomalies: network anomalies, sensor anomalies, and video-based anomalies, along with their methods and software tools. Furthermore, anomaly detection methods such as machine learning and deep learning are presented in this work, highlighting their detection strategy techniques, features, applications, issues, and challenges. Moreover, a generic algorithm is also developed to ease the user achieve the task more specifically by targeting a specific domain as well as approach. Comparative studies of three anomaly methods and their analysis identify research discovery areas with their applications. As a result, researchers and practitioners can familiarize themselves with the existing methods for solving real problems, improving methods, and developing new optimum methods for anomaly detection in diverse applications.Keywords
Advances in urbanization initiatives have drawn the attention of business executives and academics alike, with a spike in demand for cutting-edge technology powering smart cities in recent years. Imagine an intelligent city, a bustling metropolitan center where an array of electronic sensors, cameras, and IoT devices collaborate to gather information from people, resources, and gadgets. This data passes through a centralized network, where it is carefully examined, controlled, and used to uphold a precise balance throughout vital industries such as community services, information networks, and transportation systems. However, with increased technical capacity comes the obligation to protect public data; as a result, the main goal of these smart cities is to guarantee the highest level of security for the data that belongs to the public [1–4].
We now discuss anomalies, which are those fascinating occurrences in datasets that, in the context of data analysis, stand out prominently from the rest [5]. A medical miracle or a thrilling scene of a mystery thriller are some rare and complex phenomena that may be regarded as an anomaly. These anomalies, which are sometimes referred to as irregularities, divergences, abnormalities, or outliers, give a sense of excitement and unpredictability to a variety of areas [6]. Imagine a plethora of IoT tools, ranging from sensors to cameras, diligently gathering data from the smart city streets. This vast amount of data is kept on a centralized server, where it undergoes a processing show that makes it easier to watch citizens, analyze their behavior, and identify suspicious activity. The ultimate objective is to extract useful information that provides a safe refuge and protects cities from damage [7].
Networks, sensor data, and video data are three diverse areas where anomalies occur in the context of smart cities. When it comes to the digital world, network anomalies provide a hint of mystery, whereas sensory anomalies play with variations in sensory data. The last section of the show, video-based anomalies, features eye-catching images that highlight unusual activity, behavior, and occurrences. Anomaly detection has grown in popularity and excitement among researchers in recent years. Many applications have been created to help visually impaired people, such as intrusion detection, fraud detection, fault detection, health system monitoring, event detection in sensor networks, disturbance detection in ecosystems, trafficking systems, and outlier detection in video surveillance. In the past, data mining methods like the clustering method or statistics were used for anomaly identification. As shown in Fig. 1, anomaly detection approaches are divided into three categories in this paper: network-based anomaly detection, sensor-based anomaly detection, and video-based anomaly detection.
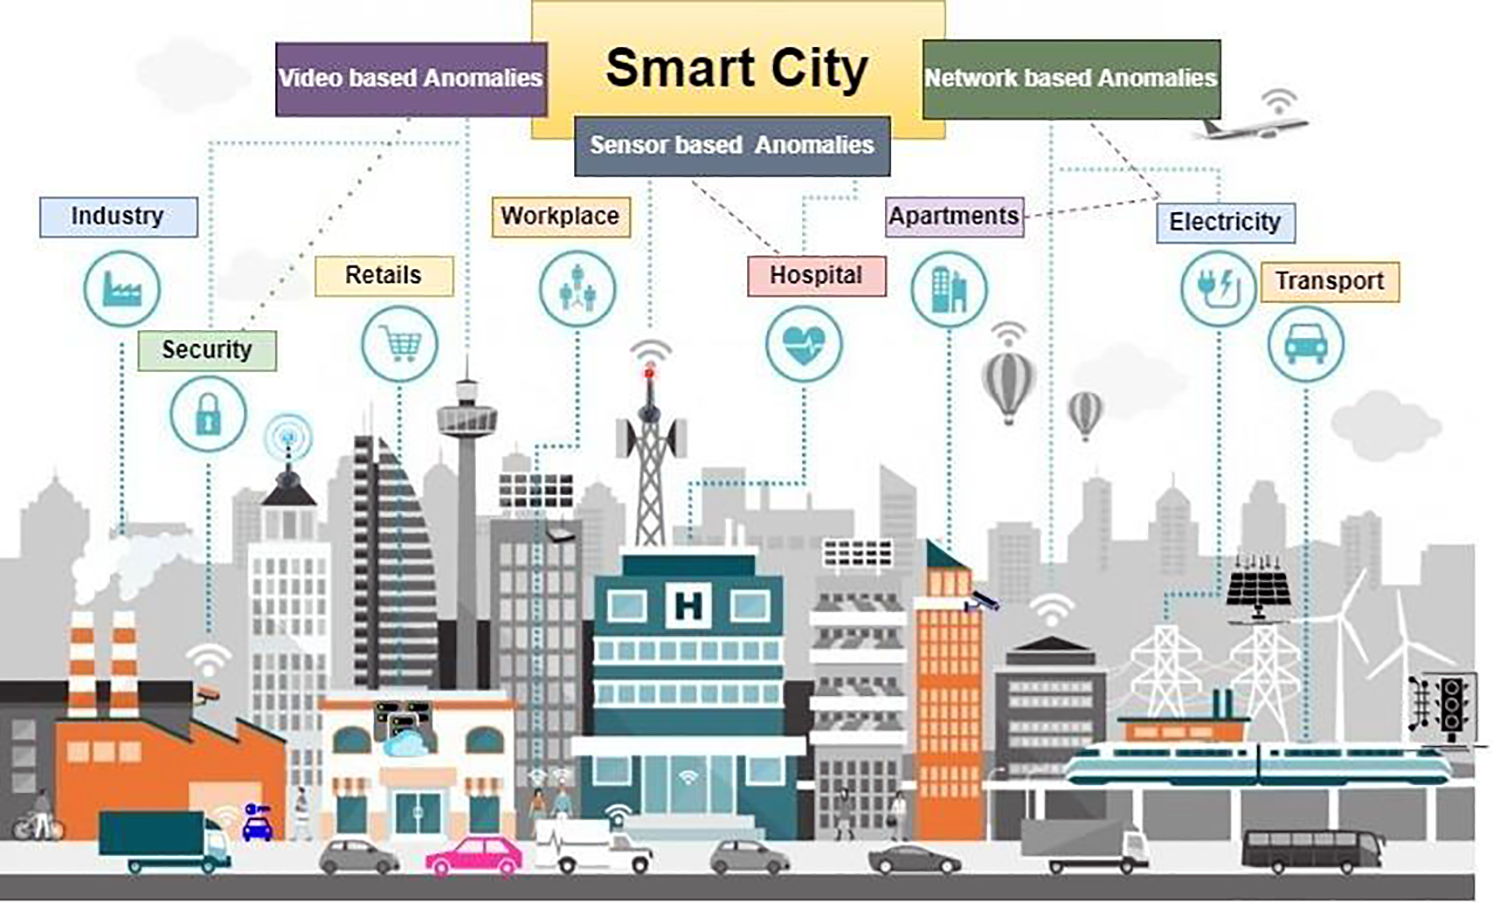
Figure 1: Depicts a smart city concept with a central focus on video-based, sensor-based, and network-based anomaly detection in many industries, retail, such as workplace, hospital, apartments, electricity, transport, and security
Sensor-based anomaly detection approaches find anomalies in data gathered by sensors, such as tracking road surfaces for a safe and smooth road infrastructure, whereas network-based anomaly detection techniques concentrate on identifying lost packets and data traffic and mitigating network assaults. Analogously, video-based algorithms are useful for identifying normal and aberrant behavior since surveillance cameras in smart cities record human and vehicle actions. Then, utilizing three anomaly detection learning techniques, such as supervised, semi-supervised, and unsupervised, this abnormal data is examined and retrieved.
The field of learning techniques has three fascinating approaches: supervised learning, which uses labeled data; unsupervised learning, which creates outcomes based on assumptions; and semi-supervised learning, which uses labels only for normal data. These strategies open the door to three different kinds of anomalies: the singular outlier known as a point anomaly, the context-shifting marvel known as a contextual anomaly, and the collective anomaly, which gathers examples that violate the norm. A person unexpectedly falling onto a sidewalk, cars driving on walkways, and jaywalking are a few examples of oddities [8]. In addition, as technology advances, smart gadgets such as computers, electronic components, and mobile phones produce a wide range of sensory data in different formats. In order to identify the movements of both cars and people, the use of surveillance cameras has grown dramatically. A number of methods and algorithms are used for anomaly detection in sensor, video, and network data, including Convolutional Neural Networks (CNN), Support Vector Machines (SVM), Artificial Neural Networks (ANN), Random Forests (RF), and Decision Trees (DT) [9–12]. Fig. 2 depicts the architecture for anomaly detection in a generalized manner, in which the system is pre-processed, and features are extracted according to typical and anomalous actions or occurrences.
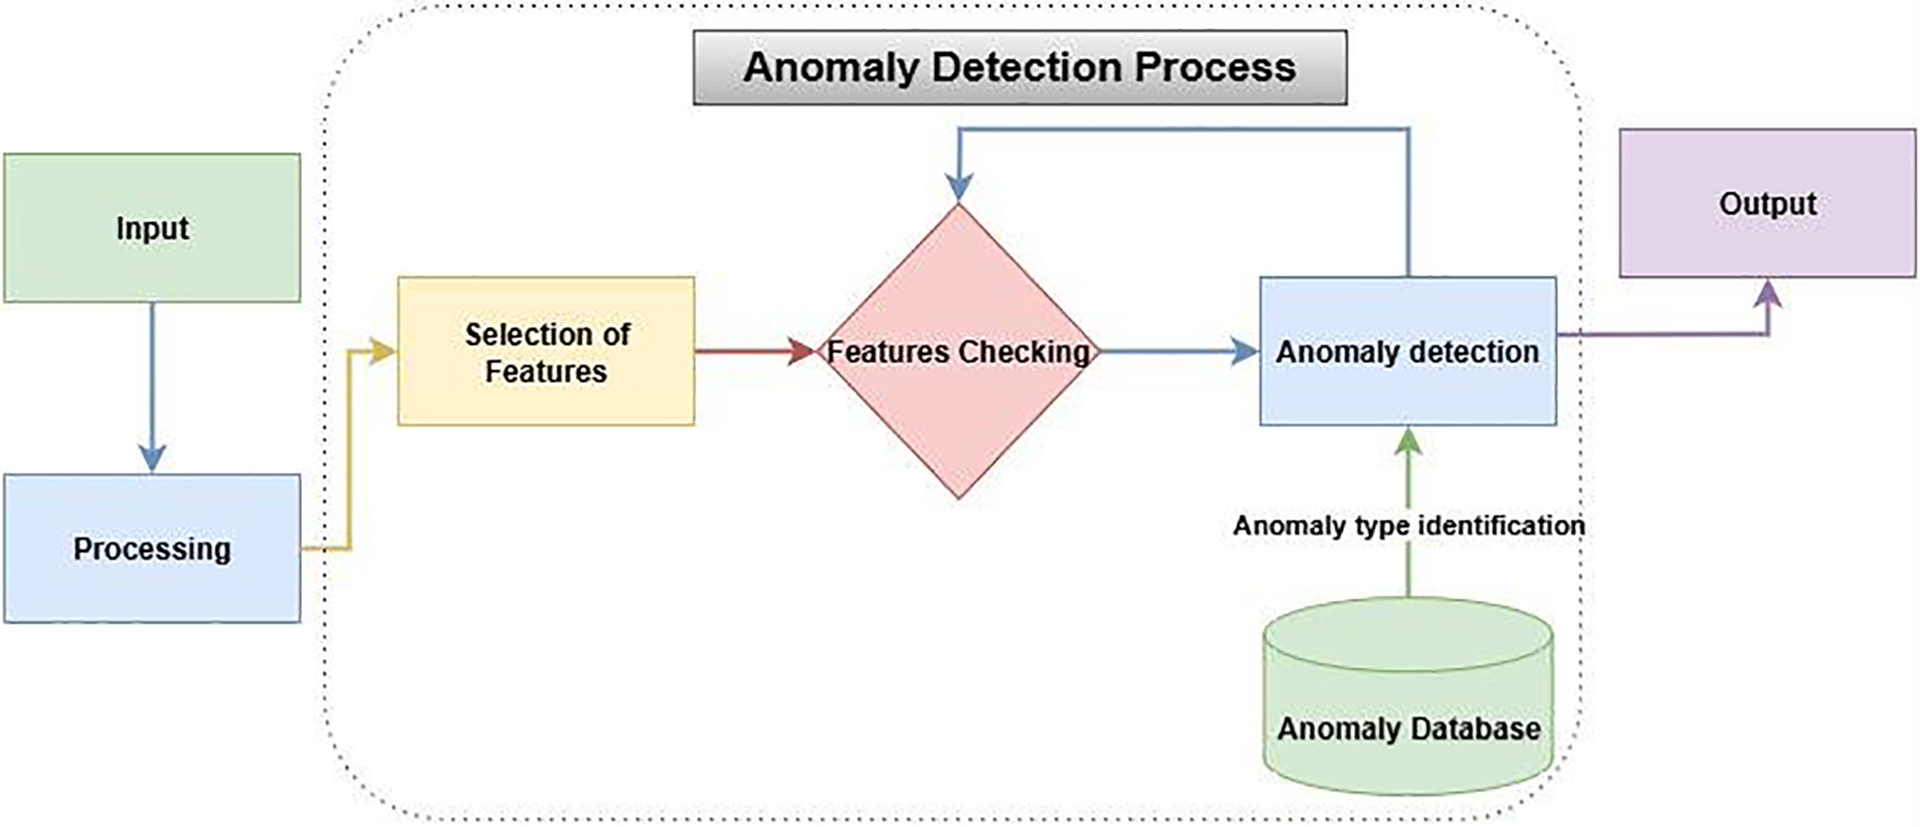
Figure 2: Flowchart representing the step-by-step procedure of feature selection, anomaly detection, and classification using a database of known anomalies
The proposed effort focused on the research issues and sought to answer them as follows, taking into consideration the comments given in the opening section:
Q1. What are the three most common types of anomalies that exist in smart cities?
Q2. What are the Network anomaly detection techniques?
Q3. What are the Sensor anomaly detection techniques?
Q4. What are the Video anomaly detection techniques?
Q5. What are the common challenges for anomaly detection?
We thoroughly analyzed anomalies in smart cities connected to networks, sensors, and video. For the in-depth examination, a review technique was adopted. This benefited us by combining earlier work and broadening our plan. The materials are linked to methods for detecting abnormalities in networks, sensors, and video. Other sources are used, such as research papers, review articles, conference presentations, and links. The fundamental purpose of our study is to provide information to all users so that they may choose which anomaly detection technologies will best meet their demands. Table 1 summarizes the findings of the investigation.
Recently, researchers have been exploring a variety of dimensions connected to networks, sensors, and anomalies in video. It has been an engrossing path of discovery exploring anomaly detection. With its thorough guidance, this article leads readers through the most recent innovations and methods that have completely changed the way we think about security and surveillance.
The study begins in the field of automated surveillance and focuses on the integration of sensors and feature extraction techniques [12]. But this technique for automated surveillance is comprehensive. Utilizing a variety of sensing modalities, likely to record a broad spectrum of abnormalities. In contrast, this might lead to a rise in complexity and resource needs. After that, the story switches to an impressive demonstration of using a Dense Random Neural Network (DRNN) to identify security vulnerabilities in smart homes [13]. Not only can the DRNN identify complex security breaches, but it also has the potential to identify anomalies in smart home environments with a high degree of accuracy. However, deep neural networks may be computationally expensive to train and maintain. The next sections provide a detailed analysis of healthcare system anomalies [14], demonstrating the ability of machine learning to detect denial-of-service attacks in the broad context of the IoT [15]. These techniques emphasize the significance of both the healthcare system and IoT security. Nevertheless, these techniques can improve the detection of irregularities in medical data and identify changing patterns of attacks. However, when it comes to limitations, machine learning techniques could have trouble processing the overwhelming amount of data generated by the Internet of Things. Additionally, privacy issues and regulatory issues arise when healthcare data utilization is taken into account.
The capacity of machine learning to change to counter shifting assault patterns. Two-layer dimension reduction and a two-tier classification module are introduced, thickening the plot and providing insight into the identification of harmful activity within the complex IoT networks [16]. Although the techniques have complicated implementations and possible computing costs, they offer in-depth insights into harmful activity occurring within networks. When a two-stream strategy is revealed, the plot takes an unexpected turn. This novel approach seamlessly integrates an autoencoder with post-hoc interpretability to find abnormalities in surveillance movies without explicitly labeling them [17]. This approach creatively blends many methods for identifying anomalies in security footage. Autoencoder integration, however, could improve feature representation. However, this procedure necessitates the meticulous adjustment of many parts. An extensive examination of deep learning-based methods for detecting anomalies in videos is presented together with a novel cinematic viewpoint [18]. The story takes off when a unique approach using machine learning techniques is used to identify anomalous activity in networks of smart home IoT devices, creating an anomaly-based Network Intrusion Detection System (NIDS) [19]. The investigation also includes the utilization of clustering methods, a complex method that identifies relationships and patterns in data points to produce attractive categories [20]. This technique offers a systematic way to spot patterns in data and can help make linkages in intricate datasets visible. As we go on to the following act, the focus is on traffic patterns, where Uncertainty-managing Batch Relevance-based Artificial Intelligence (U-BRAIN) skillfully manages missing data [21]. While the strategy for managing batches necessitates a sophisticated implementation, this method can manage missing data adequately. First, a thorough investigation of traffic analysis frameworks is presented, combining data from many sensors to provide an all-encompassing picture [22].
A dynamic battle between shallow and deep neural networks is introduced as the play progresses, with an engrossing investigation of identifying types of assaults and abnormalities in the Social Internet of Things [23]. This approach tackles the crucial problem of IoT security, although this research only focuses on a small number of works. With the adoption of a probabilistic generation approach, the plot takes an unexpected turn as the tale develops by warning users of likely anomalies based on domain information like community membership [24]. The experience of network intrusion detection is highlighted, with a potent large-data anomaly detection method driven by an altered version of the CluStream clustering algorithm [26]. A wide variety of algorithms locate spatiotemporal locations and reveal the mysteries concealed inside, taking viewers on an exhilarating voyage [27]. An intriguing investigation of abnormal behavior identification in video data concludes the narrative. This performance is a cinematic extravaganza that pushes the limits of technical capabilities with its stunning array of frameworks, which include feature extraction, categorization, and behavior modeling [9]. Using the mean-shift technique, anomaly categorization and detection in movies adds a little mystery and paves the way for further development [28]. On the other hand, this approach offers few details on particular techniques and real-world applications. The story continues with the addition of Convolutional Long Short-Term Memory (ConvLSTM) and Markov Random Field (MRF), a dynamic pair that analyzes abnormalities in video data and predicts future frames [29].
The Gaussian Mixture model is introduced in the plot as the drama builds, highlighting the unequaled precision of this method for identifying several suspicious occurrences in videos [30]. The entire range of visual anomaly detection problems might not be covered by this technique. The development of a device called a smart cane, which is intended to recognize things and give precise navigational guidance to those who are blind or visually challenged, marks a shift in the technological spectacle toward accessibility [31]. The story moves into the field of artificial vision and map-matching techniques, creating a tool that changes the navigational landscape in addition to detecting objects and places [32]. Deep information cannot be discussed while describing a particular strategy using this method. With a thorough dive into techniques for comprehending human activity and behavior, the action takes an introspective turn [33]. The use of CASBlip, a development in obstacle and object detection and navigation, ushers in drama [34]. With the use of spatial anomaly detection techniques, which include a choreography of data and information in sensor networks and uncover anomalies that challenge conventional wisdom, the narrative deepens [35]. Although network topology adjustments are necessary, this approach is thought to be sensitive. The narrative takes a surprising turn as it explores the underbelly of smart device complexity and the discovery of operational irregularities using current supply monitoring [36]. A crescendo of anomaly identification utilizing photos, videos, and sensors is shown in the grand finale, leaving the audience in wonder at the seemingly endless possibilities [4].
Contextual, point, and collective abnormalities are the main attractions throughout this magnificent show. Whether used with image, video, or sensor-based data, the story highlights how anomaly detection assumptions are universally applicable across a variety of contexts, resulting in a cohesive understanding. This article presents the three types of anomaly detection algorithms in a way that is elegant, precise, and innovative, effectively distilling the core of anomaly detection. As this fascinating voyage comes to an end, Fig. 3 shows as visual information, providing a look into the categorization of anomalies using three fascinating methods: sensing, video, and network. This work invites readers to immerse themselves in the thrill, creativity, and absolute creativity that emerge inside its covers as it serves as a monument to the seemingly endless possibilities within the field of anomaly detection.
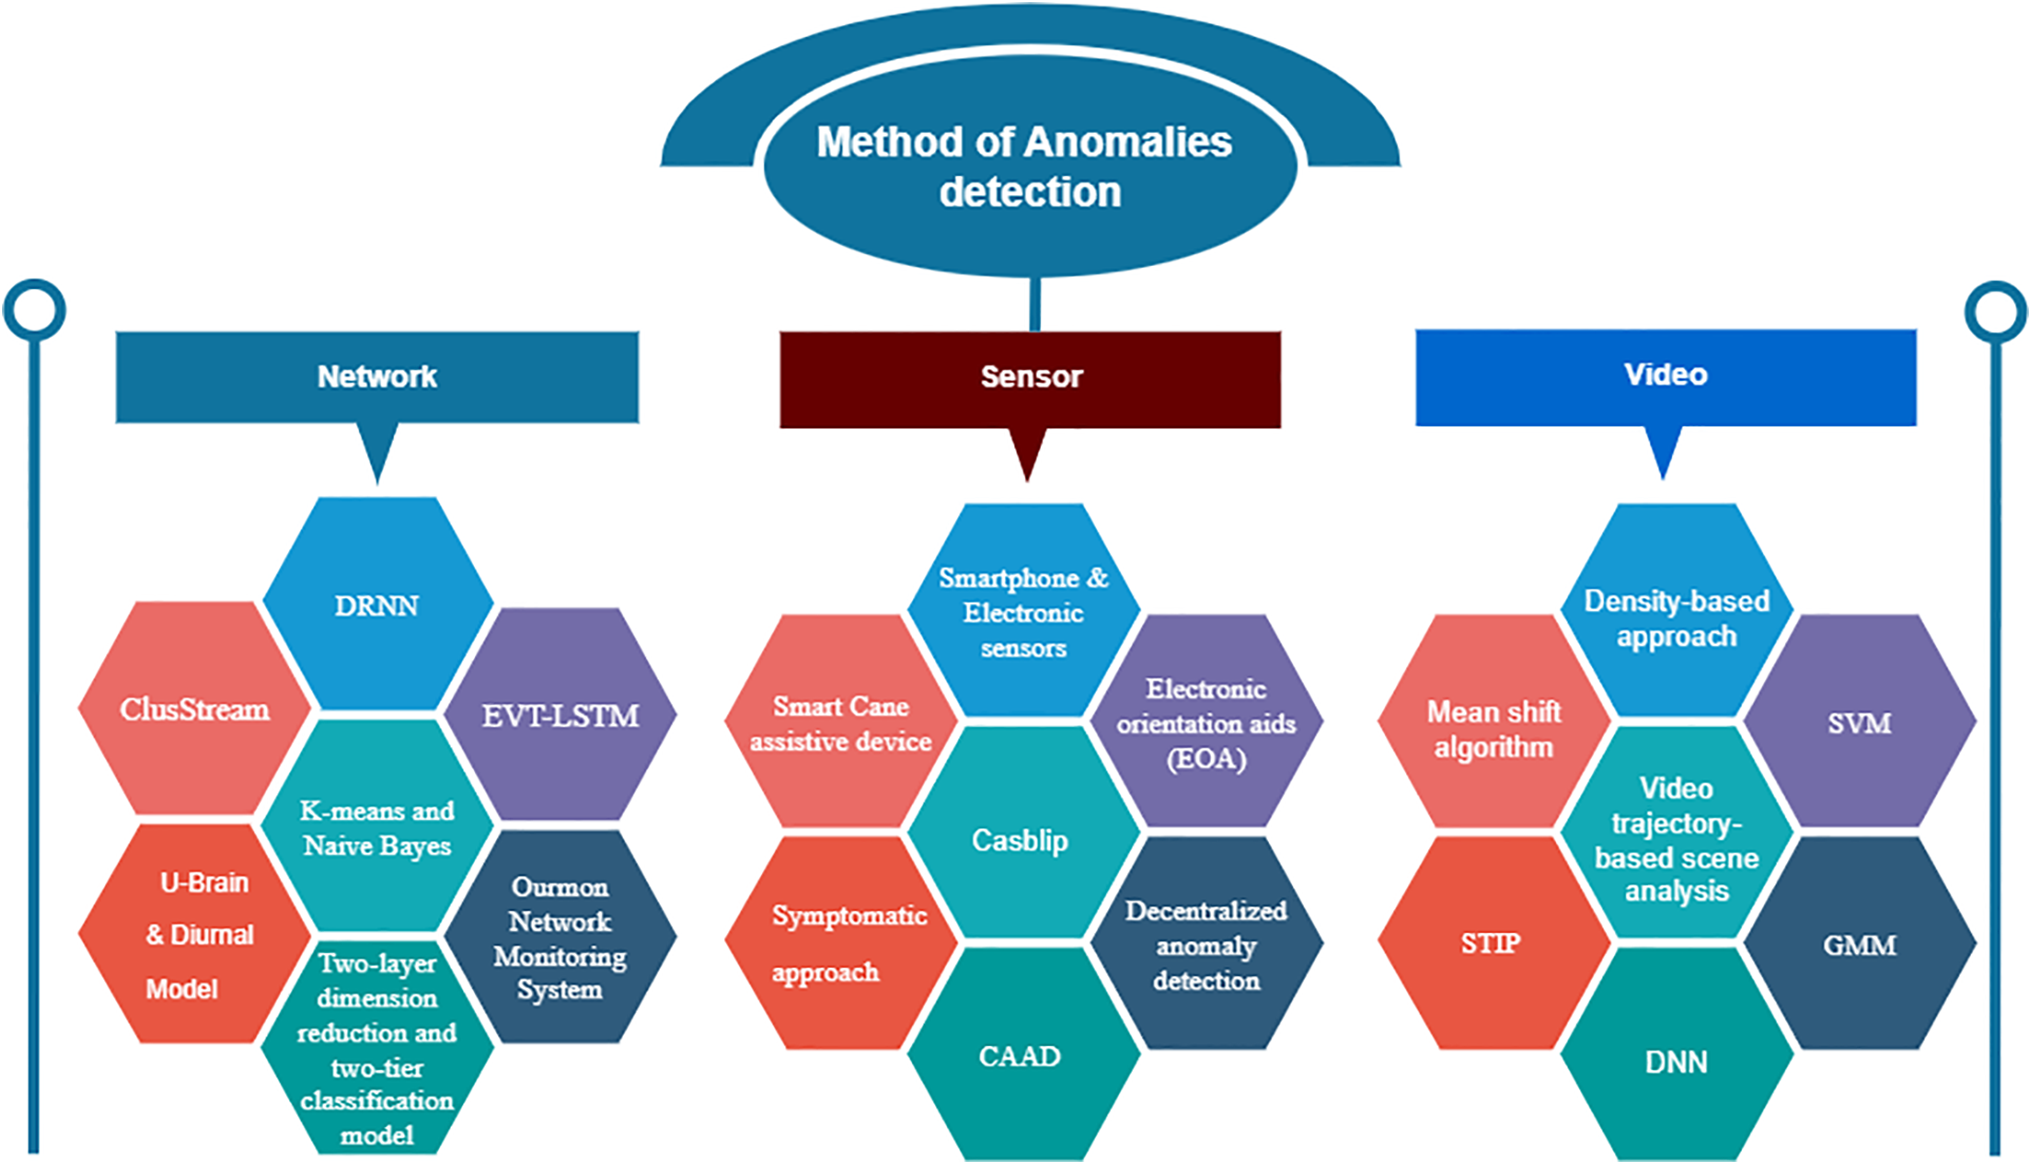
Figure 3: Methods for anomaly detection according to network, sensor, and video
4 Techniques and Methods Related to Anomaly Detection
As previously discussed, several techniques have been implemented and developed to understand patterns and anomalous human behaviors existing in any data. Furthermore, the discussion of the anomalies is categorized into three main domains: network, sensor, and video-based data. Some visualization methods for network anomaly detection are discussed.
4.1 Network-Based Anomaly Detection Techniques
Several devices produce information in different formats in smart cities, like some of the information in the signal format generated from the sensor-based device. However, some of the data is in video form and covered by a surveillance camera; this type of information is gathered and managed in a centralized network. Different approaches and methods exist in a centralized network that prevent the network from various kinds of attacks and detect anomalies in data, like an affected packet, missing data, etc. As presented, some techniques for detecting network anomalies and attacks are discussed here.
4.1.1 Dense Random Neural Network (DRNN)
DRNN is an in-depth learning approach used to analyze network attacks, such as denial-of-service attacks, denial-of-sleep attacks, and ping-of-death attacks, that occurred against IoT gateways and identify the method that detects network attacks. Similarly, DRNN also captures the affected packet with more accuracy after predicting the attack. In this scenario, the attacker sends the bundle of packets to the oversized destination to bring the system down on the destination side. For testing purposes, captured packets are used in which attacks are inserted to evaluate DRNN [13].
4.1.2 Irregular Pattern Monitoring System
In this study, we provide a probabilistic generative method that uses community membership as a foundational model for typical behavior and alerts to possible anomalies that deviate from this pattern. In fact, a null model to detect regular interaction patterns uses community membership as one of its fundamental building blocks. Through latent variables for community membership and the anomaly parameter, structural information is included in the model. The method seeks to infer these latent parameters, and then it outputs labels that indicate abnormalities at the network’s edges [24].
A powerful, large data anomaly detection technique built on a modified version of the CluStream clustering algorithm. In the suggested approach, Redis clusters are utilized to store all the data during the online stage and iteratively update the data over time. The K-means clustering technique is designed to decrease time complexity while the cluster centers are swiftly determined using the optimal-distance approach during the offline stage. The results of the experiments show that the suggested approach is speedier than the original CluStream clustering algorithm and can discover outliers in huge data with accuracy [26]. CluStream is also used to examine the clusters by extracting their micro-cluster information within a specific time sequence [37].
A deep learning model is used for the detection of cyberattacks by using the fog ecosystem. This model is resilient to cyberattacks because of its high capability of feature extraction and discovering hidden patterns from training data, so attacks are easily identified. Whereas the shallow model can also do this but has a lower accuracy rate than the deep learning model, deep learning has outclassed the shallow model with a higher accuracy rate for detecting cyberattacks [23]. The end-to-end deep learning model is presented to detect anomalies in temporal data. The proposed model is based on the Extreme Value Theory of Long Short-Term Memory (EVT-LSTM), which is derived from Long Short-Term Memory (LSTM). The experimental analysis is performed on seven real-world datasets to compare the proposed technique with other machine learning and hybrid deep-learning methods [38]. A deep learning method is discussed for analyzing data security and predicting anomalies in the network. This model predicted the anomaly in the future network. For experimental analysis, a public dataset and the analyzed method provide effectiveness and management strategies for network controllers [39].
A method of intrusion detection is described using a Deep Neural Network (DNN), a meta-classifier, and LSTM. The adopted method performs two primary tasks for anomaly detection. First, a Deep Sparse Autoencoder (DSAE) is used for feature engineering. The second step is a classification that can be performed with a stacking ensemble learning approach. Three different datasets are used for experimental analysis for anomaly detection, such as IoT-23, LITNET-2020, and NetML-2020 [40].
4.1.5 Detection of Patient Disease by Using K-Means and Naive Bayes
This study examines the use of the unsupervised K-means clustering algorithm to find anomalies in the healthcare industry and accurately forecast heart disease. The silhouette approach is used in the proposed model to first establish an ideal value of K before forming the clusters needed to detect abnormalities. The suggested model then uses the five most prominent machine learning approaches, including K-nearest neighbor, random forest, support vector machine, naive bayes, and logistic regression, to develop the final prediction model after removing the observed anomalies from the data. Using a typical dataset for cardiac illness, the effectiveness of the suggested technique is supported. In order to assess the accuracy of finding anomalies in our experimental study, the researcher also takes data plotting into consideration [41].
The Naïve-Bayes method is implemented to identify the relationship between dependent and independent variables. In contrast, the Naïve-Bayes classifier is also used to classify data according to its potential group. Heart disease increases around the world and causes death on a large scale. The Naïve-based method is used and compared to diagnose heart disease with other data mining techniques, such as DT and neural networks. Naïve-Bayes achieved the best result in diagnosing heart disease. K-mean is also used to detect outliers in heart patient diagnosis [42]. It is also investigated that integration of Naïve-Bayes techniques with boosting and bagging enhances the Naïve-Bayes classifier to diagnose liver disease [43].
The k-means clustering integrated with Naïve Bayes is used to diagnose the heart diseases of the patient. In this mechanism, the initial centroid selection (outlier, range, attributes, etc.) is critical due to its effects on better results.
4.1.6 Two-Layer Dimension Reduction and Two-Tier Classification Model
Nowadays, the IoT device usage is increasing and needs to make the IoT infrastructure more stable and secure. A model capable of detecting malicious activities and performing intrusion detection in IoT networks is critical for IoT networks like User-to-Root (U2R). The model performs linear discriminate analysis and component analysis to reduce the high-dimensional dataset to lower features. Similarly, two-tier classification used Naïve Bayes and k-nearest neighbor algorithms to identify suspicious and malicious behaviors [16].
4.1.7 U-Brain and Diurnal Model
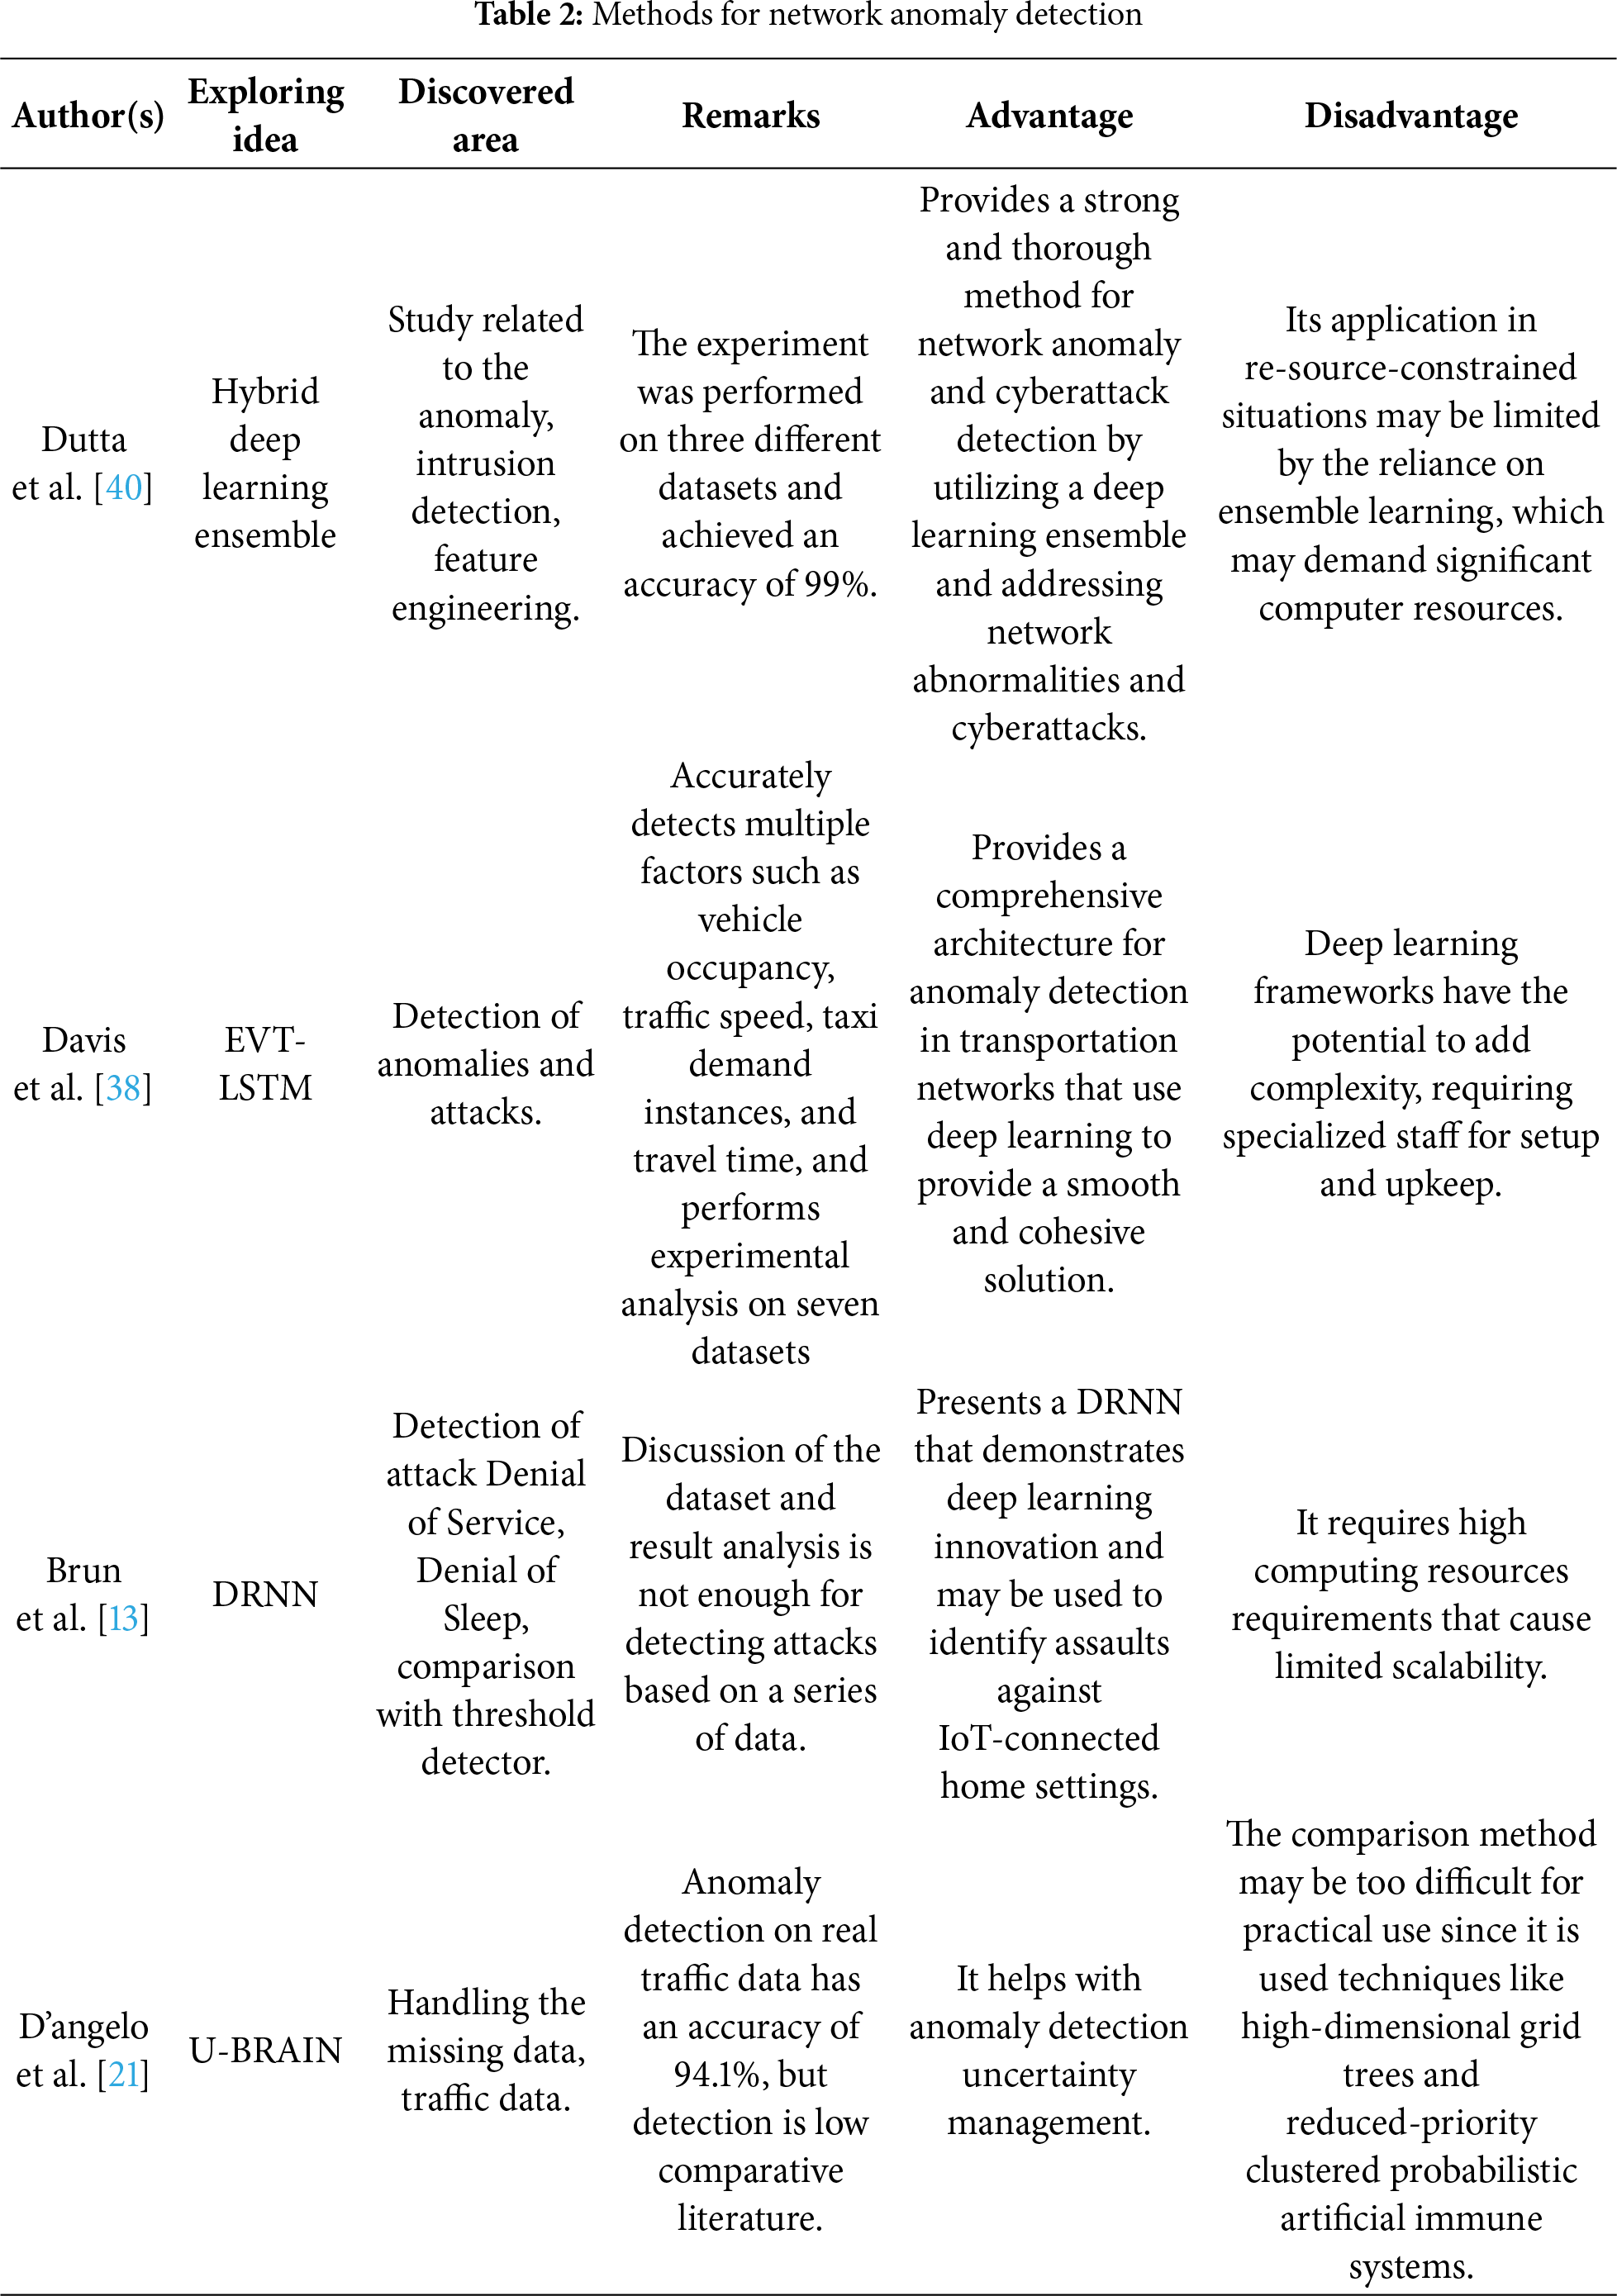
The technique U-Brain is used to understand and monitor the process that originates from data traffic. Thus, the U-Brain can quickly detect both normal and abnormal activities based on the training dataset. Additionally, U-Brain allows a specific amount of uncertainty to manage online network traffic complexity to make the system more reliable [21]. Chapple et al. [44] generated a diurnal network access model that detects authentication anomalies after user attempts at the login side. Identifying anomalies or anomalous connections can be made on the university network with the clustering method. Table 2 describes a brief overview of the approaches mentioned above, along with areas discovered and remarks. The purpose of these areas is to determine the applicability of a specific strategy regarding any network anomaly or outlier. Furthermore, remarks highlight the pros and cons of the approach concerned.
Mathematical Formulation of Network Anomaly Detection
Let
where
where
The rule for classification is described in the binary form:
Similarly, by reducing loss (L (hinge loss or cross entropy)), the ML and DL models find the optimal model parameters (θ) during the training process. The loss can be measured as the difference between true (
However, the optimization process can be done by updating the parameter θ with the help of a gradient-based or iterative method.
Finally, the solution can be obtained by setting a threshold (τ) for the classification of network traffic as mentioned below. Here (τ) is considered to be a threshold determined with respect to the validation.
A generic Algorithm 1 for network anomaly detection is discussed as follows:
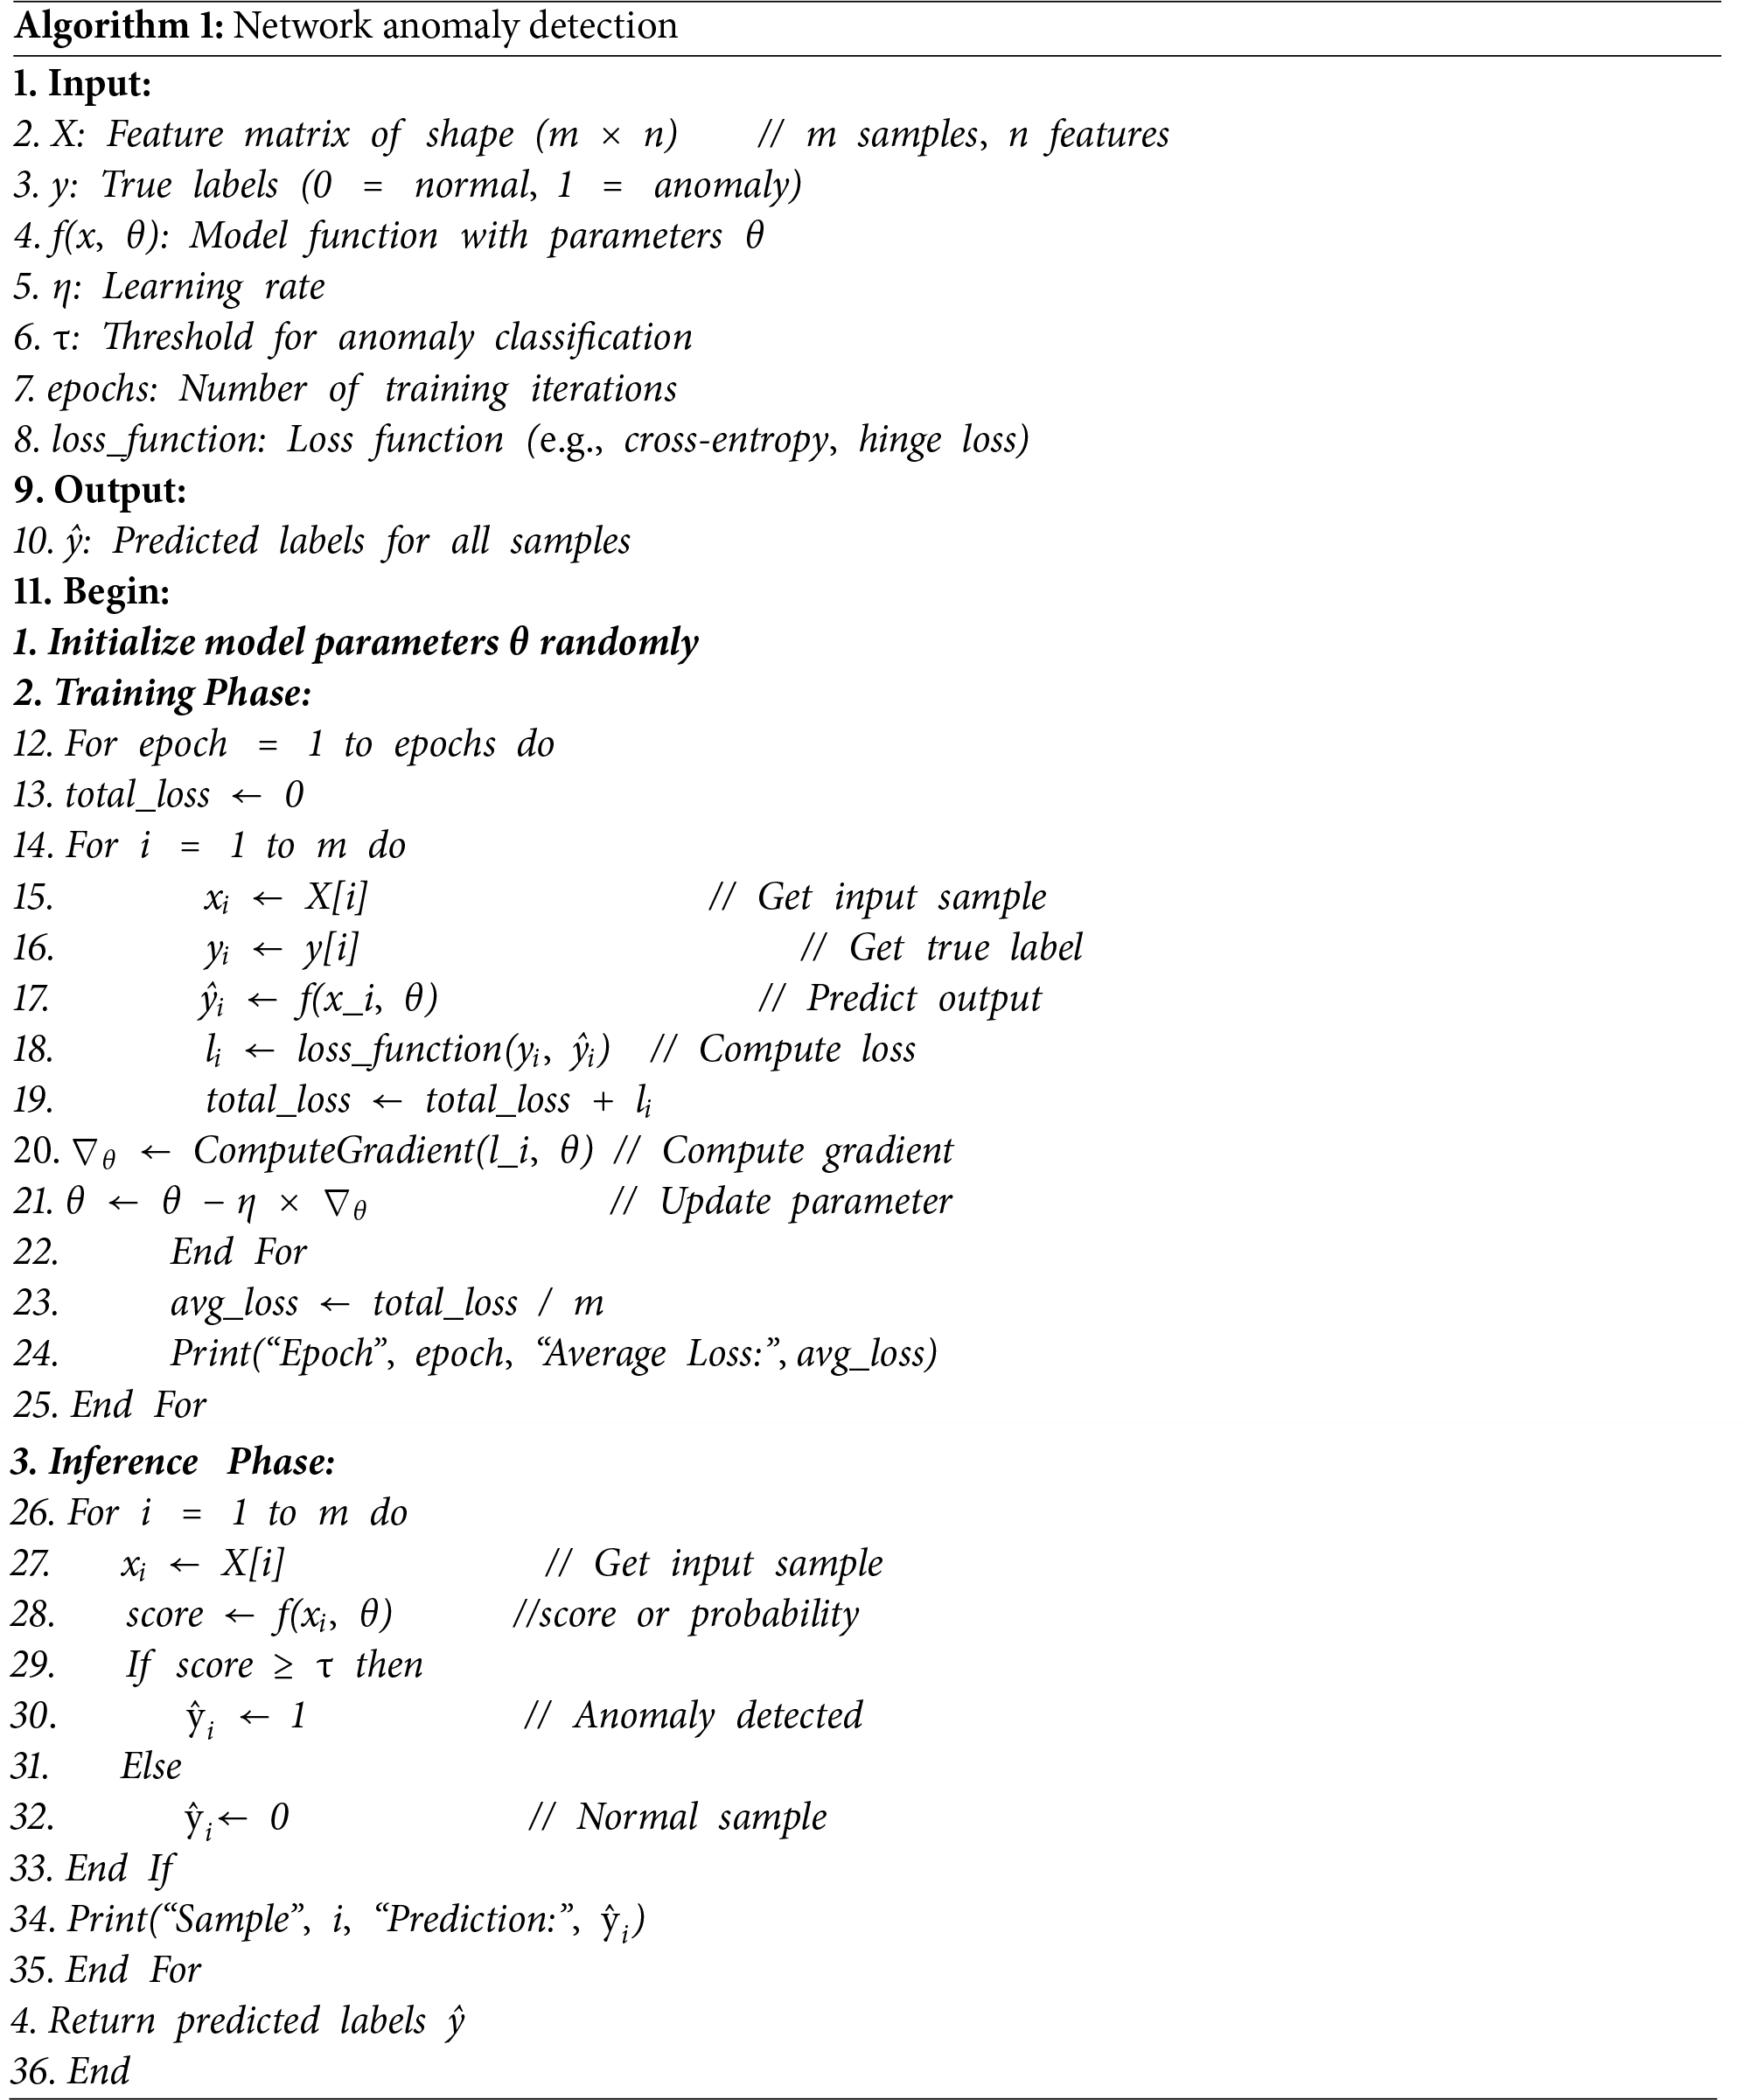
Fig. 4 shows that the performance trade-off in the deep learning-based anomaly detection is evident through the comparative analysis. Dutta et al. Hybrid Ensemble attains the highest accuracy of 99.0% with a heavy penalty both in terms of computational cost and complexity (Score 4), which substantiates the high cost of ensemble models. Although D’Angelo et al. U-BRAIN method is very complicated (Score 5), it has a high accuracy of 94.1% at a relatively lower cost of computation (Score 2) when compared with the other deep models. On the other hand, the Davis et al. EVT-LSTM and Brun et al. DRNN techniques suggest that there was a high complexity and accuracy of 90–100%, and, therefore, graphical visualization was needed to demonstrate these subtle performance attributes.
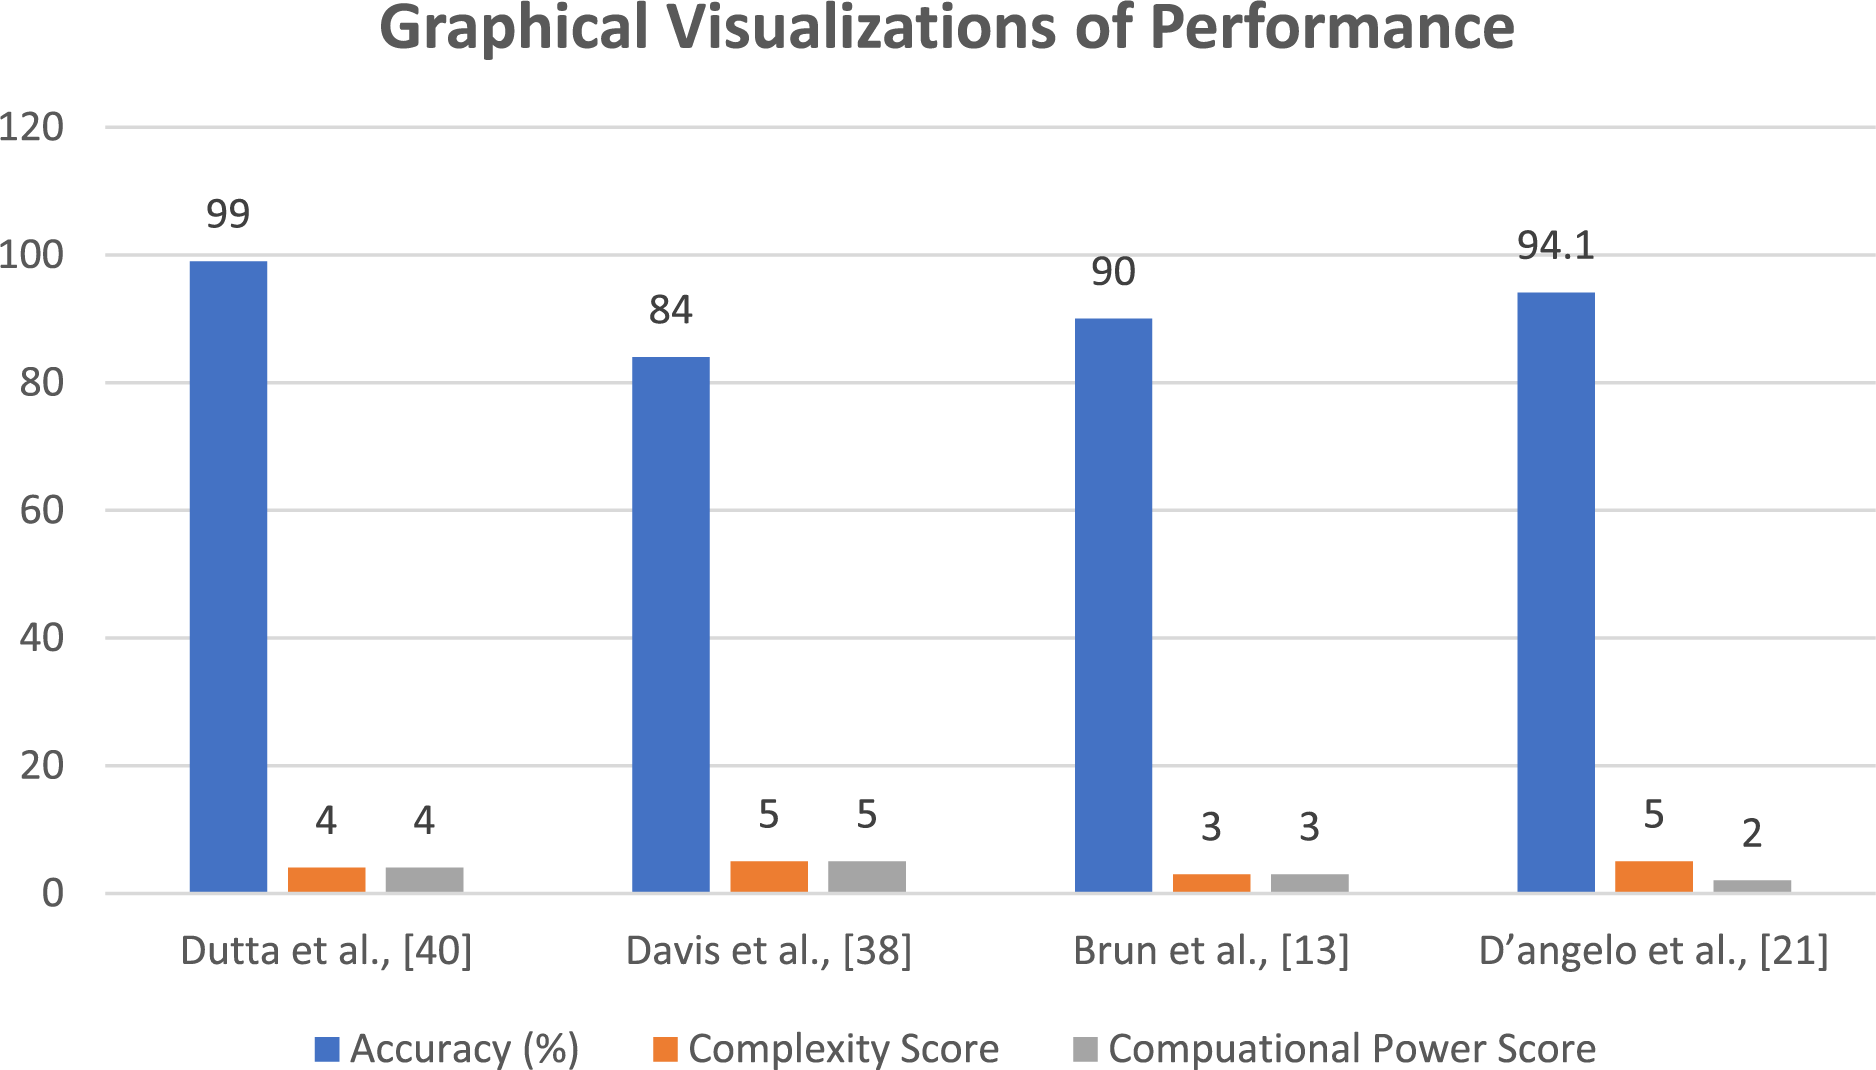
Figure 4: Graphical visualizations of performance [13,21,38,40]
4.2 Sensor-Based Anomaly Detection Techniques
Sensor-based anomaly detection recognizes faults between multiple connected devices. Data can be gathered through Radio-Frequency Identification (RFID) tags, weather stations, and the sensor-based component producing real-time sequential data in IoT. Many frameworks and models are used to detect anomalies, outliers, obstacles, and objects by using sensors and getting output in sensory information regarding the detected anomalies. The sensors read the physical world, mining the normal information and capturing anomalous events like credit card fraud detection, machine fault detection, and deteriorating health conditions. Some of the most common methods and tools, along with a brief discussion related to sensor-based anomaly and obstacle detection, are given below:
4.2.1 Cardiac Anomaly Detection Using Smartphone and Electronic Sensors
For health analytics, smartphones have been developed and deployed. Several built-in sensors include Photoplethysmography (PPG), Global Positioning System (GPS), accelerometer, magnetometer, and heterogeneous sensors to measure and monitor the health condition for exercise planning regarding the situation. If receiving or facing anomalous events or conditions, like sudden increases in energy consumption, the smartphone will alert [14].
Heart rhythm and heart rate are important parameters for detecting cardiac anomalies and for the health monitoring process. The development of smartphones with high-profile cameras has led to their usage for medical diagnoses to effectively and smartly detect cardiac anomalies and heart health. It is reported that there are effective mechanisms to utilize smartphones for monitoring heart health. A programmed Python application was designed to acquire the heart rate using the camera and data processing. The Power Spectrum Density (PSD) and Welch periodogram computation were performed to estimate the heart rate. Then, for the calculation of heart rate variability, three time-domain and two frequency-domain methods were used to detect atrial fibrillation by evaluating heart rate variability based on variability results and comparing various medical standards and facts [45].
Implementing a Wireless Sensor Network (WSN) to monitor and select heart health and related medical conditions is presented. The proposed implementation of wireless sensor networks is based on Haar wavelet decomposition, non-seasonal Holt-Winters forecasting, the Hampel filter for spatial analysis, and temporal analysis. The system can process the sensors’ data to estimate the condition of the patient for particular diseases and generate an alarm for the medical care team in emergencies. The heart rate, respiration rate, oxygen saturation in the blood, blood pressure, body temperature, and electrocardiogram are essential for diagnosing heart health and other related medical conditions. Various invasive and non-invasive sensors are available on the market to collect data from the patient’s body in the wired and wireless modes of operation, which can be interfaced to a centralized diagnostic and mitering system [46].
Various anomaly detection classification techniques, like the Hidden Markov Model (HMM) and Support Vector Machine (SVM), can detect cardiac anomalies. At the same time, the wrapper or hybrid method could enhance the efficiency of classification models. The researchers further presented the design of optimal feature selection by using a robust learning technique. This maximizes classifiers’ performance and effectively reduces phonocardiogram signals’ noise for optimal hybrid feature selection to identify the heart’s normal or abnormal state automatically. The author claimed 85% anomaly detection accuracy [47].
4.2.2 Smart Assistive Devices: Smart Cane Assistive Device, Casblip, and Electronic Orientation Aids (EOA)
A tool with a sensor framework is designed for impaired people. The usual ultrasonic sensor detects objects or hurdles that will appear near the blind man. The smart can also have a water sensor; this achievement makes it different from other visually impaired people. Smart canes can also be foldable and held more comfortably [31]. A smart cane, which is lightweight and inexpensive, receives signals and beeps in various patterns to warn the blind of any obstacles, potholes, or water puddles. It detects the level of ambient light and adjusts the Light Emitting Diodes (LED) illumination appropriately. These are achieved by combining an Arduino Nano microcontroller with two ultrasonic sensors, a moisture sensor, and a Light Dependent Resistor (LDR) sensor. These are positioned strategically along the cane for effective direction. In addition, a Global System for Mobile Communications (GSM) module is included in the system so that, in an emergency, a visually impaired person may send a message to the emergency contact number. Eighty percent of customers were happy with the prototype’s accuracy, which the evolved model demonstrated at a rate of 89% [48]. The design of a smart cane for visually impaired people is presented. Interfacing sensors have implemented the design with Arduino. The reported smart cane can detect holes and obstacles and give indications of direction to the blind person with the help of sound beeps at different intervals for different signals [49]. It was also reported that a smart cane design for blind people for obstacle detection was interfaced with an ultrasonic sensor with a Field Programmable Gate Array (FPGA) [50].
The device is designed for the impaired person who accurately provides awareness and guidance according to the new environment. The device consists of a GPS and a Geographic Information System (GIS) to accurately determine a blind person’s position and fulfill the blind person’s needs according to the unknown environment with navigation [32]. A wearable device helps visually impaired people detect objects and navigate to determine a clear and safe path. Whereas CasBlip has two modules that include a sensor module that consists of an image sensor and a laser beam for detecting an object, and an acoustic module that provides environmental information regarding the object’s location and converts the information into a sound format [34].
4.2.3 Symptomatic Approach and Other Machine Learning Approaches
A head-symptomatic approach is used to detect manufacturers and operational anomalies; it exists between the current supply of smart devices and characteristics that make the device functional. This approach is implemented to check the exploitation of current collections and provide a warning in the form of a deviation [36]. A machine learning model is discussed in order to detect anomalies and attacks in the IoT environment. However, machine learning models, including decision tree (DT), artificial neural network (ANN), Random Forest (RF), logistic regression (LR), and SVM, are used for anomaly and attack detection. It is concluded that DT, RF, and ANN performed better and achieved the highest accuracy than other models. Furthermore, it is also highlighted that RF performance is comparatively much better [51].
4.2.4 Decentralized Anomaly Detection
The primary purpose of using decentralized anomaly detection is to detect sensor node anomalies to reduce energy, rather than detect them in a centralized manner. For doing this, information can be collected with a neighborhood’s help for finding in-node anomalies [35]. This study intends to shed light on Human Activity Recognition (HAR) literature because of publications made after 2018. To highlight application areas, data sources, methodologies, and open research issues in HAR, the 95 publications assessed for this study were divided into several categories. Daily living activities appear to have received most of the attention in the literature, followed by user activities centered on individual and group-based activities. However, there is scant research on real-time tasks, including surveillance, healthcare, and suspicious activity. Data from mobile sensors and Closed-Circuit Television (CCTV) footage have been extensively used in previous research. The three most well-known methods used for HAR are CNN, LSTM, and SVM. Finally, but not least, the constraints and unresolved issues that need to be handled are presented in this research [52].
The demand for autonomous decentralized systems is increasing rapidly to detect anomalies on the industrial Ethernet. An approach has been presented that builds a traffic model for the chemical industry. This model decomposes the time series into four items that are produced by a stationary analysis. Furthermore, a space model, standard Kalman filter recursions, and an Expectation Maximization (EM) algorithm are also used for parameter identification. The techniques are evaluated and have a significant result in the detection of abnormalities [53].
4.2.5 Confidence-Aware Anomaly Detection (CAAD) and Other Models for COVID-19 Detection
A mechanism that predicts viral diseases like Severe Acute Respiratory Syndrome (SARS), Middle East Respiratory Syndrome (MERS), and COVID-19 is being discussed. In this method, the CAAD model is used to detect anomalous behavior. This method consists of a feature extractor, an anomaly detection module, and a confidence prediction module. However, these modules help to predict viral as well as non-viral pneumonia. If the anomaly detection module’s score is high and the score confidence prediction module is small, this case is considered an anomaly in viral pneumonia. The experiments were performed on the X-VIRAL dataset to predict viral or non-viral cases [54].
A transfer learning method is applied to Computed Tomography (CT) scan images for disease detection, like COVID-19. In this method, COVID-19 is detected in three phases. The first phase is the data augmentation with the stationary wavelets, and then a convolutional neural network is applied for the detection of COVID-19. Finally, the abnormality can be determined from CT scan images [55].
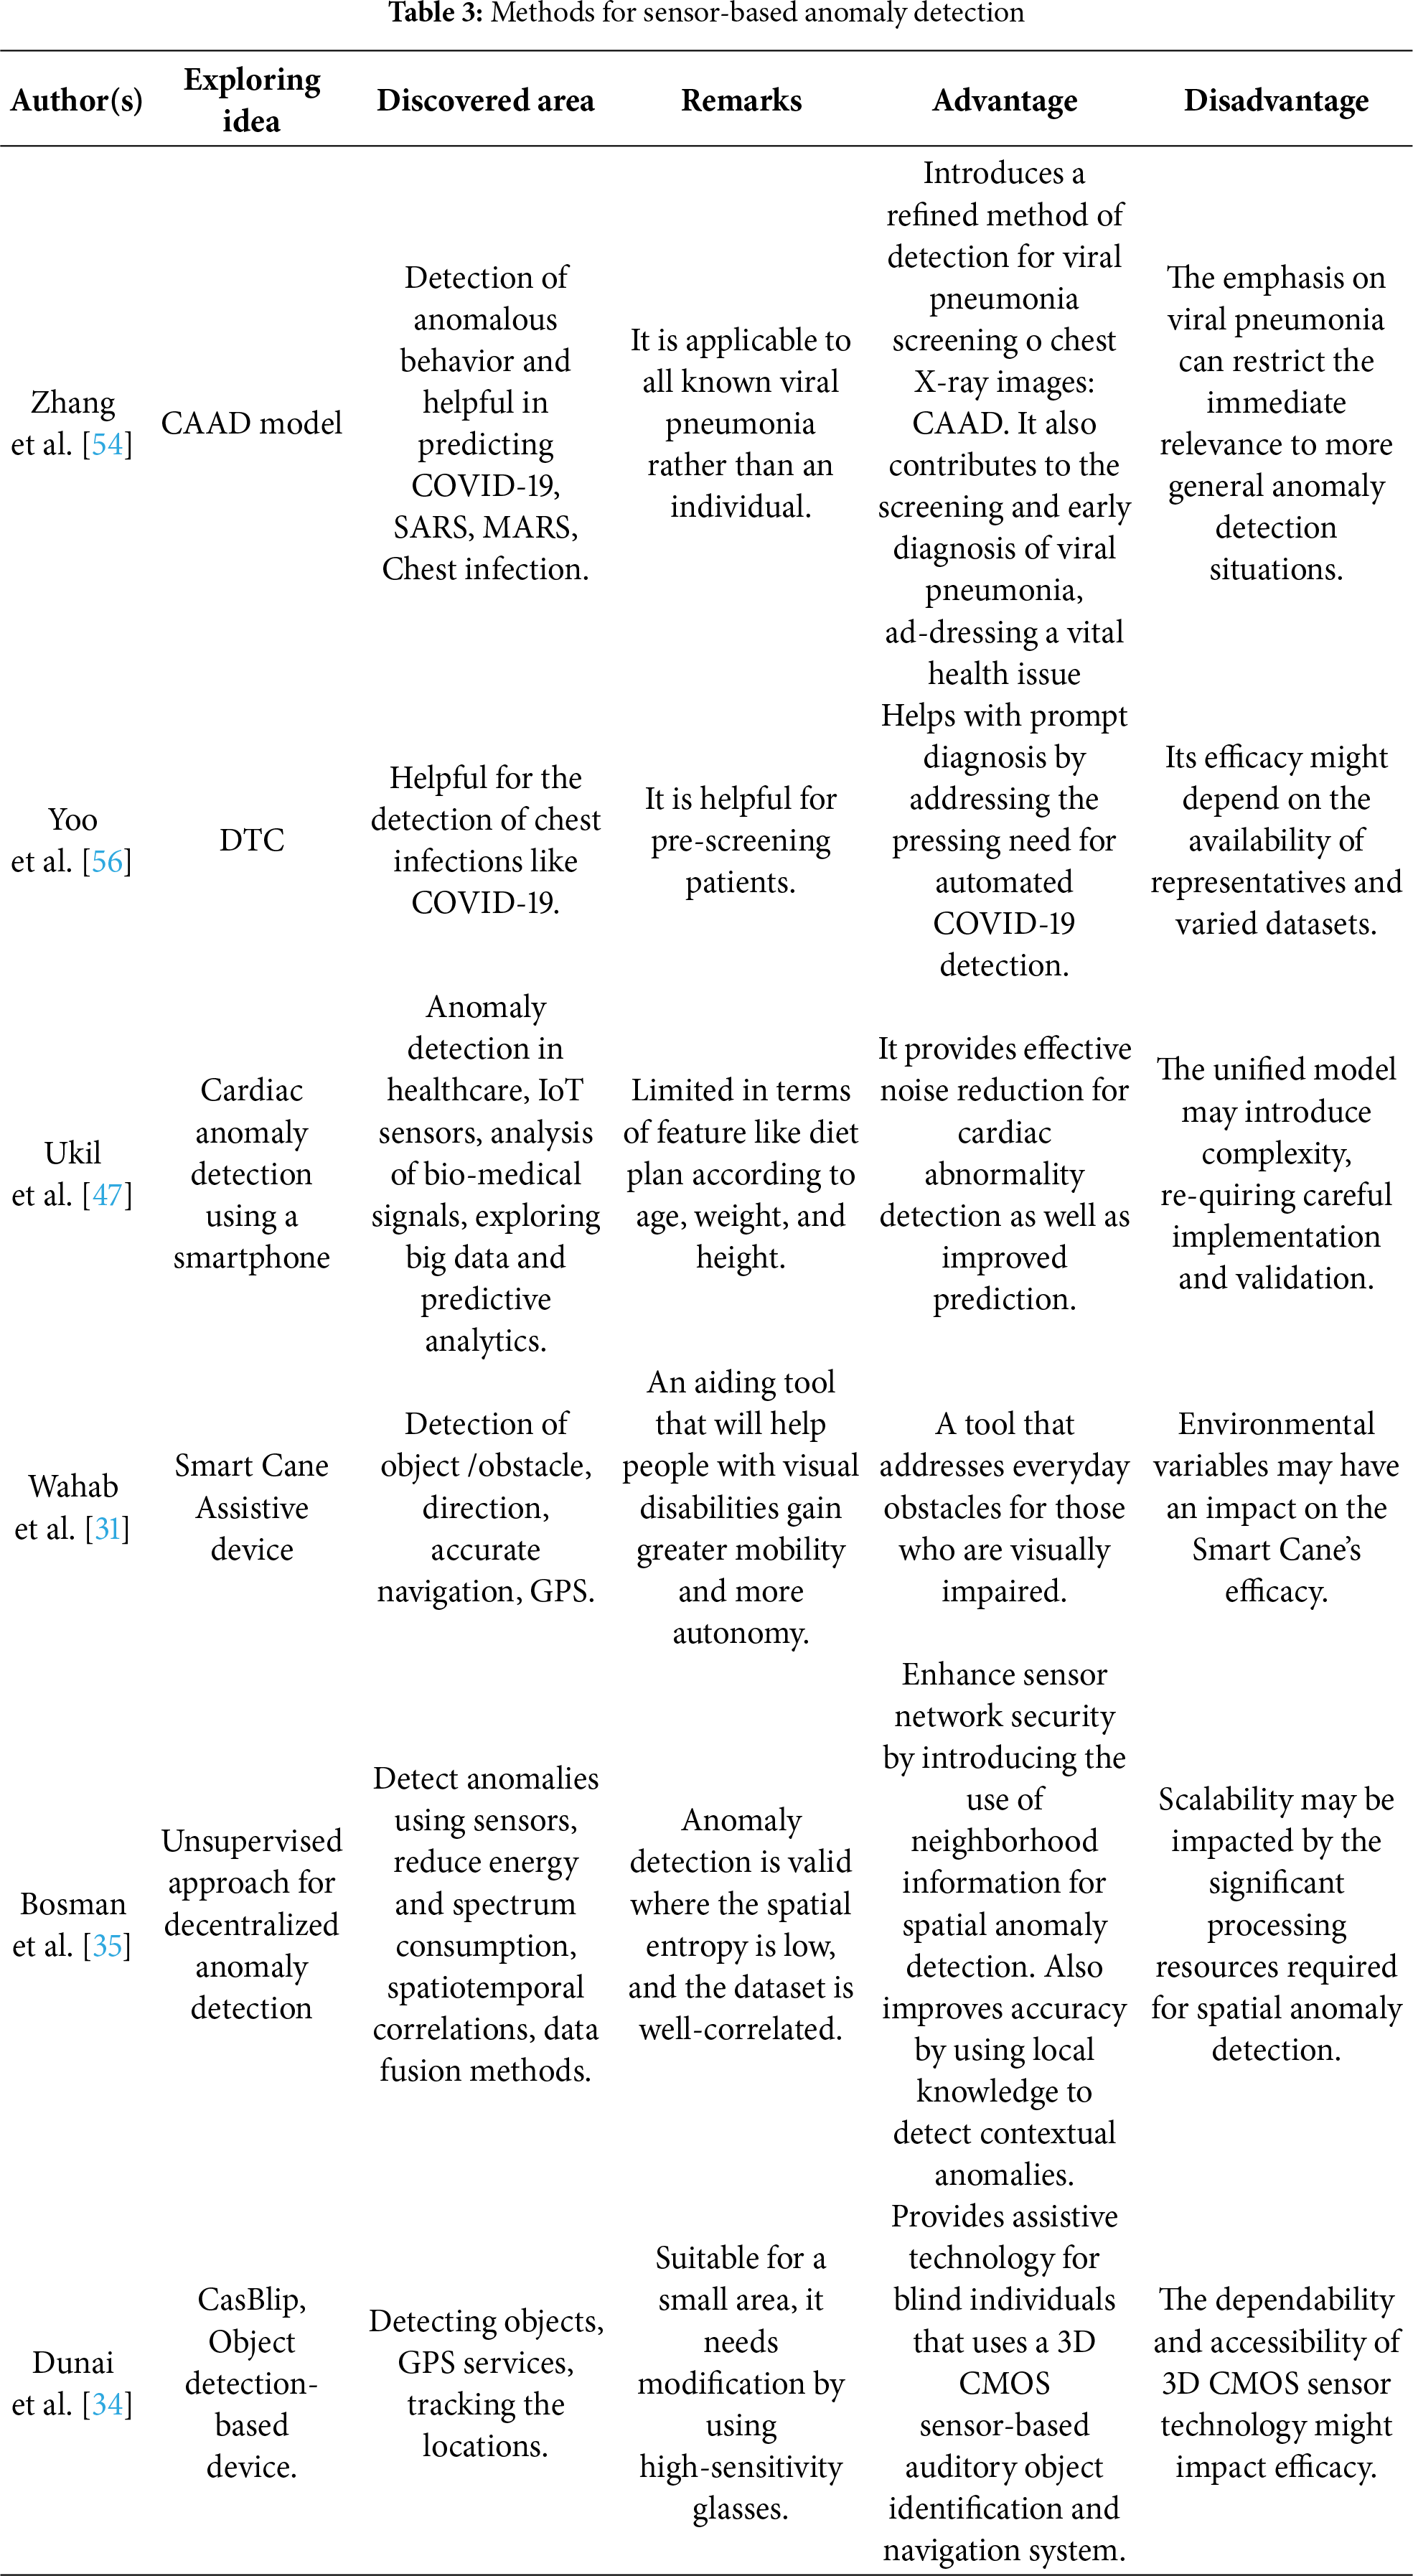
A method for the detection of COVID-19 using deep learning is presented. In this method, a decision-tree classifier (DTC) is adopted for the detection of COVID-19 from Chest X-ray Radiography (CXR) images. The classifier is divided into three binary DTs. The first DT differentiates between normal and abnormal images. The second DT predicted the tuberculosis sign, while the third identified the COVID-19 signs. The adopted method is helpful for pre-screening the patients [56]. Table 3 provides a brief overview of anomaly detection methods.
Mathematical Formulation of Sensor-Based Anomaly Detection
Sensor Data Collection
Let there be K different sensors, each generating time-series data:
where
∘
∘
∘
Feature Extraction
Raw data conversion into informative features:
where:
•
• Z: Feature matrix used for detection
Prediction Function
A mapping function f is applied to extracted features to estimate anomaly labels:
where:
•
• θ: Model parameters
•
Loss Function
The model is trained to minimize the discrepancy between predicted and actual labels:
where:
•
•
Parameter Optimization
Model parameters are updated to minimize loss:
where:
• η: Learning rate
•
Rule Decision
A threshold τ is used to classify predictions as anomaly or normal:
A generic Algorithm 2 for sensor-based anomaly detection is discussed as follows:
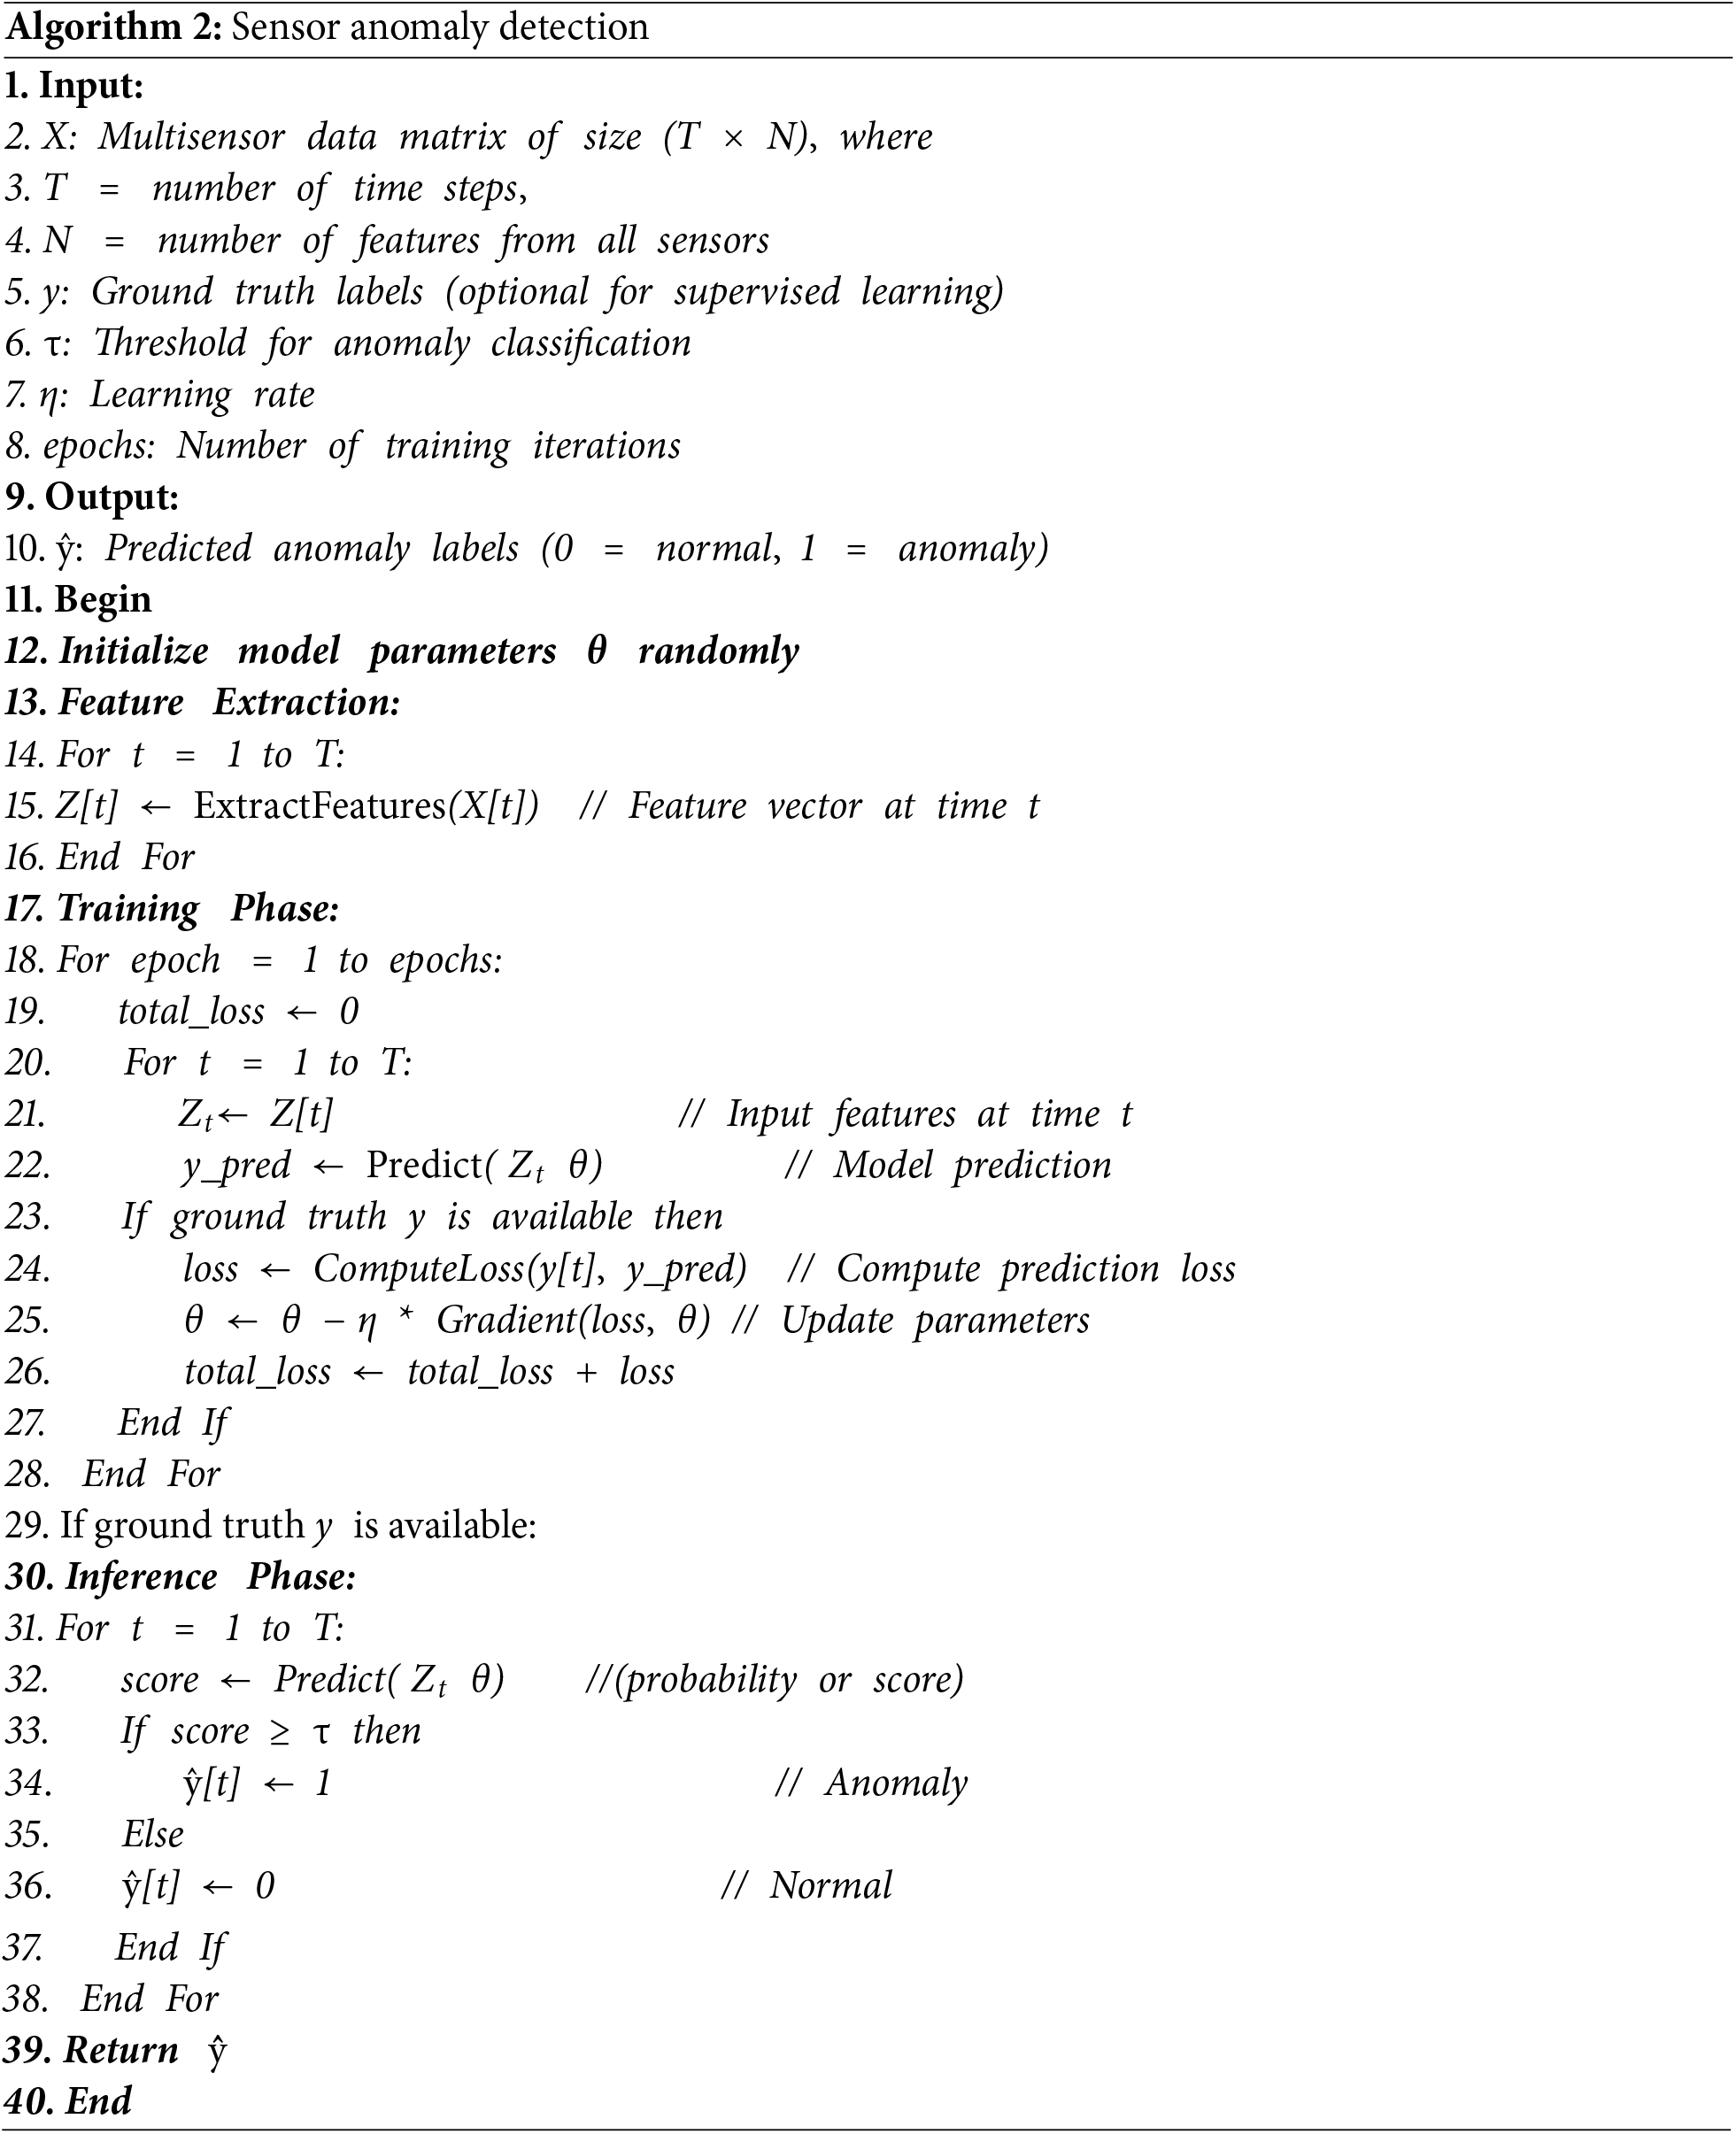
As shown in Fig. 5, Complexity and Computational Load Intensity are closely intertwined, particularly in the various application domains. Most of the application-specific and focused models, including the CAAD model, DTC, and Smart Cane, have the least complexity and computational load (Score 1), which implies that they are efficient, but could imply limited scope. On the other hand, approaches that address large, complex data, such as the Bosman et al. Unsupervised Spatio-temporal AD and Ukil et al. Cardiac AD requires a lot of complexity and computing power (Scores 4–5) because of the “significant processing resources” required to run the advanced signal processing and spatio-temporal analysis. This trend highlights an important trade-off, namely that efficiency may be attained at the cost of generalizability and ability to process complex, high-dimensional data.
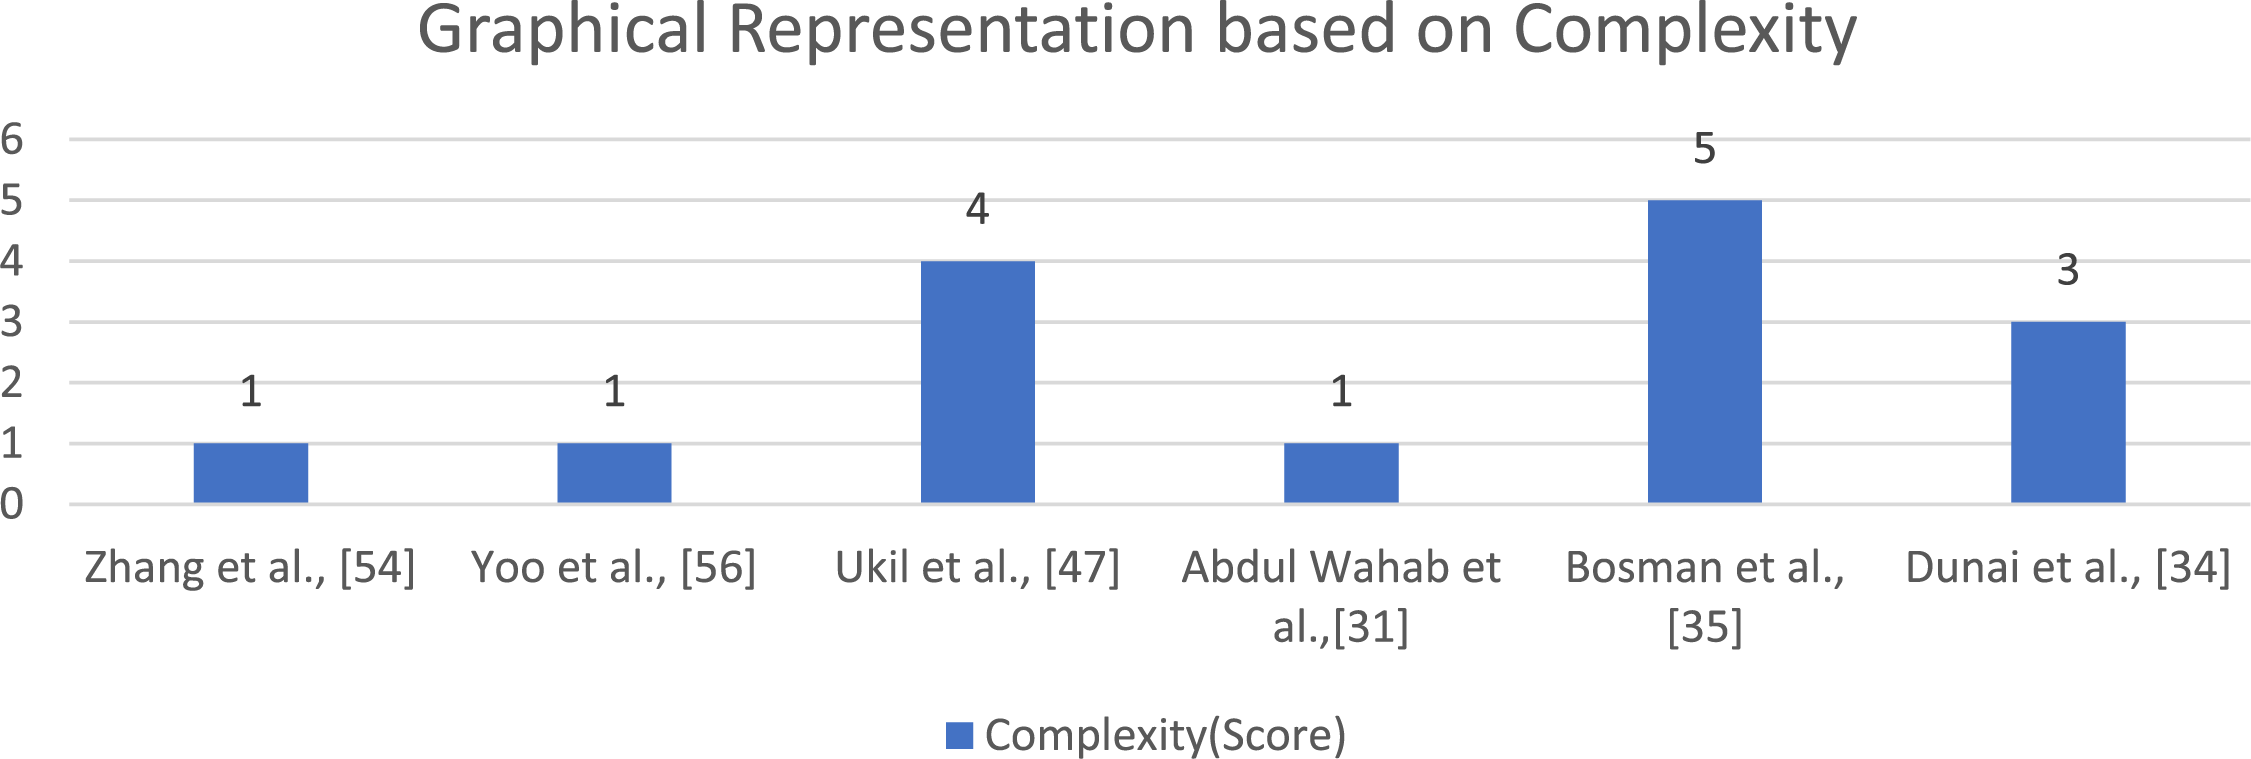
Figure 5: Graphical visualizations of complexity [31,34,35,47,54,56]
4.3 Video-Based Anomaly Detection Techniques
Many devices exist in the IoT environment that massively generate video data, including smartphones, wearable devices, cameras, etc. These devices are used for entertainment as well as security purposes. However, surveillance cameras monitor the run-time situation and detect suspicious or anomalous behavior, events, and objects. For example, the farmer used a camera-based drone and a helicam to detect the growing field’s condition and sense the soil’s nutrients and moisture. Similarly, wearable camera-based devices are used to help an impaired person survive [57]. Nowadays, detecting anomalous behavior within video contexts is an exciting field for researchers. Therefore, several methods have been developed to detect human activity and behavior through the different camera-based devices in visualization.
The local outlier factor (LOF) technique identified the suspicious object’s local density that its neighbors’ local density can notice. Therefore, for analyzing breast cancer, four algorithms (LOF, Order Points to identify clustering structure (OPTICS), Density-based Spatial Clustering of Applications with Noise (DBSCAN), and Density-based Clustering (DENCLUE)) are used and compared based on various parameters. For implementation purposes, a breast cancer dataset is used. Results show that the optics algorithm performs very well, but checking the number of outliers’ closeness with actual data, the LOF performs better [58].
The detection of an outlier in web video is gaining much attention among researchers. Several outliers and abnormalities emerged in various types of web videos, like sports, news, etc. To identify the outliers that exist in such types of videos, a density-based LOF method is adopted. The method detects the outlier based on the object that existed in the metadata. After that, LOF is used with multiple nearest-neighbor values to discover the anomaly in web videos [59].
4.3.2 Video Trajectory-Based Scene Analysis
Furthermore, the dense trajectory can be applied to video scenes for computing purposes to build the fixed-length descriptor of each frame and then generate bags of visual words. Afterwards, SVM is applied for the separation of suspicion clusters [28].
In surveillance videos, the detection of anomalous trajectories in traffic scenes, like the wrong U-turn, is essential. Presently, a general potential data field-based trajectory is used for clustering abnormal events and anomalous behavior. It has several limitations, like limited range estimation with the help of a factor that produces inaccuracy in the result, and a defined cluster size. The General Potential Data field with Spectral Clustering is adopted. This technique provides a 12% more accurate result in the detection of abnormal events [32].
4.3.3 Four Layered Approach for Video Anomaly Detection
An innovative technique for supporting classification machine learning algorithms creates an anomaly-based NIDS detection model, therefore identifying the aberrant SH IoT device network behavior. In a simulated SH test-bed scenario, three network-based assaults were utilized to gauge the effectiveness of our NIDS solution. The detection model produced using conventional and ensemble machine learning (ML) techniques performs exceptionally well overall. All detection models have greater than 98.8% accuracy [19].
In this research, a deep representation method for solving the issue is proposed. This method extracts and represents features in an unsupervised manner. This algorithm is capable of spotting odd behavior, such as lingering and standing still in a crowded area. Our suggested framework uses feature channels that were taken from the appearance and foreground of the original video and is a two-channel system. In order to learn the high-level feature representation automatically and generate two anomaly scores for these two channels, two hybrid deep learning architectures, called a four-layer stacked de-noising auto-encoder with three-layer deep belief networks, and a plane-based one-class support vector machine (SDAE-DBN-PSVM), are implemented. For merging anomaly scores and identifying anomalous events, a fusion strategy is then provided. This method’s efficacy has been tested using findings from two benchmark datasets (UCSD and Subway) and a sizable real-world dataset (MCG). The impacts of the volume of training data and the video’s lighting conditions on the precision of anomaly identification are also quantitatively analyzed and displayed [60]. Automatic event detection is popular in various types of applications, like sports and TV clips. For the detection of events, One Class Support Vector Machine (OCSVM) clustering is adopted to detect anomalous trajectories [58]. However, a support vector machine is also used to analyze the video and detect the vehicle’s abnormal behavior in traffic with vehicle trajectories [61].
The mean-shift algorithm is used for detecting abnormal behavior in a video, where each clip is of a fixed length. Videos are generated in the form of visual bags with the help of k mean hard quantization, then the mean-shift algorithm is applied in a repeated manner for the sake of improving the level of an anomaly by modifying and classifying the abnormal activities based on their location and weights. An anomaly with a high point is considered a novel [28].
Road anomalies can be detected by using the Grubbs test. The mean shift algorithm is used for data combining to find the anomalies’ positions from multiple clusters [62]. An approach has been presented that detects anomalous trajectories that exist in crowded scenes. This approach used four steps to detect anomalies. Firstly, the extraction of a moving object is done with an object tracker that extracts the object based on multiple features. After that, the mean shift algorithm is applied to get the distinct objects based on features. Finally, anomalies can be detected using a Shannon entropy-based anomaly detector [63].
4.3.5 Spatio-Temporal Interest Points (STIP)
STIP is a robust algorithm that is used for the recognition of humans and generating video summaries. STIP can detect the moving object from the video directly, rather than using foreground segmentation and modeling. A distribution does the extraction of STIPs based on velocity and locations, which are used for classifying abnormal behavior in a video. STIPs are the primary key to detecting exciting points in the video. Many applications (recognition of human action, surveillance videos, and précising the video) exist in which this technique is implemented to detect informative points. Therefore, a comprehensive overview of the STIPs algorithm and challenges has been discussed [27]. To provide important information in videos, particular spatio-temporal interest points and sparse convolutional coding are presented. Results demonstrated that both of these approaches performed well in identifying anomalous events [37].
A method of detecting abnormal behavior by using deep learning methods is described. In this paper, a Spatial Temporal Convolution Neural Network (STCNN) is used. This model first processes the surveillance images by using the aggregation channel feature model. After that, a suspected object region is detected with the help of feature extraction, and finally, SVM classification is performed to predict the abnormality [64]. A deep learning method for anomaly detection in real-time videos is discussed. In this method, the Incremental Spatio-Temporal Learner (ISTL) detects normality and anomalies over time. However, this method is suitable for real-time surveillance videos [65].
4.3.6 Deep Neural Network (DNN)
A DNN is used to define and identify normal behavior in videos. In contrast, DNN can also detect the future frame based on previously detected frames, so the model’s prediction can be made by comparing the video with the testing results. Different frames or errors are considered an anomaly in this scenario [29]. The DNN model is also used for anomaly detection. After the detection of the anomalies, a system-generated alarm is raised for security purposes. This method has low cost and high accuracy, like more than 90% [66].
4.3.7 Feature Extraction and Classification
The approach used for intelligently recognizing indoor and abnormal outdoor activities, especially understanding human activity, is feature extraction, so detection can be done using two steps: representation of behavior and modeling it. The first step describes behavior. The second step uses the methods of classification for behavior modeling by providing semantic information. Finally, it determines whether the behavior is normal or abnormal [9]. The researchers provide a two-stream method that offers an auto-encoder-based framework for quick and effective anomaly identification from surveillance video without tagging anomalous occurrences. Additionally, post-hoc interpretability of feature map visualization is used to demonstrate the feature learning process, exposing unclear and uncertain decision boundaries in the video series. Experimental findings on the Avenue, UCSD Ped2, and Subway datasets demonstrate the effectiveness of the applied strategy in identifying anomalous occurrences and elucidating the underlying workings of the model at the object level [17].
The crime rate is increasing nowadays. Therefore, there is a great demand to install surveillance cameras at different places, like schools, airports, etc. That works 24 h a day, on all days of the week, to monitor activity in the environment. There is a limitation in consistently detecting the anomalous content in the video. An approach has been presented that automatically detects the anomalous activity in three major steps. First, the object can be detected in a motion state, and second, object tracking is performed. Third, the activity can be identified by understanding the behavior. The feature extraction is used to extract key features like speed, dimension, etc. This helps with tracking the object. Finally, the dominant features are selected from the videos. However, the system provides accuracy up to 90% [30].
The deep learning approach is used for detecting anomalies in surveillance videos. For doing this, the Multidimensional Inequality Framework (MIF) framework is used for visual features and extracts normal and abnormal activities [67]. A framework is presented that separately detects local as well as global anomalies. For global anomalies, kinetic energy and the computation of the first derivative of kinetic energy are used to find the global anomaly by computing each frame score. After that, the anomaly can be detected by categorizing the local anomaly into three more categories: appearance, velocity, and location anomaly. These anomalies can be detected by extracting various features. Finally, identify abnormalities from the video [68].
4.3.8 Gaussian Mixture Model (GMM)
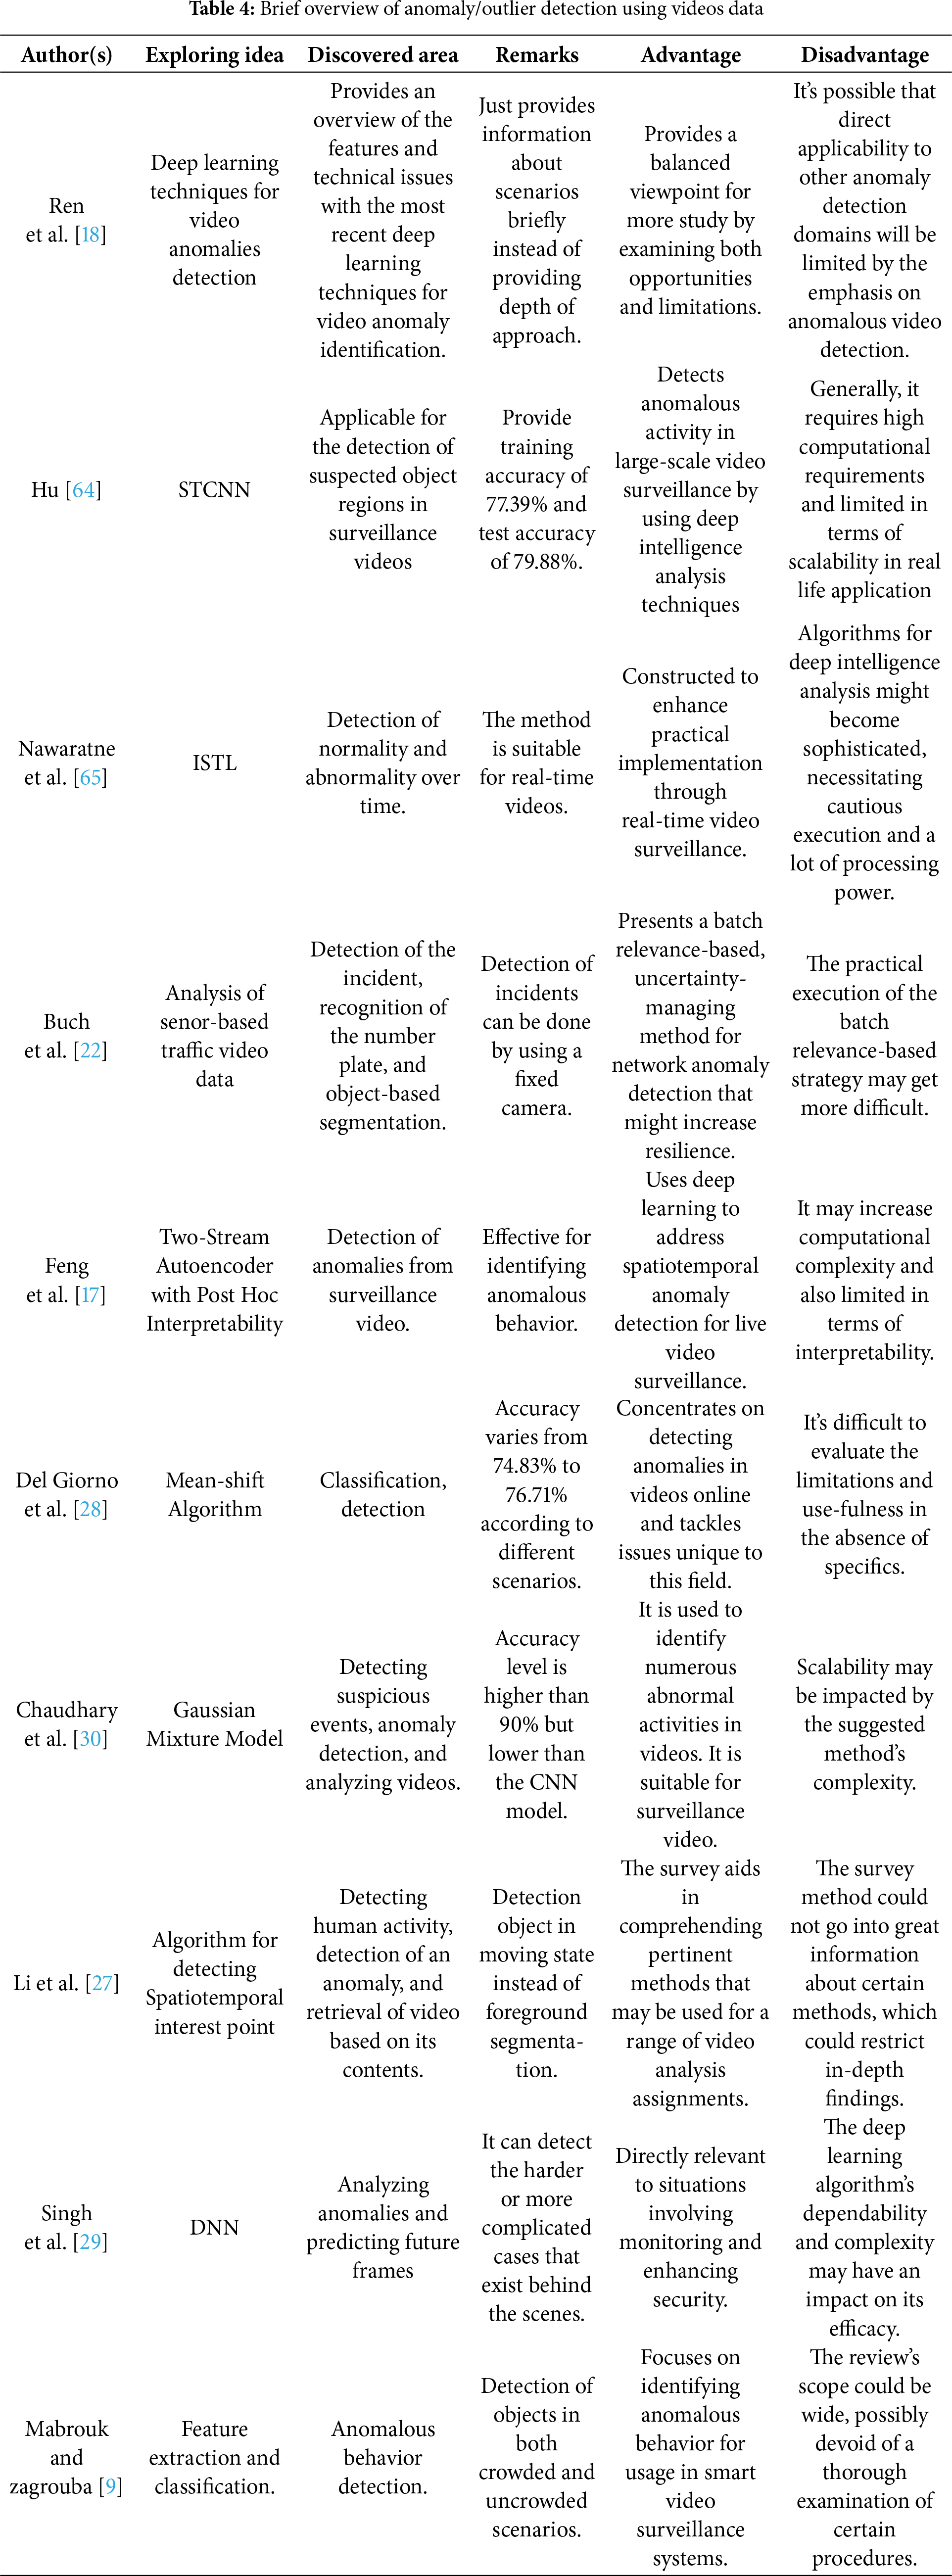
The Gaussian Mixture model is used for detecting objects, such as those that involve crawling, walking activities, and foreground. Therefore, object direction and patterns are used to detect suspicious events. After that, it classifies the data into a normal or abnormal form. The alarm is produced to detect abnormal or suspicious events [30]. The Gaussian Mixture Model is used with other techniques for comparison to detect an object that is in a moving state in the video. This model is efficient, even for detecting complex situations, dynamic objects, and objects in shadow [69]. A Gaussian mixture model is presented to extract normal behavior from the crowded videos. The model robustly extracts the motion from the dynamic scenes. Motion features that do not fit in normal scenes are considered anomalies [70]. Table 4 provides a brief overview of visualization approaches, along with discovered areas and remarks.
Generic Mathematical Formulation for Video Anomaly Detection
Video Data Collection
The video is a sequence of frames over time. Let the video data be represented as:
where:
•
• H, W: Height and width of frame
• C: Number of channels (e.g., 3 for RGB)
The spatio-temporal block or segment can be defined as:
Feature Extraction
Each segment
where:
• ϕ(⋅): A general feature extraction function capturing motion, appearance, and temporal changes
•
Anomaly Score Estimation
Each feature vector
where:
• f: A general decision function (learned or unsupervised)
• θ: Model parameters’
•
Loss Function (for Training, if Supervised or Semi-Supervised)
where:
• l (⋅): A loss function measuring the difference between predicted score and ground truth
• N: Number of training samples or segments
Parameter Optimization
Parameters are optimized via a general rule:
where:
• η: Learning rate
•
Anomaly Detection Decision
A threshold τ is used to classify predictions as anomaly or normal:
The flow diagram of proposed anomaly detection flow diagram is mentioned is as in Fig. 6. Moreover, a generic Algorithm 3 related to video anomaly detection is also discussed as follows:
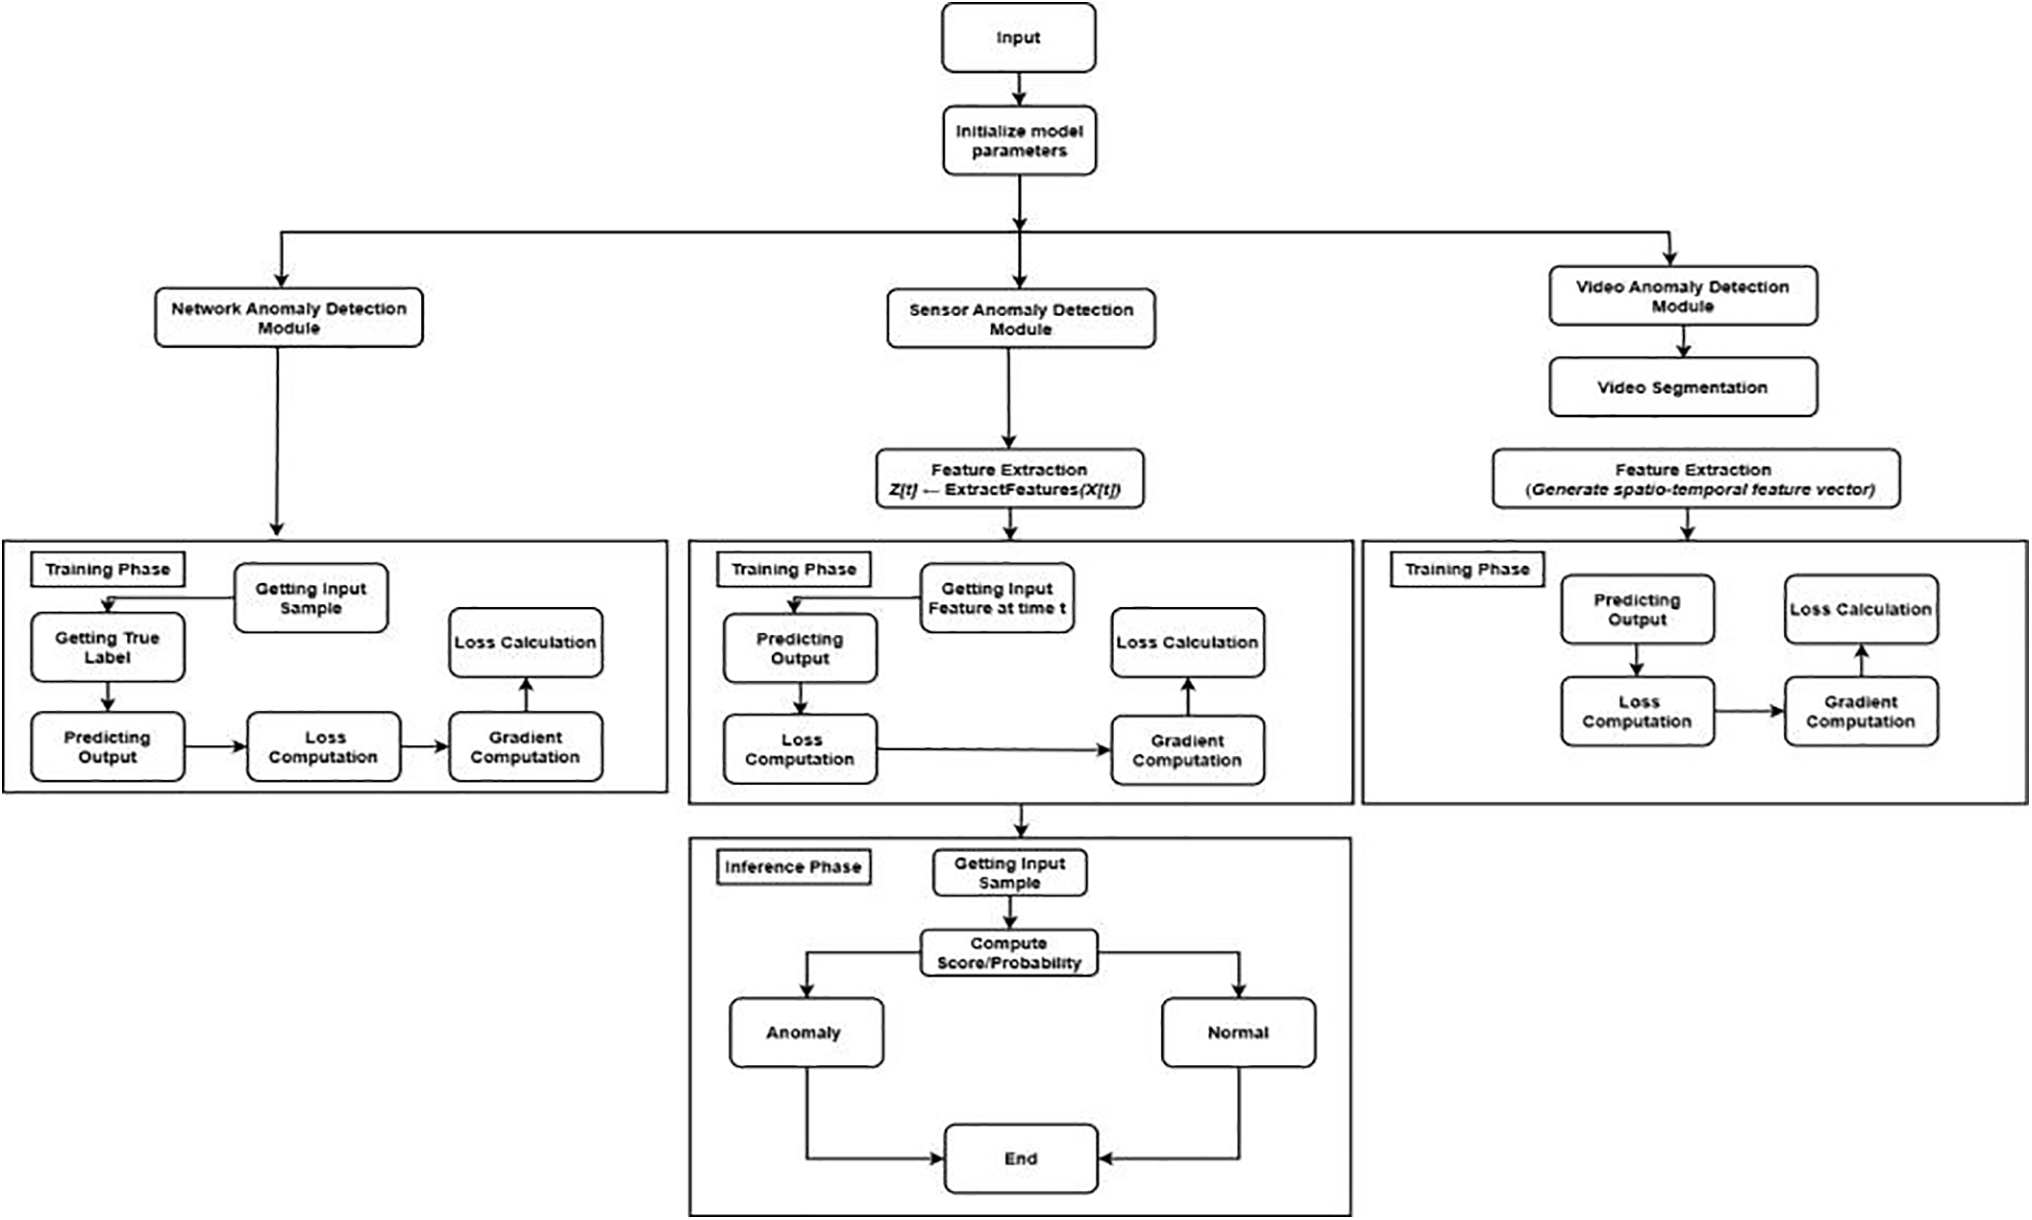
Figure 6: Proposed flow diagram
The visualization and data in Fig. 7 show that there is a distinct dichotomy in the resource demands. Basic algorithms such as the Mean-shift Algorithm (74.83%–76.71% Accuracy) are efficient and hence have the lowest score in Complexity and Computational Cost (Score 1). On the contrary, deep learning-based methods, such as STCNN (79.88% Accuracy) and the ISTL (91.1% Accuracy) of Hu. Fall at the upper end of the resource range (Score 4 in both measures), which is directly correlated with their “high computational needs” and their highly sophisticated character. The Gaussian Mixture Model is what takes an important middle ground in the sense that it can be highly accurate (approximately 90.0%), at respectively moderate cost and complexity (Score 3), and the major drawback of the model is its scalability by its complexity, which makes it more scalable.
Figure 7: Graphical visualizations of performance [28,30,64,65]
Anomaly detection techniques are categorized into three different categories: supervised, semi-supervised, and unsupervised. However, these methods are also used for prediction as well as for behavioral analysis. In supervised learning using the label data for identifying anomalous behavior, it can be implemented on an application for classification and regression [71–75]. Similarly, unsupervised methods are used where data is unlabeled and produced based on assumptions by scoring techniques [31,76,77]. Finally, the Hybrid/Semi-supervised method uses some label data for the available class, but mostly using the unlabeled data [78–80].
The anomaly detection techniques are further categorized based on learning methods, as mentioned above. A brief description of anomaly detection approaches with working mechanisms according to learning methods is given below in Table 5.
Different strategies based on multiple techniques developed so far. Table 6 summarizes these techniques by comparing different anomaly detection algorithms and comparison based on various factors like detection strategy, structure/feature, highlights, and restraint. Thus, this will be helpful for the users in selection of techniques against detection strategies. The Highlights and the restraints are also discussed, which will help check the algorithm efficiency.
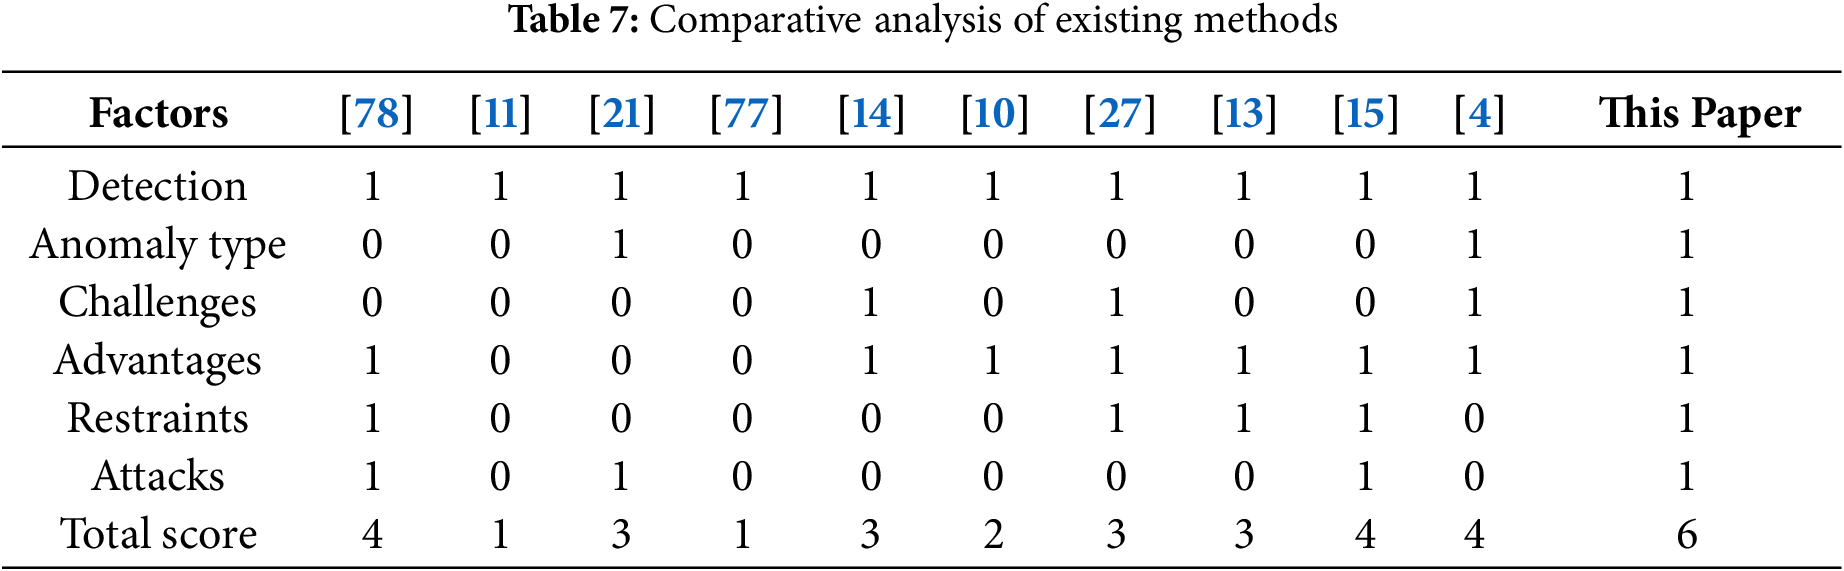
Table 7 describes the comparative analysis that shows that this paper covers most of the factors, while the rest of the papers are limited in factors. Most of the research has not discussed anomaly types, challenges, advantages, and restraints regarding specific techniques. Information about attacks is also not discussed by most of the research. Finally, the total score has been calculated to measure the highest factor rate for computing purposes.
As the above discussion shows, the detection of anomalies has taken a lot of researchers’ interest, so they have proposed several strategies for detecting anomalies. Aside from this, anomaly detection has many challenges, so some of the most stringent challenges are:
Several anomaly detection techniques have been developed, but there are no anomaly detection techniques that properly detect the forwarding attacks in Z1 networks like ClusStream, K-means, and Naive Bayes in an accurate manner. K-means makes assumptions of spherical clusters, and NB makes assumptions of correlated, independent features of forward attacks that are missing. Some of the methods are used, but they cannot show accurate results like selective forwarding periods because there is no suitable communication between the nodes of Z1 networks [123].
7.2 Detection of Multiple Dissimilar Objects
Understanding the motion or appearance of various types of objects in single events is important because anomaly detection works in video after learning the scenes or objects [67,84,98,108,124–129]. An example video trajectory analysis can be effectively employed to track the movement of an individual, but may be constrained in cases where there are many different types of objects that are not connected with each other in the patterns of their motions.
Detection of the right neighborhood for anomaly detection using the neighboring technique is still an issue. A previous method related to anomaly detection only detected the same anomalies, so detecting heterogeneous objects is a challenging task and more complex [130,131]. For example, the Mean Shift Algorithm may overlap nearby clusters; in case an abnormal and normal data point are side by side, they all become incorrectly classified.
Most of the anomaly detection methods are based on the available datasets: anomalies related to ground truth in real scenarios are unavailable, so effectively detecting the anomalies and broadening their form to improve the detection’s performance remains challenging. Similarly, some methods perform efficiently in light conditions rather than dense scenes [130–133].
In General, some of the techniques for anomaly detection are software-based, so integrating these hardware techniques is challenging. These create different issues regarding detecting anomalies like missing the shot, detected image resolution, etc. [134–136].
7.6 Noise and Environmental Variations
There is much variation and noise in real-world scenes because of the enlightenment and a dynamic background [88]. For example, in DRNN, noise sequences stand in the way of model performance since Temporal patterns are confused by Random packet delays.
7.7 Rule Complexity in Machine Learning Techniques
The machine learning models need to be trained before being implemented in a real-world environment. Therefore, these models are rule-based, so if there is an increase in sensor data variables, this will require more rules. Hence, these will also increase the number of rules if they happen [137]. For example, in SVM, nonlinear kernels form complicated decision surfaces, and the number of support vectors is high, which results in a high rule complexity, and the kernel parameters are hard to tune effectively.
8 Discussion for Anomaly Types
The discussion for three types of anomalies, i.e., network-based anomalies, sensor-based anomalies, and video-based anomalies, is precisely discussed to identify their efficient methods, discovered areas, applications, and pros and cons. The first method is network-based, as mentioned in Section A. The analysis of the network-based anomalies is also presented in Table 1. The purpose of the research is to identify the discovered areas, applications, and pros and cons. The prime methods of the researcher are described as follows:
• D’angelo et al. [21] used U-BRAIN for handling the missing data and traffic data and performed feature selection. They claimed higher accuracy in their method, 94.1%, but the detection rate is low compared to reduced-priority clustered probabilistic artificial immune systems and high-dimensional grid trees.
The second type is a sensor-based anomaly in Section B, and its analysis is presented in Table 2. The prime methods of the researcher are described as follows:
• Wahab et al. [31] developed a framework called Smart Cane Assistive Device that is used in navigation for detecting objects or obstacles, but is unable to perform in dry conditions.
• Myridakis et al. [36] used operational anomalies for the cyber-physical network to mitigate anomalies and malware.
The third type is the video-based anomaly discussed in Section B and its analysis presented in Table 3. The prime methods of the researcher are described as follows:
• Li et al. [27] used STIP’s algorithm for feature extraction and classification to detect objects in crowded and uncrowded scenarios.
• Chaudhary et al. [30] used the Gaussian Mixture Model for suspicious events and efficiently worked to detect objects in a complicated situation, dynamic backgrounds, and shadow scenes, and claimed the model’s accuracy was more than 90% but lower than the CNN model.
The major types of anomalies (network, sensor, and video) use learning methods that are classified into three types: supervised, unsupervised, and hybrid/semi-supervised learning methods. The workings and classification of such methods are described in Table 4. A supervised plan identifies anomalous behavior using the label data. The regression technique is applicable in this method, which can be applied by many researchers in their work [8,71–75]. The second learning method uses unlabeled data to produce results [31,76,77]. The third type of learning method uses a hybrid method that requires data (label or un label) according to the condition to identify the anomaly. Furthermore, the analysis of three learning methods for anomaly detection is complex except for their classification. Each type of learning method uses different algorithms according to different scenarios for the detection of anomalies. Moreover, researchers have presented various methods, and their comparison is discussed in Table 5 on their algorithms, strategies, and disadvantages. This research work may also help practitioners and researchers acquaint themselves with improving or enhancing the existing methods and presenting the optimum methods for anomaly detection.
We presented comparative studies with various authors’ work in Table 7. The 0 sign shows the various authors’ research work that has not been seen in their papers. However, anomaly types, challenges, remarks (pros and cons), restraints, and anomalies attached are caught in a few authors’ research work, as shown by one sign in Table 7, and the 0 sign highlights their non-existence in their work.
Network-based anomalies, sensor-based anomalies, and video-based abnormalities are the three key fields that this research cruise explores. An extensive analysis of anomaly detection techniques carried out between 2011 and 2023 is the first step. A variety of innovations, issues, and uses are demonstrated in all perspectives, all of which have an influence on the techniques of detecting anomalies. The utilization of U-BRAIN by D’Angelo et al. [21] is an innovative idea of intelligence when it comes to network-based anomalies. The technique easily handles complicated traffic and missing data, achieving an accuracy of 94.1%. Its inferiority in terms of detection rate is nonetheless highlighted by the intricacy of network anomaly detection by other methods, such as reduced-priority clustered probabilistic artificial immune systems and high-dimensional grid trees.
Wahab et al. [31] investigated sensor-based anomalies, and they revealed a notable development in visually impaired navigation: the Smart Cane Assistive Device. It can identify barriers rather well, but there are problems when it’s dry; therefore, it has to be improved even more. Myridakis et al.’s [36] emphasis on operational anomalies in cyber-physical networks draws attention to the variety of applications possible and underscores the need for adaptable solutions for a range of situations.
In the intriguing field of video-based anomaly detection, Li et al. [27] employed the Spatio-Temporal Interest Points (STIP) approach for feature extraction and classification. This method is versatile enough to be used in surveillance settings since it does a decent job of recognizing objects in both crowded and uncrowded areas. Though with somewhat lower accuracy than CNN models, Chaudhary et al. have effectively recognized suspicious events by using the Gaussian Mixture Model (GMM) for complex situations, changing backgrounds, and poorly illuminated sceneries. The research goes further into the subtle differences between supervised, unsupervised, and hybrid/semi-supervised learning strategies. Each classification introduces a variety of methods and strategies tailored to certain circumstances. Furthermore, a generic algorithm is also proposed in each category for the implementation as well as the detection of a specific type of anomaly. This will ease the reader’s understanding of the work programmatically. Comparison of other writers’ works, which emphasizes the existence or absence of anomaly types, challenges, and observations in their research, further enriches the tale.
At the end of the study, this conclusion serves as a call to action as well as a point of closure. It is encouraged for researchers and practitioners to make new contributions to the ongoing advancement of anomaly detection by improving existing methods and developing novel approaches to tackle novel problems. Every anomaly discovered during this investigation is a component of the puzzle that comes together to construct a more secure and resilient future, one that is produced by everyone’s joint efforts to advance anomaly detection methods.
Acknowledgement: This research has been supported by Princess Nourah bint Abdulrahman University.
Funding Statement: This research has been supported by Princess Nourah bint Abdulrahman University. Researchers Supporting Project number (PNURSP2025R909), Princess Nourah bint Abdulrahman University, Riyadh, Saudi Arabia.
Author Contributions: Study conception, Design, Conceptualization, Data curation, Writing—original draft, Methodology: Hafiz Burhan Ul Haq; Supervision, Methodology, Writing—original draft, Writing—review & editing: Haroon ur Rashid Kayani; Resources, Software: Waseem Akram; Validation, Visualization, Draft manuscript preparation: Khalid Mahmood; Investigation, Supervision, Writing—original draft, Writing—review & editing: Chihhsiong Shih; Formal and informal analysis: Rupak Kharel and Amina Salhi. All authors reviewed the results and approved the final version of the manuscript.
Availability of Data and Materials: Not applicable, as this is a narrative review based on existing literature.
Ethic Approval: Not Applicable.
Conflicts of Interest: The authors declare no conflicts of interest to report regarding the present study.
References
1. Yetis R, Sahingoz OK. Blockchain based secure communication for IoT devices in smart cities. In: Proceedings of the 2019 7th International Istanbul Smart Grids and Cities Congress and Fair (ICSG); 2019 Apr 25–26; Istanbul, Turkey. p. 134–8. doi:10.1109/SGCF.2019.8782285. [Google Scholar] [CrossRef]
2. Jyothi V, Krishna MG, Raveendranadh B, Rupalin D. IoT based smart home system technologies. Int J Eng Res Dev. 2017;13(2):31–7. [Google Scholar]
3. Alkandari A, Alnasheet M, Alshekhly IFT. Smart cities: survey. J Adv Comput Sci Technol Res. 2012;2(2):79–90. [Google Scholar]
4. Chalapathy R, Chawla S. Deep learning for anomaly detection: a survey. arXiv:1901.03407. 2019. [Google Scholar]
5. Agyemang EF. Anomaly detection using unsupervised machine learning algorithms: a simulation study. Sci Afr. 2024;26:e02386. doi:10.1016/j.sciaf.2024.e02386. [Google Scholar] [CrossRef]
6. Aggarwal CC. An introduction to outlier analysis. In: Outlier analysis. Berlin/Heidelberg, Germany: Springer; 2013. p. 1–40 doi: 10.1007/978-1-4614-6396-2_1. [Google Scholar] [CrossRef]
7. Chilipirea C, Petre AC, Groza LM, Dobre C, Pop F. An integrated architecture for future studies in data processing for smart cities. Microprocess Microsyst. 2017;52(1):335–42. doi:10.1016/j.micpro.2017.03.004. [Google Scholar] [CrossRef]
8. Kumaran SK, Dogra DP, Roy PP. Anomaly detection in road traffic using visual surveillance: a survey. arXiv:1901.08292. 2019. [Google Scholar]
9. Mabrouk AB, Zagrouba E. Abnormal behavior recognition for intelligent video surveillance systems: a review. Expert Syst Appl. 2018;91:480–91. doi:10.1016/j.eswa.2017.09.029. [Google Scholar] [CrossRef]
10. Shirazi MS, Morris BT. Looking at intersections: a survey of intersection monitoring, behavior and safety analysis of recent studies. IEEE Trans Intell Transp Syst. 2017;18(1):4–24. doi:10.1109/tits.2016.2568920. [Google Scholar] [CrossRef]
11. Sivaraman S, Trivedi MM. Looking at vehicles on the road: a survey of vision-based vehicle detection, tracking, and behavior analysis. IEEE Trans Intell Transp Syst. 2013;14(4):1773–95. doi:10.1109/tits.2013.2266661. [Google Scholar] [CrossRef]
12. Sodemann AA, Ross MP, Borghetti BJ. A review of anomaly detection in automated surveillance. IEEE Trans Syst Man Cybern C Appl Rev. 2012;42(6):1257–72. doi:10.1109/tsmcc.2012.2215319. [Google Scholar] [CrossRef]
13. Brun O, Yin Y, Gelenbe E. Deep learning with dense random neural network for detecting attacks against IoT-connected home environments. Procedia Comput Sci. 2018;134:458–63. doi:10.1016/j.procs.2018.07.183. [Google Scholar] [CrossRef]
14. Ukil A, Bandyoapdhyay S, Puri C, Pal A. IoT healthcare analytics: the importance of anomaly detection. In: Proceedings of the 2016 IEEE 30th International Conference on Advanced Information Networking and Applications (AINA); 2016 Mar 23–25; Crans-Montana, Switzerland. p. 994–7. [Google Scholar]
15. Anthi E, Williams L, Burnap P. Pulse: an adaptive intrusion detection for the Internet of Things. In: Proceedings of the Living in the Internet of Things: Cybersecurity of the IoT-2018; 2018 Mar 21–22; London, UK. p. 1–4. doi:10.1049/cp.2018.0035. [Google Scholar] [CrossRef]
16. Pajouh HH, Javidan R, Khayami R, Dehghantanha A, Choo KKR. A two-layer dimension reduction and two-tier classification model for anomaly-based intrusion detection in IoT backbone networks. IEEE Trans Emerg Top Comput. 2019;7(2):314–23. doi:10.1109/TETC.2016.2633228. [Google Scholar] [CrossRef]
17. Feng J, Liang Y, Li L. Anomaly detection in videos using two-stream autoencoder with post hoc interpretability. Comput Intell Neurosci. 2021;2021:7367870. doi:10.1155/2021/7367870. [Google Scholar] [PubMed] [CrossRef]
18. Ren J, Xia F, Liu Y, Lee I. Deep video anomaly detection: opportunities and challenges. In: Proceedings of the 2021 International Conference on Data Mining Workshops (ICDMW); 2021 Dec 7–10; Auckland, New Zealand. p. 959–66. [Google Scholar]
19. Li X, Ghodosi H, Chen C, Sankupellay M, Lee I. Improving network-based anomaly detection in smart home environment. Sensors. 2022;22(15):5626. doi:10.3390/s22155626. [Google Scholar] [PubMed] [CrossRef]
20. Trevino A. Introduction to K-Means Clustering, Oracle. 2025 [cited 2024 Jan 1]. Available from: https://blogs.oracle.com/ai-and-datascience/introduction-to-k-means-clustering. [Google Scholar]
21. D’Angelo G, Palmieri F, Ficco M, Rampone S. An uncertainty-managing batch relevance-based approach to network anomaly detection. Appl Soft Comput. 2015;36:408–18. doi:10.1016/j.asoc.2015.07.029. [Google Scholar] [CrossRef]
22. Buch N, Velastin SA, Orwell J. A review of computer vision techniques for the analysis of urban traffic. IEEE Trans Intell Transp Syst. 2011;12(3):920–39. doi:10.1109/tits.2011.2119372. [Google Scholar] [CrossRef]
23. Diro AA, Chilamkurti N. Distributed attack detection scheme using deep learning approach for Internet of Things. Future Gener Comput Syst. 2018;82:761–8. doi:10.1016/j.future.2017.08.043. [Google Scholar] [CrossRef]
24. Safdari H, De Bacco C. Anomaly detection and community detection in networks. arXiv:2205.06012. 2022. [Google Scholar]
25. Bhuyan MH, Bhattacharyya DK, Kalita JK. Network anomaly detection: methods, systems and tools. IEEE Commun Surv Tutorials. 2014;16(1):303–36. doi:10.1109/surv.2013.052213.00046. [Google Scholar] [CrossRef]
26. Wang Y. An improved Clustream clustering algorithm for anomaly detection in electric power big data. Int J Eng Intell Syst. 2022;30(3). [Google Scholar]
27. Li Y, Xia R, Huang Q, Xie W, Li X. Survey of spatio-temporal interest point detection algorithms in video. IEEE Access. 2017;5:10323–31. doi:10.1109/access.2017.2712789. [Google Scholar] [CrossRef]
28. Del Giorno A, Hu H, Rhinehart N. 16-831 final report: online anomaly detection in videos. 2014. [Google Scholar]
29. Singh P, Pankajakshan V. A deep learning based technique for anomaly detection in surveillance videos. In: Proceedings of the 2018 Twenty Fourth National Conference on Communications (NCC); 2018 Feb 25–28; Hyderabad. p. 1–6. [Google Scholar]
30. Chaudhary S, Khan MA, Bhatnagar C. Multiple anomalous activity detection in videos. Procedia Comput Sci. 2018;125:336–45. doi:10.1016/j.procs.2017.12.045. [Google Scholar] [CrossRef]
31. Wahab MHA, Talib AA, Kadir HA, Johari A, Noraziah A, Sidek RM, et al. Smart cane: assistive cane for visually impaired people. arXiv:1110.5156. 2011. [Google Scholar]
32. Brilhault A, Kammoun S, Gutierrez O, Truillet P, Jouffrais C. Fusion of artificial vision and GPS to improve blind pedestrian positioning. In: Proceedings of the 2011 4th IFIP International Conference on New Technologies, Mobility and Security; 2011 Feb 7–10; Paris, France. p. 1–5. [Google Scholar]
33. Borges PVK, Conci N, Cavallaro A. Video-based human behavior understanding: a survey. IEEE Trans Circuits Syst Video Technol. 2013;23:1993–2008. doi:10.1109/tcsvt.2013.2270402. [Google Scholar] [CrossRef]
34. Dunai L, Garcia BD, Lengua I, Peris Fajarnés G. 3D CMOS sensor based acoustic object detection and navigation system for blind people. In: Proceedings of the IECON 2012—38th Annual Conference on IEEE Industrial Electronics Society; 2012 Oct 25–28; Montreal, QC, Canada. p. 4208–15. [Google Scholar]
35. Bosman HH, Iacca G, Tejada A, Wörtche HJ, Liotta A. Spatial anomaly detection in sensor networks using neighborhood information. Inf Fusion. 2017;33:41–56. doi:10.1016/j.inffus.2016.04.007. [Google Scholar] [CrossRef]
36. Myridakis D, Spathoulas G, Kakarountas A. Supply current monitoring for anomaly detection on IoT devices. In: Proceedings of the 21st Pan-Hellenic Conference on Informatics; 2017 Sep 28–30; Larissa, Greece. p. 1–2. [Google Scholar]
37. Rudy Cahyadi HP, Fadlil J. Video anomaly detection using selective spatio-temporal interest points and convolutional sparse coding. In: Proceedings of the 2015 IEEE/WIC/ACM International Conference on Web Intelligence and Intelligent Agent Technology (WI-IAT); 2015 Dec 6–9; Singapore. [Google Scholar]
38. Davis N, Raina G, Jagannathan K. A framework for end-to-end deep learning-based anomaly detection in transportation networks. Transp Res Interdiscip Perspect. 2020;5:100112. doi:10.1016/j.trip.2020.100112. [Google Scholar] [CrossRef]
39. Liu L, Lin J, Wang P, Liu L, Zhou R. Deep learning-based network security data sampling and anomaly prediction in future network. Discrete Dyn Nat Soc. 2020;2020:4163825. doi:10.1155/2020/4163825. [Google Scholar] [CrossRef]
40. Dutta V, Choraś M, Pawlicki M, Kozik R. A deep learning ensemble for network anomaly and cyber-attack detection. Sensors. 2020;20(16):4583. doi:10.3390/s20164583. [Google Scholar] [PubMed] [CrossRef]
41. Ripan RC, Sarker IH, Hossain SM, Anwar M, Nowrozy R, Hoque MM, et al. A data-driven heart disease prediction model through K-means clustering-based anomaly detection. SN Comput Sci. 2021;2(2):1–12. doi:10.1007/s42979-021-00518-7. [Google Scholar] [CrossRef]
42. Shouman M, Turner T, Stocker R. Integrating Naive Bayes and K-means clustering with different initial centroid selection methods in the diagnosis of heart disease patients. CS IT-CSCP. 2012;2:125–37. [Google Scholar]
43. Ramana BV, Babu MSP, Venkateswarlu NB. A critical evaluation of Bayesian classifier for liver diagnosis using bagging and boosting methods. Int J Eng Sci Technol. 2011;3(4):2561–5. [Google Scholar]
44. Chapple MJ, Chawla N, Striegel A. Authentication anomaly detection: a case study on a virtual private network. In: Proceedings of the 3rd Annual ACM Workshop on Mining Network Data; 2007 Jun 12; San Diego, CA, USA. p. 17–22. [Google Scholar]
45. Lagido RB, Lobo J, Leite S, Sousa C, Ferreira L, Silva-Cardoso J. Using the smartphone camera to monitor heart rate and rhythm in heart failure patients. In: Proceedings of the IEEE-EMBS International Conference on Biomedical and Health Informatics (BHI); 2014 Jun 1–4; Valencia, Spain. p. 556–9. [Google Scholar]
46. Salem O, Liu Y, Mehaoua A, Boutaba R. Online anomaly detection in wireless body area networks for reliable healthcare monitoring. IEEE J Biomed Health Inform. 2014;18(5):1541–51. doi:10.1109/jbhi.2014.2312214. [Google Scholar] [PubMed] [CrossRef]
47. Ukil A, Bandyopadhyay S, Puri C, Singh R, Pal A. Effective noise removal and unified model of hybrid feature space optimization for automated cardiac anomaly detection using phonocardiogram signals. In: Proceedings of the 2018 IEEE International Conference on Acoustics, Speech and Signal Processing (ICASSP); 2018 Apr 15–20; Calgary, AB, Canada. p. 866–70. [Google Scholar]
48. Nandini AV, Dwivedi A, Kumar NA, Ashwin TS, Vishnuvardhan V, Guddeti RMR. Smart cane for assisting visually impaired people. In: Proceedings of the TENCON 2019—2019 IEEE Region 10 Conference (TENCON); 2019 Oct 17–20; Kochi, India. p. 546–51. [Google Scholar]
49. Mutiara GA, Hapsari GI, Rijalul R. Smart guide extension for blind cane. In: Proceedings of the 2016 4th International Conference on Information and Communication Technology (ICoICT); 2016 May 25–27; Bandung, Indonesia. p. 1–6. [Google Scholar]
50. Saaid MF, Mohammad AM, Ali MM. Smart cane with range notification for blind people. In: Proceedings of the 2016 IEEE International Conference on Automatic Control and Intelligent Systems (I2CACIS); 2016 Oct 22; Selangor, Malaysia. p. 225–9. [Google Scholar]
51. Hasan M, Islam MM, Zarif MII, Hashem MMA. Attack and anomaly detection in IoT sensors in IoT sites using machine learning approaches. Internet Things. 2019;7:100059. doi:10.1016/j.iot.2019.100059. [Google Scholar] [CrossRef]
52. Arshad MH, Bilal M, Gani A. Human activity recognition: review, taxonomy and open challenges. Sensors. 2022;22(17):6463. doi:10.3390/s22176463. [Google Scholar] [PubMed] [CrossRef]
53. Lai Y, Liu Z, Song Z, Wang Y, Gao Y. Anomaly detection in industrial autonomous decentralized system based on time series. Simul Model Pract Theory. 2016;65:57–71. doi:10.1016/j.simpat.2016.01.013. [Google Scholar] [CrossRef]
54. Zhang J, Xie Y, Liao Z, Pang G, Verjans J, Li W, et al. Viral pneumonia screening on chest x-ray images using confidence-aware anomaly detection. arXiv:2003.12338. 2020. [Google Scholar]
55. Ahuja S, Panigrahi BK, Dey N, Rajinikanth V, Gandhi TK. Deep transfer learning-based automated detection of COVID-19 from lung CT scan slices. Appl Intell. 2021;51(1):571–85. doi:10.36227/techrxiv.12334265.v1. [Google Scholar] [CrossRef]
56. Yoo SH, Geng H, Chiu TL, Yu SK, Cho DC, Heo J, et al. Deep learning-based decision-tree classifier for COVID-19 diagnosis from chest X-ray imaging. Front Med. 2020;7:427. doi:10.3389/fmed.2020.00427. [Google Scholar] [PubMed] [CrossRef]
57. 10 Real World Applications of Internet of Things (IoT)—explained in videos. Analytics Vidhya. 2023 [cited 2024 Jan 1]. Available from: https://www.analyticsvidhya.com/blog/2016/08/10-youtube-videos-explaining-the-real-world-applications-of-internet-of-things-iot/. [Google Scholar]
58. Behera S, Rani R. Comparative analysis of density based outlier detection techniques on breast cancer data using Hadoop and MapReduce. In: Proceedings of the 2016 International Conference on Inventive Computation Technologies (ICICT); 2016 Aug 26–27; Coimbatore, India. p. 1–4. [Google Scholar]
59. Algur SP, Bhat P. Abnormal web video detection using density based LOF method. Int J Comput Sci Eng. 2016;4:6–14. [Google Scholar]
60. Yang M, Rajasegarar S, Erfani SM, Leckie C. Deep learning and one-class SVM based anomalous crowd detection. In: Proceedings of the 2019 International Joint Conference on Neural Networks (IJCNN); 2019 Jul 14–19; Budapest, Hungary. p. 1–8. [Google Scholar]
61. Batapati P, Tran D, Sheng W, Liu M, Zeng R. Video analysis for traffic anomaly detection using support vector machines. In: Proceedings of the 11th World Congress on Intelligent Control and Automation; 2014 Jun 29–Jul 4; Shenyang, China. p. 5500–5. [Google Scholar]
62. Nguyen VK, Renault E, Milocco R. Environment monitoring for anomaly detection system using smartphones. Sensors. 2019;19(18):3834. doi:10.3390/s19183834. [Google Scholar] [PubMed] [CrossRef]
63. Das D, Mishra D. Unsupervised anomalous trajectory detection for crowded scenes. In: Proceedings of the 2018 IEEE 13th International Conference on Industrial and Information Systems (ICIIS); 2018 Dec 1–2; Rupnagar, India. p. 27–31. [Google Scholar]
64. Hu Y. Design and implementation of abnormal behavior detection based on deep intelligent analysis algorithms in massive video surveillance. J Grid Comput. 2020;18(2):227–37. doi:10.1007/s10723-020-09506-2. [Google Scholar] [CrossRef]
65. Nawaratne R, Alahakoon D, De Silva D, Yu X. Spatiotemporal anomaly detection using deep learning for real-time video surveillance. IEEE Trans Ind Informatics. 2019;16(1):393–402. doi:10.1109/tii.2019.2938527. [Google Scholar] [CrossRef]
66. Revathi AR, Kumar D. An efficient system for anomaly detection using deep learning classifier. Signal Image Video Process. 2017;11(2):291–9. doi:10.1007/s11760-016-0935-0. [Google Scholar] [CrossRef]
67. Sultani W, Chen C, Shah M. Real-world anomaly detection in surveillance videos. In: Proceedings of the IEEE Conference on Computer Vision and Pattern Recognition; 2018 Jun 18–23; Salt Lake City, UT, USA. p. 6479–88. [Google Scholar]
68. Li Q, Li W. A novel framework for anomaly detection in video surveillance using multi-feature extraction. In: Proceedings of the 2016 9th International Symposium on Computational Intelligence and Design (ISCID); 2016 Dec 10–11; Hangzhou, China. Vol. 1, p. 455–9. [Google Scholar]
69. Patel CI, Patel R. Gaussian mixture model based moving object detection from video sequence. In: Proceedings of the International Conference & Workshop on Emerging Trends in Technology; 2011 Feb 25–26; Mumbai, Maharashtra, India. p. 698–702. [Google Scholar]
70. Ullah H, Tenuti L, Conci N. Gaussian mixtures for anomaly detection in crowded scenes. Video Surveill Transp Imaging Appl. 2013;8663:866303. [Google Scholar]
71. Goernitz N, Kloft M, Rieck K, Brefeld U. Toward supervised anomaly detection. J Artif Intell Res. 2013;46:235–62. doi:10.1613/jair.3623. [Google Scholar] [CrossRef]
72. Ji S, Xu W, Yang M, Yu K. 3D convolutional neural networks for human action recognition. IEEE Trans Pattern Anal Mach Intell. 2012;35(1):221–31. doi:10.1109/tpami.2012.59. [Google Scholar] [PubMed] [CrossRef]
73. Kamijo S, Matsushita Y, Ikeuchi K, Sakauchi M. Traffic monitoring and accident detection at intersections. IEEE Trans Intell Transp Syst. 2000;1(2):108–18. doi:10.1109/6979.880968. [Google Scholar] [CrossRef]
74. Karpathy A, Toderici G, Shetty S, Leung T, Sukthankar R, Fei-Fei L. Large-scale video classification with convolutional neural networks. In: Proceedings of the IEEE Conference on Computer Vision and Pattern Recognition; 2014 Jun 23–28; Columbus, OH, USA. p. 1725–32. [Google Scholar]
75. Simonyan K, Zisserman A. Very deep convolutional networks for large-scale image recognition. arXiv:1409.1556. 2014. [Google Scholar]
76. Goldstein M, Uchida S. A comparative evaluation of unsupervised anomaly detection algorithms for multivariate data. PLoS One. 2016;11(4):152173. doi:10.1371/journal.pone.0152173. [Google Scholar] [PubMed] [CrossRef]
77. Srivastava N, Mansimov E, Salakhudinov R. Unsupervised learning of video representations using LSTMs. In: Proceedings of the International Conference on Machine Learning; 2015 Jul 6–Jul 11; Lille, France. p. 843–52. [Google Scholar]
78. Kuusela M, Vatanen T, Malmi E, Raiko T, Aaltonen T, Nagai Y. Semi-supervised anomaly detection towards model-independent searches of new physics. J Phys Conf Ser. 2012;368:012032. doi:10.1088/1742-6596/368/1/012032. [Google Scholar] [CrossRef]
79. Liu P, Yang P, Wang C, Huang K, Tan T. A semi-supervised method for surveillance-based visual location recognition. IEEE Trans Cybern. 2016;47(11):3719–32. doi:10.1109/tcyb.2016.2578639. [Google Scholar] [PubMed] [CrossRef]
80. Sun M, Hao S, Liu G. Semi-supervised vehicle classification via fusing affinity matrices. Signal Process. 2018;149:118–23. doi:10.1016/j.sigpro.2018.03.006. [Google Scholar] [CrossRef]
81. Khan SW, Hafeez Q, Khalid MI, Alroobaea R, Hussain S, Iqbal J, et al. Anomaly detection in traffic surveillance videos using deep learning. Sensors. 2022;22(17):6563. doi:10.3390/s22176563. [Google Scholar] [PubMed] [CrossRef]
82. Luo W, Liu W, Gao S. Remembering history with convolutional LSTM for anomaly detection. In: Proceedings of the 2017 IEEE International Conference on Multimedia and Expo (ICME); 2017 Jul 10–14; Hong Kong, China. p. 439–44. [Google Scholar]
83. Luo W, Liu W, Gao S. A revisit of sparse coding based anomaly detection in stacked RNN framework. In: Proceedings of the IEEE International Conference on Computer Vision; 2017 Oct 22–29; Venice, Italy. p. 341–9. [Google Scholar]
84. Medel JR, Savakis A. Anomaly detection in video using predictive convolutional long short-term memory networks. arXiv:1612.00390. 2016. [Google Scholar]
85. Lee S, Kim HG, Ro YM. STAN: spatio-temporal adversarial networks for abnormal event detection. In: Proceedings of the 2018 IEEE International Conference on Acoustics, Speech and Signal Processing (ICASSP); 2018 Apr 15–20; Calgary, AB, Canada. p. 1323–7. doi:10.1109/ICASSP.2018.8462388. [Google Scholar] [CrossRef]
86. Sabokrou M, Fayyaz M, Fathy M, Moayed Z, Klette R. Deep-anomaly: fully convolutional neural network for fast anomaly detection in crowded scenes. Comput Vis Image Underst. 2018;172:88–97. doi:10.1016/j.cviu.2018.02.006. [Google Scholar] [CrossRef]
87. Vu H. Deep abnormality detection in video data. Int Jt Conf Artif Intell. 2017;2:3. [Google Scholar]
88. Yang W, Gao Y, Cao L. TRASMIL: a local anomaly detection framework based on trajectory segmentation and multi-instance learning. Comput Vis Image Underst. 2013;117(10):1273–86. doi:10.1016/j.cviu.2012.08.010. [Google Scholar] [CrossRef]
89. Quellec G, Lamard M, Cozic M, Coatrieux G, Cazuguel G. Multiple-instance learning for anomaly detection in digital mammography. IEEE Trans Med Imaging. 2016;35(7):1604–14. doi:10.1109/tmi.2016.2521442. [Google Scholar] [PubMed] [CrossRef]
90. Henrio J, Nakashima T. Anomaly detection in videos recorded by drones in a surveillance context. In: Proceedings of the 2018 IEEE International Conference on Systems, Man, and Cybernetics (SMC); 2018 Oct 7–10; Miyazaki, Japan. p. 2503–8. [Google Scholar]
91. Li F, Yang W, Liao Q. An efficient anomaly detection approach in surveillance video based on oriented GMM. In: Proceedings of the IEEE International Conference on Acoustics, Speech and Signal Processing (ICASSP); 2016 Mar 20–25; Shanghai, China. p. 1981–5. [Google Scholar]
92. Li Y, Liu W, Huang Q. Traffic anomaly detection based on image descriptor in videos. Multimed Tools Appl. 2016;75(5):2487–505. doi:10.1007/s11042-015-2637-y. [Google Scholar] [CrossRef]
93. Wen J, Lai Z, Ming Z, Wong WK, Zhong Z. Directional Gaussian model for automatic speeding event detection. IEEE Trans Inf Forensics Secur. 2017;12(10):2292–307. doi:10.1109/tifs.2017.2705623. [Google Scholar] [CrossRef]
94. Ribeiro M, Lazzaretti AE, Lopes HS. A study of deep convolutional auto-encoders for anomaly detection in videos. Pattern Recogn Lett. 2018;105:13–22. doi:10.1016/j.patrec.2017.07.016. [Google Scholar] [CrossRef]
95. Ghrab NB, Fendri E, Hammami M. Abnormal events detection based on trajectory clustering. In: Proceedings of the 2016 13th International Conference on Computer Graphics, Imaging and Visualization (CGiV); 2016 Mar 29–Apr 1; Beni Mellal, Morocco. p. 301–6. [Google Scholar]
96. Ranjith R, Athanesious JJ, Vaidehi V. Anomaly detection using DBSCAN clustering technique for traffic video surveillance. In: Proceedings of the Seventh International Conference on Advanced Computing (ICoAC); 2015 Dec 15–17; Chennai, India. p. 1–6. [Google Scholar]
97. Patcha A, Park JM. An overview of anomaly detection techniques: existing solutions and latest technological trends. Comput Netw. 2007;51(12):3448–70. doi:10.1016/j.comnet.2007.02.001. [Google Scholar] [CrossRef]
98. .심은찬. Disentangled sticky hierarchical dirichlet process hidden markov model for statistical anomaly detection [dissertation]. Seoul, Republic of Korea: Hanyang University; 2023 [cited 2024 Jan 1]. Available from: https://repository.hanyang.ac.kr/handle/20.500.11754/187139. [Google Scholar]
99. Mumtaz K, Duraiswamy K. A novel density based improved k-means clustering algorithm-Dbkmeans. Int J Comput Sci Eng. 2010;2(2):213–8. [Google Scholar]
100. K-Means vs KNN in Machine Learning [Online]. 2019 [cited 2025 Jan 1]. Available from: http://abhijitannaldas.com/ml/kmeans-vs-knn-in-machine-learning.html. [Google Scholar]
101. Dhiraj S. Difference between k-Nearest Neighbor (KNN) and k-Means Clustering [Online]; 2019 [cited 2024 Jan 1]. Available from: https://medium.com/@dhiraj8899/difference-between-k-nearest-neighbor-k-nn-and-k-means-clustering-d9a44859182f. [Google Scholar]
102. Fawzy A, Mokhtar HM, Hegazy O. Outliers detection and classification in wireless sensor networks. Egyptian Informatics J. 2013;14(2):157–64. doi:10.1016/j.eij.2013.06.001. [Google Scholar] [CrossRef]
103. Parwez MS, Rawat DB, Garuba M. Big data analytics for user-activity analysis and user-anomaly detection in mobile wireless network. IEEE Trans Ind Informatics. 2017;13(4):2058–65. doi:10.1109/tii.2017.2650206. [Google Scholar] [CrossRef]
104. Thang TM, Kim J. The anomaly detection by using DBSCAN clustering with multiple parameters. In: Proceedings of the 2011 International Conference on Information Science and Applications; 2011 Apr 26–29; Jeju Island, Republic of Korea. p. 1–5. [Google Scholar]
105. Topology- and density-based clustering [Online]. 2019 [cited 2025 Jan 1]. Available from: https://blog.dominodatalab.com/topology-and-density-based-clustering/. [Google Scholar]
106. Nguyen HX, Roughan M. Multi-observer privacy-preserving hidden Markov models. IEEE Trans Signal Process. 2013;61(23):6010–9. doi:10.1109/tsp.2013.2282911. [Google Scholar] [CrossRef]
107. Biswas S, Babu RV. Short local trajectory based moving anomaly detection. In: Proceedings of the 2014 Indian Conference on Computer Vision, Graphics and Image Processing; 2014 Dec 14–18; Bangalore, India. p. 1–8. [Google Scholar]
108. Zhu C, Sheng W, Liu M. Wearable sensor-based behavioral anomaly detection in smart assisted living systems. IEEE Trans Autom Sci Eng. 2015;12(4):1225–34. doi:10.1109/tase.2015.2474743. [Google Scholar] [CrossRef]
109. Kumarage H, Khalil I, Tari Z. Granular evaluation of anomalies in wireless sensor networks using dynamic data partitioning with an entropy criterion. IEEE Trans Comput. 2014;64(9):2573–85. doi:10.1109/tc.2014.2366755. [Google Scholar] [CrossRef]
110. Hamdi S, Bouindour S, Loukil K, Snoussi H, Abid M. Hybrid deep learning and HOF for anomaly detection. In: Proceedings of the 2019 6th International Conference on Control, Decision and Information Technologies (CoDIT); 2019 Apr 23–26; Paris, France. p. 575–80. [Google Scholar]
111. Ahlmark DI, Fredriksson H, Hyyppä K. Obstacle avoidance using haptics and a laser rangefinder. In: Proceedings of the IEEE Workshop on Advanced Robotics and its Social Impacts; 2013 Nov 7–9; Tokyo, Japan. p. 76–81. [Google Scholar]
112. García AR, Fonseca R, Durán A. Electronic long cane for locomotion improving on visually impaired people: a case study. In: Proceedings of the 2011 Pan American Health Care Exchanges; 2011 Mar 28–Apr 1; Rio de Janeiro, Brazil. p. 58–61. [Google Scholar]
113. Mocanu B, Tapu R, Zaharia T. When ultrasonic sensors and computer vision join forces for efficient obstacle detection and recognition. Sensors. 2016;16(11):1807. doi:10.3390/s16111807. [Google Scholar] [PubMed] [CrossRef]
114. Kaltsa V, Briassouli A, Kompatsiaris I, Hadjileontiadis LJ, Strintzis MG. Swarm intelligence for detecting interesting events in crowded environments. IEEE Trans Image Process. 2015;24(7):2153–66. doi:10.1109/tip.2015.2409559. [Google Scholar] [PubMed] [CrossRef]
115. Bosman HH, Iacca G, Tejada A, Wörtche HJ, Liotta A. Ensembles of incremental learners to detect anomalies in ad hocsensor networks. Ad Hoc Netw. 2015;35:14–36. doi:10.1016/j.adhoc.2015.07.013. [Google Scholar] [CrossRef]
116. Lin W, Zhou Y, Xu H, Yan J, Xu M, Wu J, et al. A tube-and-droplet-based approach for representing and analyzing motion trajectories. IEEE Trans Pattern Anal Mach Intell. 2016;39(8):1489–503. doi:10.1109/tpami.2016.2608884. [Google Scholar] [PubMed] [CrossRef]
117. Giannakeris P, Kaltsa V, Avgerinakis K, Briassouli A, Vrochidis S, Kompatsiaris I. Speed estimation and abnormality detection from surveillance cameras. In: Proceedings of the IEEE Conference on Computer Vision and Pattern Recognition Workshops; 2018 Jun 18–22; Salt Lake City, UT, USA. p. 93–9. [Google Scholar]
118. Kaltsa V, Briassouli A, Kompatsiaris I, Strintzis MG. Swarm-based motion features for anomaly detection in crowds. In: Proceedings of the 2014 IEEE International Conference on Image Processing (ICIP); 2014 Oct 27–30; Paris, France. p. 2353–7. [Google Scholar]
119. Gao H, Xin R, Chen P, Li X, Lu N, You P. Memory-augment graph transformer based unsupervised detection model for identifying performance anomalies in highly-dynamic cloud environments. J Cloud Comput. 2025;14(1):40. doi:10.1186/s13677-025-00766-5. [Google Scholar] [CrossRef]
120. Abbas Y, Alarfaj AA, Alabdulqader EA, Algarni A, Jalal A, Liu H. Drone-based public surveillance using 3D point clouds and neuro-fuzzy classifier. Comput Mater Continua. 2025;82(3):4759–76. doi:10.32604/cmc.2025.059224. [Google Scholar] [CrossRef]
121. Huang C, Gao C, Li M, Li Y, Wang X, Jiang Y, et al. Correlation information enhanced graph anomaly detection via hypergraph transformation. IEEE Trans Cybern. 2025;55:2865–78. doi:10.1109/tcyb.2025.3558941. [Google Scholar] [PubMed] [CrossRef]
122. Qureshi A, Butt A, Alazeb A, Mudawi N, Alonazi M, Almujally N, et al. Semantic segmentation and YOLO detector over aerial vehicle images. Comput Mater Continua. 2024;80(2):3315–32. doi:10.32604/cmc.2024.052582. [Google Scholar] [CrossRef]
123. Garcia-Font V, Garrigues C, Rifà-Pous H. Difficulties and challenges of anomaly detection in smart cities: a laboratory analysis. Sensors. 2018;18(10):3198. doi:10.3390/s18103198. [Google Scholar] [PubMed] [CrossRef]
124. Cheng KW, Chen YT, Fang WH. Gaussian process regression-based video anomaly detection and localization with hierarchical feature representation. IEEE Trans Image Process. 2015;24(12):5288–301. doi:10.1109/tip.2015.2479561. [Google Scholar] [PubMed] [CrossRef]
125. Hu X, Hu S, Huang Y, Zhang H, Wu H. Video anomaly detection using deep incremental slow feature analysis network. IET Comput Vis. 2016;10(4):258–67. doi:10.1049/iet-cvi.2015.0271. [Google Scholar] [CrossRef]
126. Jeong H, Yoo Y, Yi KM, Choi JY. Two-stage online inference model for traffic pattern analysis and anomaly detection. Mach Vis Appl. 2014;25(6):1501–17. doi:10.1007/s00138-014-0629-y. [Google Scholar] [CrossRef]
127. Kaviani R, Ahmadi P, Gholampour I. Automatic accident detection using topic models. In: Proceedings of the 2015 23rd Iranian Conference on Electrical Engineering; 2015 May 10–14; Tehran, Iran. p. 444–9. [Google Scholar]
128. Sabokrou M, Fathy M, Hoseini M, Klette R. Real-time anomaly detection and localization in crowded scenes. In: Proceedings of the 2015 IEEE Conference on Computer Vision and Pattern Recognition Workshops (CVPRW); 2015 Jun 7–12; Boston, MA, USA. p. 56–62. [Google Scholar]
129. Wang T, Qiao M, Deng Y, Zhou Y, Wang H, Lyu Q, et al. Abnormal event detection based on analysis of movement information of video sequence. Optik. 2018;152:50–60. doi:10.1016/j.ijleo.2017.07.064. [Google Scholar] [CrossRef]
130. Huang H, Mehrotra K, Mohan CK. Rank-based outlier detection. J Stat Comput Simul. 2013;83(3):518–31. [Google Scholar]
131. Xu X, Liu H, Yao M. Recent progress of anomaly detection. Complexity. 2019;2019:2686378. doi:10.1155/2019/2686378. [Google Scholar] [CrossRef]
132. Chong YS, Tay YH. Abnormal event detection in videos using spatiotemporal autoencoder. In: Advances in neural networks—ISNN 2017. Berlin/Heidelberg, Germany: Springer; 2017. p. 189–96 doi: 10.1007/978-3-319-59081-3_23. [Google Scholar] [CrossRef]
133. Lu C, Shi J, Jia J. Abnormal event detection at 150 fps in MATLAB. In: Proceedings of the 2013 IEEE International Conference on Computer Vision; 2013 Dec 1–8; Sydney, Australia. p. 2720–7. [Google Scholar]
134. Kavikuil K, Amudha J. Leveraging deep learning for anomaly detection in video surveillance. In: 1st International Conference on Artificial Intelligence and Cognitive Computing (AICC). Singapore: Springer; 2019. p. 239–47. [Google Scholar]
135. Kim H, Ben-Othman J, Mokdad L, Bellavista P. A virtual emotion detection architecture with two-way enabled delay bound toward evolutional emotion-based IoT services. IEEE Trans Mob Comput. 2022;21(4):1172–81. doi:10.1109/tmc.2020.3024059. [Google Scholar] [CrossRef]
136. Bashir AK, Rawat DB, Wu J, Imran MA. Guest editorial: security, reliability, and safety in IoT-enabled maritime transportation systems. IEEE Trans Intell Transp Syst. 2023;24(2):2275–81. doi:10.1109/tits.2023.3238266. [Google Scholar] [CrossRef]
137. Gaddam A, Wilkin T, Angelova M, Gaddam J. Detecting sensor faults, anomalies and outliers in the Internet of Things: a survey on the challenges and solutions. Electronics. 2020;9(3):511. doi:10.3390/electronics9030511. [Google Scholar] [CrossRef]
Cite This Article
 Copyright © 2026 The Author(s). Published by Tech Science Press.
This work is licensed under a Creative Commons Attribution 4.0 International License , which permits unrestricted use, distribution, and reproduction in any medium, provided the original work is properly cited.
 Downloads
 Citation Tools