
 Submit a Paper
 Propose a Special lssue
 Open Access
ARTICLE
Development of the Framework for Traffic Accident Visualization Analysis (F-TAVA) Based on the Conceptualization of High-Risk Situations in Autonomous Vehicles
1 Department of Urban Engineering, Chungbuk National University, Cheongju-si, 28644, Republic of Korea
2 Department of Transport Big Data, The Korea Transportation Institute, Sejong-si, 30147, Republic of Korea
* Corresponding Author: Tai-jin Song. Email:
(This article belongs to the Special Issue: AI-Driven Big Data Analytics for Sustainable Mixed Traffic and Mobility Systems)
Computers, Materials & Continua 2026, 87(2), 36 https://doi.org/10.32604/cmc.2026.074802
Received 18 October 2025; Accepted 25 December 2025; Issue published 12 March 2026
 View Full Text
 Download PDF
Abstract
Autonomous vehicles operate without direct human intervention, which introduces safety risks that differ from those of conventional vehicles. Although many studies have examined safety issues related to autonomous driving, high-risk situations have often been defined using single indicators, making it difficult to capture the complex and evolving nature of accident risk. To address this limitation, this study proposes a structured framework for defining and analyzing high-risk situations throughout the traffic accident process. High-risk situations are described using three complementary indicators: accident likelihood, accident severity, and accident duration. These indicators explain how risk emerges, increases, and persists over time. Based on this concept, a framework for traffic accident visualization analysis is developed to support phase-specific risk assessment and visualization. The framework combines accident-phase information with factor-level risk contributions, allowing systematic identification of key factors and their interactions across different accident stages. Using combinations of the three indicators, high-risk situations are classified into twenty-seven distinct types, providing a clear typology for complex accident scenarios involving autonomous vehicles. The applicability of the proposed framework is demonstrated through two representative accident scenarios with different risk characteristics. The results show that the framework effectively captures interactions among multiple risk factors, explains how risk levels change from pre-crash to post-crash phases, and identifies contributing factors that are difficult to detect using conventional traffic accident investigation methods. Overall, the proposed framework offers a practical basis for autonomous vehicle accident analysis, safety evaluation, and policy-related decision-making.Keywords
Abbreviations
| The following abbreviations are used in this manuscript | |
| AV | Autonomous Vehicle |
| F-TAVA | Framework for Traffic Accident Visualization Analysis |
Autonomous vehicles (AVs) are vehicles that can drive without driver intervention, improving mobility efficiency and convenience [1,2]. However, the operation of AV technology raises additional safety-related issues. In particular, there are concerns that the response capabilities of Autonomous Driving Systems (ADSs) in unexpected situations or non-standard environments have not yet reached a sufficient level [3]. These technical limitations have led to actual crashes, and in recent years, various accident cases involving AVs have continued to occur. A notable example is the 2016 accident in Florida, USA, which occurred while Tesla’s ADS was active, sparking serious concerns about the safety of autonomous driving technology [4].
Unlike human drivers, ADSs have limited intuitive judgement and situation interpretation capabilities. Therefore, clear definitions and systematic identification criteria are necessary for high-risk situations in which various risk factors interact. However, despite frequent use of the term “high-risk” in existing studies on AV safety, its definition remains inconsistent and unclear. Many tend to conceptualize dangerous situations as the probability of an accident occurring [5–7], while factors such as the severity or duration of an accident have been relatively overlooked. This tendency may limit the ability to reflect complex risks in the verification and policy implementation of the technology and also implies the potential for issues arising from the absence of clear definition criteria.
Actual high-risk situations are difficult to define using a single indicator alone, as they are formed by the multidimensional interaction of various risk factors. This study considers this complexity and aims to define high-risk situations based on three core indicators: accident occurrence probability, accident severity, and accident duration. Here, accident occurrence probability refers to the likelihood of an accident occurring prior to the accident, based on internal and external environmental conditions of the vehicle. Accident severity refers to the extent of human and material damage following an accident. Accident duration refers to the temporal impact of an accident or system failure on traffic flow and safety throughout the entire process from before the accident to after the accident. In other words, the accident occurrence probability reflects the risk attributes before the accident (pre-crash), the accident severity reflects the risk attributes after the accident (in/post-crash), and the accident duration reflects the risk attributes throughout the entire crash occurrence process (pre/in/post-crash). These three indicators encompass different risk attributes, so a comprehensive definition of high-risk situations is necessary through the combination of these three indicators.
This study defines various types of high-risk situations through the combination of the three indicators and proposes an analytical framework that can visually represent them. The proposed visualization analysis framework can be applied to various risk scenarios that autonomous vehicles may encounter and can be utilized to structurally identify complex risks over time and derive response strategies. Furthermore, the results of this study are expected to serve as practical analytical tools for safety verification of autonomous vehicles, accident prevention, and policy design.
In the field of transportation, “high-risk situations” are defined based on various criteria, and many studies focus on the following three aspects: 1) situations with a high probability of accidents, 2) situations with a high severity of accidents, and 3) situations with a long duration of accidents. In this section, we review previous studies based on these three definition criteria.
The definition of high-risk based on accident probability considers situations with a high probability of collision as high-risk. This definition is primarily intended to identify and prevent accidents in advance. Pierson et al. [8] used NGSIM data to set accident probability thresholds based on factors such as congestion and speed around autonomous vehicles. They then classified situations as low-, medium-, and high-risk categories based on these thresholds. Ren et al. [9] utilized actual vehicle driving data from roundabouts to derive high-risk situations within roundabouts. This study identified reduced visibility during lane changes, approaching vehicles, and sudden cut-ins as key risk factors. Zhao et al. [10] classified combinations of variables with a high probability of accidents as high-risk, and presented sudden lane changes by surrounding vehicles and approaching speeding vehicles as representative risk factors. The study mentioned that not only single variables but also interactions between variables can act as key mechanisms that increase the probability of accidents. Wang et al. [11] identified curved roads, hills, and nighttime conditions as key high-risk factors due to limited visibility for AVs. While the study un-clearly define high-risk situations, it evaluated the risk of generated scenarios in terms of accident probability. Kim et al. [12] utilized Waymo autonomous driving video data and collision reports provided from the California Department of Motor Vehicles (CA DMV) to derive high-risk situations. The study presented that the accident probability sharply increases when the distance to surrounding objects (vehicles, pedestrians, bicycles) falls within a specific range (17–20 m). Zaker et al. [13] defined situations that are not frequently occurring but have a high collision probability as edge cases. The study identified narrow lanes and close proximity to two-wheeled vehicles as representative risk factors. While these studies contribute to the development of risk detection and accident prevention systems for AVs, they have limitations in assessing the actual high-risk situations because they little consider the scale or impact of accidents after they occur.
Unlike studies defining high-risk situations based on accident probability, there are relatively few studies on accident severity and duration. Of these, the accident severity-based approach determines high-risk situations based on the extent of human casualties and physical damage after an accident. Kuo et al. [14] classified accidents based on the severity of accidents involving AVs and defined accidents resulting in death or serious injury as high-risk situations. In particular, collisions occurring at high speeds were analyzed as having the highest severity. This approach is useful for determining the social impact of accidents and response priorities, as it reflects the extent of damage in the event of an accident involving an AV. On the other hand, it focuses on the consequences of accidents, so there are limitations in identifying and preventing risky situations before accidents occur. The accident duration-based approach defines high-risk situations based on the duration of traffic congestion or road paralysis after an accident occurs. This approach is valuable in that it considers both the negative impact of accidents and the resilience of the system. Nevertheless, existing literature lacks analysis of this aspect. Recently, The study conducted by Song et al. [15] defined situations with long accident durations and frequent changes in vehicle behavior as high-risk situations. In particular, complex accident developments involving multiple maneuvers were presented as factors that increase risk. This definition can be a key criterion for evaluating the stability and resilience of ADSs. However, most studies still focus only on accident probability or severity, and analysis using duration as a key factor is very limited. Therefore, future research needs to go beyond the independent use of these three factors and establish a high-risk definition system based on composite indicators that integrates them. In particular, factors such as duration can serve as indicators reflecting the recovery and control capabilities of real-time autonomous driving systems, contributing not only to accident prevention but also to evaluating the overall stability of the system.
2.2 AV’s Scenario Related Studies
Various scenario-based studies have been conducted to ensure the safety of AVs and improve their accident response capabilities. Scenario-related studies can be broadly classified into three types: 1) test scenarios for verifying the safety of ADSs, 2) scenarios focusing on traffic accidents that may occur during AV driving, and 3) scenarios focusing on high-risk situations for AVs.
The first type, test scenarios, are scenarios for verifying the performance and safety of ADSs. This type of research structures conditions for evaluating the driving capabilities of AVs in simulations or real environments. Park et al. [16] designed scenarios based on the Pegasus 5-layer format to provide a scope of experimentation for AV experimenters. The scenarios were generated using TF-IDF-based text mining of general traffic accident data. This presented a representative scenario: a left turn in a child safety zone in AV mode. So et al. [17] analyzed 223,552 general traffic accident reports from 2014 using text mining techniques and generated a total of 18 test scenarios based on 19 high-priority keyword combinations. Fremont et al. [18] generated autonomous driving test scenarios using the SCENIC language. This tested the scenarios in simulations and then extended the analysis to experiments in actual road environments. Although these test scenario studies provide an important starting point for verifying the safety of AVs, most of them have the limitation of being designed around the driving of a single AV. In other words, there is criticism that these studies do not adequately reflect the complexity between AVs, surrounding vehicles, and the environment, and therefore little attention to reflect high-risk situations on actual roads.
The second type is a scenario centered on traffic accidents that may occur during autonomous vehicle operation. This scenario includes not only existing vehicle accident types but also sensor errors and cyber attacks related to autonomous driving. Li et al. [19] analyzed CA DMV collision reports to derive scenarios for traffic accident invonvling autonomous vehicle(s). Although the generated scenarios were based on the traffic accident data involving AVs, they targeted Level 2 AVs and derived scenarios similar to those of non-AVs (e.g., rear-end collision scenarios, signal intersection scenarios), which is a limitation of this approach. Kim et al. [20] aimed to derive scenarios beyond behaviors similar to non-AVs, focusing on the system aspects of AVs. The study generated scenarios based on autonomous driving mode disengagement reports, AV accident reports, and videos capturing the accients involving AV(s). A total of 10 scenarios were generated, with representative examples including perception sensor error and decision sensor error scenarios. This study is based on the system of AVs. Therefore, it is limited in deriving scenarios related to cyber attacks and communication, as it only targets the performance of currently operating ADSs. Girdhar et al. [21] aimed to derive AV accident scenarios prepared for cyber attacks, rather than simple autonomous driving sensor errors. The study summarized possible types of cyber attacks and generated scenarios based on the 6-W principle (Who, What, When, Where, Why, How). A representative scenario is a scenario of RSU hacking damage at a signal intersection. Such studies on AV traffic accident scenarios are significant in that they identify technical vulnerabilities in AVs. However, most scenarios focus on whether or not a traffic accident occurs, which limits their usefulness in terms of quantitative risk assessment and identification of high-risk situations. Therefore, there is a growing need for research on high-risk scenarios that identify situations with a high probability of accidents or high severity in advance and seek countermeasures to minimize damage in the event of an accident, rather than focusing on the accidents themselves.
The third type is high-risk situation-centered scenarios. Research on high-risk situation scenarios for AVs focuses on situations where AVs are likely to encounter accidents or where accidents are likely to be serious. Li et al. [22] created high-risk pre-crash scenarios in terms of the probability of accidents involving AVs. In particular, the study mentioned that cut-in scenarios are the most high-risk scenarios with the highest probability of accidents. Luo et al. [23] derived high-risk scenarios involving two-wheeled vehicles and AVs. It used a neural network model to derive high-risk scenarios with a high probability of accidents and mentioned that the probability of collision increases when close proximity and lane changing behaviors are combined. Zhou et al. [24] reconstructed actual collision accident videos through simulation and derived high-risk scenarios focusing on collision avoidance rates and accident severity. These studies on high-risk situation scenarios are significant in defining complex situations with a high probability of actual accidents. However, most high-risk situation scenarios focus only on specific situations (e.g., pre-crash scenarios), and there is a lack of analysis linking the entire accident process with traffic accident factors at each stage.
First, we transitioned from a single-indicator-based definition to a composite, indicator-based definition of high-risk situations. This new definition covers the entire pre-, in-, and post-crash process. To this end, this study organized the risk factors at each point in time and expanded them to reflect the relationships between risk factors. Additionally, we increased the practical applicability by aligning the high-risk situation classification system of this study with autonomous driving scenario studies and applying it to case studies. Various scenarios were included in the analysis, and classification and visualization were performed for each type of high-risk situation. The contributions are as below:
• Systemize three high-risk situation concepts based on the entire pre/in/post-crash process and classify key risk factors for each stage,
• Define high-risk situations based on composite indicators rather than single indicator,
• Provide a visualization analysis process that enables analysis of not only single causes but also complex causes, and
• Apply the proposed visualization analysis process to accident scenarios that may occur in future AVs environment, thereby providing a theoretical foundation for practical application.
3 Defining Traffic Accident Process Involving AV(s)
3.1 Three Phases of Accident Procedure
In order to define high-risk situations for AVs, it is necessary to first clearly understand the entire process of a traffic accident and identify key items for each phase. The process of traffic accidents involving AV(s) should be presented based on the pre-crash, in-crash, and post-crash stages outlined in the Haddon matrix to enable the identification of causes for improving overall traffic safety in accident situations [20,25]. The pre-crash phase refers to the situation prior to the collision, including the surrounding environment, the status of the ADS, and the vehicle’s driving condition. This phase is further divided into three zones: 1) Caution—Not in an incident-impacted area, 2) Emergency—In an incident-impacted area but possibly maneuvering to avoid a crash, 3) Critical—In an incident-impacted area faced with a crash. The in-crash phase refers to the actual collision. Key variables in the in-crash stage, such as the type of collision, the collision target, and the vehicle speed at the time of collision, are critical factors in determining the severity of the crash. The post-crash phase refers to the period after the collision, and includes variables such as the extent of damage, vehicle and infrastructure damage, and the occurrence of secondary accidents. These three phases collectively provide a structured framework that can be operationalized in real-world AV safety management: 1) pre-crash indicators support preventive interventions, 2) in-crash indicators inform injury-mitigation strategies, 3) post-crash indicators contribute to rapid recovery and secondary-crash prevention.
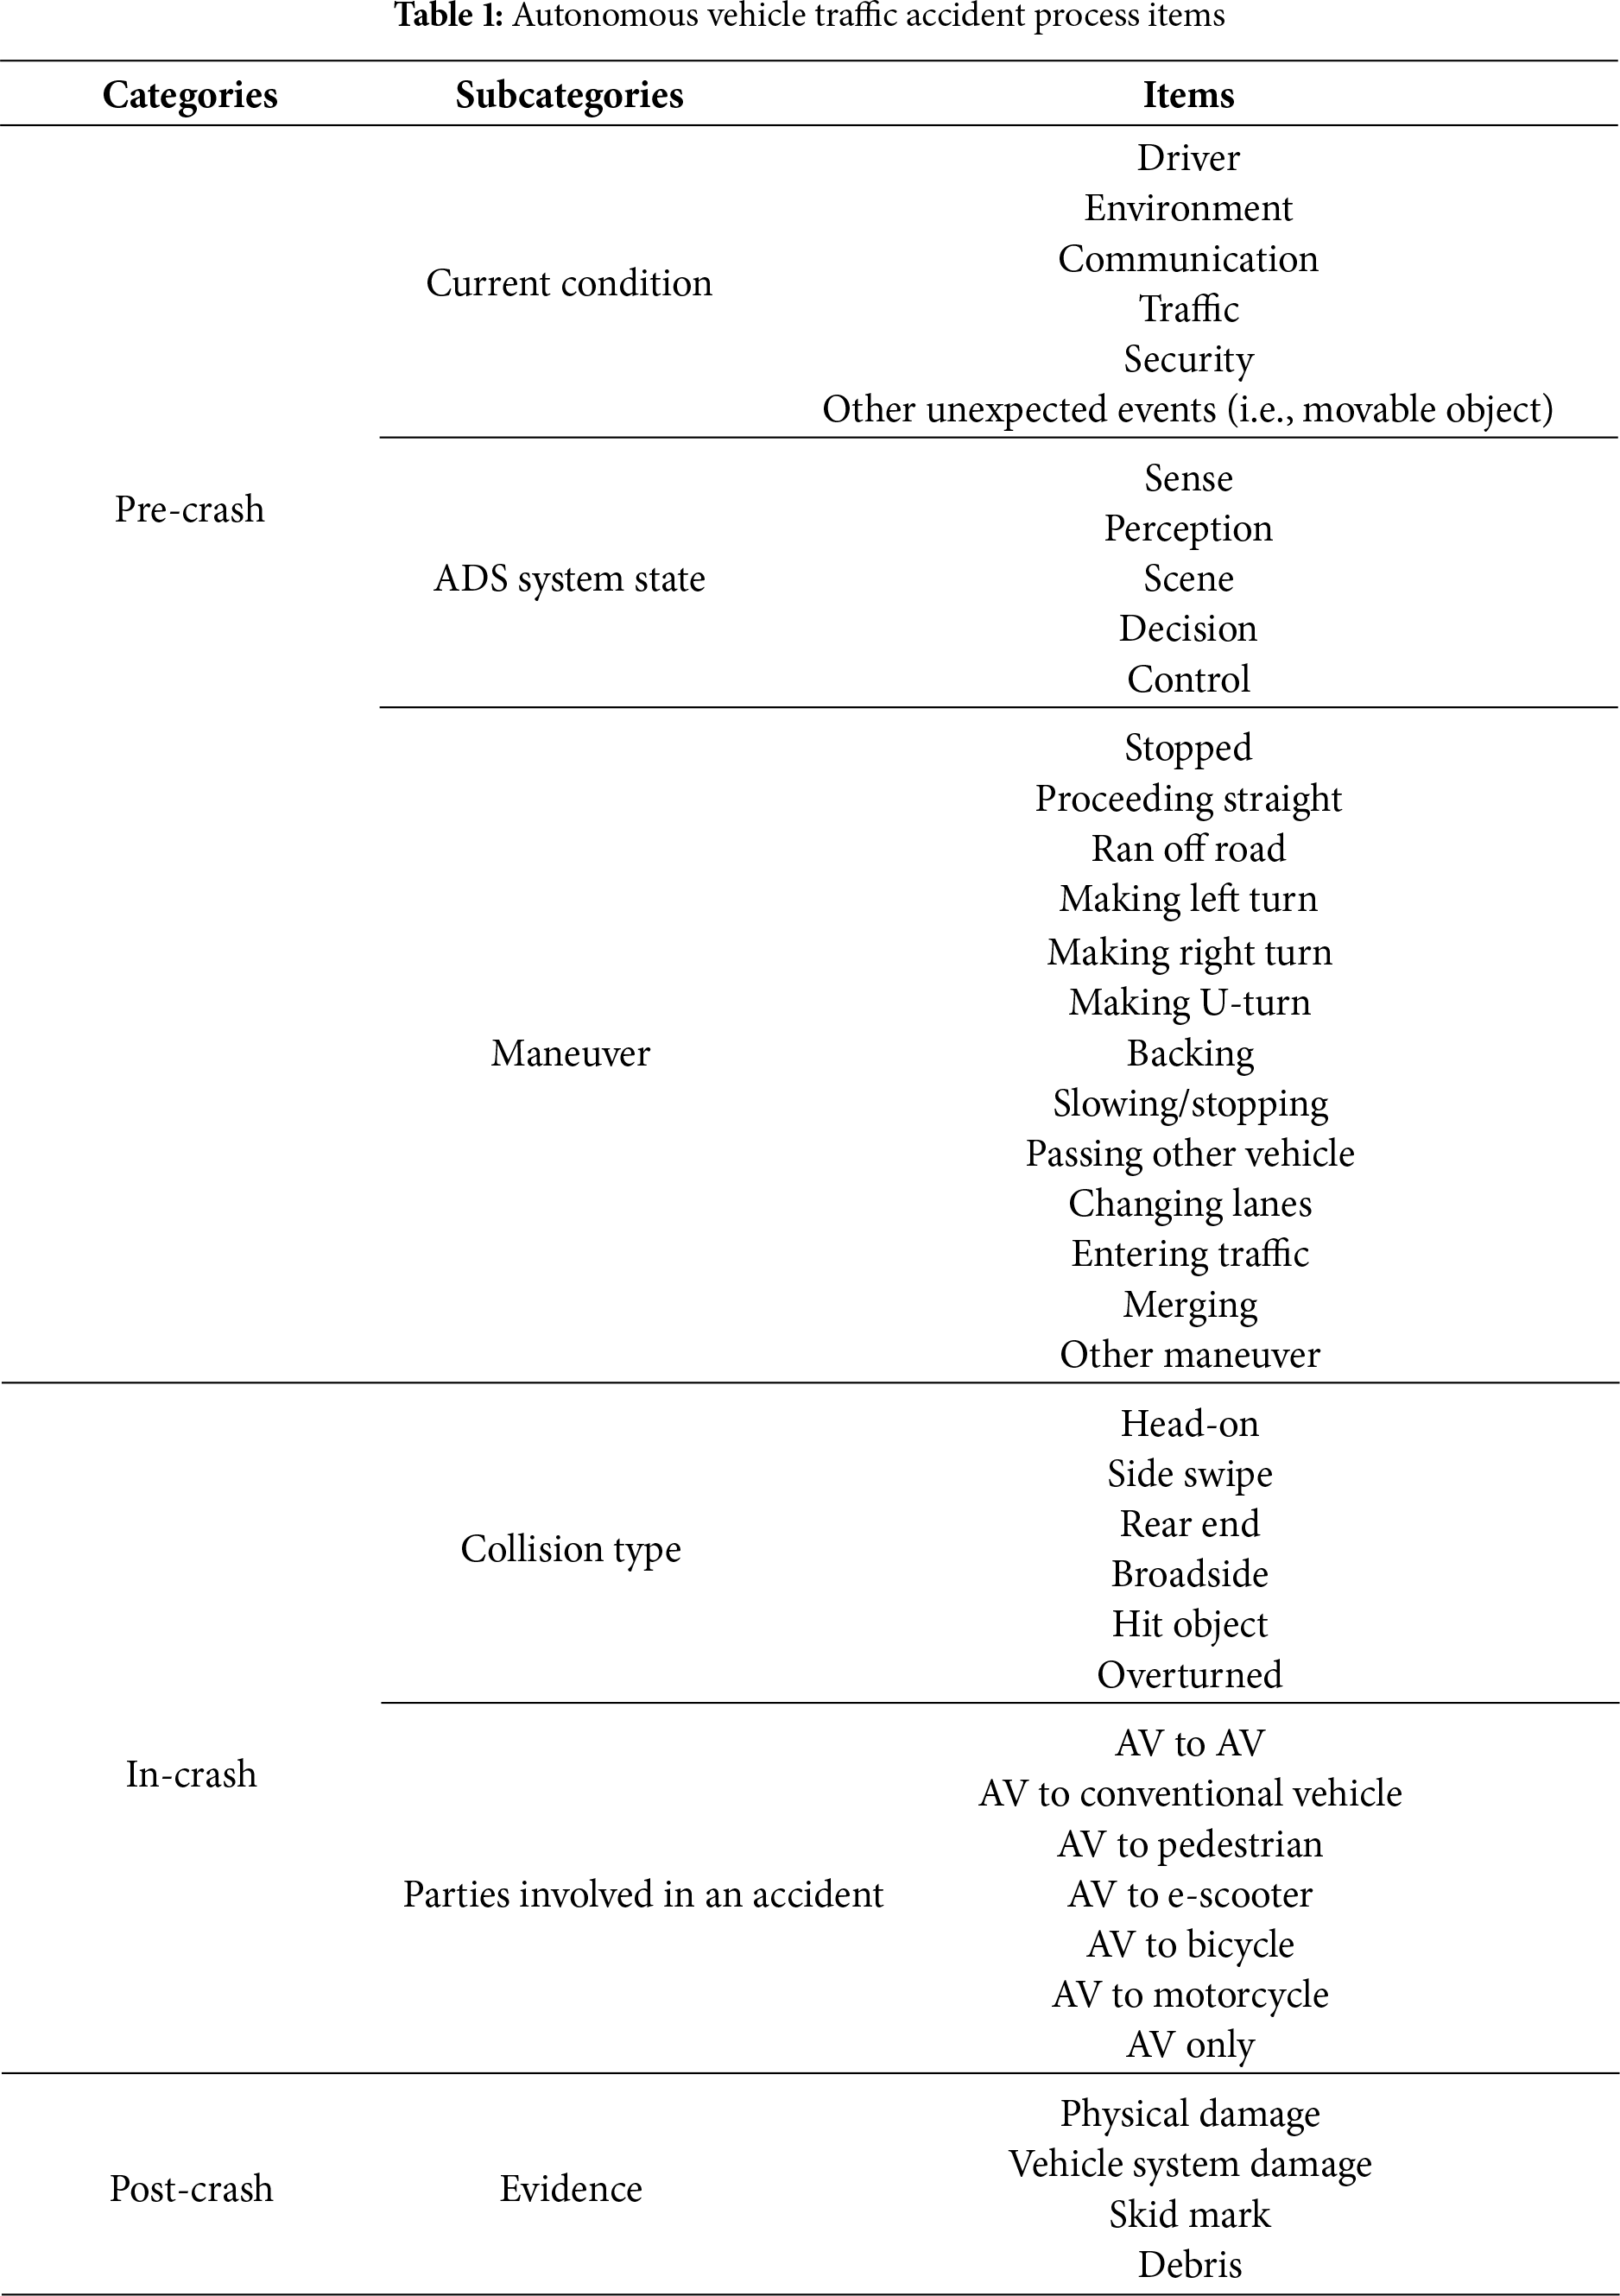
To quantitatively analyze each stage of AV accidents, it is necessary to structure the factors that constitute traffic accidents by their respective layers. This study is based on the six elements (Current condition, ADS state, Maneuvering, Collision type, Parties involved in an accident, and Evidence after scene) proposed in Kim et al. [20]’s accident analysis framework, but we redefined and restructured the detailed factors for each element according to the objectives of this study. Current conditions refer to the internal and external environment of an autonomous vehicle before the time of an accident. These factors include driver characteristics such as mobile phone use when driving, environmental characteristics such as natural conditions and road infrastructure, V2X communication conditions, traffic characteristics, security characteristics such as the presence or absence of hacking (excluding ADS), and other unexpected events. The ADS system state recognizes functional safety for the ADS based on PIEV and consists of five stages: sense, perception, scene, decision, and control. These are diagnosed by distinguishing the three functional failure modes (fault, error, and failure) defined in ISO 26262 [26]. A fault refers to a situation in which one of the ADSs changes from a normal state to an abnormal state due to a physical defect in the device. An error occurs if there is a discrepancy between the measured value and the observed value, resulting in an incorrect output due to a fault. A failure occurs when an incorrect value is transmitted to the system due to an error, causing eventually unintended behavior. Maneuver refers to the final driving an AV after the processes of the five stages. In this study, the components of maneuver were reconstructed using elements from the California Department of Motor Vehicles (CA DMV) [27] within ‘Movement preceding collision’. We selected the following items that directly represent the maneuvers of AVs: stopped, proceeding straight, making left turn, making right turn, making U-turn, backing, slowing/stopping, passing other vehicle, changing lanes, entering traffic, merging. Collision type is information about the direction of collision of an AV. Factors within collision type also utilize the “Type of Collision” in DMV [27], which includes head-on, side swipe, rear end, broadside, hit object, and overturned. In addition, the components of parties involved in an accident are based on the accident factors presented in the study by Kim et al. [4]. It consists of AV to AV, AV to conventional vehicle, AV to pedestrians, and AV only. Although the CA DMV defines pedestrian crahses as a collision type, this study classifies them separately as “AV to pedestrian” to clearly distinguish collision direction from the involved parties. Evidence refers to everything that can be investigated by the police at the scene after a traffic accident. The factors within evidence were derived using the component of evidence presented in the studies Kim et al. [4] and Kim et al. [20]. It consists of physical damage, vehicle system damage, skid mark, and debris.
3.3 Integrated Framework for Traffic Accident Visualization Analysis
3.3.1 Accident Phase-Factor Matching within Accident Layers
The proposed Framework for Traffic Accident Visualization Analysis (hereafter F-TAVA) begins with matching the factors at each stage of a traffic accident with the components of the accident. The matching results are shown in Table 1. The stage of “Pre-crash” is the last opportunity to avoid an accident and the point in time that has the greatest influence on the likelihood of an accident occurring. It includes factors such as current conditions, ADS system state, and maneuver. In-crash refers to the moment when the AV is colliding, and includes collision types and parties involved in the accident. These factors directly influence the injury severity. Post-crash is the final stage where the accident may escalate or lead to secondary accidents. The core element of post-crash is evidence, which provides crucial information for diagnosing the accident’s impact.
3.3.2 Overall Structure of F-TAVA
F-TAVA is composed of three main layers (shown in Fig. 1). First, the top layer is designed to visualize the movement path of AVs based on the traffic accident phases proposed by the study of Kim et al. [20]. As-mentioned earlier, the vehicle trajectory information is divided into three phases, with the pre-crash phase further subdivided into caution, emergency, and critical. Trajectory data within each phase are stored in the database according to location and time. Second, the intermediate layer consists of input items for high-risk situation factors. The input items are based on the elements presented in Table 1, including traffic accident phase, current condition, ADS system state, maneuver, collision type and parties, Evidence. Factors within the input items are arranged using the hybrid model (Sequential timed event plotting model + Bow-tie model) proposed by Kim et al. [4]. The hybrid model offers the advantage of visually representing causal relationships between factors while reflecting spatio-temporal concepts, and it allows incorporating information such as probabilities for each factor. A technique capable of incorporating factor-specific probabilities is required. The Hidden Markov Model (HMM) is an effective method for estimating unobservable hidden probability values (State) based on observable outcome values (Observation). It has recently been applied in related studies for AV accident analysis (Girdhar et al. [21] and Kim et al. [28]). This study proposes the F-TAVA framework, which combines the hybrid model with HMM. The proposed framework enables quantitative assessment of accident risk from a composite perspective (hidden + observable), encompassing both causal relationships and the inherent complexity of accidents. Third, the bottom layer is the output items which consist of scenario information. This information includes the high-risk type, indicator values, key high-risk factors, and the comprehensive high-risk score. Specifically, the scenario information is determined by the Likelihood (L), Severity (S), and Duration (D). The proposed F-TAVA framework visualizes phase-specific metrics (L, S, and D), the temporal progression of risk triggers, and the overall high-risk score (H). These visual outputs enable analysts to intuitively observe how risk evolves across phases, identify critical escalation points, and support decision-making by highlighting when preventive or responsive actions are most required.
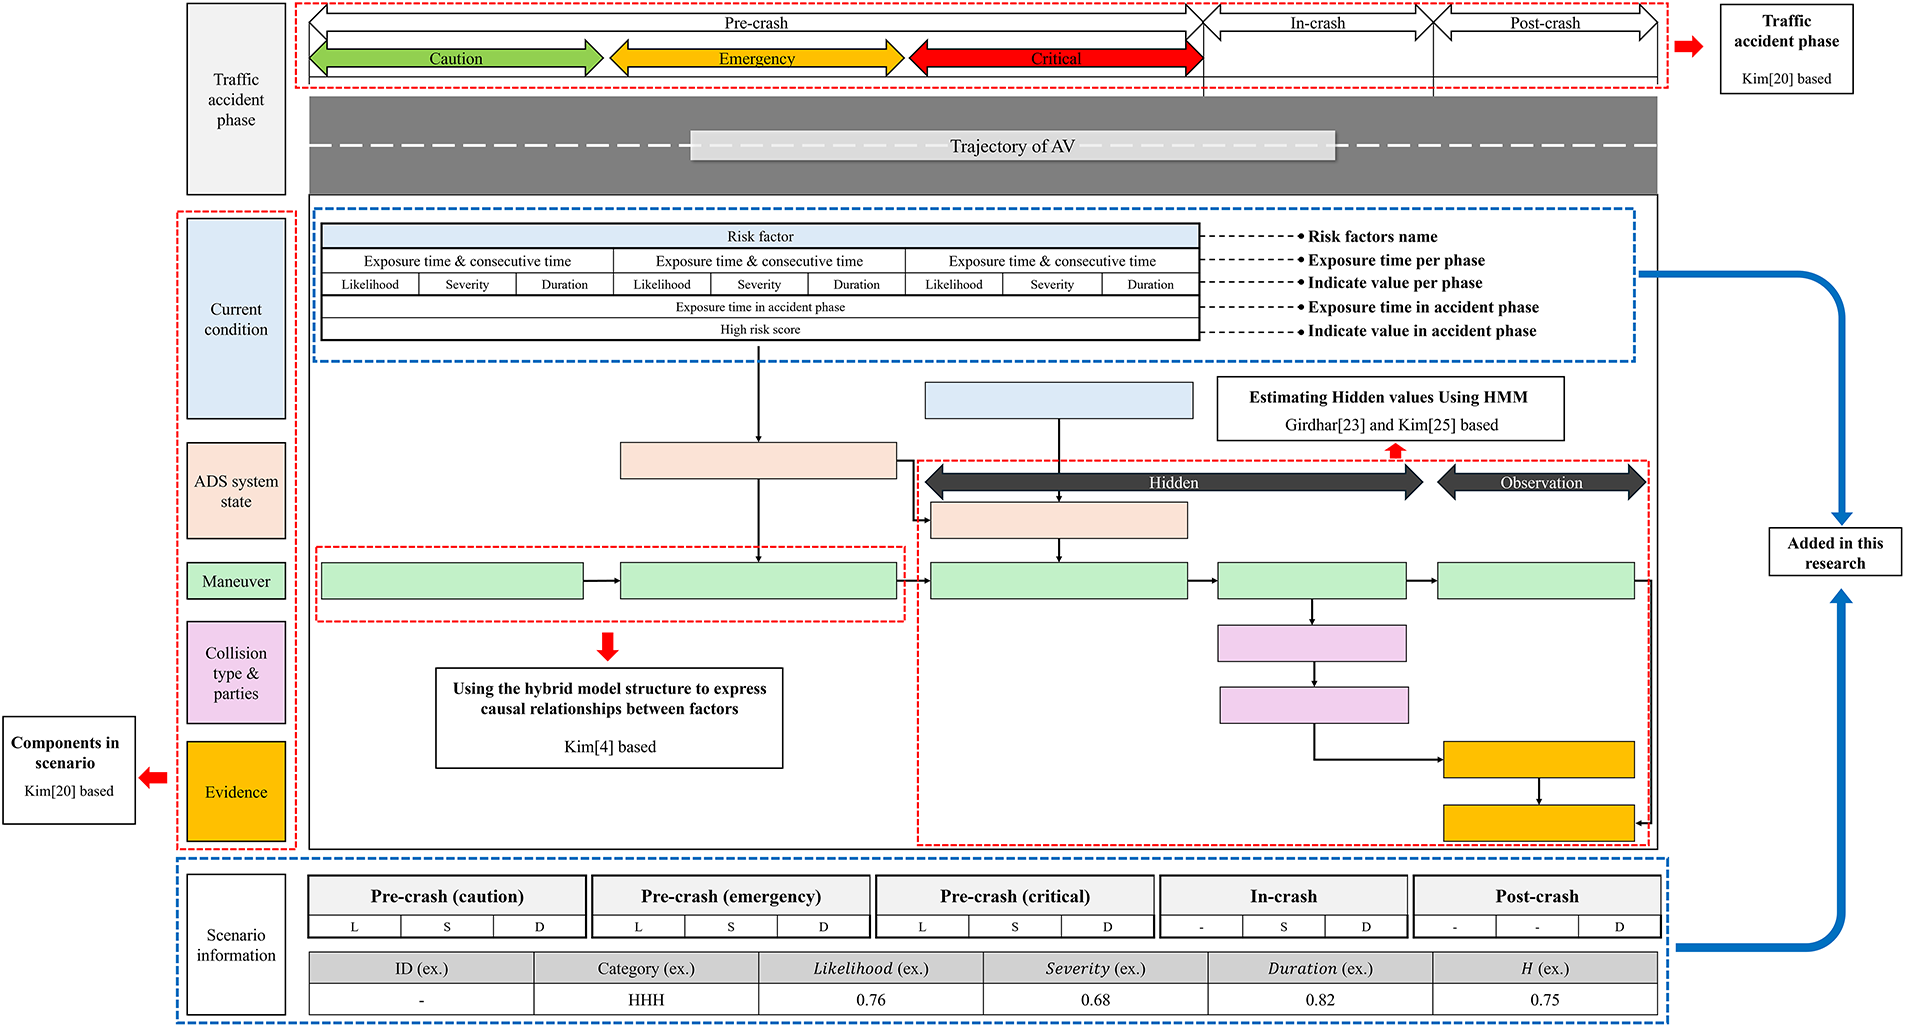
Figure 1: The schematic diagram of F-TAVA
L, S, and D are dynamic indicators that change according to the accident phase. This is because static indicators alone cannot adequately reflect changes in risk over time or the dynamic characteristics of factors. Fig. 2 depicts how L, S, and D correspond to the accident phase. During the pre-crash phase, all three indicators are present. The indicators estimated during this phase predict high-risk situations and enable an immediate response. During the in-crash phase, only the S and D indicators are reflected. In the post-crash phase, only the D indicator is reflected. During the in-crash and post-crash phases, the derived indicators are used to assess the risk situation based on information collected once the accident has ended.
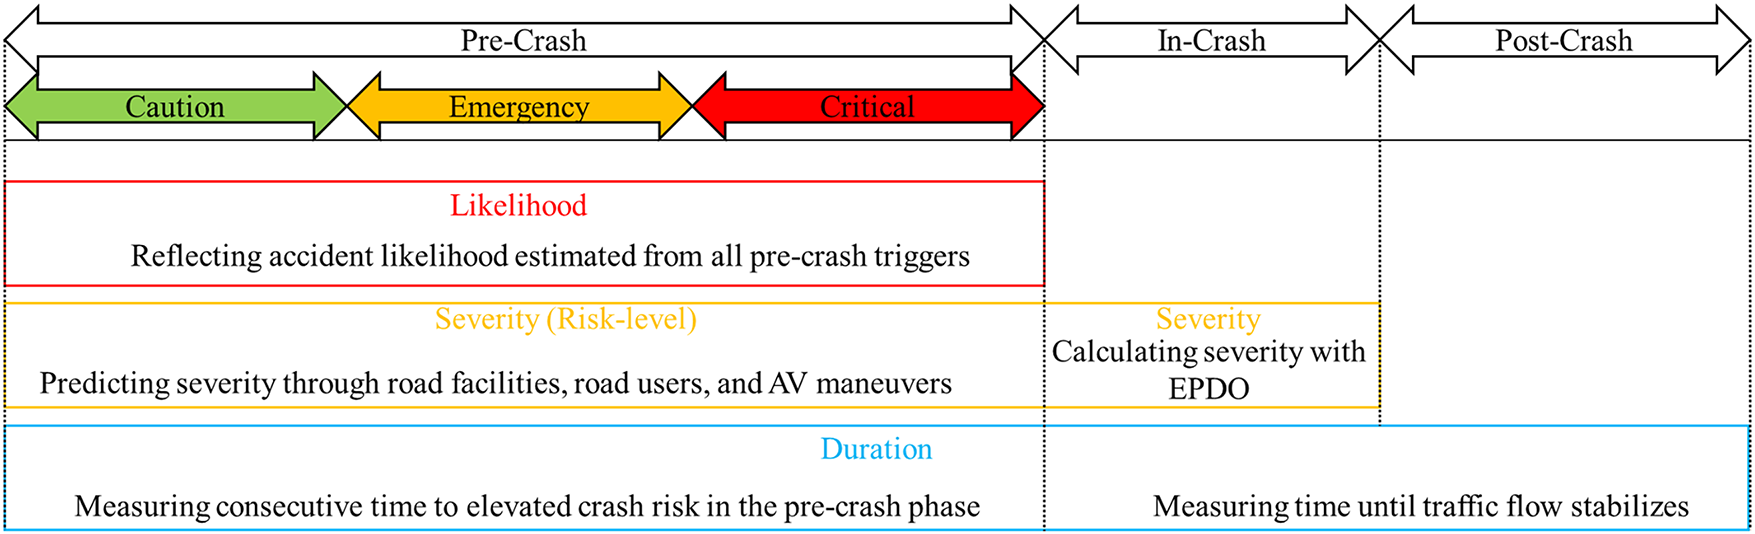
Figure 2: L, S, D in accident phase
Each indicator at this stage can be expressed as shown in Fig. 3. The presented distribution is the function
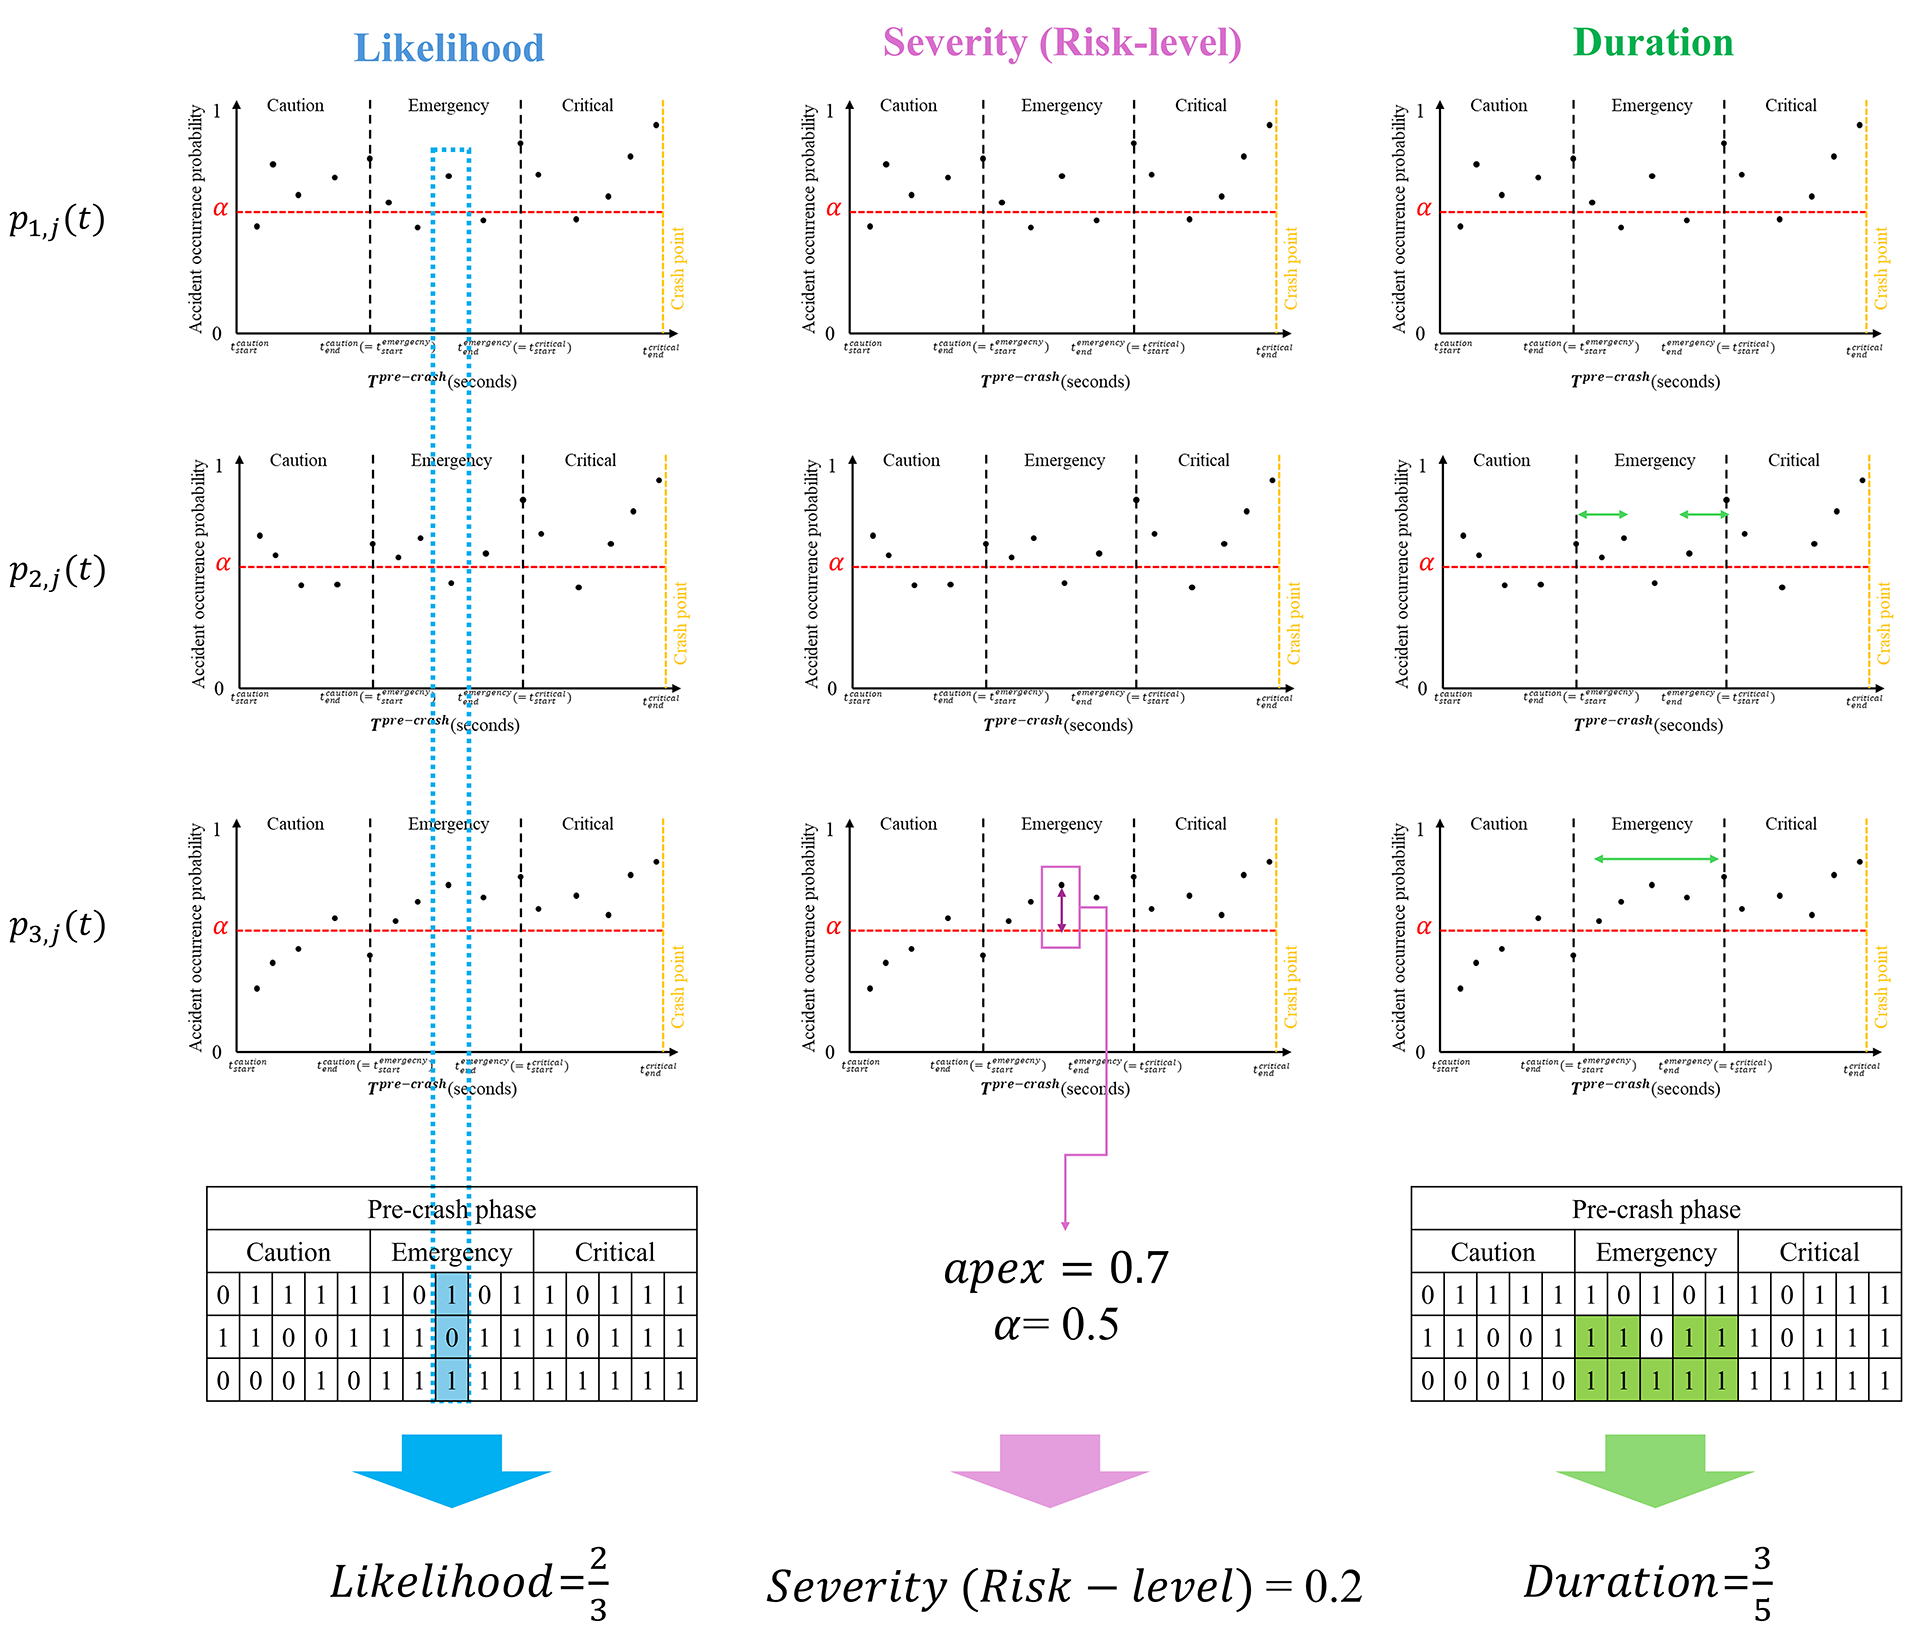
Figure 3: Conceptual derivation of L, S, and D from
In
L is calculated based on the binary function
3.3.4 Severity (Risk-Level) in Pre-Crash Phase
The risk-level indicator
3.3.5 Duration in Pre-Crash Phase
D in the pre-crash phase is an indicator (
3.3.6 Indicators in In/Post-Crash Phases
During the in-crash phase, S and D are reflected.
In-crash phase and post-crash D are defined in the following way (shown in Eq. (6)). D in the in-crash phase is defined as the time from the time the vehicle crashes to the time the vehicle stops, and D in the post-crash phase is defined as the time the traffic flow stabilizes after the vehicle stops. Since these values can have more than one value, they are standardized by the maximum observed D value in the analysis period X.
3.3.7 Definition of High-Risk Score
After the end of the incident, a final high-risk metric (H) is calculated. H is calculated as a combination of L, S, and D. Where L is the same L calculated in Eq. (1). S and D are the weighted sum of the pre-, in-, and post-crash indicators (shown in Eq. (7)). We assume that the weights are all equal.
Ultimately, the High-risk situation (R) is defined as a function of
To enhance the interpretability of the proposed equations, the threshold value
Low L, Low S and Low D situation shows the Normal or low-risk situation, which is a low-risk state where hazards exist around the AV(s) but little factors significantly influence the accident. The Critical high-risk situation (High L, High S, High D) denotes a high-risk scenario where the probability of an accident occurring in highest and the potential damage is greatest. The intermediate area (moderate risk situation) is a range where potential hazards can occur depending on the risk factors. This range requires accident handling and response through additional typological subdivisions. High-risk situation types are finally classified into a total of 27 types, ranging from LLL (Low L, Low S, Low D) to HHH (High L, High S, High D) (shown in Table 2).
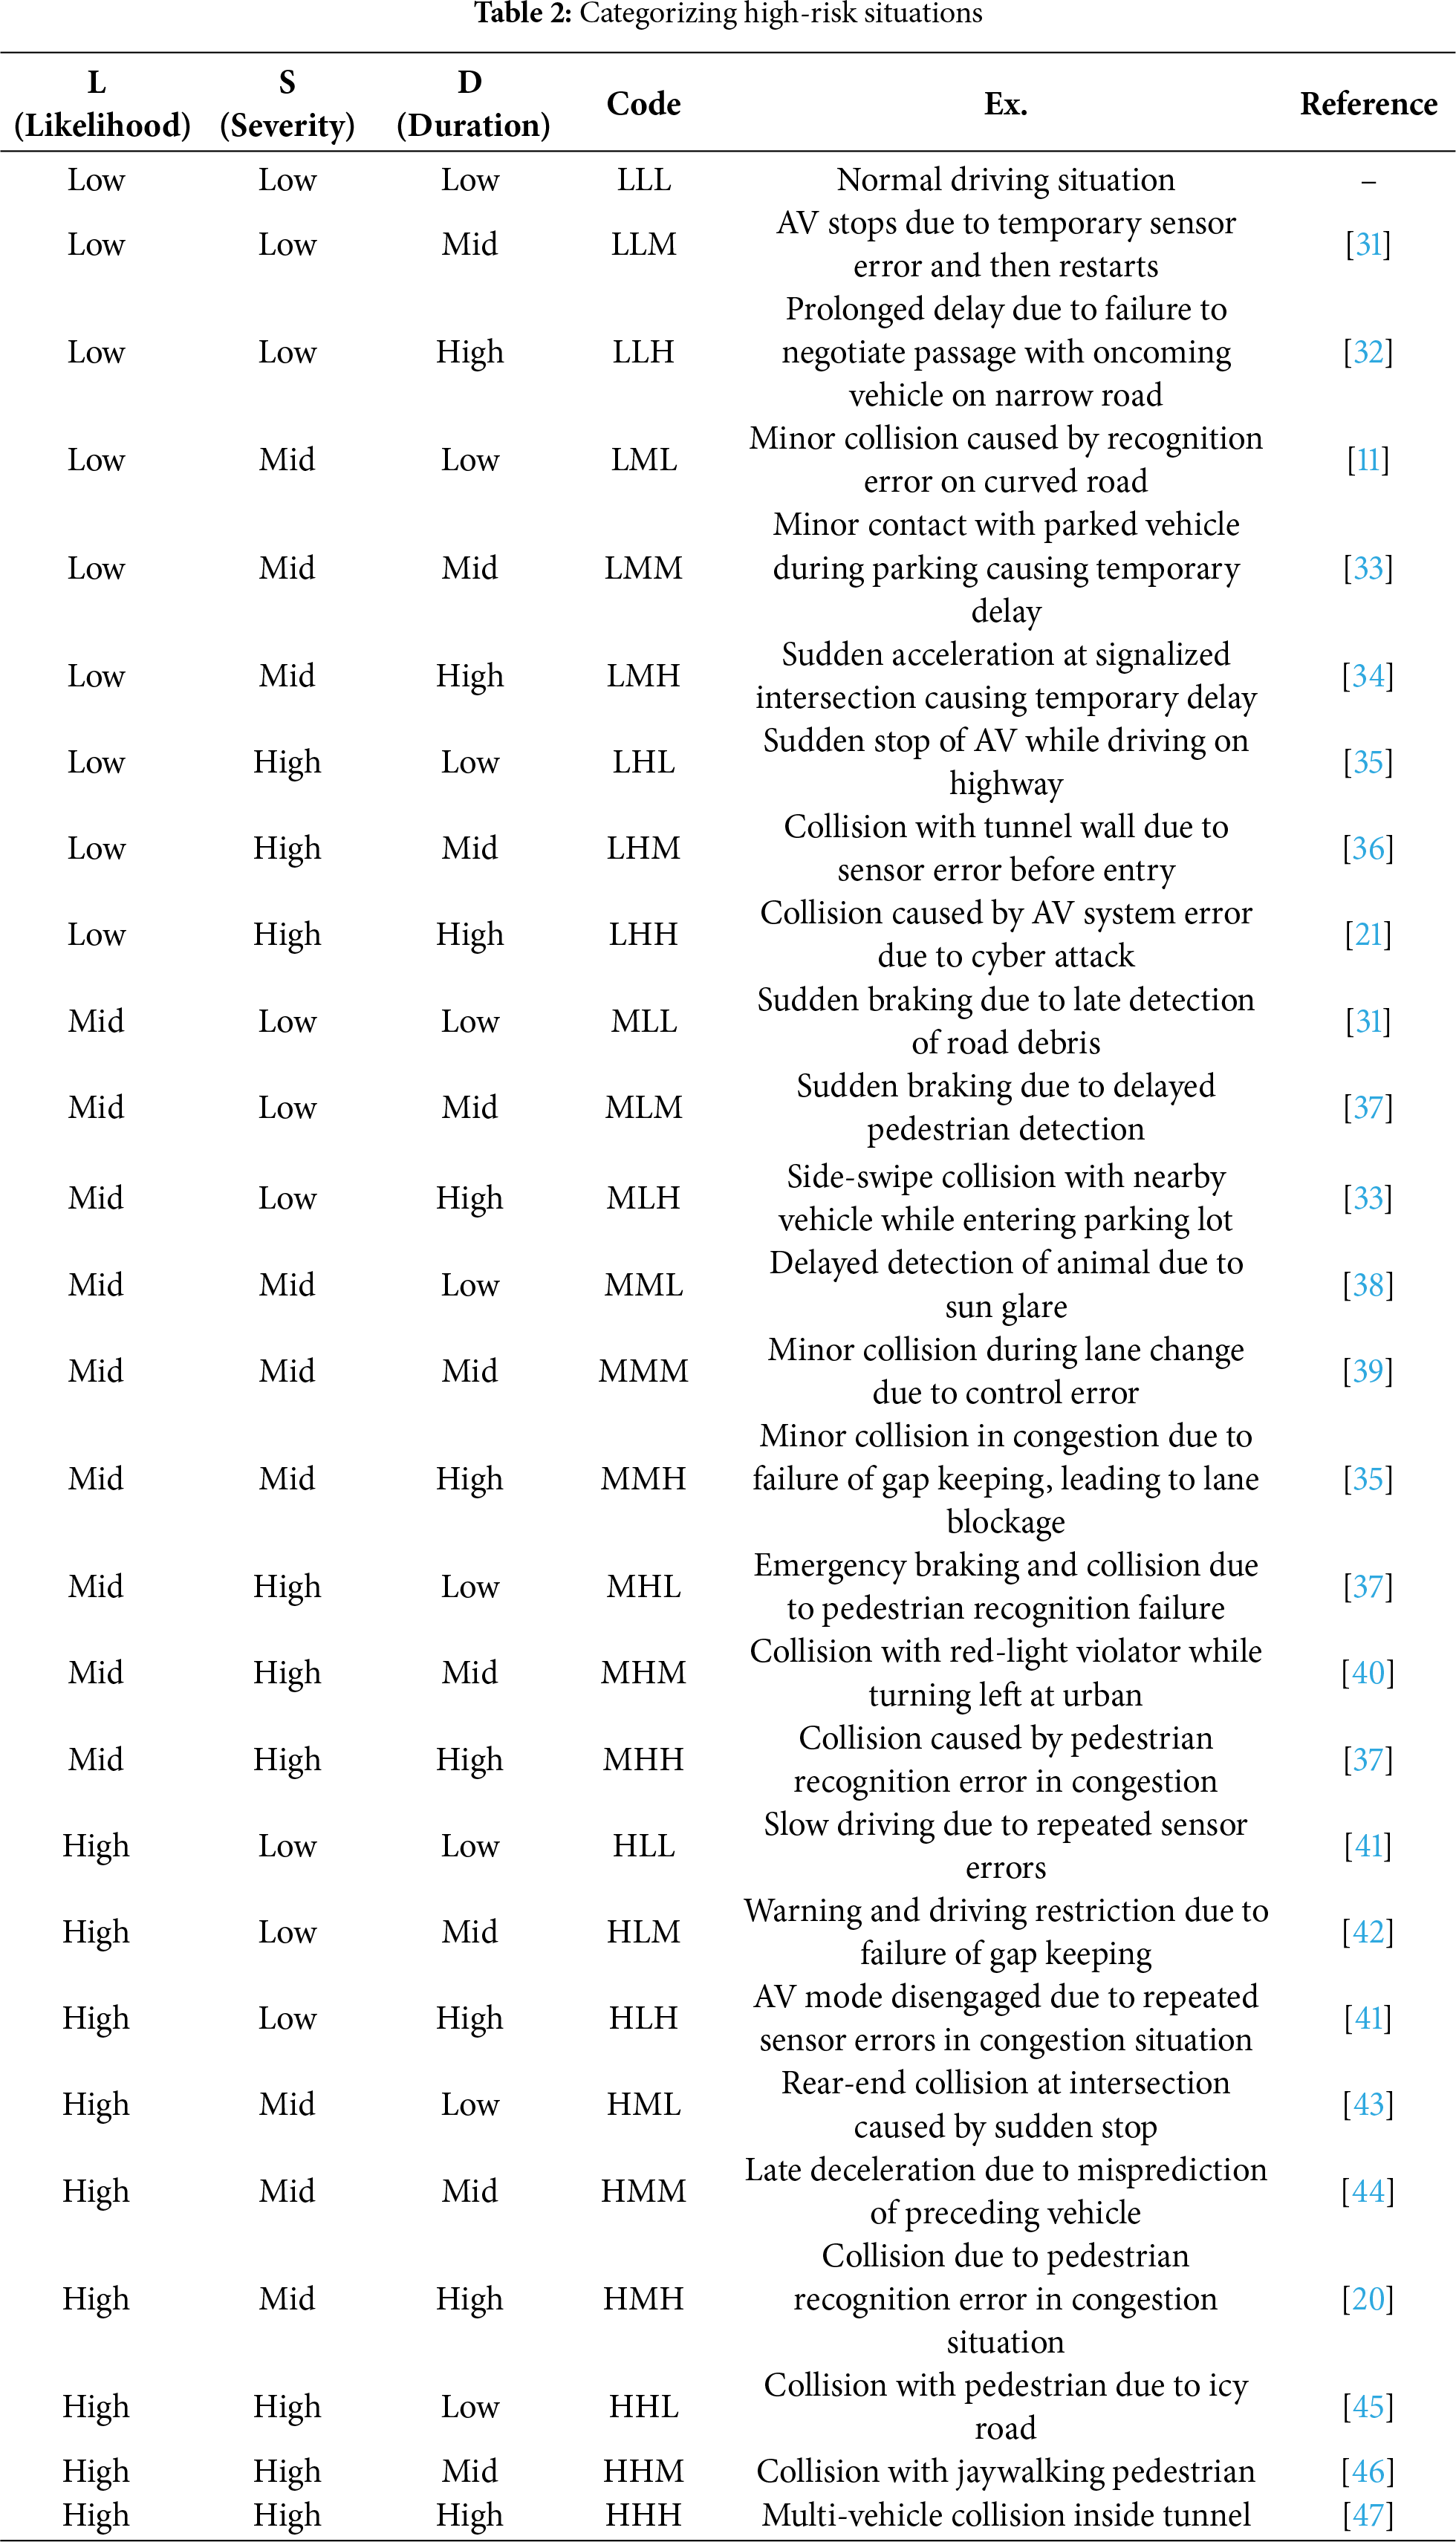
This study selected two representative high-risk scenarios (LHH and HHH) with prominent risk characteristics from the 27 risk types defined in Table 2. The LHH type is a risk scenario with a low occurrence probability but extremely high severity and long-term impact when an accident occurs. It is a type difficult to observe in everyday driving environments. This type is considered an edge-case, necessitating preemptive simulation training or the establishment of emergency response systems for proactive accident prevention. The HHH type is an critical-high-risk category exhibiting extremely high levels across all three indicators. Delayed accident response in this type can cause massive damage, necessitating comprehensive countermeasures including early detection and preemptive avoidance strategies.
4.1 Inserting Probability Values
F-TAVA can be utilized based on a variety of data collected from the environment in which the AV is driving. However, at present, there are limitations in obtaining all relevant data on AVs and various factors required for autonomous driving. In this study, Monte Carlo simulation techniques were applied to implement F-TAVA instead of real-world data. This technique has the advantage that it can randomize various uncertainties and potentially dangerous situations. By assigning stochastic variability to individual risk factors and repeatedly sampling them, this method can evaluate even complex risk scenarios that are difficult to observe or occur infrequently, and has been used in various risk analysis studies, such as predicting the probability of autonomous driving crashes [48] and autonomous driving test scenarios [49].
The probability values of F-TAVA are assigned using the following procedure (shown in Fig. 4). First, each factor is categorized according to the phase it belongs to, and the probability value of the factor is calculated. In this study,
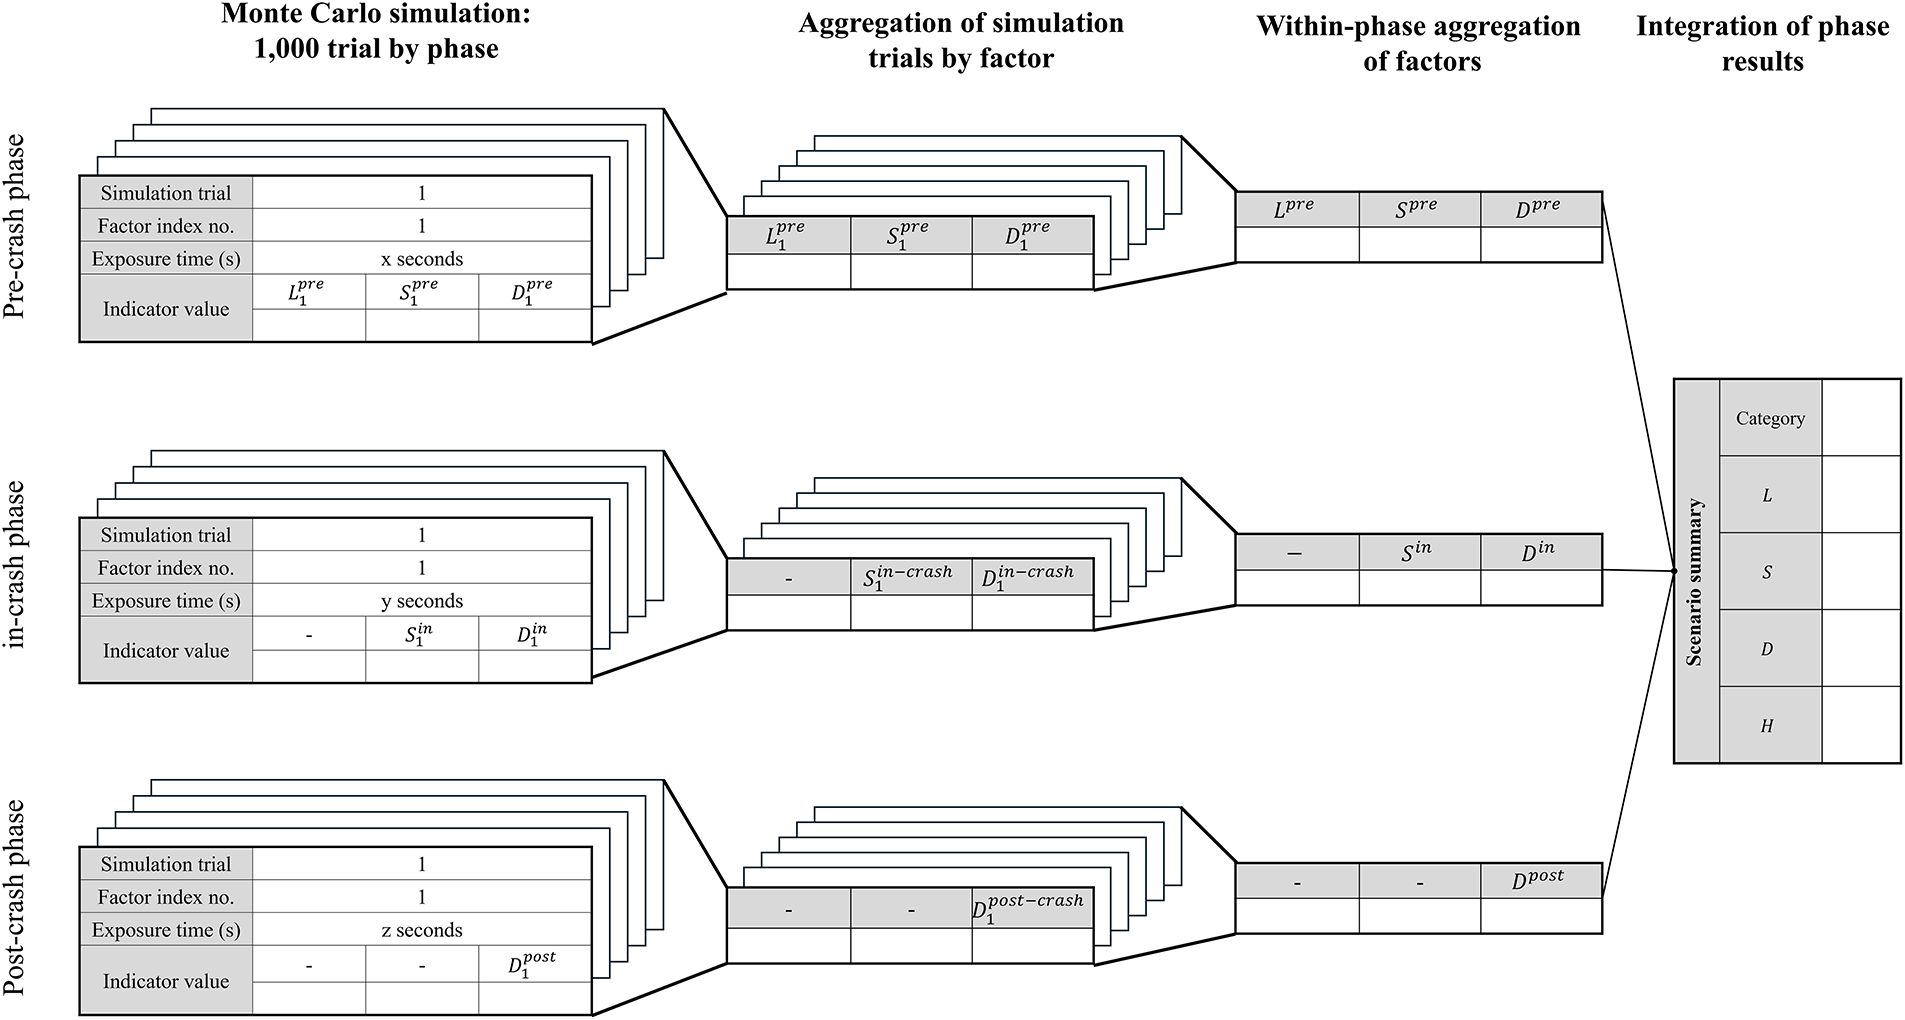
Figure 4: Inserting probability values
4.2 LHH Case: Cyber-Attack Scenario
The LHH case is an edge-case type with low probability of occurrence, high severity, and high duration. This study implemented F-TAVA based on the cyber attack scenarios presented in the previous study [21]. The probabilities assigned to the scenarios are presented in Table 3, and the results of F-TAVA analysis are presented in Fig. 5.
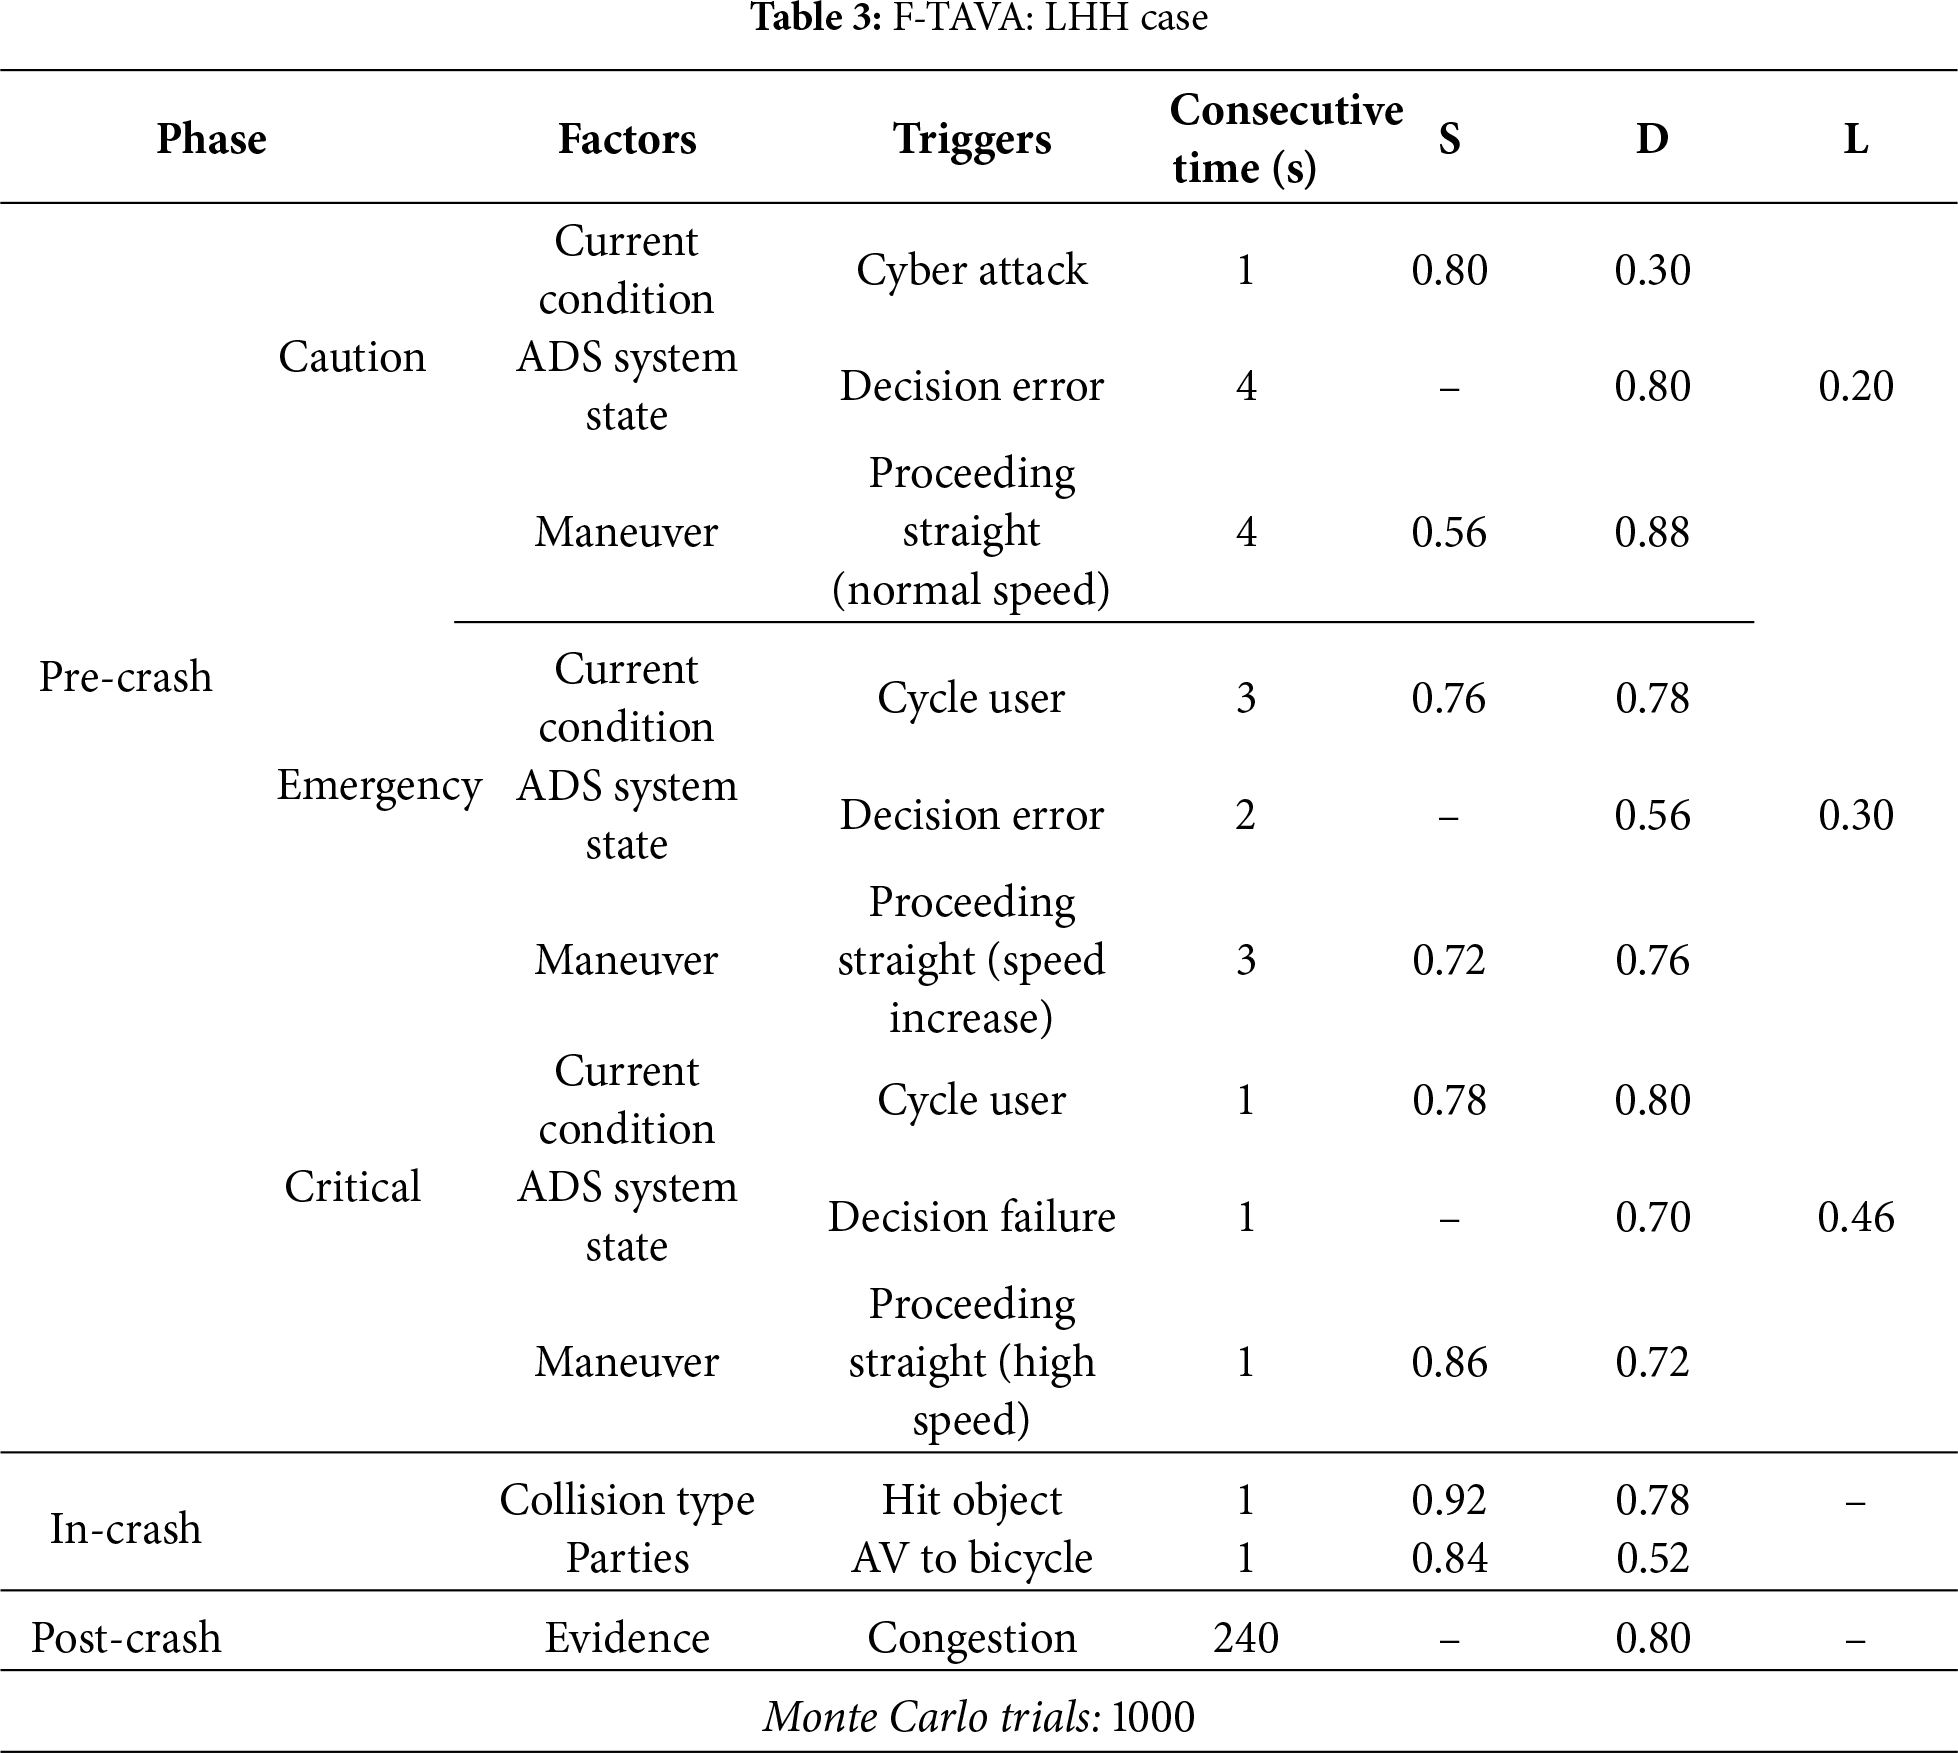
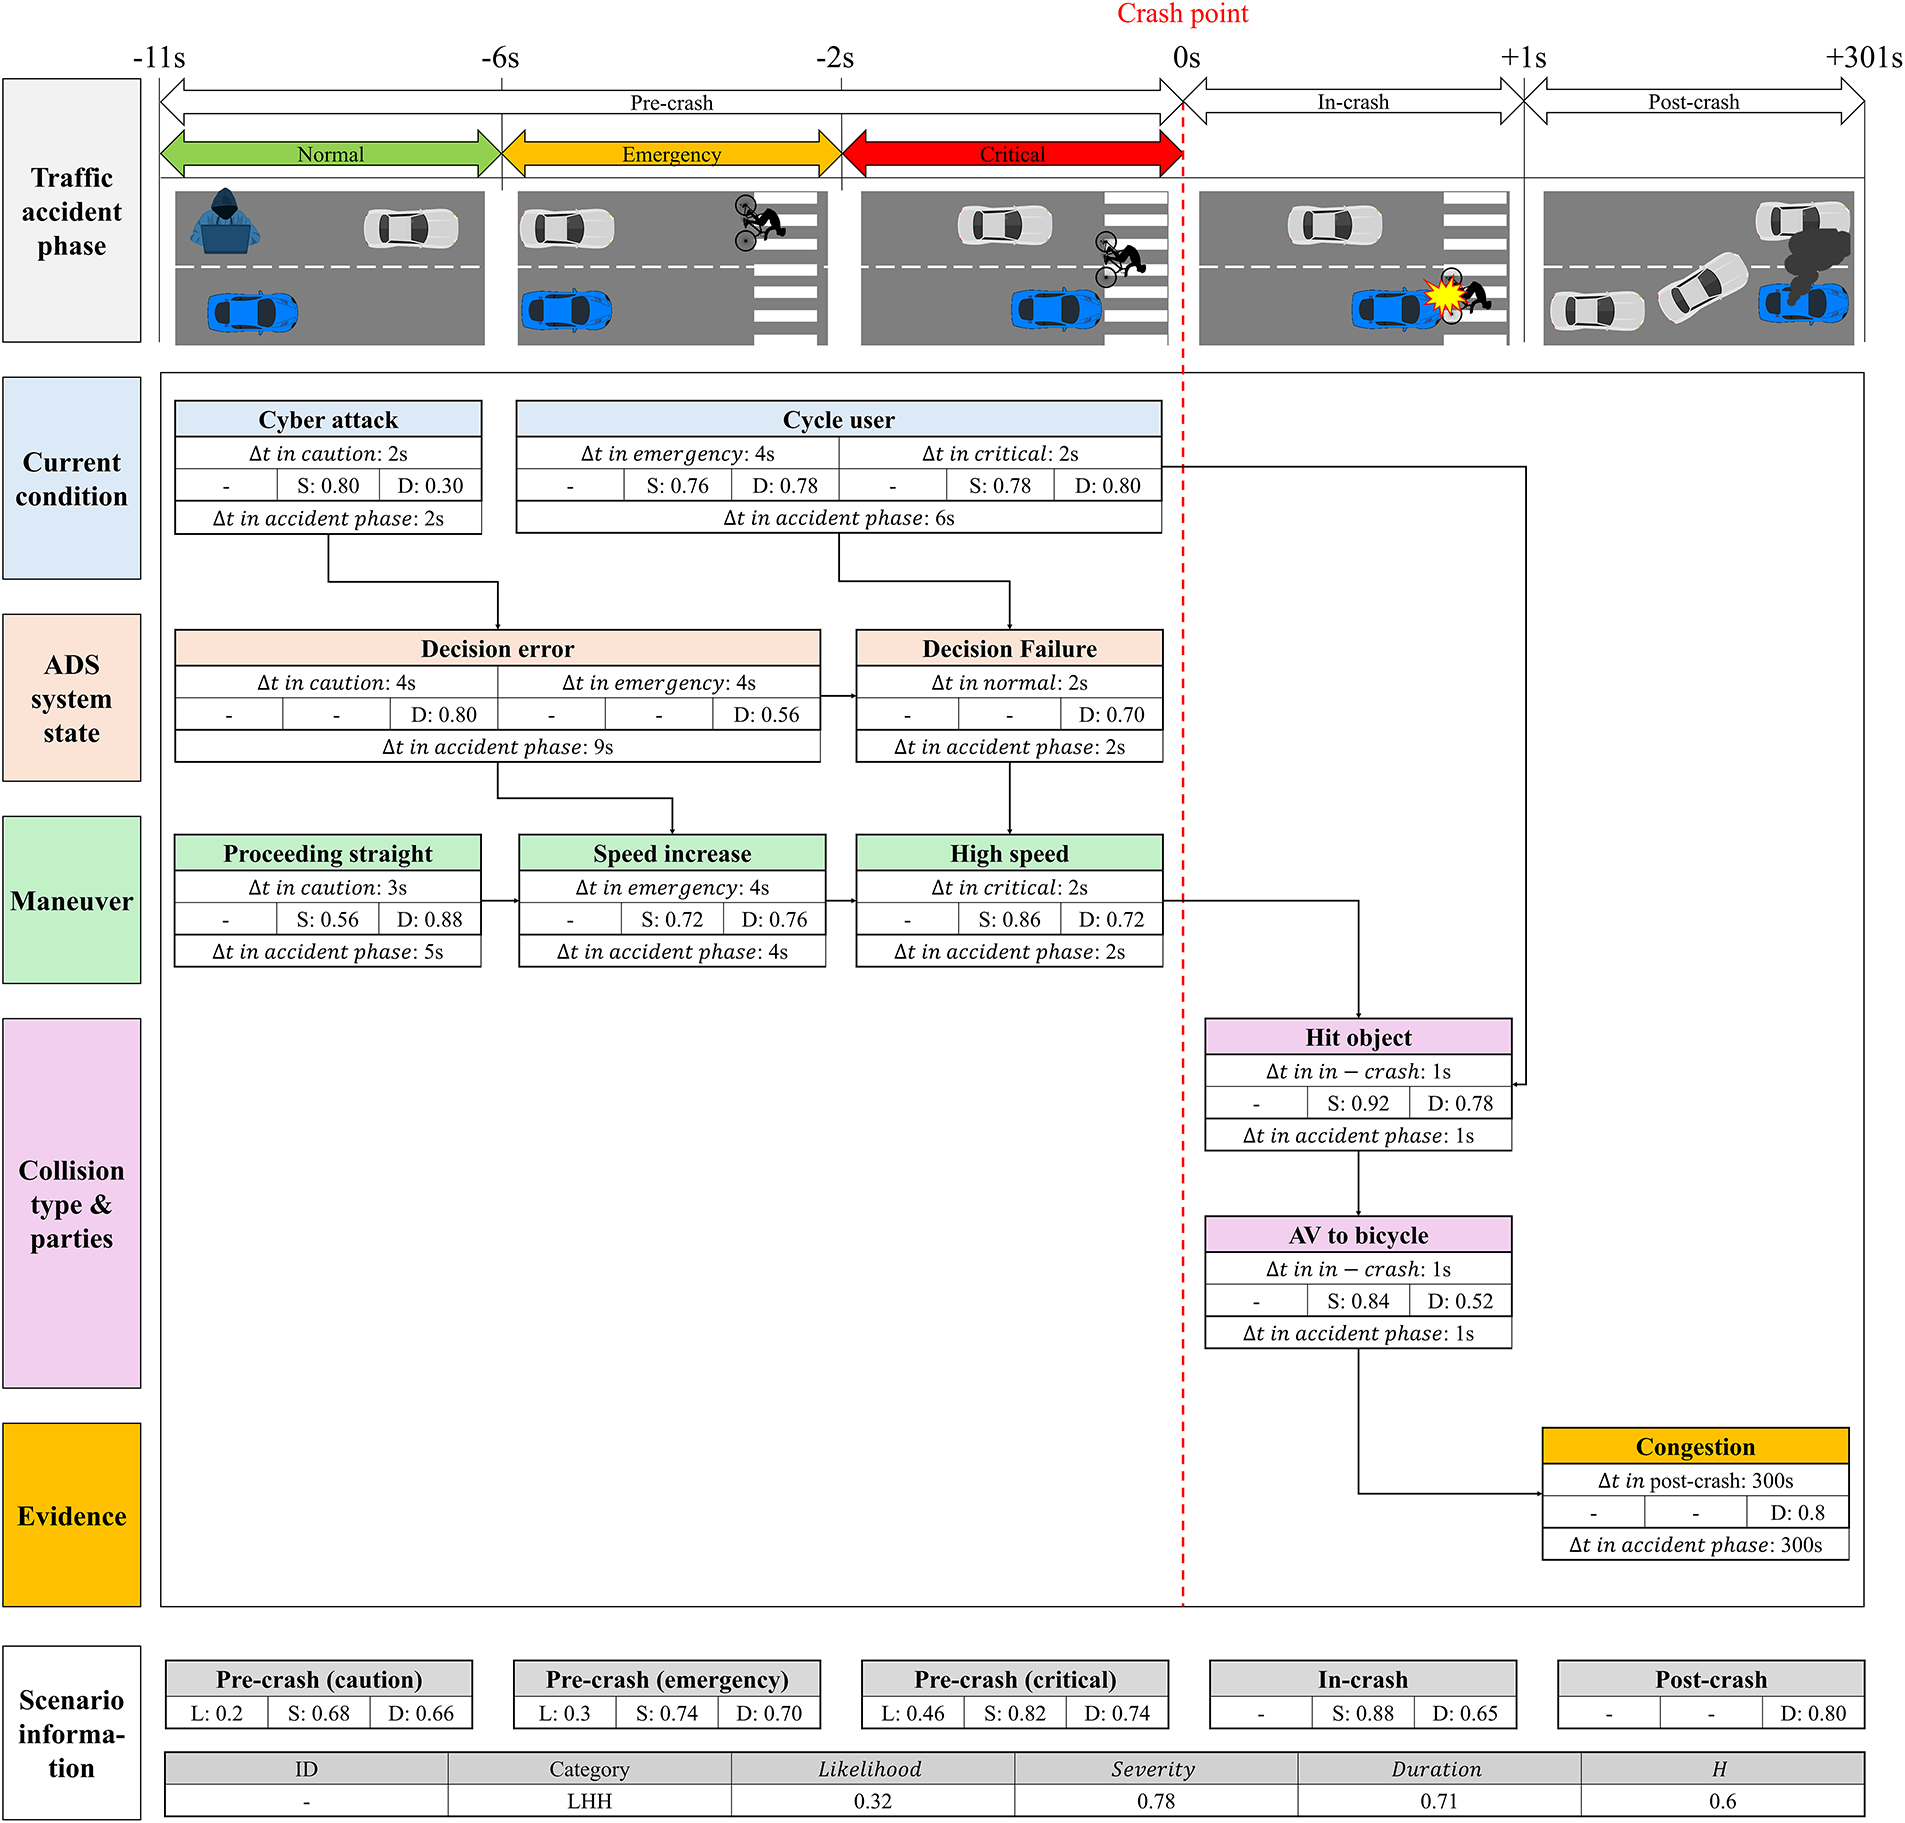
Figure 5: F-TAVA: LHH case
The scenario starts with the caution zone at
The emergency zone starts when the cycle user appears on the road (
The critical zone starts when the cycle user enters within the minimum stopping distance of the AV (
The in-crash phase starts when the AV and cycle user collide (
The post-crash phase starts at the point where the AV stops after the crash (
The HHH type is a critical high-risk case characterized by high values of all three indicators. In this study, F-TAVA was implemented based on the scenario of a chain-reaction accident in a tunnel presented in a previous study [47]. The probabilities assigned to the scenarios are presented in Table 4, and the F-TAVA analysis results are shown in Fig. 6. The results of the scenario analysis are described below.
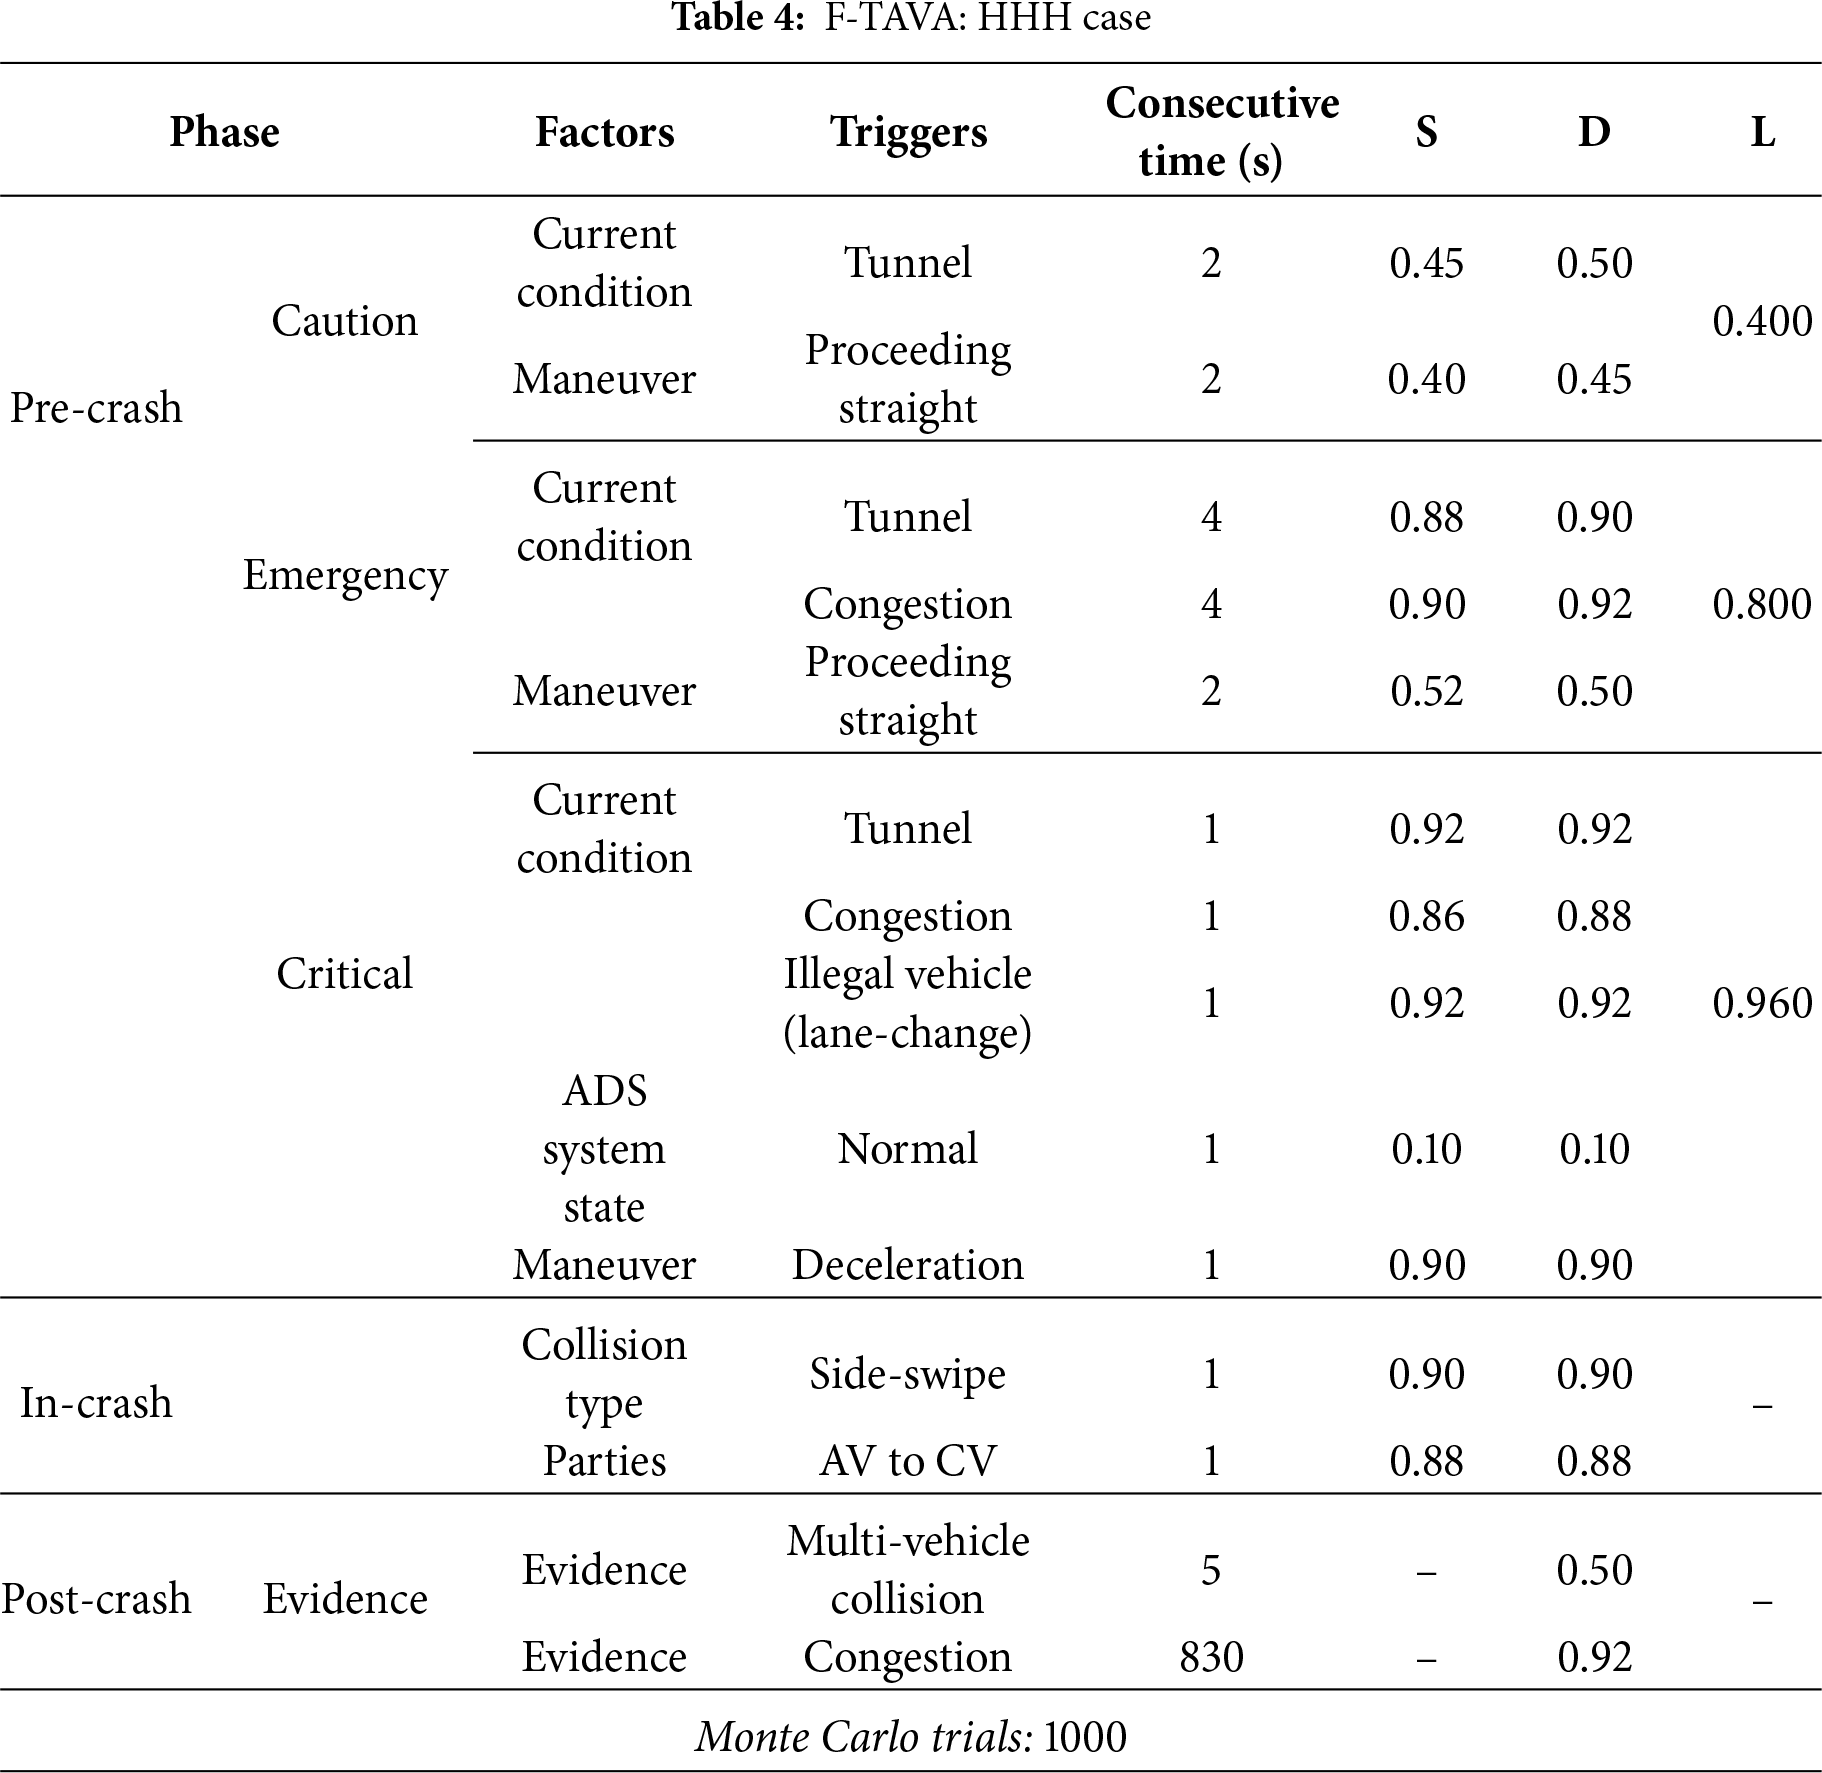
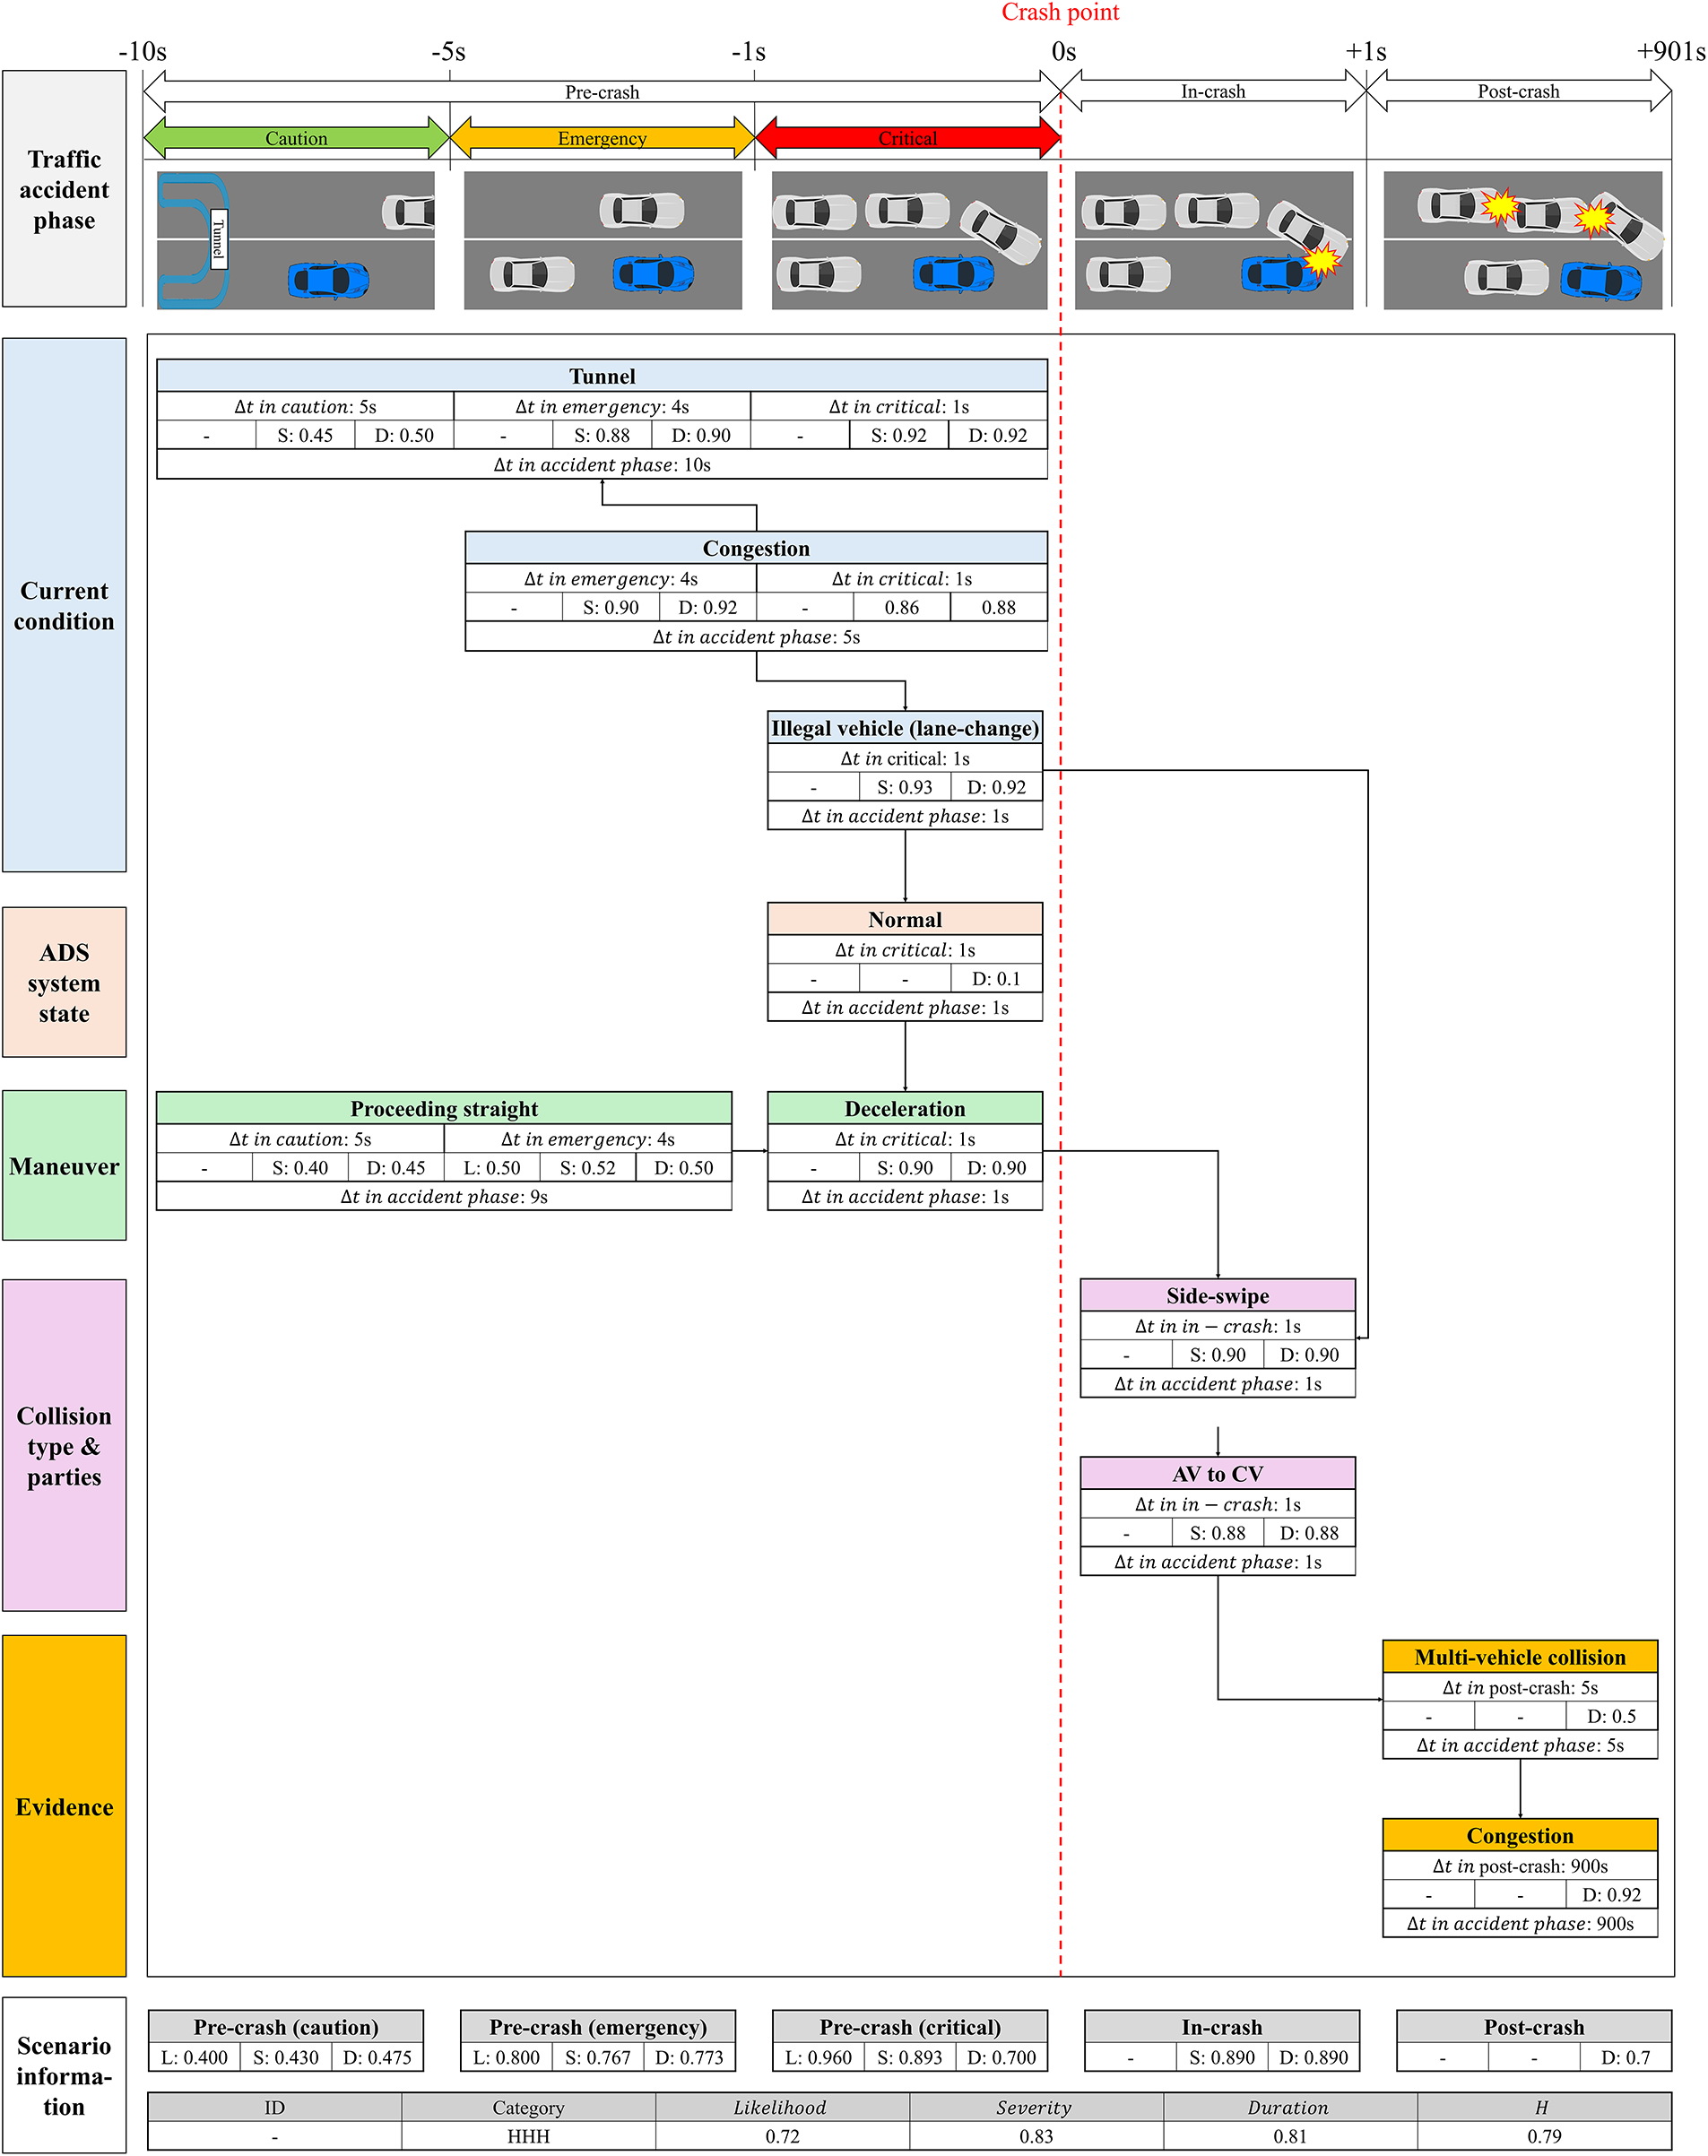
Figure 6: F-TAVA: HHH case
The scenario starts with the caution zone at the point in time when the AV enters the tunnel (
The emergency zone starts at
The critical zone starts at
The in-crash phase starts at the time when the AV and the illegal vehicle collide (
The post-crash phase starts at the point where AV stops after the crash (
Previous studies primarily defined high-risk situations for AVs based on a single indicator. The use of a single indicator failed to adequately reflect the various potential risk factors that interact in complex ways in real-world road environments, ultimately revealing limitations by simplifying the understanding of hazardous situations. To overcome these limitations, this study defines high-risk situations by structurally integrating three indicators: probability, severity, and duration. The proposed framework enables quantitative analysis of the key factor combinations contributing to high-risk situations and the risk level of the situation itself. It also allows for the identification of potential factors that are difficult to detect using conventional accident investigation systems. Furthermore, the framework is designed to enable time-series dynamic analysis incorporating multiple factors. This structure allows identification of which factors amplify risk in each accident phase and how the impact of these factors transfers to subsequent phases. In addition, the framework includes elements difficult to address within traditional traffic accident investigation systems, such as cyber-attacks and ADS functions, within its scope of cause tracing. This extended scope enables more comprehensive diagnosis of traffic accident causes based on factor-specific contribution levels and AV–environment interactions. Finally, practical application of the framework requires prior establishment of a real-time continuous loading system for DSSAD (Data Storage System for Automated Driving) data.
Nevertheless, there are several limitations. First, the proposed indicators relied on a scenario-based discrete approach rather than probability density function-based estimation using actual road driving data. While this approach is advantageous for ensuring practicality, it has limitations in reflecting continuous probability structures. Furthermore, Monte Carlo simulation enables stable estimation under virtual conditions but has limitations in achieving the probabilistic precision obtained from real data-based learning. In addition, the threshold value (
Acknowledgement: None.
Funding Statement: This work was supported by the Korea Institute of Police Technology (No.: RS-2024-00405603).
Author Contributions: Conceptualization, Heesoo Kim and Tai-jin Song; methodology, Heesoo Kim; writing—original draft preparation, Heesoo Kim; writing—review and editing, Soongbong Lee and Tai-jin Song; visualization, Minwook Kim and Hyorim Han; supervision, Tai-jin Song; project administration, Tai-jin Song. All authors reviewed the results and approved the final version of the manuscript.
Availability of Data and Materials: None.
Ethics Approval: Not applicable.
Conflicts of Interest: The authors declare no conflicts of interest to report regarding the present study.
References
1. Wang J, Zhang L, Huang Y, Zhao J. Safety of autonomous vehicles. J Adv Transp. 2020;2020(1):8867757. doi:10.1155/2020/8867757. [Google Scholar] [CrossRef]
2. Bathla G, Bhadane K, Singh RK, Kumar R, Aluvalu R, Krishnamurthi R, et al. Autonomous vehicles and intelligent automation: applications, challenges, and opportunities. Mob Inf Syst. 2022;2022(1):7632892. doi:10.1155/2022/7632892. [Google Scholar] [CrossRef]
3. Nascimento AM, Vismari LF, Molina CBST, Cugnasca PSC, Camargo JB, de Almeida JR, et al. A systematic literature review about the impact of artificial intelligence on autonomous vehicle safety. IEEE Trans Intell Transp Syst. 2019;21(12):4928–46. doi:10.1109/tits.2019.2949915. [Google Scholar] [CrossRef]
4. Kim H, Han H, You Y, Cho MJ, Hong J, Song TJ. A comprehensive traffic accident investigation system for identifying causes of the accident involving events with autonomous vehicle. J Adv Transp. 2024;2024(1):9966310. doi:10.1155/2024/9966310. [Google Scholar] [CrossRef]
5. Hevelke A, Nida-Rümelin J. Responsibility for crashes of autonomous vehicles: an ethical analysis. Sci Eng Ethics. 2015;21(3):619–30. doi:10.1007/s11948-014-9565-5. [Google Scholar] [PubMed] [CrossRef]
6. Chikaraishi M, Khan D, Yasuda B, Fujiwara A. Risk perception and social acceptability of autonomous vehicles: a case study in Hiroshima, Japan. Transp Policy. 2020;98(6293):105–15. doi:10.1016/j.tranpol.2020.05.014. [Google Scholar] [CrossRef]
7. Mariani R. An overview of autonomous vehicles safety. In: 2018 IEEE International Reliability Physics Symposium (IRPS). Piscataway, NJ, USA: IEEE; 2018. p. 6A.1-1–6. [Google Scholar]
8. Pierson A, Schwarting W, Karaman S, Rus D. Learning risk level set parameters from data sets for safer driving. In: 2019 IEEE Intelligent Vehicles Symposium (IV). Piscataway, NJ, USA: IEEE; 2019. p. 273–80. [Google Scholar]
9. Ren D, Huang H, Li Y, Jin J. High-risk test scenario generation for autonomous vehicles at roundabouts using naturalistic driving data. Appl Sci. 2025;15(8):4505. doi:10.3390/app15084505. [Google Scholar] [CrossRef]
10. Zhao J, Du D, Yu X, Li H. Risk scenario generation for autonomous driving systems based on causal bayesian networks. arXiv:2405.16063. 2024. [Google Scholar]
11. Wang D, Fu W, Song Q, Zhou J. Potential risk assessment for safe driving of autonomous vehicles under occluded vision. Sci Rep. 2022;12(1):4981. doi:10.1038/s41598-022-08810-z. [Google Scholar] [PubMed] [CrossRef]
12. Kim H, Kim M, Lee S, Song T. Identifying potential risk factors for autonomous vehicles using LLM models: focusing on a convergent approach to interpreting collision reports and driving videos. J Korean Soc Intell Transp Syst. 2025;24(1):250–66. [Google Scholar]
13. Zaker M, Blom HA, Soudjani S, Lavaei A. Rare collision risk estimation of autonomous vehicles with multi-agent situation awareness. arXiv:2405.01011. 2024. [Google Scholar]
14. Kuo PF, Hsu WT, Lord D, Putra IGB. Classification of autonomous vehicle crash severity: solving the problems of imbalanced datasets and small sample size. Accid Anal Prev. 2024;205(1):107666. doi:10.1016/j.aap.2024.107666. [Google Scholar] [PubMed] [CrossRef]
15. Song Y, Chitturi MV, Noyce DA. Automated vehicle crash sequences: patterns and potential uses in safety testing. Accid Anal Prev. 2021;153(1):106017. doi:10.1016/j.aap.2021.106017. [Google Scholar] [PubMed] [CrossRef]
16. Park S, So J, Ko H, Jeong H, Yun I. Development of safety evaluation scenarios for autonomous vehicle tests using 5-layer format (case of the community road). J Korea Inst Intell Transp Syst. 2019;18(2):114–28. doi:10.12815/kits.2019.18.2.114. [Google Scholar] [CrossRef]
17. So JJ, Park I, Wee J, Park S, Yun I. Generating traffic safety test scenarios for automated vehicles using a big data technique. KSCE J Civ Eng. 2019;23(6):2702–12. doi:10.1007/s12205-019-1287-4. [Google Scholar] [CrossRef]
18. Fremont DJ, Kim E, Pant YV, Seshia SA, Acharya A, Bruso X, et al. Formal scenario-based testing of autonomous vehicles: from simulation to the real world. In: 2020 IEEE 23rd International Conference on Intelligent Transportation Systems (ITSC). Piscataway, NJ, USA: IEEE; 2020. p. 1–8. [Google Scholar]
19. Li Y, Wang X, Wang T, Liu Q. Characteristics analysis of autonomous vehicle pre-crash scenarios. arXiv:2502.20789. 2025. [Google Scholar]
20. Kim H, You Y, Han H, Cho M, Song T. Traffic accidents scenarios based on autonomous vehicle functional safety systems. J Korea Inst Intell Transp Syst. 2023;22(6):264–83. doi:10.12815/kits.2023.22.6.264. [Google Scholar] [CrossRef]
21. Girdhar M, Hong J, Lee H, Song TJ. Hidden markov models-based anomaly correlations for the cyber-physical security of EV charging stations. IEEE Trans Smart Grid. 2021;13(5):3903–14. doi:10.1109/tsg.2021.3122106. [Google Scholar] [CrossRef]
22. Li P, Zhu X, Ren Y, Tan Z, Hu W, Zhang Y, et al. Generalization of cut-in pre-crash scenarios for autonomous vehicles based on accident data. Sci Rep. 2024;14(1):17664. doi:10.1038/s41598-024-68263-4. [Google Scholar] [PubMed] [CrossRef]
23. Luo X, Wei Z, Zhang G, Huang H, Zhou R. High-risk powered two-wheelers scenarios generation for autonomous vehicle testing using WGAN. Traffic Inj Prev. 2025;26(2):243–51. doi:10.1080/15389588.2024.2399305. [Google Scholar] [PubMed] [CrossRef]
24. Zhou R, Zhang G, Huang H, Wei Z, Zhou H, Jin J, et al. How would autonomous vehicles behave in real-world crash scenarios? Accid Anal Prev. 2024;202(3):107572. doi:10.1016/j.aap.2024.107572. [Google Scholar] [PubMed] [CrossRef]
25. Rustagi N, Kumar A, Norbu L, Vyas D. Applying haddon matrix for evaluation of road crash victims in Delhi, India. Indian J Surg. 2018;80(5):479–87. doi:10.1007/s12262-017-1632-0. [Google Scholar] [CrossRef]
26. ISO. 2021 [cited 2025 Dec 12]. Available from: https://www.iso.org/standard/43464.html. [Google Scholar]
27. DMV. 2021 [cited 2025 Dec 12]. Available from: https://www.dmv.ca.gov/portal/. [Google Scholar]
28. Kim H, Lee C, Kim M, Cho M, Song T. HMM-based approach to tracking the cause of autonomous vehicle accidents. J Korea Inst Intell Transp Syst. 2025;24(2):135–50. doi:10.12815/kits.2025.24.2.135. [Google Scholar] [CrossRef]
29. Korea Road Traffic Authority (KoROAD). Social cost of road traffic accidents in 2022: statistical analysis report. Seoul, Republic of Korea: KoROAD Press; 2024. [Google Scholar]
30. Waernbaum I, Pazzagli L. Model misspecification and bias for inverse probability weighting estimators of average causal effects. Biom J. 2023;65(2):2100118. doi:10.1002/bimj.202100118. [Google Scholar] [PubMed] [CrossRef]
31. Moradloo N, Mahdinia I, Khattak AJ. Safety in higher level automated vehicles: investigating edge cases in crashes of vehicles equipped with automated driving systems. Accid Anal Prev. 2024;203(2):107607. doi:10.1016/j.aap.2024.107607. [Google Scholar] [PubMed] [CrossRef]
32. Zhang Z, Lu S, Xie L, Su H, Li D, Wang Q, et al. A guaranteed collision-free trajectory planning method for autonomous parking. IET Intell Transp Syst. 2021;15(2):331–43. doi:10.1049/itr2.12028. [Google Scholar] [CrossRef]
33. Kutela B, Dzinyela R, Haule H, Sheykhfard A, Msechu K. Leveraging autonomous vehicles crash narratives to understand the patterns of parking-related crashes. Traffic Saf Res. 2023;4:e000033. doi:10.55329/fiqq8731. [Google Scholar] [CrossRef]
34. ALTurki M, Ratrout NT, Al-Sghan I. Impact of autonomous vehicles on the performance of a signalized intersection under different mixed traffic conditions: a simulation-based investigation. J Appl Eng Sci. 2023;21(1):224–40. doi:10.5937/jaes0-39994. [Google Scholar] [CrossRef]
35. Hargrove D. Tesla ‘phantom braking’ could endanger drivers and those following them [Internet]. 2023 [cited 2025 Dec 12]. Available from: https://www.cbs8.com/article/news/investigations/tesla-phantom-braking-san-diego/509-8210ebb9-ba44-4def-bb99-642d7e60cc77. [Google Scholar]
36. Cai J, Liu Y, Li Z. A speed optimization model for connected and autonomous vehicles at expressway tunnel entrance under mixed traffic environment. PLoS One. 2024;19(12):e0314044. doi:10.1371/journal.pone.0314044. [Google Scholar] [PubMed] [CrossRef]
37. Marshall A. False positives: self-driving cars and the agony of knowing what matters [Internet]. 2018 [cited 2025 Dec 12]. Available from: https://www.wired.com/story/self-driving-cars-uber-crash-false-positive-negative/. [Google Scholar]
38. Wham Baam Teslacam. Tesla autopilot vs bad drivers—25 crashes, fails & saves | Teslacam stories #63 [Video]. 2021 [cited 2025 Dec 12]. Available from: https://www.youtube.com/watch?v=QZ7vziuw420. [Google Scholar]
39. Mutha Trucker–Official Trucking Channel. Alleged whistle blower shares raw video of self driving semi truck crashing into median [Video]. 2022 [cited 2025 Dec 12]. Available from: https://www.youtube.com/@MuthaTrucker. [Google Scholar]
40. Forestieri K. Self-driving car struck by red-light runner [Internet]. 2016 [cited 2025 Dec 12]. Available from: https://www.mv-voice.com/news/2016/09/25/self-driving-car-struck-by-red-light-runner. [Google Scholar]
41. National Highway Traffic Safety Administration. Preliminary evaluation—PE22-002: phantom braking in tesla model 3/Y vehicles. Washington, DC, USA: U.S. Department of Transportation; 2022. [Google Scholar]
42. DMV. Disengagement reports. 2021 [cited 2025 Dec 12]. Available from: https://www.dmv.ca.gov/portal/vehicle-industry-services/autonomous-vehicles/disengagement-reports/. [Google Scholar]
43. Shepardson D. Amazon’s robotaxi unit Zoox agrees recall over braking issue [Internet]. 2025 [cited 2025 Dec 12]. Available from: https://www.reuters.com/business/autos-transportation/amazons-robotaxi-unit-zoox-recalls-258-vehicles-over-unexpected-braking-issue-2025-03-19/. [Google Scholar]
44. National Highway Traffic Safety Administration. Part 573 safety recall report 23E 029: cruise AV collision with articulated bus due to ADS prediction error. 2023 [cited 2025 Dec 12]. Available from: https://static.nhtsa.gov/odi/rcl/2023/RMISC-23E029-7453.pdf. [Google Scholar]
45. Kurup AM, Bos JP. Winter adverse driving dataset for autonomy in inclement winter weather. Opt Eng. 2023;62(3):031207. doi:10.1117/1.oe.62.3.031207. [Google Scholar] [CrossRef]
46. National Transportation Safety Board. Collision between vehicle controlled by developmental automated driving system and pedestrian, Tempe, Arizona, March 18, 2018 (Highway Accident Report NTSB/HAR 19/03). 2019 [cited 2025 Dec 12]. Available from: https://www.ntsb.gov/investigations/AccidentReports/Reports/HAR1903.pdf. [Google Scholar]
47. Noyes D. New video of Bay Bridge 8-car crash shows Tesla abruptly braking in ‘self-driving’ mode [Internet]. 2022 [cited 2025 Dec 12]. Available from: https://www.nbcbayarea.com/. [Google Scholar]
48. Hepeng Z, Quan Q. Fast collision probability estimation based on finite-dimensional monte carlo method. arXiv:2003.03973. 2020. [Google Scholar]
49. Li N, Chen L, Huang Y. Research on specific scenario generation methods for autonomous driving simulation tests. World Electr Veh J. 2023;15(1):2. doi:10.3390/wevj15010002. [Google Scholar] [CrossRef]
Cite This Article
 Copyright © 2026 The Author(s). Published by Tech Science Press.
This work is licensed under a Creative Commons Attribution 4.0 International License , which permits unrestricted use, distribution, and reproduction in any medium, provided the original work is properly cited.
 Downloads
 Citation Tools