
 Submit a Paper
 Propose a Special lssue
 Open Access
ARTICLE
Prediction of Wall Thickness Parameters in TPMS Models Based on CNN-SVM and MLR
1 School of Mechanical Engineering, Sichuan University of Science and Engineering, Zigong, China
2 Intelligent Perception and Control Key Laboratory of Sichuan Province, Yibin, China
3 Chengdu Zhengheng Auto Parts Co., Ltd., Chengdu, China
4 School of Automation and Information Engineering, Sichuan University of Science and Engineering, Zigong, China
* Corresponding Author: Xu Zhan. Email:
(This article belongs to the Special Issue: Additive Manufacturing: Advances in Computational Modeling and Simulation)
Computers, Materials & Continua 2026, 87(2), 16 https://doi.org/10.32604/cmc.2026.074939
Received 22 October 2025; Accepted 23 January 2026; Issue published 12 March 2026
 View Full Text
 Download PDF
Abstract
Triply periodic minimal surface (TPMS) structures are widely utilized in engineering and biomedical fields owing to their superior mechanical and functional properties. However, limited by the current additive manufacturing (AM) techniques, insufficient wall thickness often leads to poor forming quality or even printing failure. Therefore, accurate prediction of wall thickness parameters during the design stage is essential. This study proposes a prediction approach for the wall thickness parameters of TPMS models by integrating a Convolutional Neural Network–Support Vector Regression (CNN-SVM) framework with Multiple Linear Regression (MLR). A total of 152 TPMS models were randomly generated, resulting in 912 sets of sample data. Voxel-based sampling and rasterization preprocessing were employed to prepare the data for model input. The CNN-SVM model was developed using TPMS type, lattice filling type, volume fraction, and cell length as input features, with wall thickness as the output variable. Subsequently, the MLR method was applied to quantify the influence weights of these parameters. Experimental results demonstrate that the CNN-SVM model achieves a mean squared error (MSE) of 0.0011 and a coefficient of determination (R2) of 0.92. Approximately 86.9% of the test samples exhibited prediction errors within 20%, representing performance improvements of 15.8%, 10.6%, and 18.5% over traditional MLR, CNN, and SVM models, respectively. The MLR analysis further indicates that the Sheet filling type exerts the most significant positive effect on wall thickness (0.45729), whereas the Diamond TPMS structure shows the most prominent negative impact (−0.23494). The proposed hybrid model provides an effective and reliable strategy for predicting wall thickness parameters in TPMS-based additive manufacturing designs.Keywords
Triply Periodic Minimal Surface (TPMS) structures are a class of lattice geometries characterized by unique topological and geometrical features. Owing to their superior mechanical and functional properties, they have been extensively applied in mechanical engineering, materials science, physics, and biomedical fields [1]. Additive Manufacturing (AM) has overcome the processing limitations of conventional manufacturing methods for fabricating complex lattice architectures and has become the primary technique for producing TPMS-based structures. However, due to the inherent differences among AM processes, various technical constraints may lead to defects such as structural collapse, un-melted powder, and shrinkage-induced porosity. Among these, structural collapse is one of the primary factors determining whether a part can be successfully printed [2]. The wall thickness parameter of a TPMS lattice is closely related to its printability [3], adjusting the design parameters to increase wall thickness can effectively prevent printing failure caused by insufficient thickness, provide self-support during fabrication, and reduce warping or deformation at the end of the printing process, thereby minimizing the occurrence of structural collapse [4]. It is noteworthy that different AM processes exhibit significant variations in the minimum achievable wall thickness [5]. For instance, commercial Fused Deposition Modeling (FDM) printers typically achieve a minimum wall thickness of 0.4–0.8 mm [6], while Stereolithography (SLA), owing to its higher resolution, can reach approximately 0.1 mm or even finer [7]. In contrast, Selective Laser Sintering (SLS) generally produces parts with a minimum wall thickness no less than 0.8 mm in certain polymer or metallic powders [8]. Therefore, investigating the wall thickness parameters of TPMS lattices under various design conditions, establishing predictive models, and adjusting design parameters to increase wall thickness are of great significance and practical value for improving the manufacturing success rate of TPMS lattices in AM applications. However, determining wall thickness through analytical or rule-based approaches remains challenging due to the nonlinear geometric characteristics of TPMS structures, suggesting the potential value of data-driven prediction methods.
To date, extensive research has been conducted by scholars worldwide on TPMS, AM, and ML. Hu et al. [9] systematically reviewed the research progress on predicting the mechanical properties of additively manufactured materials and components, emphasizing representative achievements of ML models in forecasting tensile and fatigue fracture properties. Ma et al. [10] innovatively proposed a voxel-based geometric characterization method for TPMS lattices by introducing entropy vectors, and employed a Support Vector Machine (SVM) regression algorithm to achieve accurate predictions of the elastic modulus and yield strength of TPMS structures. Wu et al. [11] developed a prediction model based on a U-Net neural network to quantitatively predict bone growth behavior after TPMS porous scaffold implantation, and further combined optimization algorithms to enhance the osseointegration performance of TPMS lattice structures. Ibrahimi et al. [12] integrated finite element analysis (FEA) with image processing techniques to systematically quantify key parameters such as lattice mechanical properties, morphological characteristics, and permeability. By incorporating multidimensional design parameters into linear and nonlinear ML models for comparative analysis, they demonstrated that nonlinear models yield higher prediction accuracy and successfully achieved inverse design of TPMS scaffolds based on predictive data. Collectively, existing machine-learning studies on TPMS lattices have achieved substantial progress in predicting performance-related metrics, confirming the feasibility of employing TPMS morphological data as effective model inputs. However, these efforts overwhelmingly focus on mechanical, transport, or biological properties, while largely overlooked the geometric parameters that directly govern additive-manufacturing feasibility. In particular, wall thickness—despite its fundamental influence on printability and fabrication success—has rarely been incorporated as a prediction target in current ML-driven TPMS research. This indicates that the significance of wall-thickness prediction has not yet been fully acknowledged by the community, leaving a critical methodological gap unresolved. To address this issue, the present study introduces a machine-learning framework dedicated to predicting wall-thickness parameters, thereby providing an essential manufacturability-oriented complement to existing TPMS modeling approaches.
In this context, this study proposes a novel method for predicting the wall thickness parameters of 3D-printed samples with different TPMS structures. A comprehensive database of TPMS lattice wall thickness parameters was established through geometric modeling, and a prediction model was subsequently developed by introducing a Convolutional Neural Network–Support Vector Machine (CNN-SVM) algorithm to capture the relationship between lattice features, design parameters, and wall thickness. The proposed model demonstrated excellent predictive performance in experiments, providing a new perspective and methodology for TPMS wall thickness parameter prediction. Compared with conventional analytical or empirical formula-based approaches, machine learning algorithms exhibit distinctive advantages in predicting the wall thickness parameters of specific models, particularly when handling many design variations, where they can determine optimal wall thickness values with significantly improved efficiency.
2 TPMS Model Construction and Wall Thickness Parameters
2.1 Construction of TPMS Models
TPMS structures are defined by implicit functions. Common TPMS types include I-WP, Neovius, F-RD, Gyroid, Primitive, and Diamond surfaces. Among them, the Gyroid structure possesses a smooth and continuous surface with excellent self-supporting characteristics; the Primitive structure exhibits cubic symmetry; and the Diamond structure features a high specific surface area and complex connectivity. Owing to these distinctive advantages, these three TPMS types are more widely applied in engineering and biomedical fields. Their mathematical representations are given in Eqs. (1)–(3) [13], where c denotes a constant used to control the level-set threshold. By thickening or filling the isosurface defined by the implicit function, corresponding TPMS lattice structures can be generated.
The geometry of a TPMS model can be controlled through its implicit function; however, due to the structural complexity of TPMS surfaces, conventional modeling methods are generally inapplicable. Common software tools for TPMS modeling include MATLAB, nTop, MSLattice [14], Flatt Pack [15], and RegionTPMS [16]. In this study, the focus is placed on the wall thickness parameters of homogeneous TPMS lattice models. Therefore, due to its high efficiency in model construction, the Uniform TPMS Lattices–Cuboid module in the MSLattice software was selected, and the corresponding structural parameters were obtained through direct geometric measurement of the generated models.
A total of 152 TPMS models were constructed in this study. The selected TPMS types included Gyroid, Primitive, and Diamond structures. The filling type of the TPMS lattices was categorized into two forms: Sheet-type and Skeletal-type. The primary modeling parameters of the TPMS models consisted of the volume fraction (VF) and the cell length (CellLength).
2.2 Wall Thickness Parameters of TPMS Models
All TPMS lattices in this study were modeled as cubic unit cells, and the collected data included modeling parameters such as wall thickness, pore size, volume fraction, and cell length. The TPMS samples were categorized and labeled according to their TPMS type, filling type, and cell length. For instance, a Gyroid-type lattice with Sheet filling and a cell length of 1 mm was denoted as GS1. Similarly, a Gyroid Skeletal lattice with the same cell length was labeled as GN1. The relationship between volume fraction and wall thickness for several groups is illustrated in Fig. 1.
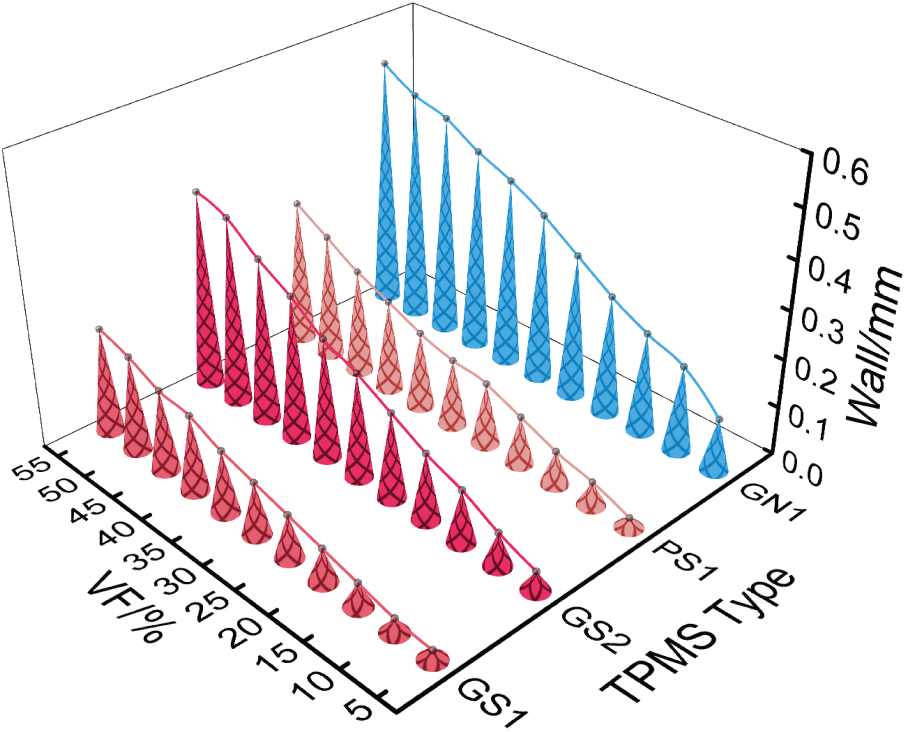
Figure 1: Relationship between volume fraction and wall thickness in several groups.
At present, the wall thickness parameter of TPMS lattices can be calculated using an analytical expression, as given in Eq. (4) [17]. In this equation, ρ* represents the volume fraction, Vcell denotes the volume of a single unit cell, and ATPMS refers to the surface area of the TPMS isosurface when the control parameter c in the implicit function is set to zero. Owing to the geometric complexity of TPMS structures, the value of ATPMS cannot be determined analytically and must instead be obtained from the modeling software after surface generation. It is also noteworthy that ATPMS varies slightly among different implicit function formulations.
From the variables in Eq. (4), it can be observed that the wall thickness parameter is essentially related to the volume fraction, the unit cell volume, and the TPMS structural type. Therefore, in this study, the TPMS type, TPMS lattice filling type, volume fraction, and cell length were selected as the input parameters for predicting the wall thickness parameters of TPMS lattices.
3 Data Preprocessing of TPMS Structures Based on Recognizability
To address the problem of wall thickness parameter prediction, this study employs a CNN-SVM hybrid algorithm to extract the geometric features and design parameters of TPMS lattices. These extracted features and parameters are then used as input variables to establish a correlation with wall thickness parameters through the proposed algorithmic model, thereby achieving accurate prediction of wall thickness for different TPMS structures.
In the construction of ML models, raw data often contain noise and missing values, making them unsuitable for direct use in model training. Therefore, data preprocessing is necessary to enhance data validity and reliability. Matrix-form datasets exhibit greater adaptability and effectiveness when processing 3D point cloud data with spatial structural features. In this study, a preprocessing framework is proposed to convert STL point cloud files into a matrix format. The process involves discretizing the point cloud to obtain regularized data, expanding the dataset through voxel-based downsampling, and enhancing data recognizability via rasterization, after which the processed data are output as a matrix representation suitable for machine learning model training.
3.1.1 Point Cloud Discretization
The STL file stores the triangular facets of a model surface as independent units, with each unit containing vertex coordinates and normal vector parameters. This independent storage results in redundant records of shared vertices between adjacent facets, leading to a large and unevenly distributed dataset of coordinated information. Therefore, point cloud discretization is performed as the first preprocessing step, since a regularized point cloud can effectively improve the efficiency of subsequent processing operations. As voxel-based downsampling is later applied to expand the point cloud dataset, the discretization process also adopts a voxelization approach.
As shown in Fig. 2a, the point information contained in an STL file only represents the outer surface of the model. Hence, an internal point cloud distribution is first generated within the model volume. Based on the model size and desired point cloud density, an appropriate voxel size is then defined to divide the point cloud space into multiple voxel cells. The points contained within each voxel are merged into a single representative voxel center, resulting in a regularly distributed and uniformly dense voxelized point cloud, as illustrated in Fig. 2b.
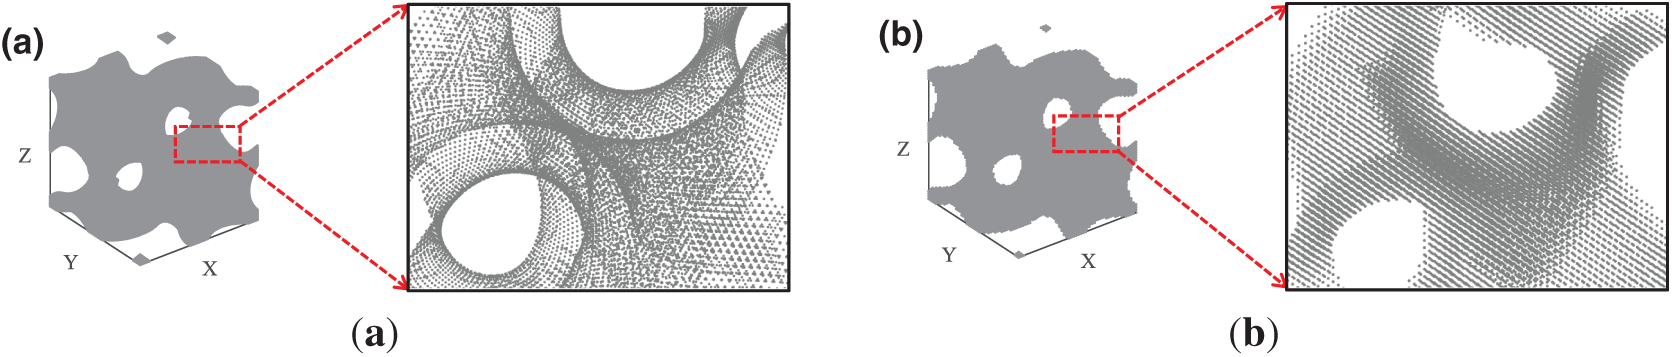
Figure 2: Point cloud discretization of the STL model: (a) original STL point cloud; (b) discretized point cloud after processing.
Because the wall thickness parameters of TPMS structures are difficult to obtain, the amount of original data is relatively limited. To address this issue, different voxel sizes were applied to simulate various spatial resolutions and perform voxel-based downsampling on the point cloud files. For each scaffold, the original point cloud was expanded into six datasets through downsampling with different voxel sizes, thereby enhancing the diversity of the training data. The visualization of point cloud data after downsampling under different voxel sizes is shown in Fig. 3.
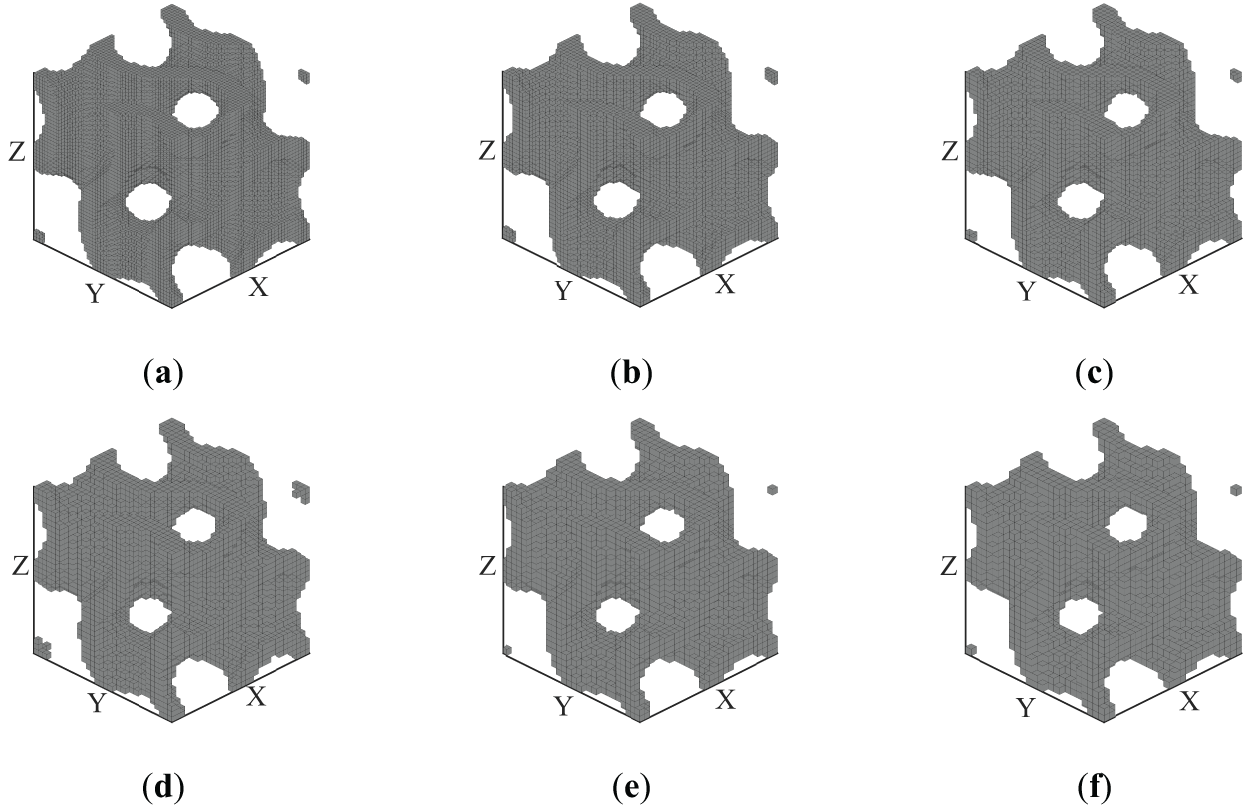
Figure 3: Point clouds after voxel downsampling with different voxel sizes: (a) 0.05 mm, (b) 0.06 mm, (c) 0.07 mm, (d) 0.08 mm, (e) 0.09 mm, and (f) 0.10 mm.
3.1.3 Rasterization Processing
The downsampled point cloud contains only discrete relative coordinate information. If it is directly modeled using point cloud network architectures such as PointNet, the feature extraction may become unstable, and it is difficult to achieve unified modeling with numerical design parameters such as cell length and volume fraction. In previous studies, Ma et al. [10] proposed an entropy vector method, in which the TPMS model is voxelized, sorted along the coordinate axes, and then vectorized. Although this approach effectively characterizes the model geometry and provides an interface for integrating numerical parameters, its one-dimensional vector representation is insufficient to capture structural differences of TPMS models at different resolutions. Consequently, it cannot support data augmentation or multiscale modeling. In contrast, a reverse 3D reconstruction-based approach can transform the TPMS model into a two-dimensional matrix representation. This transformation not only facilitates integration with numerical parameters but also provides a more structured input form for subsequent CNN-based feature extraction.
To maximize the preservation of the periodicity and continuity of TPMS structures along the three orthogonal directions, the point cloud data were projected onto the XY, YZ, and XZ planes of 3D space, producing planar point sets analogous to orthographic views of the model. Each plane was divided into 24 × 24 evenly spaced grids, within which the number of points was counted. The resulting count matrices were normalized to generate projection matrices that accurately describe the volume distribution of the model along the direction perpendicular to each projection plane. Subsequently, the three 24 × 24 projection matrices were concatenated into different regions of a composite input matrix following a predefined spatial arrangement: the XY projection matrix was placed in the upper-left region (rows 1–24, columns 1–24); the YZ projection matrix was located in the lower-left region (rows 25–48, columns 1–24); the XZ projection matrix, after orientation adjustment, was positioned on the right half of the matrix (rows 1–48, columns 25–36). The cell length and volume fraction were each expanded into matrix form and appended to the remaining regions (rows 1–48, columns 37–42 and 43–48, respectively). Finally, a 48 × 48 input matrix was constructed as the standardized representation for subsequent model training. The preprocessing workflow is illustrated in Fig. 4, and the normalization formula is given in Eq. (5).
where Xmin and Xmax represent the minimum and maximum values of the count matrix, respectively; Xi denotes the number of points in the i-th grid cell; and Xnew represents the normalized value corresponding to that grid cell.
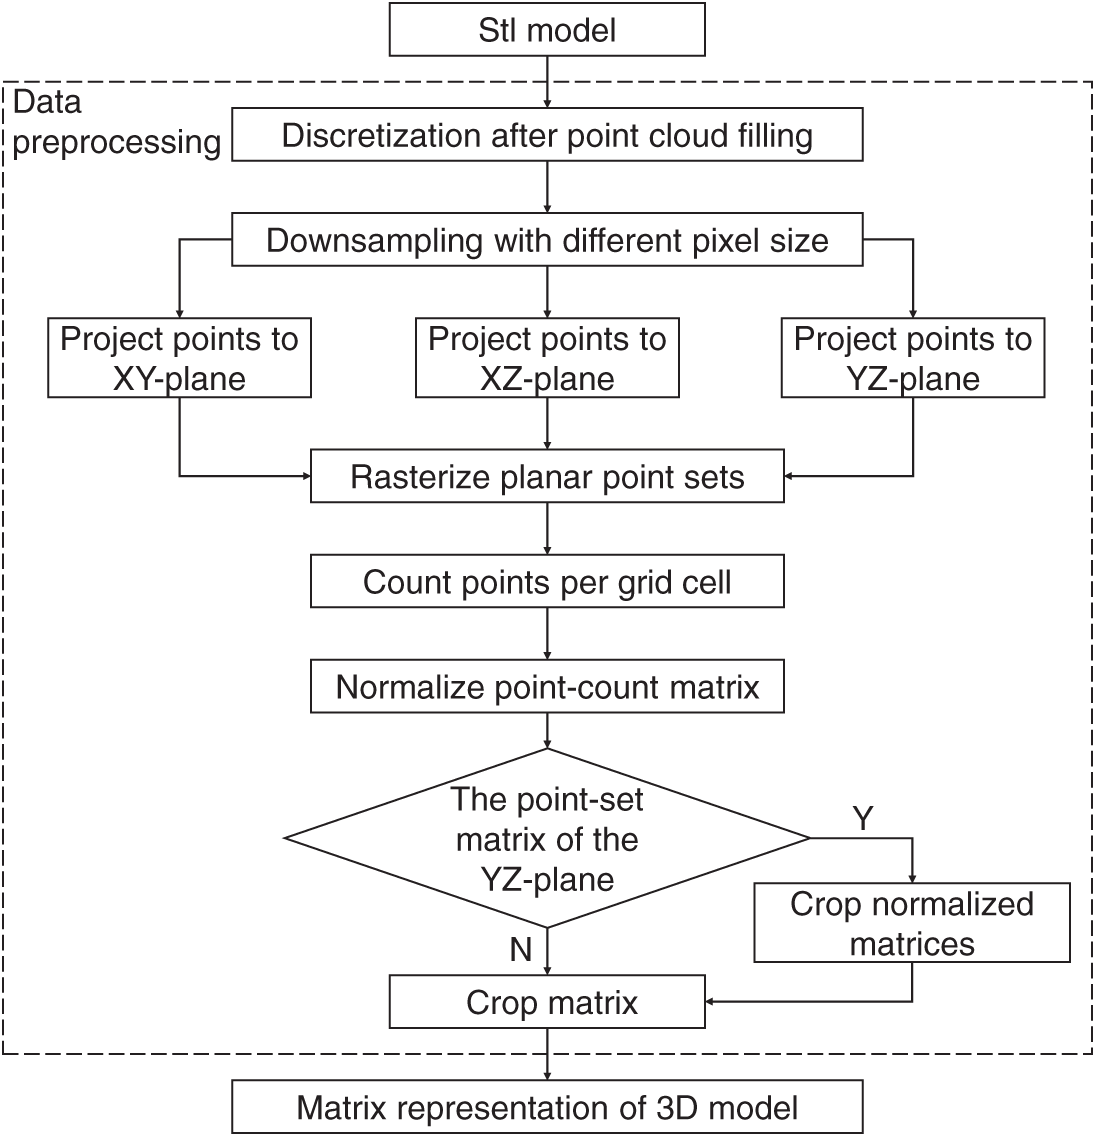
Figure 4: Data preprocessing workflow for TPMS point cloud conversion and matrix construction.
Given the significant differences in the distribution of point sets across the projection directions of different models, the resulting point set matrices can be utilized as input features for machine learning models. This method not only effectively filters out the interference of noise points but also mitigates the influence of point cloud sparsity, thereby enhancing the robustness of the model and improving classification accuracy.
Through model construction and systematic collection and processing of parameters, a wall thickness parameter dataset was established in this study. The dataset includes the TPMS type, TPMS lattice filling type, volume fraction (VF), cell length, and wall thickness parameter for 152 models. After data preprocessing and point cloud augmentation, the final dataset comprised a total of 912 samples.
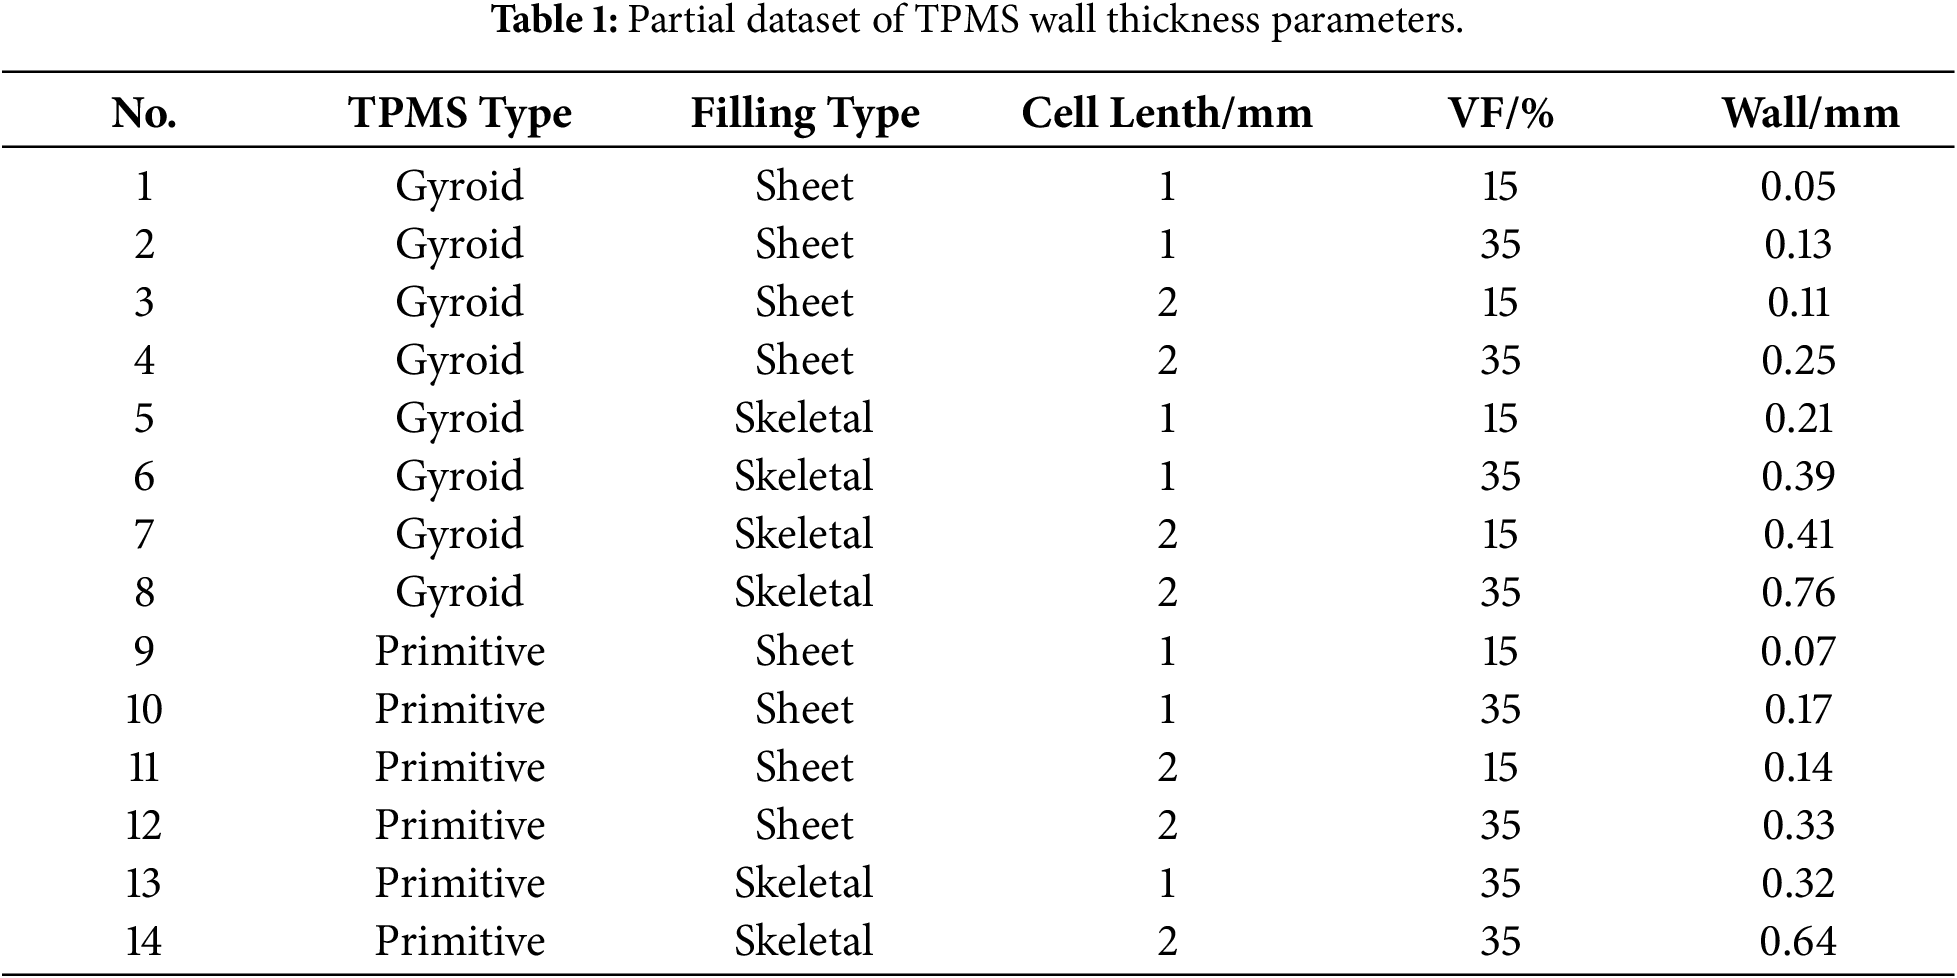
The overall distribution of wall thickness parameters in the dataset is as follows: 43 samples (28.2%) have wall thickness values of ≤0.2 mm, 58 samples (38.2%) fall within the 0.2–0.4 mm range, and 51 samples (33.6%) have values of ≥0.4 mm. The modeling parameters of representative samples with VF = 10%, 25%, and 35% are listed in Table 1.
3.2 CNN-SVM Model Construction
The CNN model is a deep learning architecture designed for feature extraction and pattern recognition, capable of efficiently capturing spatial correlations within structured data. The SVM model, on the other hand, is well suited for small-sample learning and nonlinear regression problems, providing excellent generalization capability through optimal hyperplane separation in high-dimensional feature space.
The CNN module is employed as a hierarchical feature extractor, taking preprocessed 48 × 48 matrices as input. These matrices integrate geometric projections and numerical design parameters through an early data-fusion strategy. The CNN architecture consists of multiple convolutional blocks with 3 × 3 kernels, each followed by batch normalization, ReLU activation, and max-pooling layers, enabling progressive abstraction of local-to-global structural features. The network is trained using the Adam optimizer with an initial learning rate of 3 × 10⁻⁴, a mini-batch size of 32, and a maximum of 100 epochs, while early stopping based on validation performance is adopted to mitigate overfitting.
After feature extraction, the high-level representations obtained from the fully connected layer are fed into an SVM regression module, which replaces the conventional softmax-based output layer. By performing regression in the learned feature space, the SVM enhances prediction robustness and stability, particularly under limited data conditions. As illustrated in Fig. 5, this architecture allows the CNN to effectively capture representative TPMS structural features, while the SVM ensures accurate and stable prediction performance, resulting in improved overall model reliability.
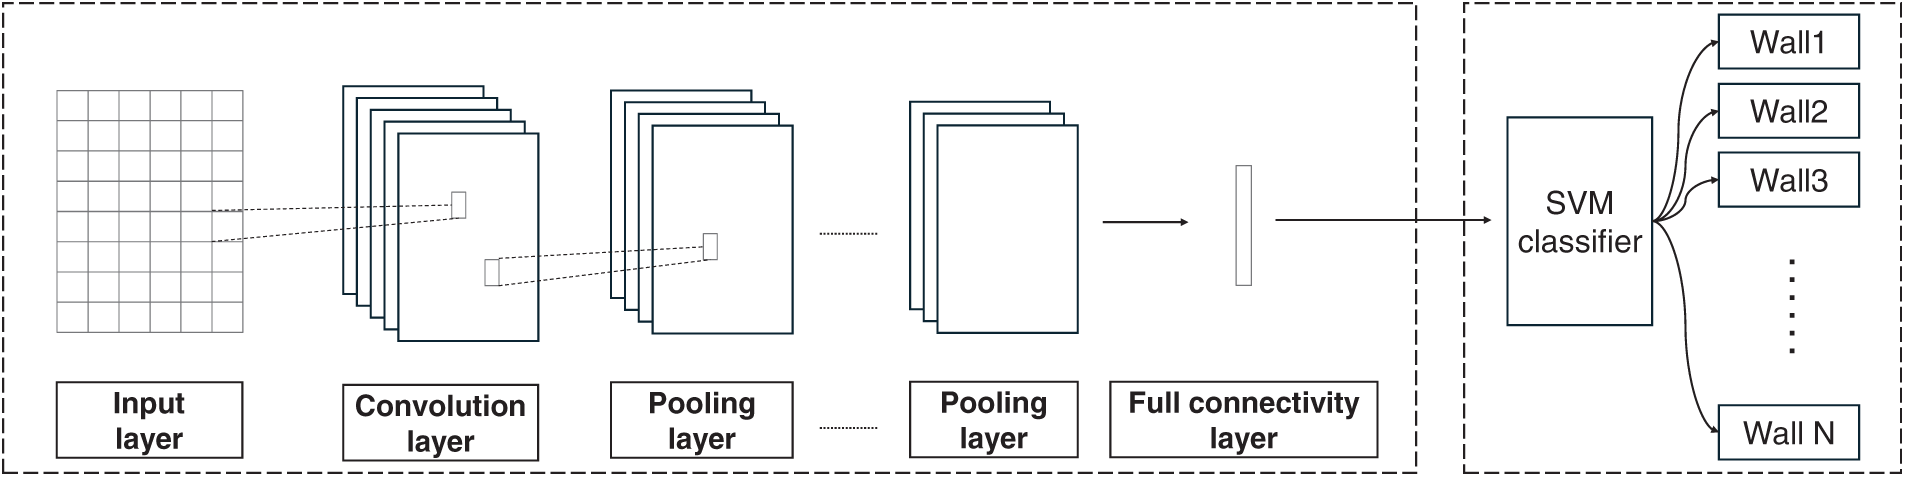
Figure 5: Structural framework of the CNN-SVM model.
3.3 Model Training and Evaluation
To ensure scientific and reliable model training, the dataset was randomly divided into a training set and a testing set with a ratio of 7:3. The training set was used to establish the prediction model, tune the hyperparameters, and obtain an optimized regression framework, while the testing set was employed to evaluate the model’s generalization performance and predictive accuracy.
Since the traditional accuracy metric for classification tasks is not applicable to regression-based parameter prediction, this study adopts the proportion of samples with a prediction error less than 20% as an alternative accuracy measure. In addition, the coefficient of determination (R2) and mean square error (MSE) were selected as the core evaluation metrics to quantify the fitting degree and prediction precision between the predicted and actual values. The value of R2 ranges from 0 to 1, where a higher value indicates better goodness of fit, while MSE is always greater than zero, with smaller values representing higher prediction accuracy. The calculation formulas of both metrics are shown below.
where YTrue represents the true values of the testing set, YPredict denotes the predicted values obtained from the model, and YTrue is the mean value of the true data in the testing set.
Multiple Linear Regression (MLR) is a widely used statistical method for analyzing the relationship between multiple independent variables and a dependent variable. The general form of the MLR equation is given in Eq. (8). In this study, MLR was employed to quantify the influence of different design parameters on the wall thickness parameter. Each regression coefficient in the model represents the contribution weight of a specific design parameter to wall thickness.
where Y is the dependent variable (wall thickness); X1, …, Xm denote the independent variables; b0, b1, …, bm are the regression coefficients to be estimated; and ε represents the random error term.
In MLR modeling, the input matrix constructed in Section 2.1 is not directly applicable due to the categorical nature of some parameters. Therefore, one-hot encoding was applied to process categorical variables. The TPMS Type, a three-class variable (Gyroid, Primitive, and Diamond), was represented by a three-dimensional binary vector: [1, 0, 0], [0, 1, 0], and [0, 0, 1], respectively. The Filling Type, a two-class variable (Sheet and Skeletal), was represented by a two-dimensional vector: [1, 0] and [0, 1], respectively.
4.1 Prediction of TPMS Wall Thickness Parameters Using the CNN-SVM Model
To verify the effectiveness of the processed point cloud matrices in representing the geometric characteristics of different structures, Fig. 6 presents the grayscale images corresponding to various TPMS structures after point cloud processing.
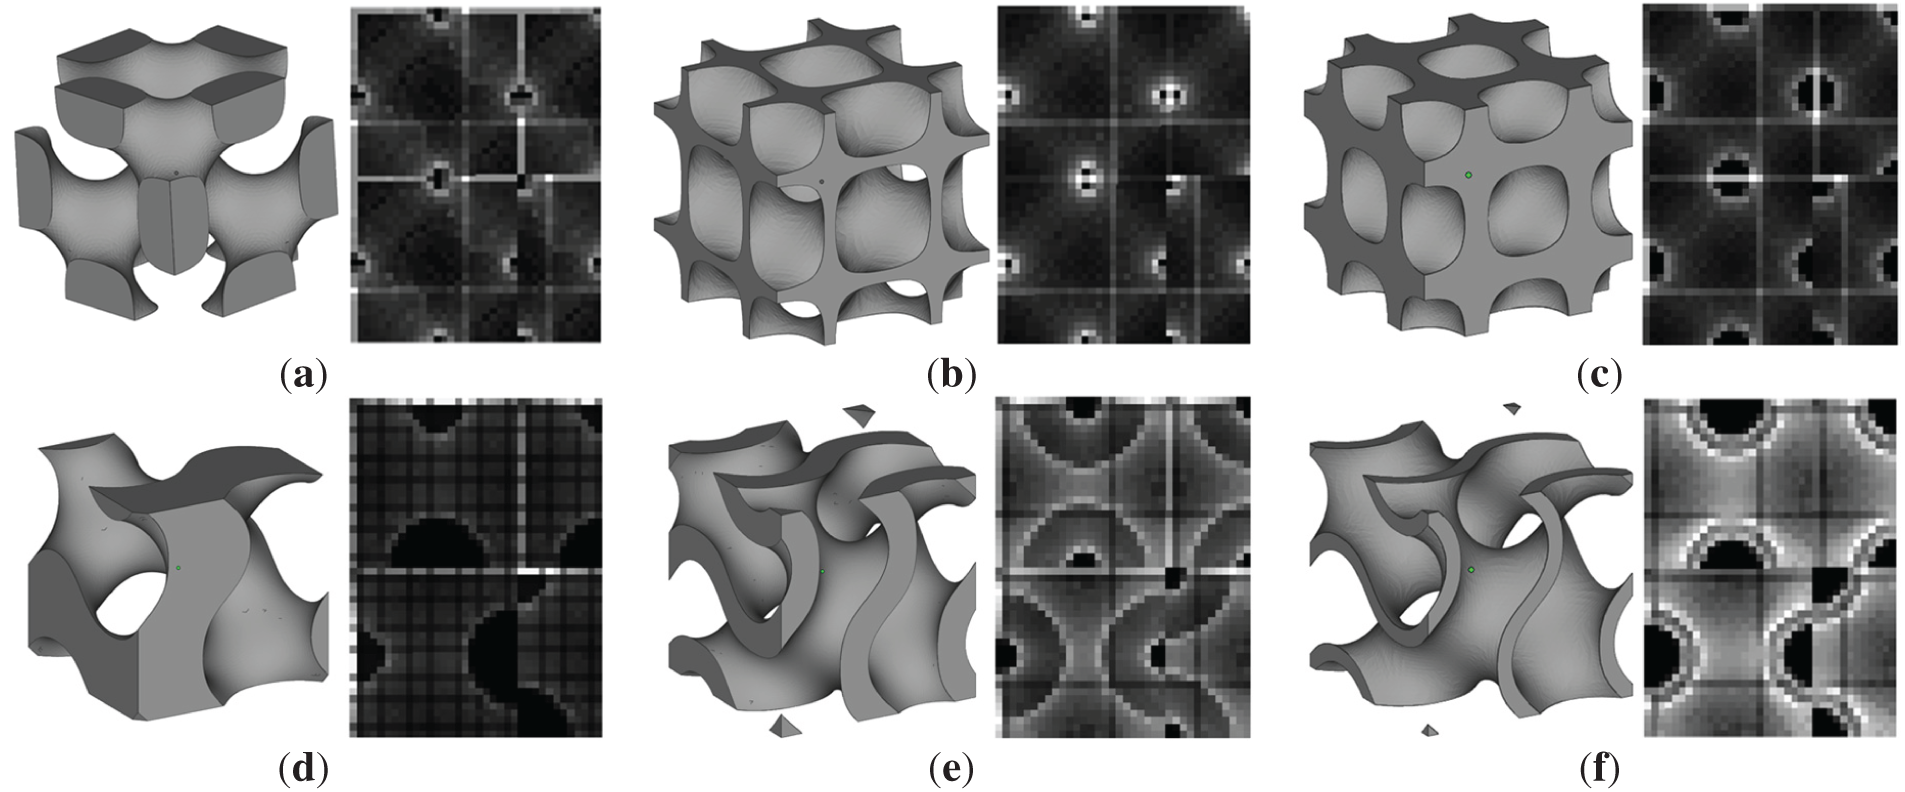
Figure 6: Grayscale representations of different TPMS structures after point cloud processing (a) DN3V40, (b) DS3V20, (c) DS3V40, (d) GN3V40, (e) GS3V40, and (f) GS2V20.
For different TPMS structures, the grayscale images exhibit significant variations in pattern and intensity distribution. In contrast, TPMS structures with identical design parameters—such as similar volume fractions or cell lengths—show comparable grayscale patterns, although subtle differences can still be observed in the blank regions. These results demonstrate that the processed matrices can effectively capture the geometric characteristics of various TPMS structures, thereby providing high-quality input features for the machine learning model.
The training process of the model is illustrated in Fig. 7, where Fig. 7a shows the model performance metrics during training, and Fig. 7b presents the loss decay curve. As observed from the figures, the performance indicators tend to stabilize around the 144th iteration, while the loss function gradually flattens after approximately 154 iterations. These results indicate that the CNN-SVM model achieves rapid convergence with a relatively small number of iterations, demonstrating stable training behavior and strong learning capability.
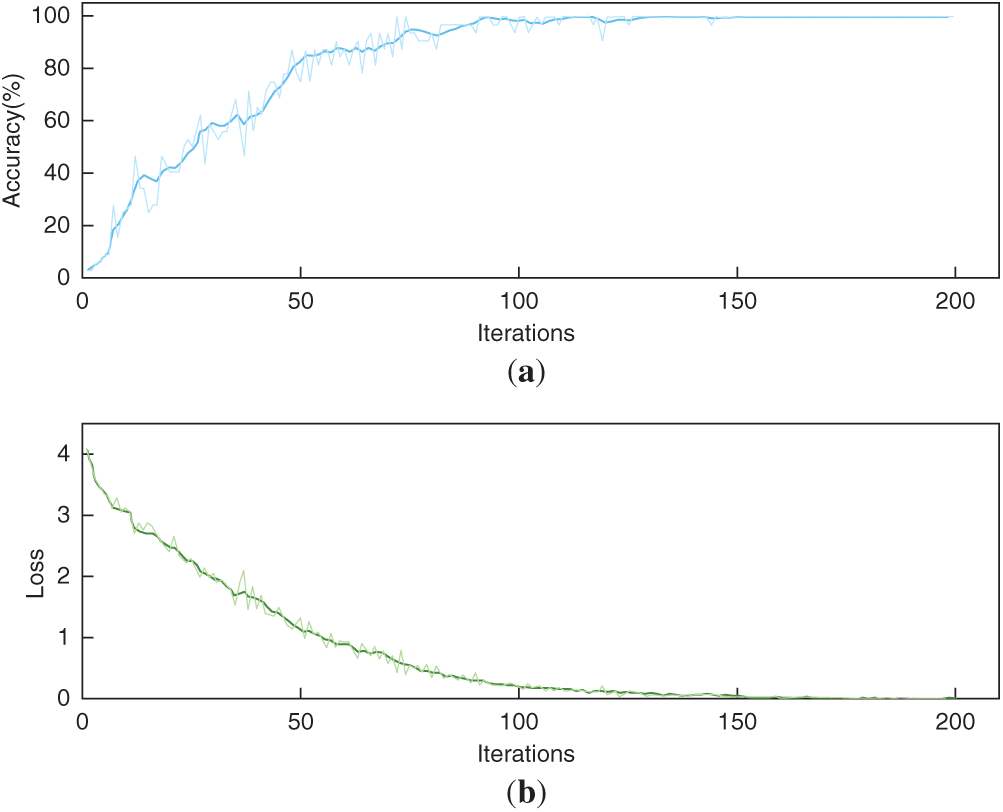
Figure 7: Training process of the CNN-SVM model: (a) training performance metrics; (b) loss decay curve.
In this experiment, not only the CNN-SVM model but also the MLR, SVM, and CNN models were constructed for performance comparison. The established dataset was imported into the MLR, SVM, and CNN models for training and testing, and the corresponding prediction results are presented in Fig. 8. The key evaluation metrics of different prediction models are summarized in Table 2.
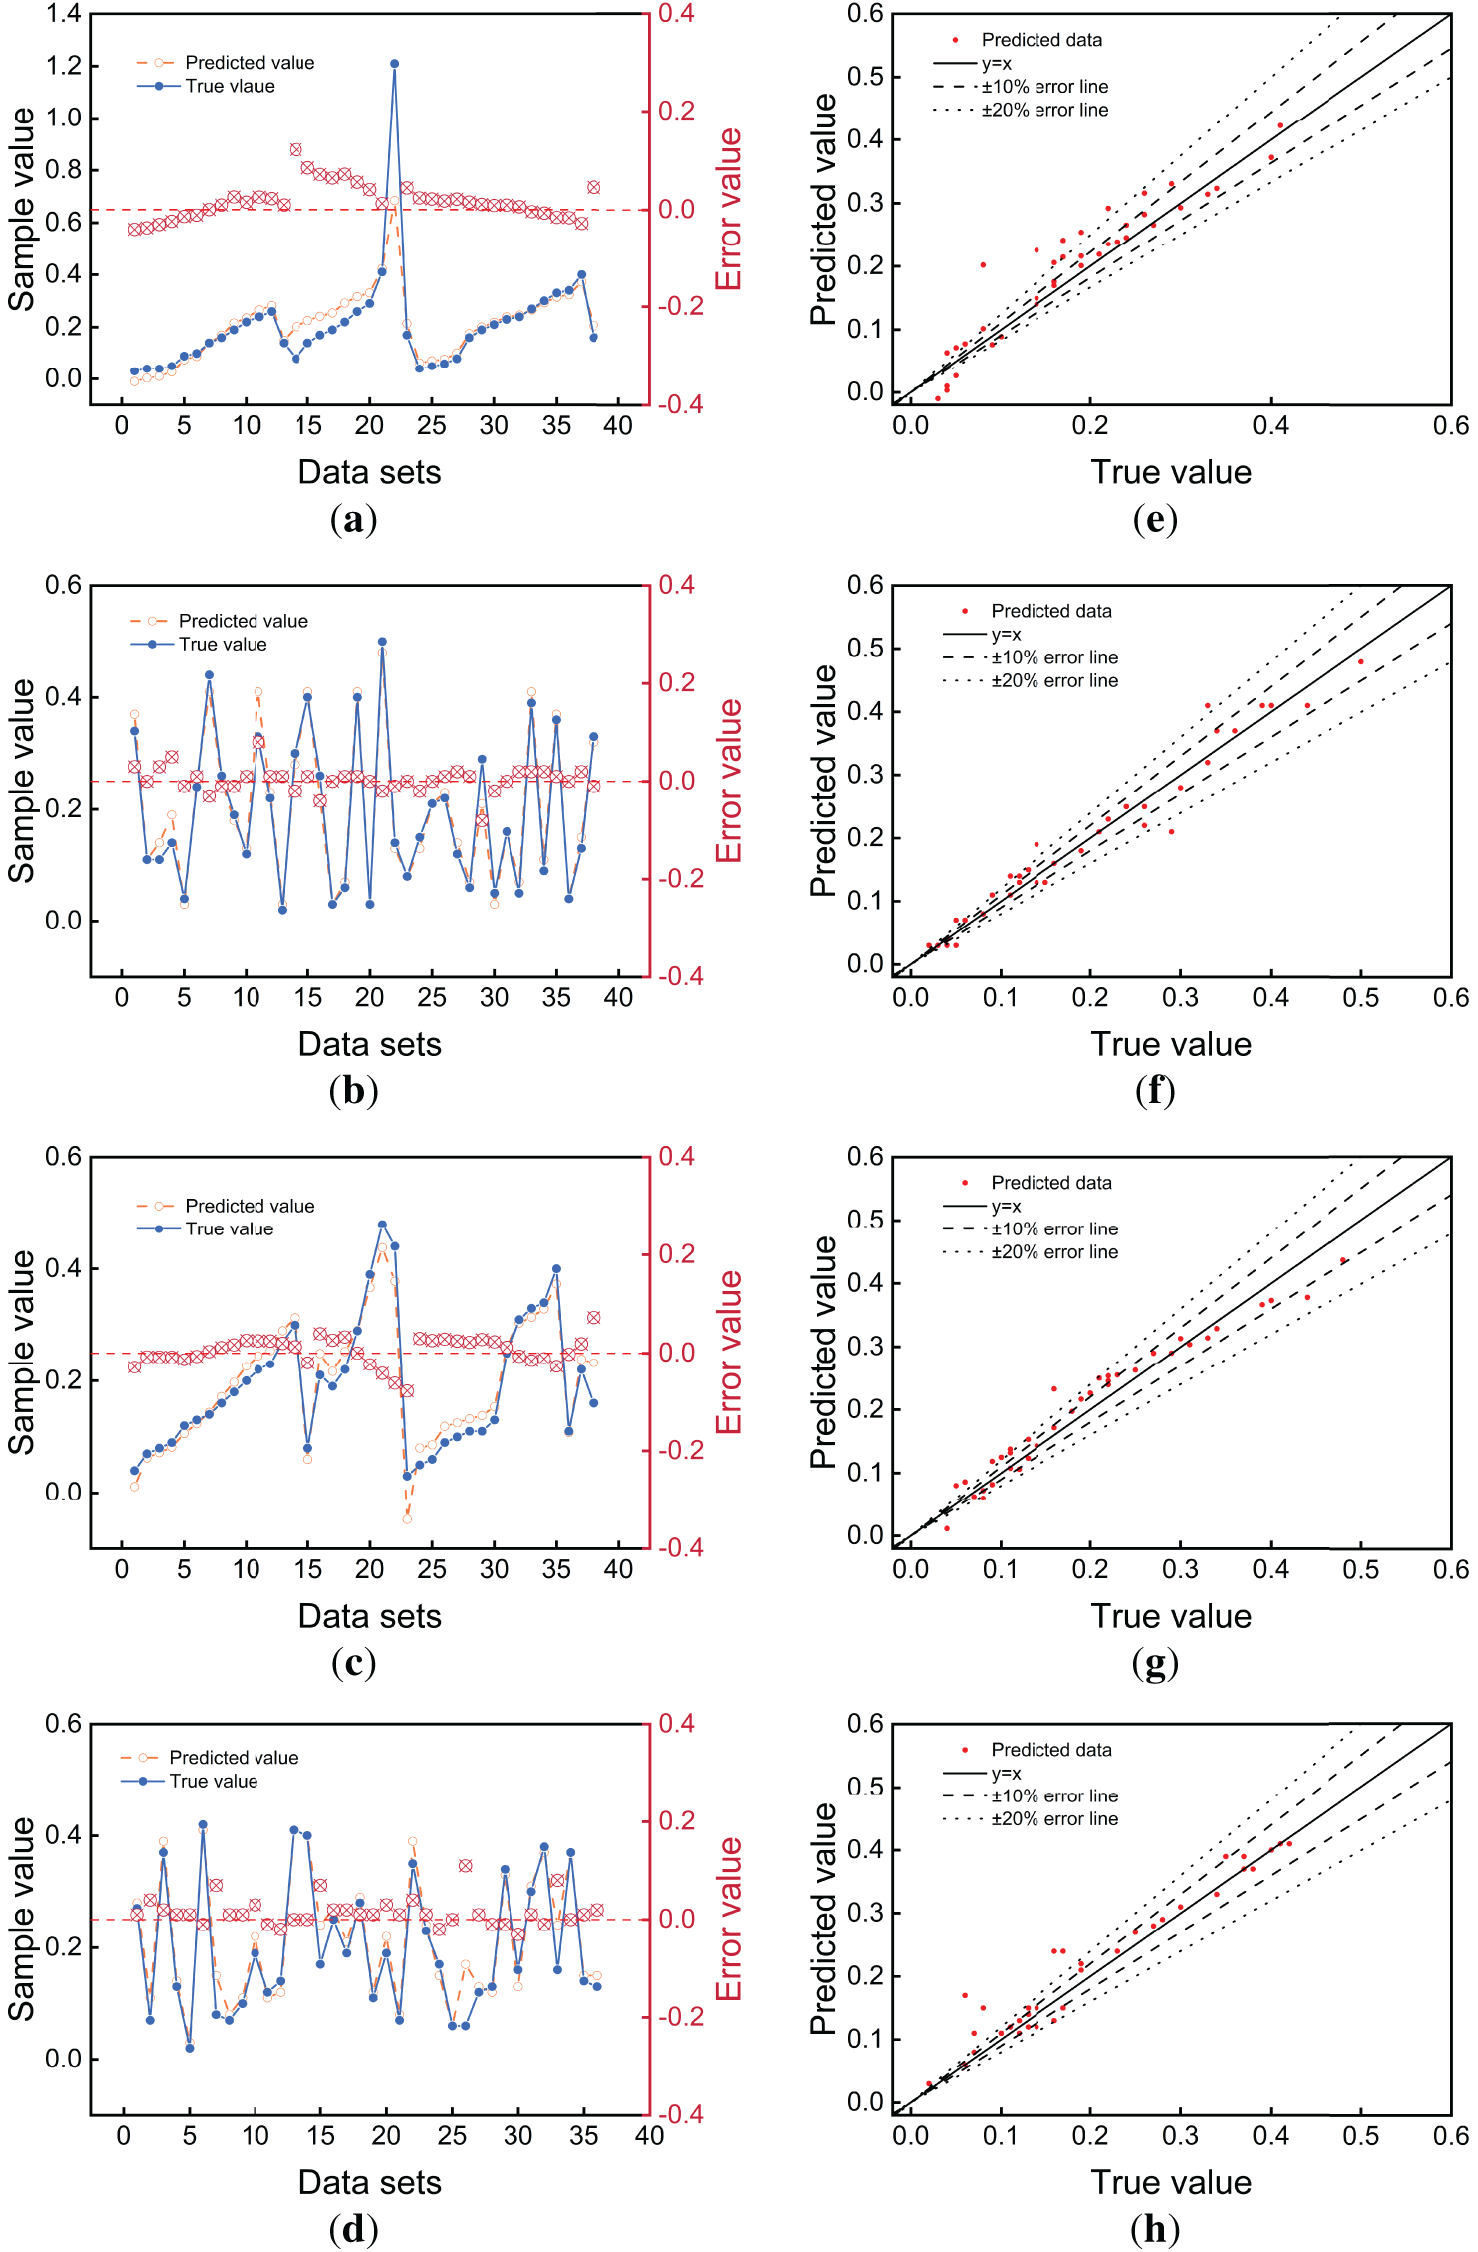
Figure 8: Comparison of model prediction results: (a) MLR, (b) CNN, (c) SVM, and (d) CNN–SVM—predicted vs. actual wall thickness values in the test set; (e) MLR, (f) CNN, (g) SVM, and (h) CNN–SVM—distributions of predicted values within ±10% and ±20% error lines in the test set.
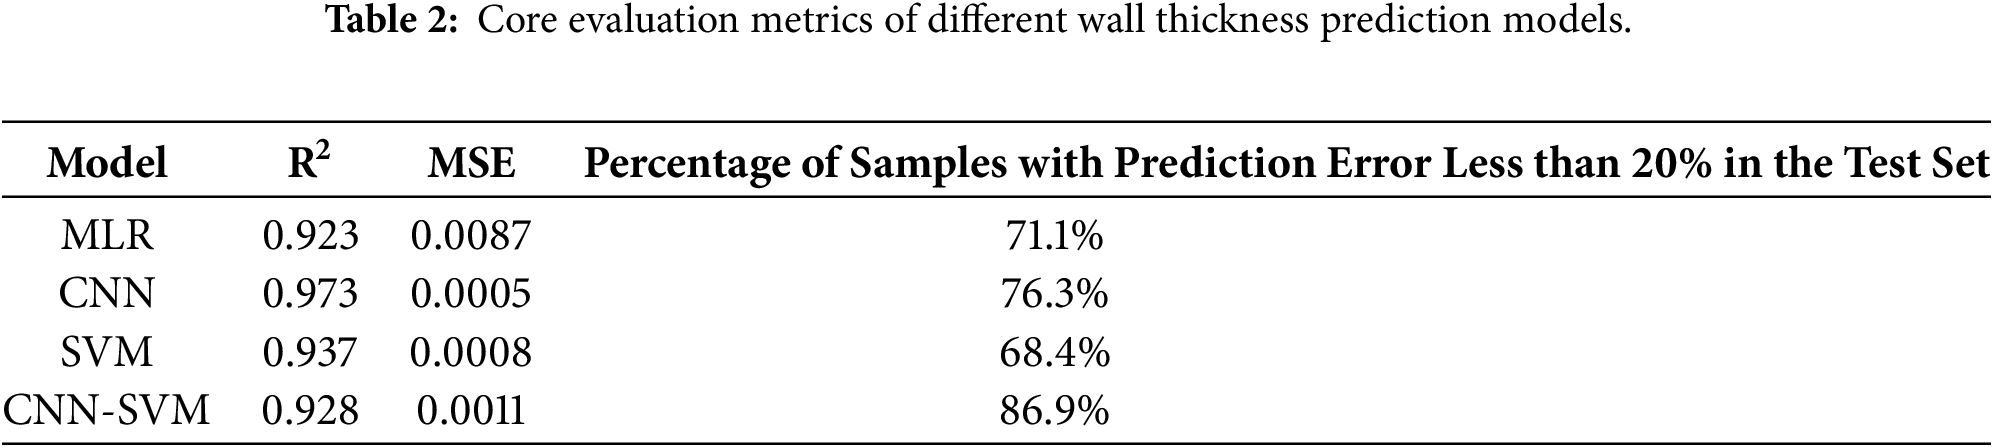
Fig. 8a–d shows the comparison between the predicted and actual wall thickness values in the testing set for the MLR, CNN, SVM, and CNN-SVM models, respectively. Fig. 8e–h illustrates the distribution of testing data within the ±10% and ±20% error bands for the same models. As shown in Fig. 8a–d, both the CNN and CNN-SVM models exhibit smaller deviations between predicted and actual values, indicating their superior predictive performance for wall thickness parameters. Further examination of Fig. 8e–h reveals that the data points are well distributed along both sides of the diagonal line, particularly for the CNN and CNN-SVM models, demonstrating their strong generalization capability.
In the testing set, the samples with prediction errors exceeding 20% were primarily concentrated in TPMS lattices with actual wall thickness values below 0.2 mm. This indicates that the CNN-SVM model performs better in predicting TPMS lattices with larger wall thicknesses. Among these samples, the lattice PS1_V0.13 exhibited the largest absolute error of 0.11 mm. Two main factors contribute to this phenomenon. First, TPMS lattices with extremely thin walls exhibit high geometric sensitivity, where local perturbations or subtle deviations introduced during rasterization can be amplified, leading to relatively large prediction errors. In addition, when the wall thickness approaches the voxel resolution limit in the rasterization process, partial geometric details may be lost or blurred, further enlarging the deviation between the extracted features and the true structure. Second, the limited number of samples within this thickness range causes the model to rely excessively on the general trends of wall thickness variation derived from other design parameters, thereby reducing prediction accuracy. This data imbalance becomes more pronounced in the ultra-thin region, where the model struggles to capture the distinct geometric behaviors associated with extremely small wall thicknesses. This finding suggests that further optimization of data balance and sample selection in the training dataset is necessary to enhance the model’s predictive accuracy and robustness across different wall thickness ranges.
According to the experimental results summarized in Table 2, the CNN-SVM model achieved the best overall performance in wall thickness prediction. Although its R2 and MSE metrics were not the highest among all models, it demonstrated outstanding control of prediction errors: compared with the conventional MLR, CNN, and SVM models, the proportion of testing samples with prediction errors less than 20% increased by 15.8%, 10.6%, and 18.5%, respectively. From an additive manufacturing perspective, maintaining prediction errors within a bounded range is more critical than marginal improvements in global accuracy metrics such as R2 or MSE. The CNN-SVM model effectively integrates the strengths of CNN and SVM architectures—using convolutional operations to efficiently extract key structural features from TPMS lattices and employing the SVM module for regression-based decision making. The synergistic combination of these two components significantly enhances the overall prediction capability and stability of the model.
4.2 Quantification of Parameter Influence on Wall Thickness via Linear Regression
The multiple linear regression (MLR) model not only enables prediction of wall thickness parameters but also provides insight into the correlations between design variables and wall thickness through the obtained regression coefficients. The influence weights of each parameter, represented by the regression coefficients, are illustrated in Fig. 9.
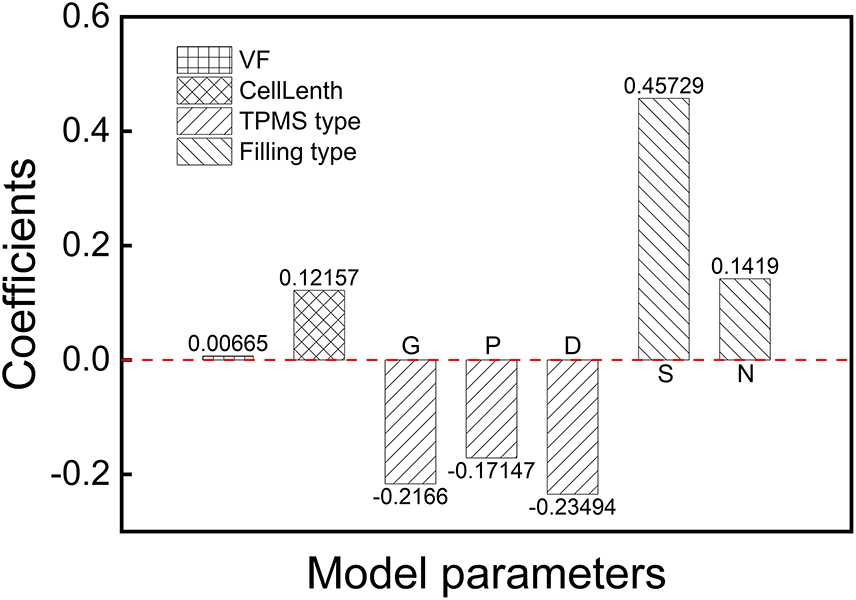
Figure 9: Regression coefficients obtained from the multiple linear regression model.
According to the regression coefficients derived from the MLR equation, among the two numerical input variables—VF and Cell length—the latter exerts a more pronounced influence on wall thickness. Therefore, in cases where insufficient wall thickness occurs in a TPMS lattice with a fixed structural type, increasing the cell length is a relatively effective approach to improve manufacturability. For the two categorical variables, TPMS Type and Filling Type, the regression coefficients of TPMS Type are all negative, indicating that different TPMS geometries reduce wall thickness to varying degrees. Among them, the Diamond type shows the most significant negative effect, suggesting that this geometry should be selected with caution, as it often requires larger VF and cell length values to satisfy the minimum wall thickness requirements of additive manufacturing. In contrast, within the Filling Type variable, the Sheet structure exhibits a stronger positive influence on wall thickness than the Skeletal type, implying that Sheet-type configurations should be prioritized in design considerations.
To develop an effective and interpretable approach for predicting TPMS wall thickness parameters, this study proposes a machine learning–based method that integrates geometric and design features. The geometric characteristics of TPMS models were extracted from rasterized point cloud projections and combined with conventional design parameters as input features for a CNN-SVM predictive model. Compared with traditional models, the CNN-SVM approach reduced the prediction error by 15.8%, 10.6%, and 18.5% relative to the MLR, CNN, and SVM models, respectively. Furthermore, a multiple linear regression analysis quantitatively evaluates the influence of individual design parameters on wall thickness. The FillingType_Sheet parameter exhibited the most significant positive effect (0.45729), indicating its strong contribution to wall thickness enhancement. Overall, the proposed method improves prediction reliability while maintaining interpretability, providing a practical reference for TPMS lattice design optimization and manufacturability enhancement in additive manufacturing.
Although the proposed method shows promising performance, its scope is currently limited to relatively basic learning architectures and a dataset primarily generated through geometric modeling and augmentation. Future work will focus on incorporating more advanced geometric deep learning models and expanding the dataset to cover a wider range of TPMS configurations and manufacturing conditions, with the aim of further improving prediction robustness and practical applicability.
Acknowledgement: Not applicable.
Funding Statement: This research was funded by Sichuan Provincial Regional Innovation Cooperation Project Funding, grant number 2024YFHZ0073, and Funded by the Research Innovation Team Program of Sichuan University of Science and Chemical Technology, grant number SUSE652A015.
Author Contributions: The authors confirm contribution to the paper as follows: Conceptualization, Lei Fu and Xu Zhan; methodology, Qian Zhang, Lei Fu, Renzhou Chen and Xu Zhan; software, Qian Zhang and Xu Zhan; validation, Qian Zhang and Renzhou Chen; formal analysis, Qian Zhang and Renzhou Chen; investigation, Renzhou Chen and Lei Fu; resources, Lei Fu and Xu Zhan; data curation, Qian Zhang and Xu Zhan; writing—original draft preparation, Qian Zhang; writing—review and editing, Qian Zhang, Lei Fu and Xu Zhan; visualization, Qian Zhang; supervision, Lei Fu and Xu Zhan; project administration, Lei Fu and Xu Zhan; funding acquisition, Lei Fu and Xu Zhan. All authors reviewed and approved the final version of the manuscript.
Availability of Data and Materials: The authors confirm that the data supporting the findings of this study are available within the article.
Ethics Approval: Not applicable.
Conflicts of Interest: The authors declare no conflicts of interest.
References
1. Feng J, Fu J, Yao X, He Y. Triply periodic minimal surface (TPMS) porous structures: from multi-scale design, precise additive manufacturing to multidisciplinary applications. Int J Extrem Manuf. 2022;4(2):022001. doi:10.1088/2631-7990/ac5be6. [Google Scholar] [CrossRef]
2. Suiker ASJ. Effect of accelerated curing and layer deformations on structural failure during extrusion-based 3D printing. Cem Concr Res. 2022;151:106586. doi:10.1016/j.cemconres.2021.106586. [Google Scholar] [CrossRef]
3. D’Andrea L, Gastaldi D, Baino F, Verné E, Saccomano G, D’Amico L, et al. Mechanical characterization of miniaturized 3D-printed hydroxyapatite parts obtained through vat photopolymerization: an experimental study. J Mech Behav Biomed Mater. 2023;141:105760. doi:10.1016/j.jmbbm.2023.105760. [Google Scholar] [PubMed] [CrossRef]
4. Tong Z, Yu X, Yang C, Shen H. A comprehensive support-free slicing method library for variable posture additive manufacturing. Addit Manuf. 2024;94:104508. doi:10.1016/j.addma.2024.104508. [Google Scholar] [CrossRef]
5. Memarzadeh A, Safaei B, Tabak A, Sahmani S, Kizilors C. Advancements in additive manufacturing of polymer matrix composites: a systematic review of techniques and properties. Mater Today Commun. 2023;36:106449. doi:10.1016/j.mtcomm.2023.106449. [Google Scholar] [CrossRef]
6. Ding Q, Li X, Zhang D, Zhao G, Sun Z. Anisotropy of poly(lactic acid)/carbon fiber composites prepared by fused deposition modeling. J Appl Polym Sci. 2020;137(23):48786. doi:10.1002/app.48786. [Google Scholar] [CrossRef]
7. Niendorf K, Raeymaekers B. Quantifying macro- and microscale alignment of carbon microfibers in polymer-matrix composite materials fabricated using ultrasound directed self-assembly and 3D-printing. Compos Part A Appl Sci Manuf. 2020;129:105713. doi:10.1016/j.compositesa.2019.105713. [Google Scholar] [CrossRef]
8. Han W, Kong L, Xu M. Advances in selective laser sintering of polymers. Int J Extrem Manuf. 2022;4(4):042002. doi:10.1088/2631-7990/ac9096. [Google Scholar] [CrossRef]
9. Hu Y, Yu H, Wu S, Ao N, Kan Q, Wu Z, et al. Research progress and challenges of mechanical property prediction of additive manufacturing alloy materials based on machine learning. Chin J Theor Appl Mech. 2024;56:1892–915. doi:10.6052/0459-1879-23-542. [Google Scholar] [CrossRef]
10. Ma S, Tang Q, Liu Y, Feng Q. Prediction of mechanical properties of three-dimensional printed lattice structures through machine learning. J Comput Inf Sci Eng. 2022;22(3):031008. doi:10.1115/1.4053077. [Google Scholar] [CrossRef]
11. Wu C, Wan B, Entezari A, Fang J, Xu Y, Li Q. Machine learning-based design for additive manufacturing in biomedical engineering. Int J Mech Sci. 2024;266:108828. doi:10.1016/j.ijmecsci.2023.108828. [Google Scholar] [CrossRef]
12. Ibrahimi S, D’Andrea L, Gastaldi D, Rivolta MW, Vena P. Machine learning approaches for the design of biomechanically compatible bone tissue engineering scaffolds. Comput Meth Appl Mech Eng. 2024;423:116842. doi:10.1016/j.cma.2024.116842. [Google Scholar] [CrossRef]
13. Huang X, Tang H, Wang L. Research progress on key mechanical properties of three-periodic minimal surface structures based on additive manufacturing. Chin J Theor Appl Mech. 2024;56:3099–115. doi:10.6052/0459-1879-24-205. [Google Scholar] [CrossRef]
14. Al-Ketan O, Abu Al-Rub RK. MSLattice: a free software for generating uniform and graded lattices based on triply periodic minimal surfaces. Mater Des Process Commun. 2021;3(6):e205. doi:10.1002/mdp2.205. [Google Scholar] [CrossRef]
15. Maskery I, Parry LA, Padrão D, Hague RJM, Ashcroft IA. FLatt pack: a research-focussed lattice design program. Addit Manuf. 2022;49:102510. doi:10.1016/j.addma.2021.102510. [Google Scholar] [CrossRef]
16. Karakoç A. RegionTPMS—region based triply periodic minimal surfaces (TPMS) for 3-D printed multiphase bone scaffolds with exact porosity values. SoftwareX. 2021;16:100835. doi:10.1016/j.softx.2021.100835. [Google Scholar] [CrossRef]
17. Poltue T, Karuna C, Khrueaduangkham S, Seehanam S, Promoppatum P. Design exploration of 3D-printed triply periodic minimal surface scaffolds for bone implants. Int J Mech Sci. 2021;211:106762. doi:10.1016/j.ijmecsci.2021.106762. [Google Scholar] [CrossRef]
Cite This Article
 Copyright © 2026 The Author(s). Published by Tech Science Press.
This work is licensed under a Creative Commons Attribution 4.0 International License , which permits unrestricted use, distribution, and reproduction in any medium, provided the original work is properly cited.
 Downloads
 Citation Tools