
 Submit a Paper
 Propose a Special lssue
 Open Access
ARTICLE
Semantic Causality Evaluation of Correlation Analysis Utilizing Large Language Models
Department of Computer Science, Faculty of Natural Sciences, Matej Bel University, Tajovského 40, Banská Bystrica, Slovakia
* Corresponding Author: Adam Dudáš. Email:
Computers, Materials & Continua 2026, 87(2), 98 https://doi.org/10.32604/cmc.2026.076507
Received 21 November 2025; Accepted 02 February 2026; Issue published 12 March 2026
 View Full Text
 Download PDF
Abstract
It is known that correlation does not imply causality. Some relationships identified in the analysis of data are coincidental or unknown, and some are produced by real-world causality of the situation, which is problematic, since there is a need to differentiate between these two scenarios. Until recently, the proper−semantic−causality of the relationship could have been determined only by human experts from the area of expertise of the studied data. This has changed with the advance of large language models, which are often utilized as surrogates for such human experts, making the process automated and readily available to all data analysts. This motivates the main objective of this work, which is to introduce the design and implementation of a large language model-based semantic causality evaluator based on correlation analysis, together with its visual analysis model called Causal heatmap. After the implementation itself, the model is evaluated from the point of view of the quality of the visual model, from the point of view of the quality of causal evaluation based on large language models, and from the point of view of comparative analysis, while the results reached in the study highlight the usability of large language models in the task and the potential of the proposed approach in the analysis of unknown datasets. The results of the experimental evaluation demonstrate the usefulness of the Causal heatmap method, supported by the evident highlighting of interesting relationships, while suppressing irrelevant ones.Keywords
Correlation analysis is frequently used in a broader scope of analysis of data to identify interesting functional relationships in the studied data. However, these relationships can be reflective of reality, where the two studied attributes influence each other’s values—making such a relationship causal—but also can only be present in the specific measured data instances. Correlation and causality are closely related concepts, with correlation analysis often serving as a starting point for investigating whether deeper causal mechanisms are present [1].
Recently, large language models have been used as a system component with the potential to act as human expert surrogates, capable of bringing broad, real-world knowledge into analytical workflows [2,3]. When considering the semantic evaluation of causality of relationships identified in data, causality assessment requires such human experts from the domain of the studied data to judge whether an observed relationship is plausibly causal or coincidental/unknown. This dependence on expert judgment can be time-consuming, significantly limits the scalability of the task, and depends on experts for areas of expertise, where there might be only a few of them.
This motivated the core idea of the presented study—the application of large language models in the task of semantic evaluation of the real-world causality of relationships identified via standard correlation analysis. Unlike conventional causal methods that rely purely on statistical models and tests, this approach leverages the online nature of large language models, making them able to assess the real-world familiarity and plausibility of relationships even in previously unseen datasets, offering a complementary approach to traditional expert- or statistics-driven causal analysis. In this way, the study contributes a novel visual analysis method that uses large language models to semantically evaluate the causal plausibility of relationships initially discovered through correlation analysis.
Hence, objectives of the work can be summarized into the following points:
• Design of procedure in which large language models are used to semantically evaluate the causality of relationships identified in correlation analysis and produce novel, weighted coefficient value, which reflects this evaluation.
• Design of a visual analysis method called Causal heatmap to present the results of the causal evaluation process in a visual way.
• Implementation of the causal evaluator and Causal heatmap in
• Experimental evaluation of the proposed model conducted on the combination of two datasets, two different causal evaluation problems, and three different evaluatory points of view—the quality of the visual model, the quality of semantic causal evaluation based on large language models, and comparative analysis of the method with conventional approaches.
Other than the introduction itself, the presented work consists of four main sections of text. Section 2 briefly examines scientific literature related to the objectives of the work, focusing on the use of large language models as surrogates for human experts. In Section 3, the design for the proposed causal evaluation workflow and visualization model are presented. The implementation and experimental evaluation of the model are detailed in Section 4, while the work concludes with Section 5, addressing advantages, disadvantages, and possible future work ideas related to the studied area.
As stated in the introductory section of this text, this work aims towards the use of large language models as surrogates for human experts, which would identify known causality and/or novel relationships in the studied data. The utilization of large language models as a human expert surrogate is well documented in several research outputs, out of which this section of the work presents only a few modern results.
In [4], authors focus on the application of large language models to process the textual representation of molecules studied in various areas of molecular science. Since the previous language model-based approaches to the task proved ineffective, the authors introduce GIT-Mol—a multi-modal large language model capable of working with visual and textual information—together with a novel architecture called GIT-Former. These novel contributions are reported to increase the accuracy of molecular property prediction by up to 10% and the quality of molecule generation by up to 20%.
The authors of [5] present the use of a large language model in the context of energetics—specifically, the model is used to determine the partial tripping of distributed energy resources based on the properties of interest. In the study, the authors utilize a BERT-based approach to streamline the fault information into tokenized input, which, on one hand, reduces the complexity of machine learning models needed for the selected task and, on the other, demonstrates the high quality of performance on limited sets of data.
The research presented in [6] focuses on the human interaction with radio map generation and wireless network planning, which often requires complex manual operations, limiting the use of automation in the problem. To counter this constraint, the authors of the work propose a large language model-based solution, in which the model autonomously generates radio maps and facilitates wireless network planning for specified areas, hence minimizing the need for extensive human-computer interaction. The reached results prove that the large language model utilization in the task reduces the amount of manual operations needed, while achieving enhanced coverage and signal-to-interference-noise ratio.
On the other hand, the research presented in [7] aims to apply large language models for remote sensing data. The authors of the study introduce three novel additions to the area—a large-scale remote sensing instruction tuning dataset, a SkyEyeGPT language model specifically designed for remote sensing, and a two-stage tuning method for the enhancement of instruction-following of the large language model in the selected task. Experimental results show that the combination of the three novel outputs produces superior outputs to the most conventional modern approaches.
The work presented in this study encompasses diagnostic analysis of data based on the correlation analysis and the determination of causality of relationships identified in it based on a large language model-based evaluator. This objective is a form of continuation of the previous research presented in [8,9] in which a correlation matrix was linguistically described by a large language model as shown in Fig. 1. In this previous approach, a correlation matrix is constructed, then a large language model generates a brief linguistic description for each of the identified relationships, and lastly, the matrix is supplemented by diagnostic cards, which describe the relationships.
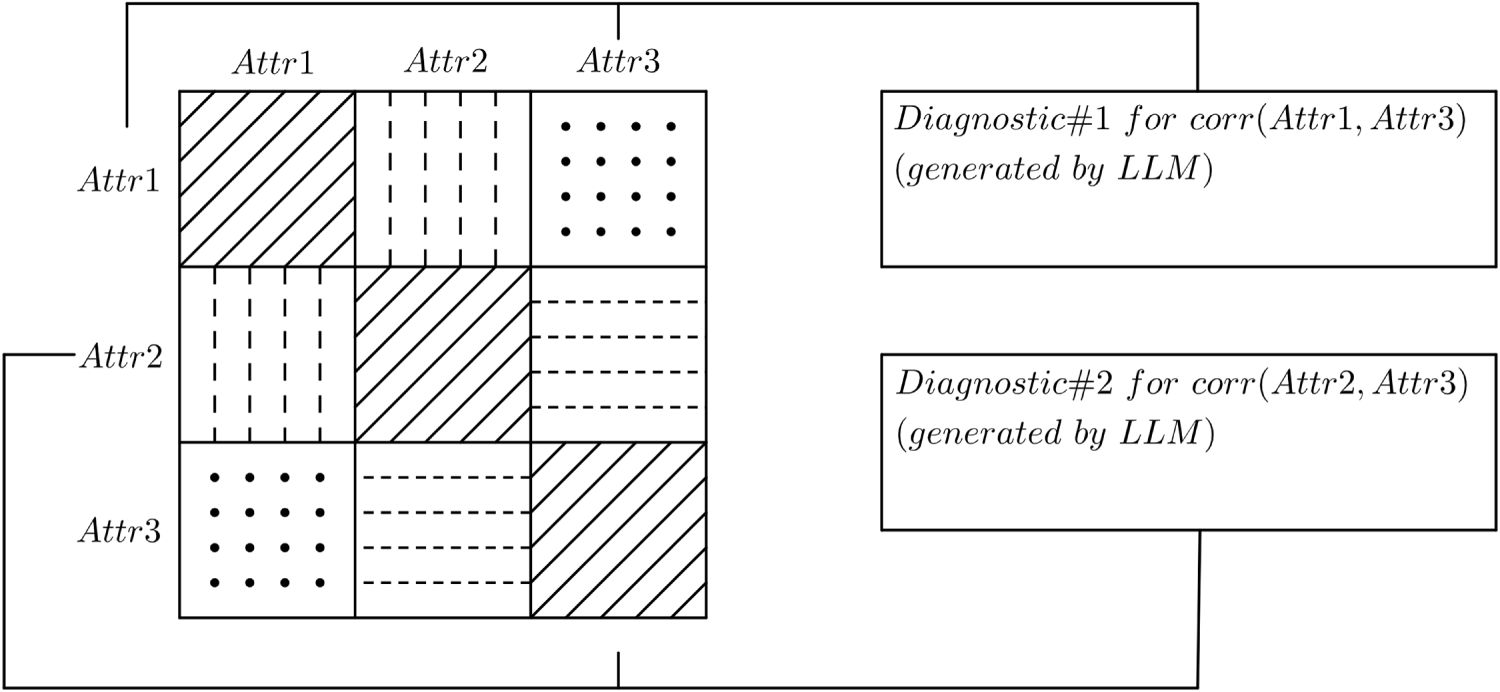
Figure 1: Schematic visualization of the approach presented in [8,9].
Since such a diagnostic analysis visualization of correlation matrices commonly contained mixed results and a high number of unnecessary descriptions, the results point to the need for the use of methods which highlight the causality or novel, unknown relationships in the correlation matrix. This motivates the utilization of large language models as causal evaluators of correlation analysis presented in the work detailed in this text.
3 Semantic Causal Analysis Utilizing Large Language Models
The original approach to semantic causal analysis of multidimensional datasets presented in this work is composed of the three basic building blocks—correlation analysis, large language models, and visualization. In this section of the text, each of these elements of the method and their use in the causal analysis are described.
The foundation of the proposed model is correlation analysis, a statistical method for the identification of the strength and direction of functional relationships between pairs of attributes in a multidimensional dataset [10]. These relationships are described using correlation coefficients, which produce values from the
In the conventional correlation analysis, two types of correlation coefficients are used—the Pearson correlation coefficient for the linear relationships, and the Spearman rank correlation coefficient for non-linear monotone relationships. The first of the mentioned correlation coefficients measured on attributes
where
These disadvantages motivate the use of the Spearman rank correlation coefficient computed as [12]:
where
Naturally, correlation between the values of two attributes can be the result of either real-world known causality of the relationship, or some other aspect—such as unknown or coincidental relationships. To identify the level of familiarity in linguistic, human-centric form, one can classify discovered relationships into five categories, such as:
Each of these categories can be assigned to the studied relationship between a pair of attributes by a human expert from the domain of the data or by their surrogate in an automized system, such as a large language model as proposed in this study. This evaluator of relationship familiarity can, then, use these linguistic values to produce a value for the familiarity level coefficient (
• In the case, the objective of the data analysis is the identification of new relationships, the
• In such a case, when the objective of analysis is the causality identification, the
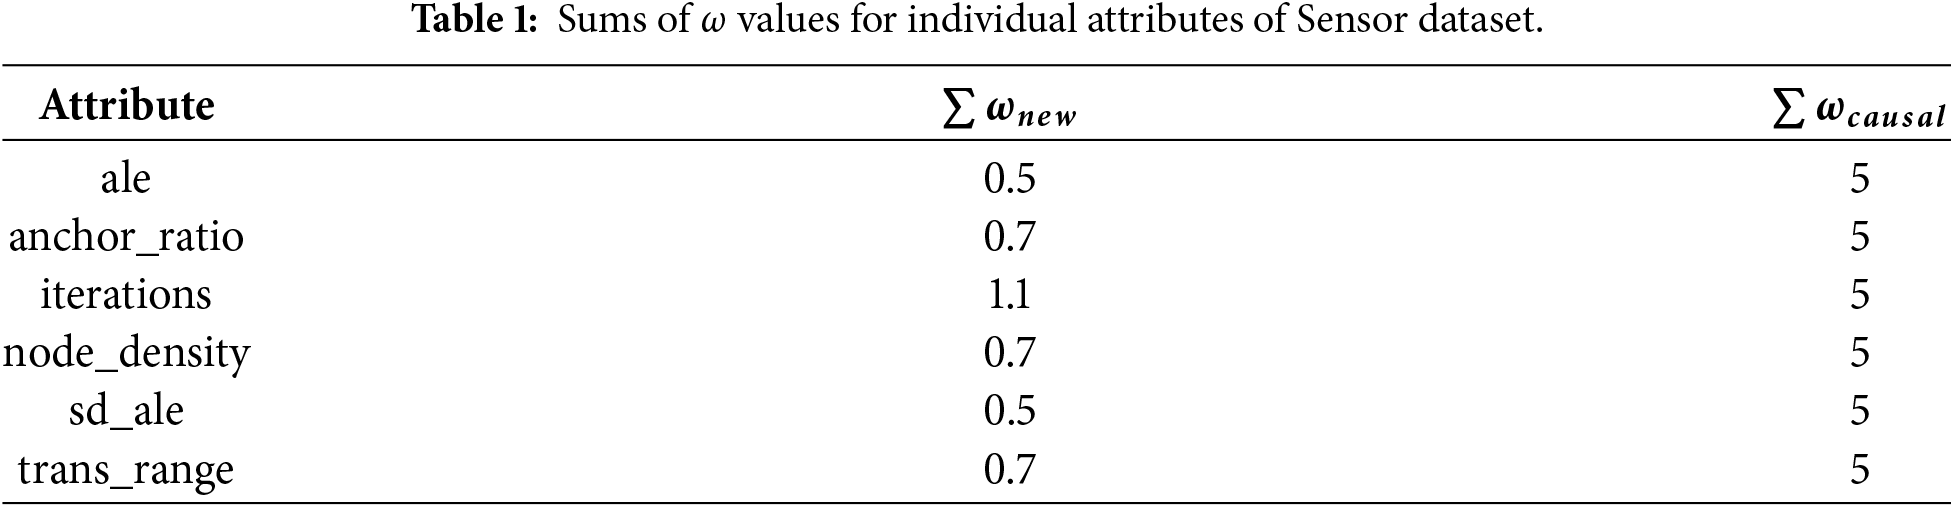
After the determination of the familiarity level coefficient value for each of the attribute pairs, simple weighing of correlation values is computed as the semantic causal coefficient (
When applied to the whole set of correlation coefficients of a dataset, the approach produces a causal matrix constructed as follows:
This procedure should maintain the relationships of interest based on the objective of analysis, while suppressing the less interesting values (pushing them closer to 0), and not inflating values on the edge, which can be of interest, but also can be uninteresting. The whole presented procedure can be summarized in the schema in Fig. 2.
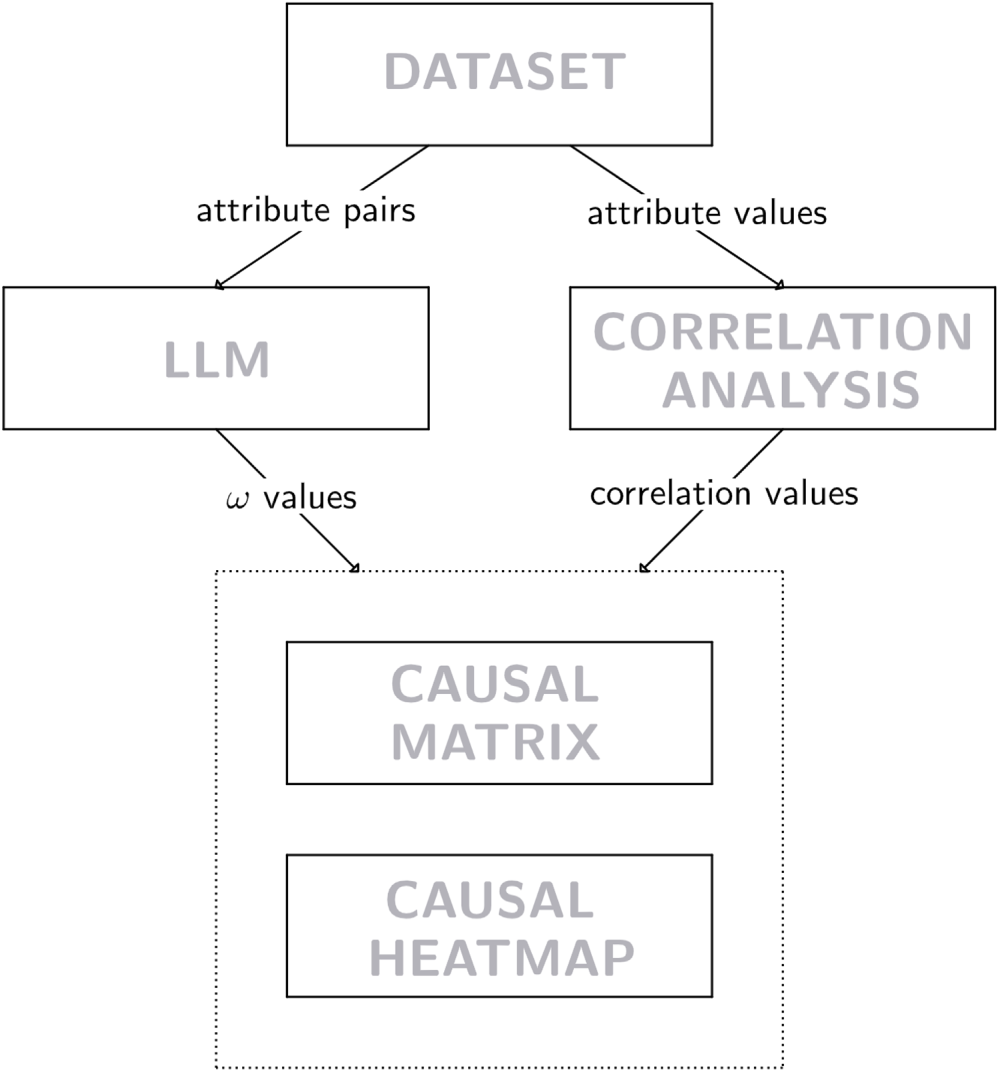
Figure 2: Schematic flowchart of the proposed approach.
As can be seen in the figure, the last step of the proposed model consists of visualization of the causal matrix in the form of a causal heatmap, presented in Fig. 3. This visualization is composed of three basic sections—the main one being the heatmap itself (Fig. 3b), which contains the values of causal matrix visualized using color from the specified palette (Fig. 3a); the last part of the visualization (Fig. 3c) presents the sum of familiarity level coefficient (
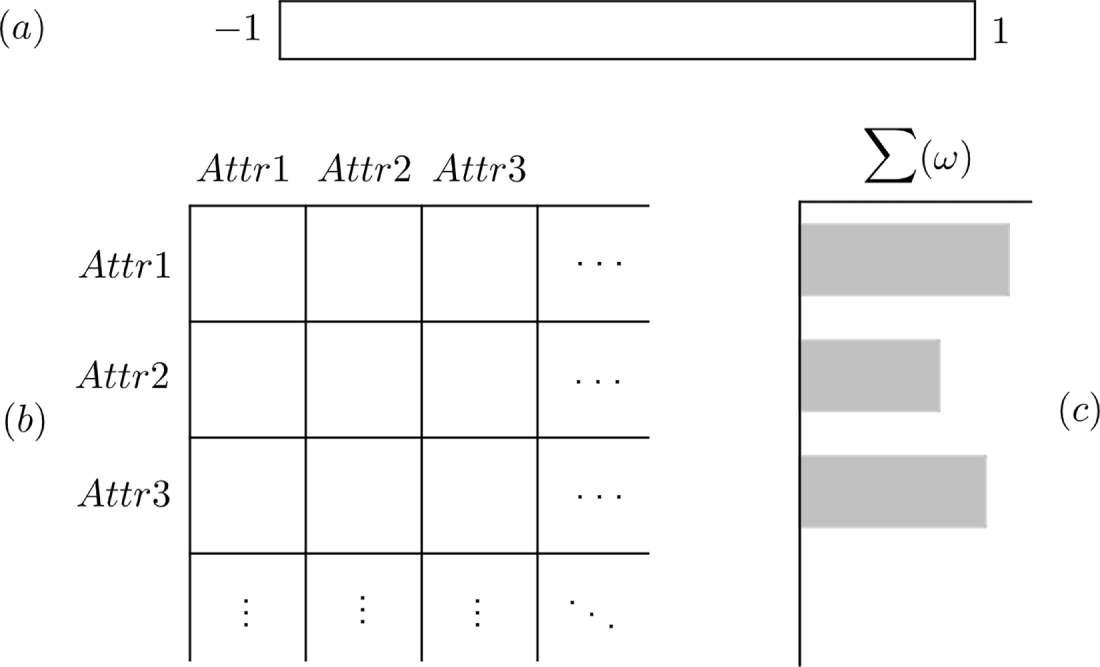
Figure 3: Schema of the Causal heatmap, where
Therefore, the presented approach produces a visual model for the analysis of pairwise relationships in the studied data, which can be used as a part of diagnostic analysis of data and to identify novel knowledge from the data itself.
4 Evaluation of the Proposed Approach
The semantics-based causal evaluation model proposed in the previous section of this work was implemented in the
In regard to the language model prompting used in the implementation of the proposed model, several iterations were tested, while the following prompts led to the best performance of the system:
• Prompting for the problem of identification of novel (unknown) relationship:
Identify general familiarity of the relationship between pairs of attributes:
{attributes}.
Evaluate these relationships as follows: known = 0.1 | moderately known = 0.3 |
neutral = 0.5 | moderately unknown = 0.7 | unknown = 1.
The data come from the area of {area}.
Print only the pair title and the score.
• Prompting for the task of causality identification:
Identify general familiarity of the relationship between pairs of attributes:
{attributes}.
Evaluate these relationships as follows: known = 1 | moderately known = 0.7 |
neutral = 0.5 | moderately unknown = 0.3 | unknown = 0.1.
The data come from the area of {area}.
Print only the pair title and the score.
As seen in the final prompts implemented in the causal evaluator, some minor formatting of the language model output was conducted, together with one crucial element of the prompt—the addition of the domain (area) from which the data originates. Even though this parameter makes the user input for the model a little more complex, it also provides additional context for the implemented large language model, which in turn produces causal evaluation of higher quality.
After the implementation, the proposed model is verified on two datasets—one well known dataset from the area of sensor data collection, which is conventionally used in benchmarking of decision-making methods (labeled as
Using these datasets, the proposed method is experimentally evaluated from three points of view—walkthrough and analysis of visualization component of the model based on Visual Data Analysis and Reasoning (VDAR) evaluation, evaluation of properties of the selected large language model in the context of causal analysis, and comparative analysis of the proposed approach with other, conventionally utilized approaches.
4.1 Evaluation of the Semantical Causal Analysis Outputs
The first of the evaluated aspects is the Causal heatmap visualization conducted using the Visual Data Analysis and Reasoning approach, which focuses on a walkthrough of visual analysis outputs and assessment of visualization’s ability to support real, meaningful data reasoning and knowledge discovery. Based on this concept, Figs. 4 and 5 detail the final Causal heatmap visualization for the
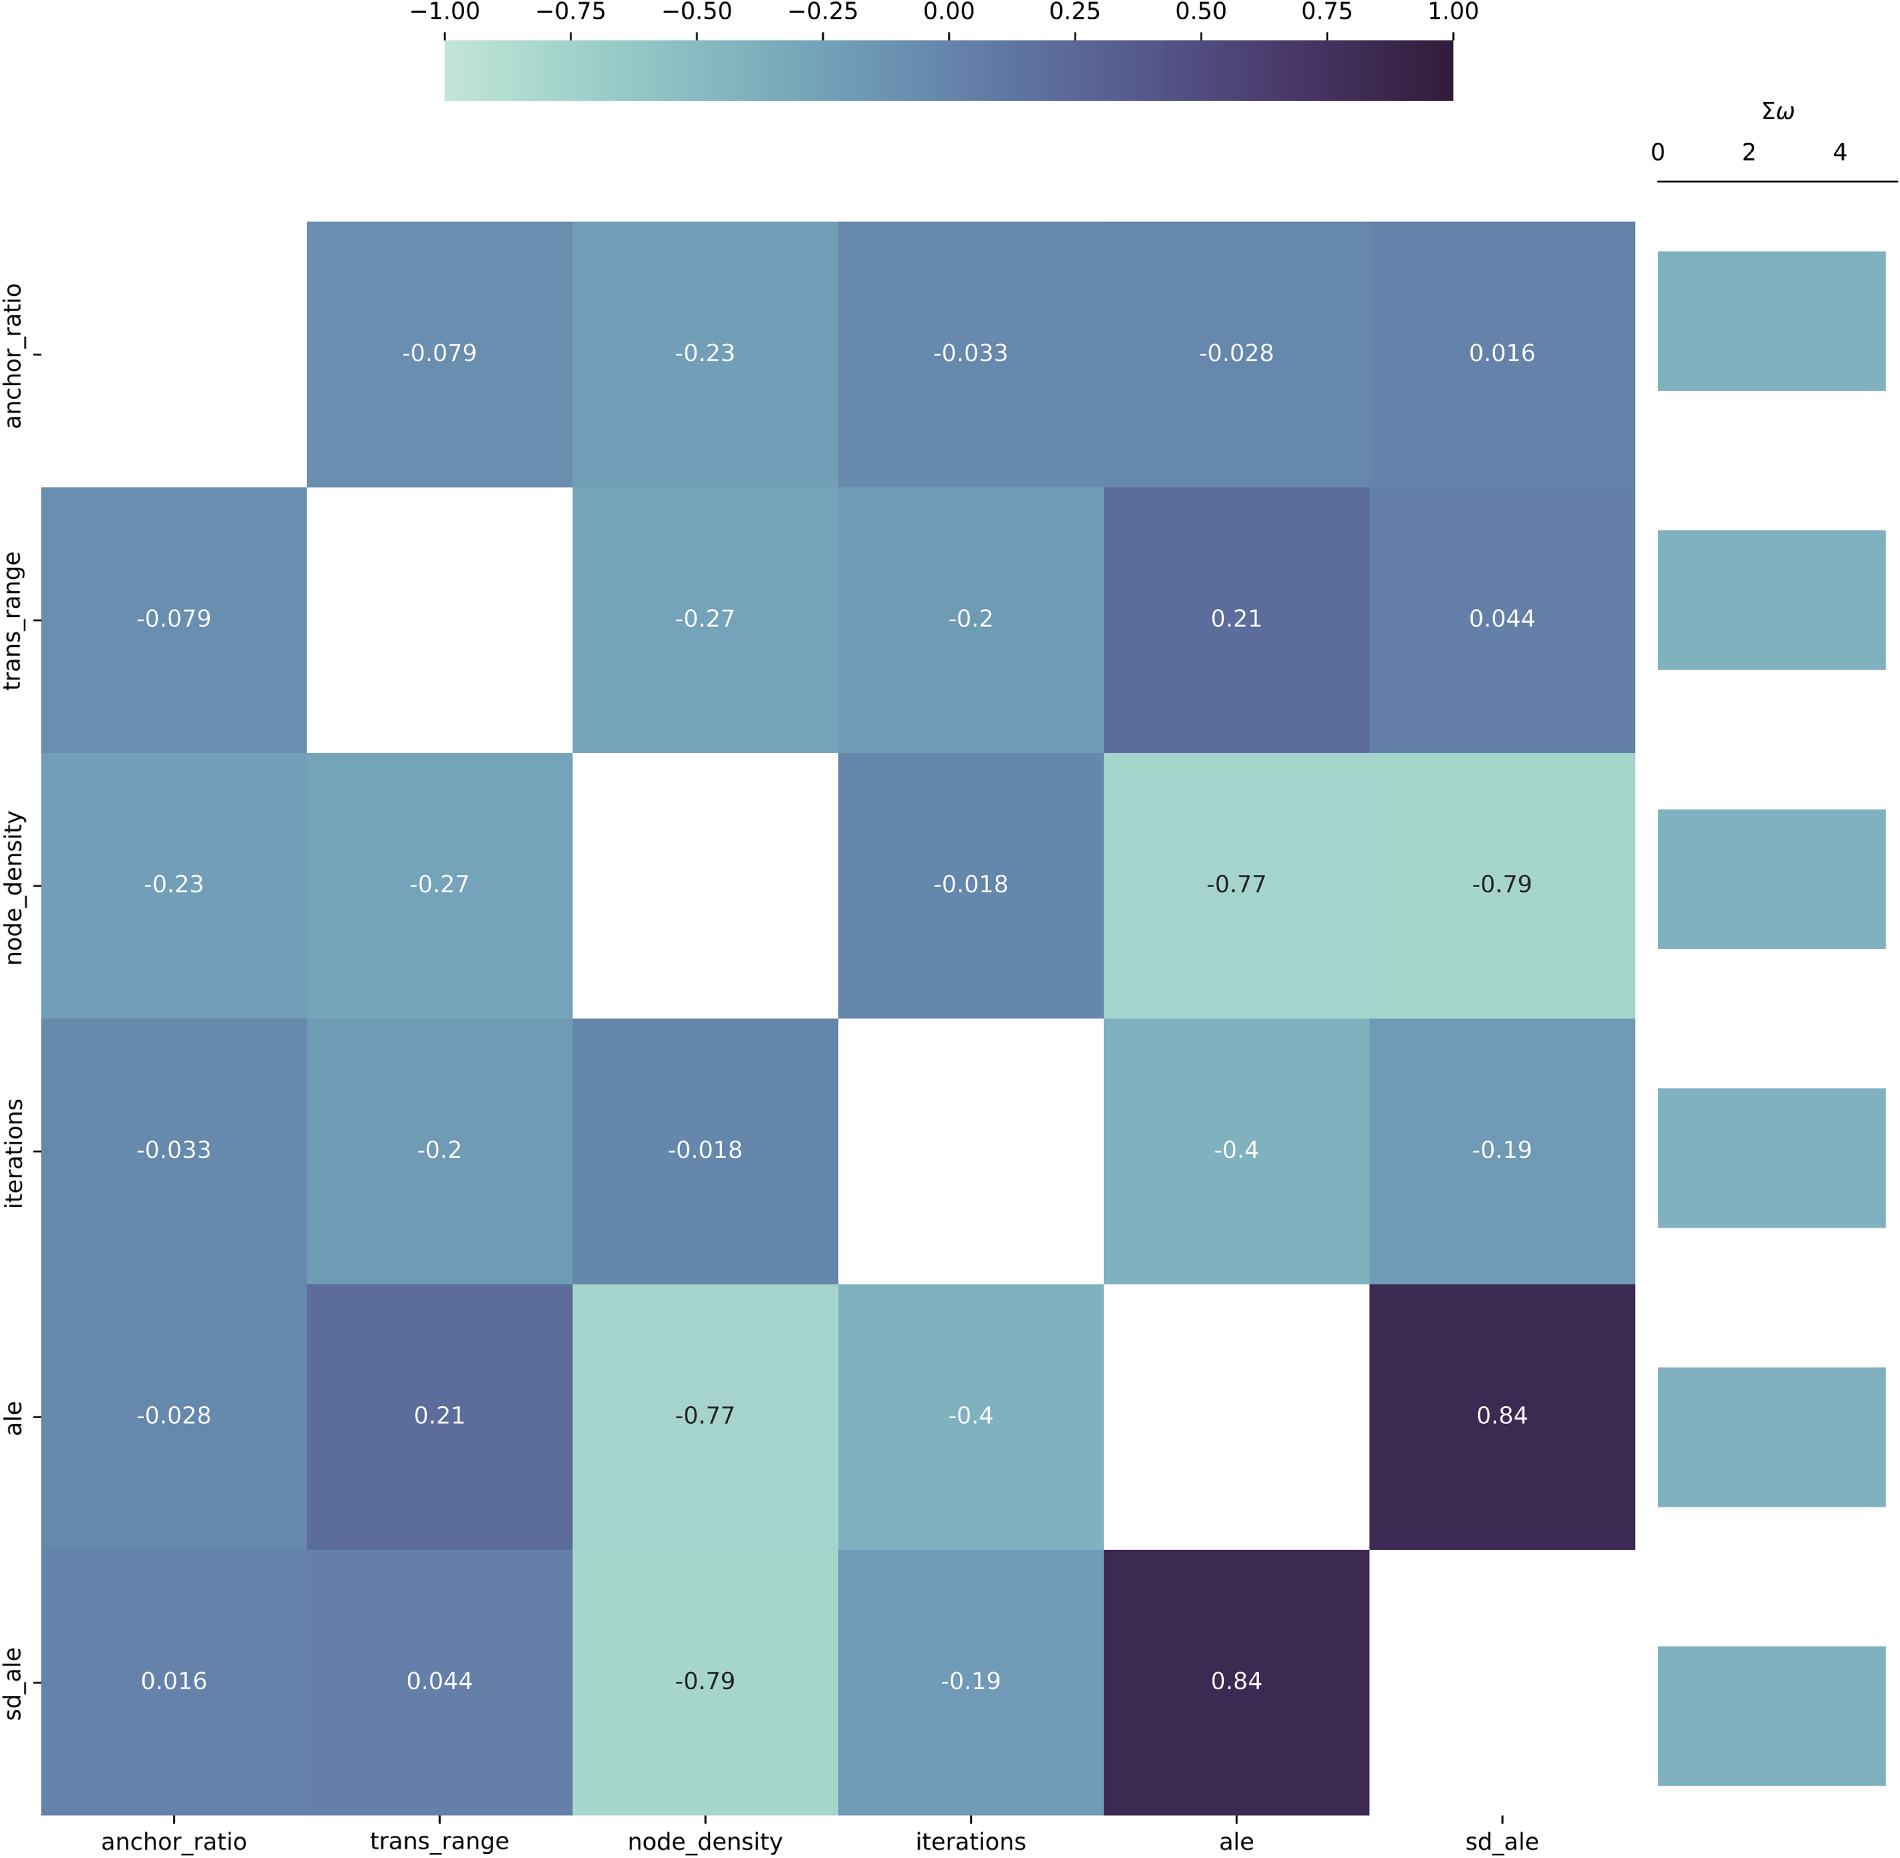
Figure 4: Causal heatmap visualization for sensor dataset with the task of identification of causality.
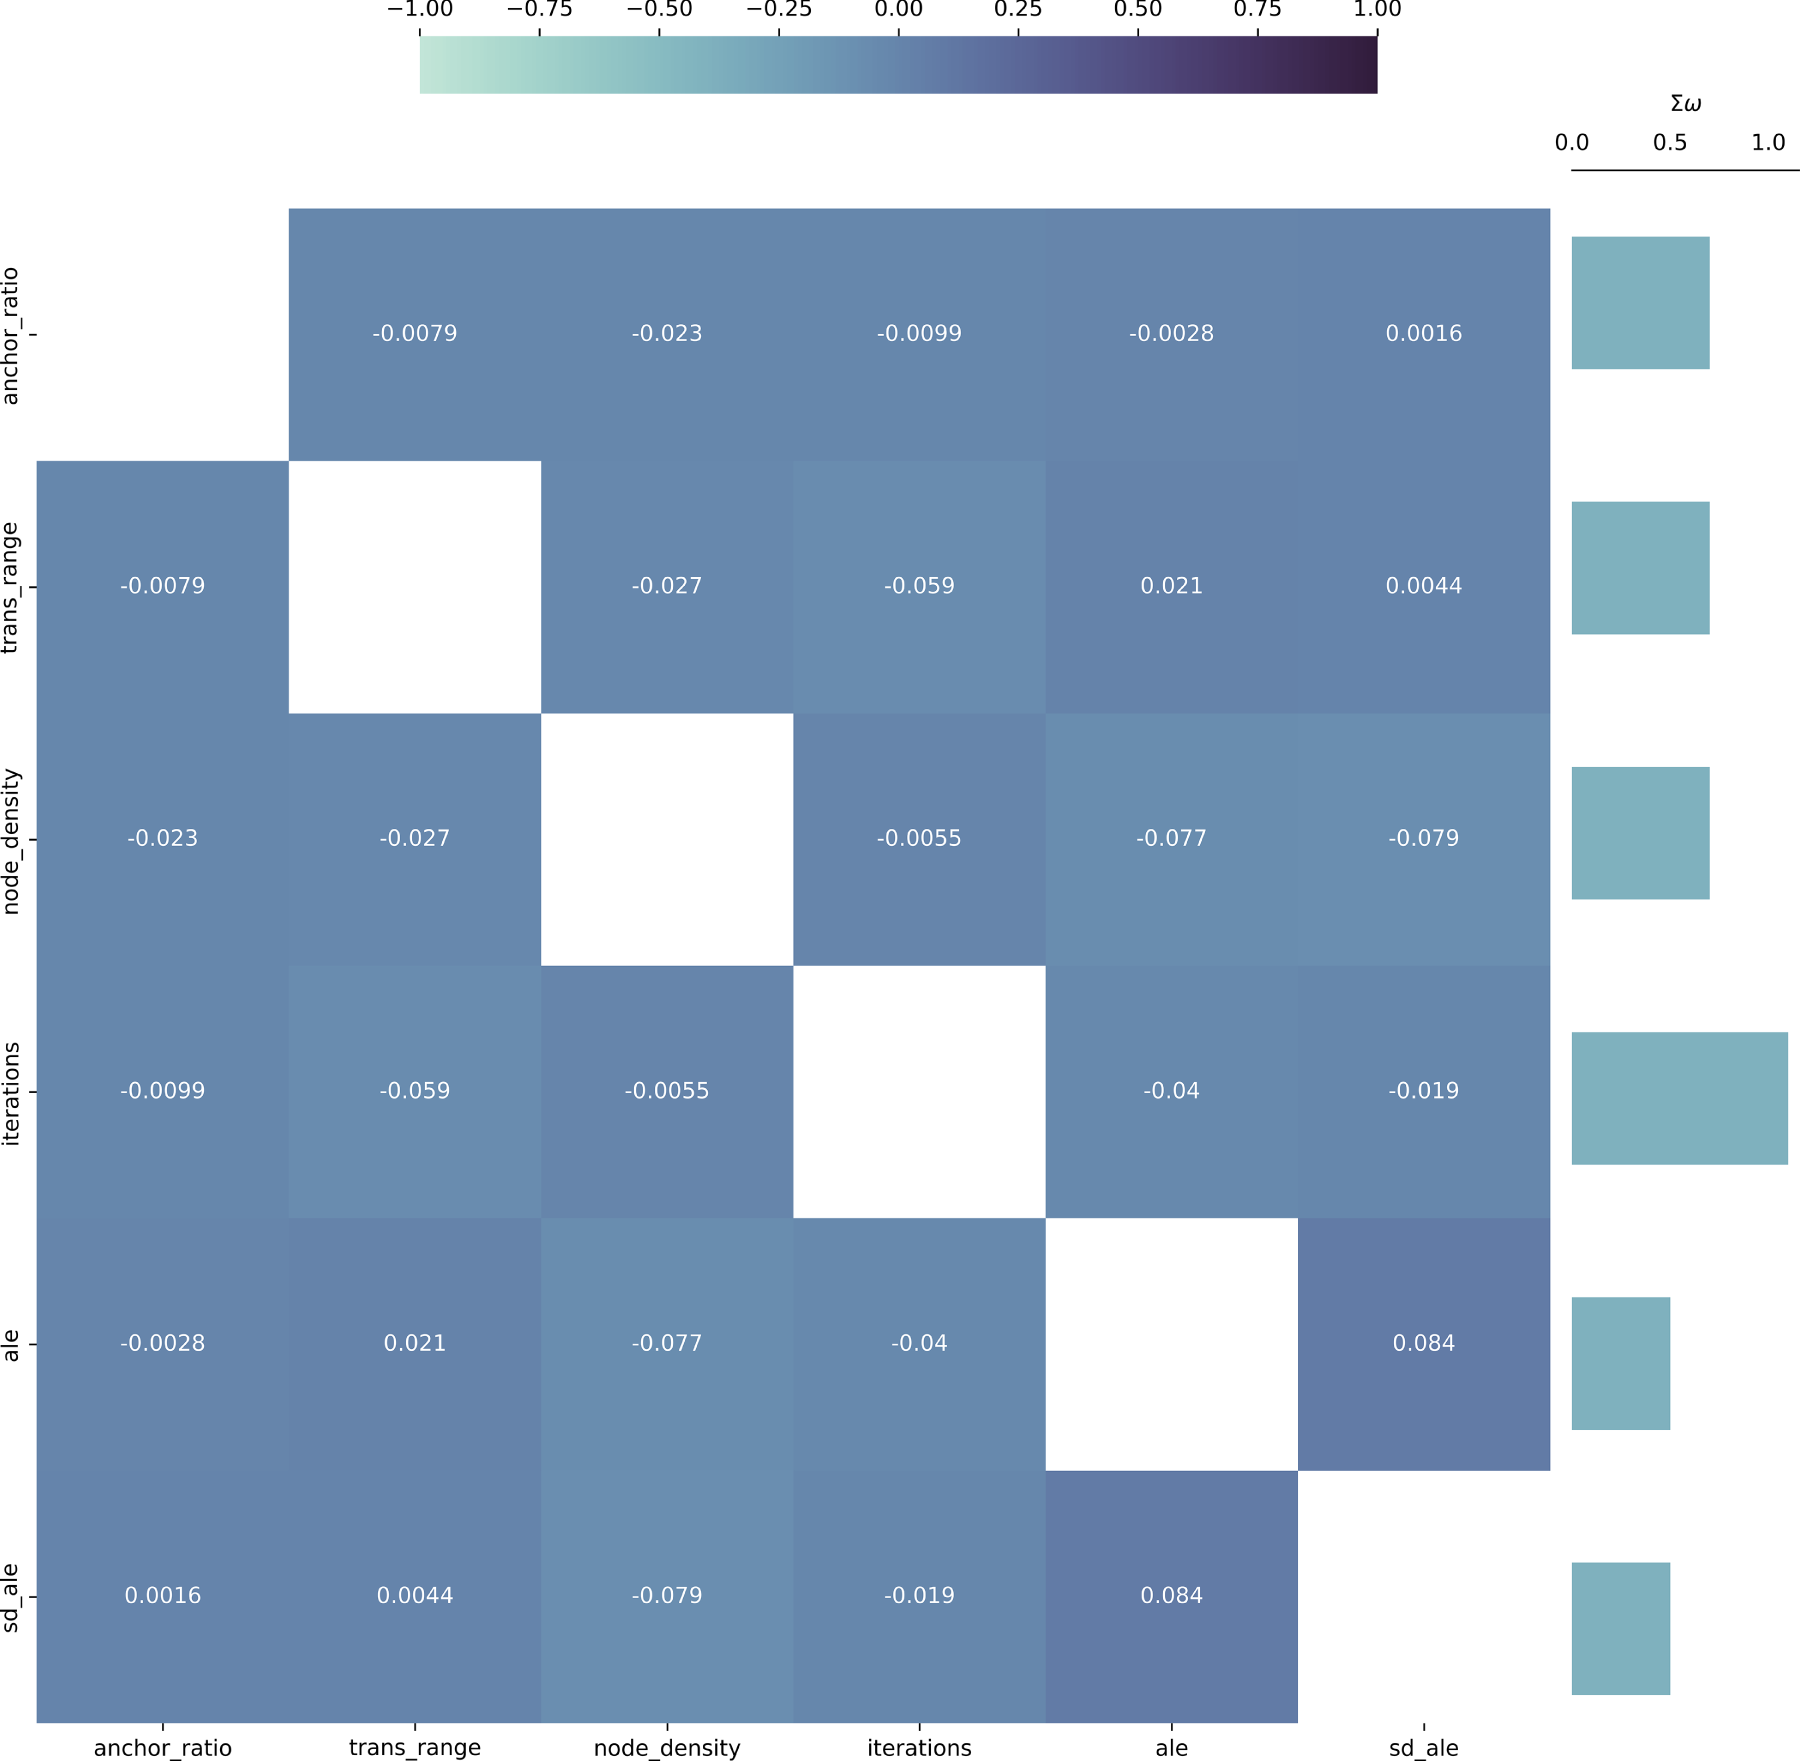
Figure 5: Causal heatmap visualization for sensor dataset with the task of identification of new relationships.
From these visualizations, it is clear that the relationships of the attributes measured in the dataset are well-known and present in the information available to the implemented large language model. This is evident from the fact that the
The visualization of Causal heatmaps for both of the considered relationship identification tasks of the
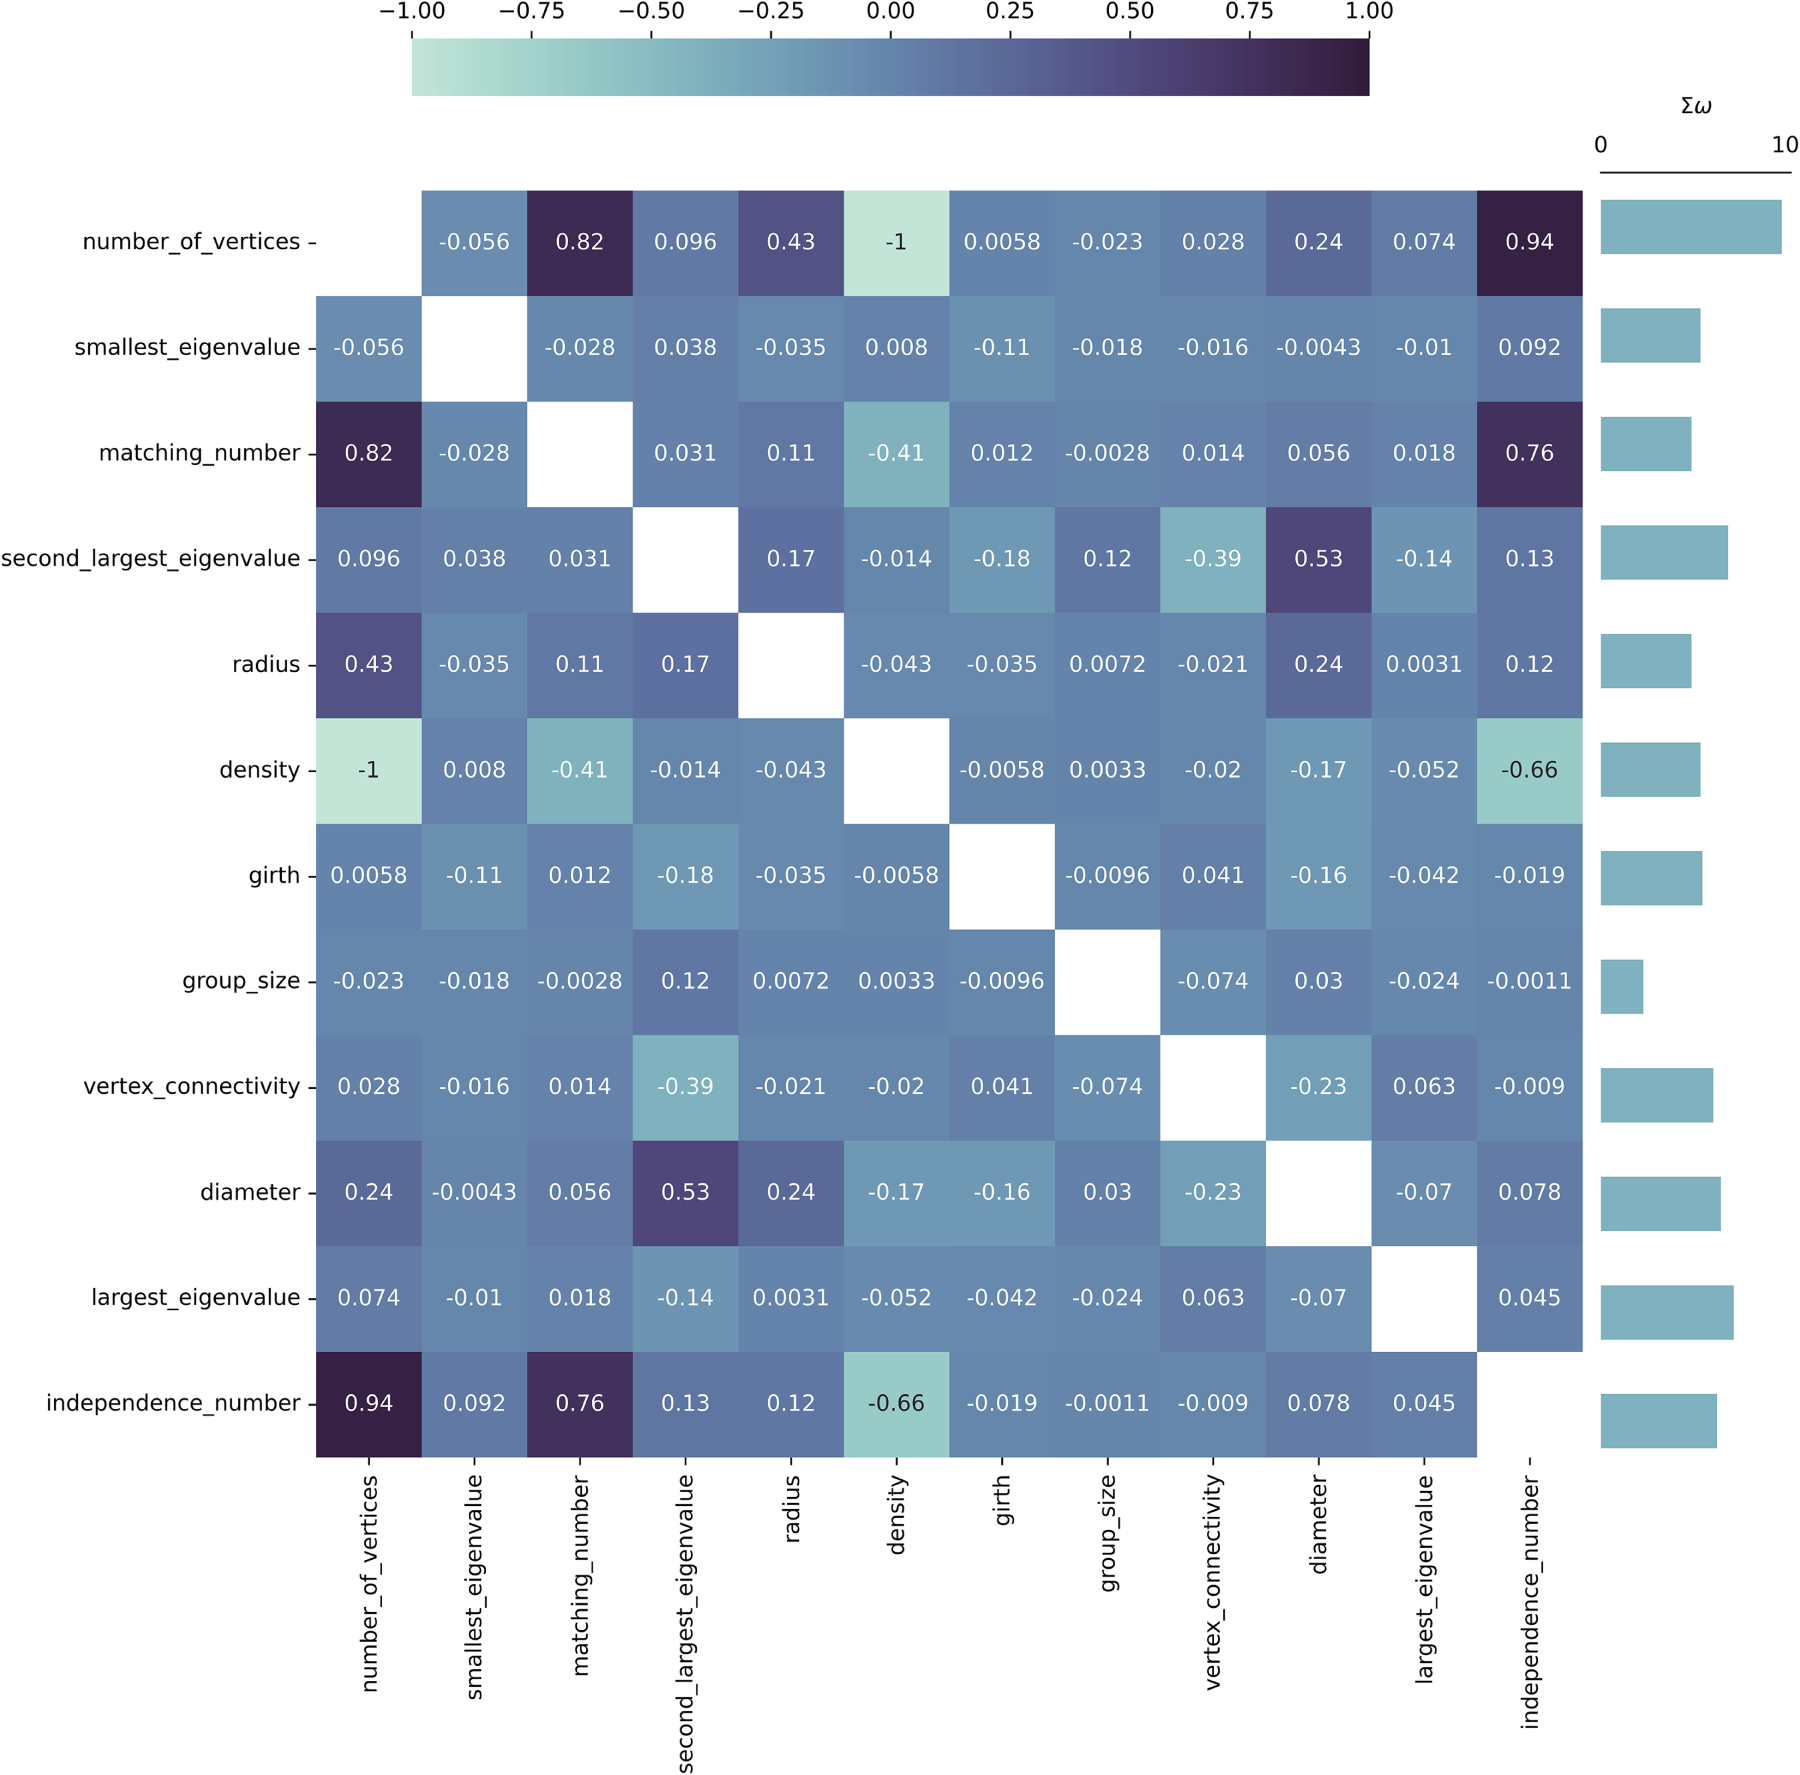
Figure 6: Causal heatmap visualization for graph property dataset with the task of identification of causality.
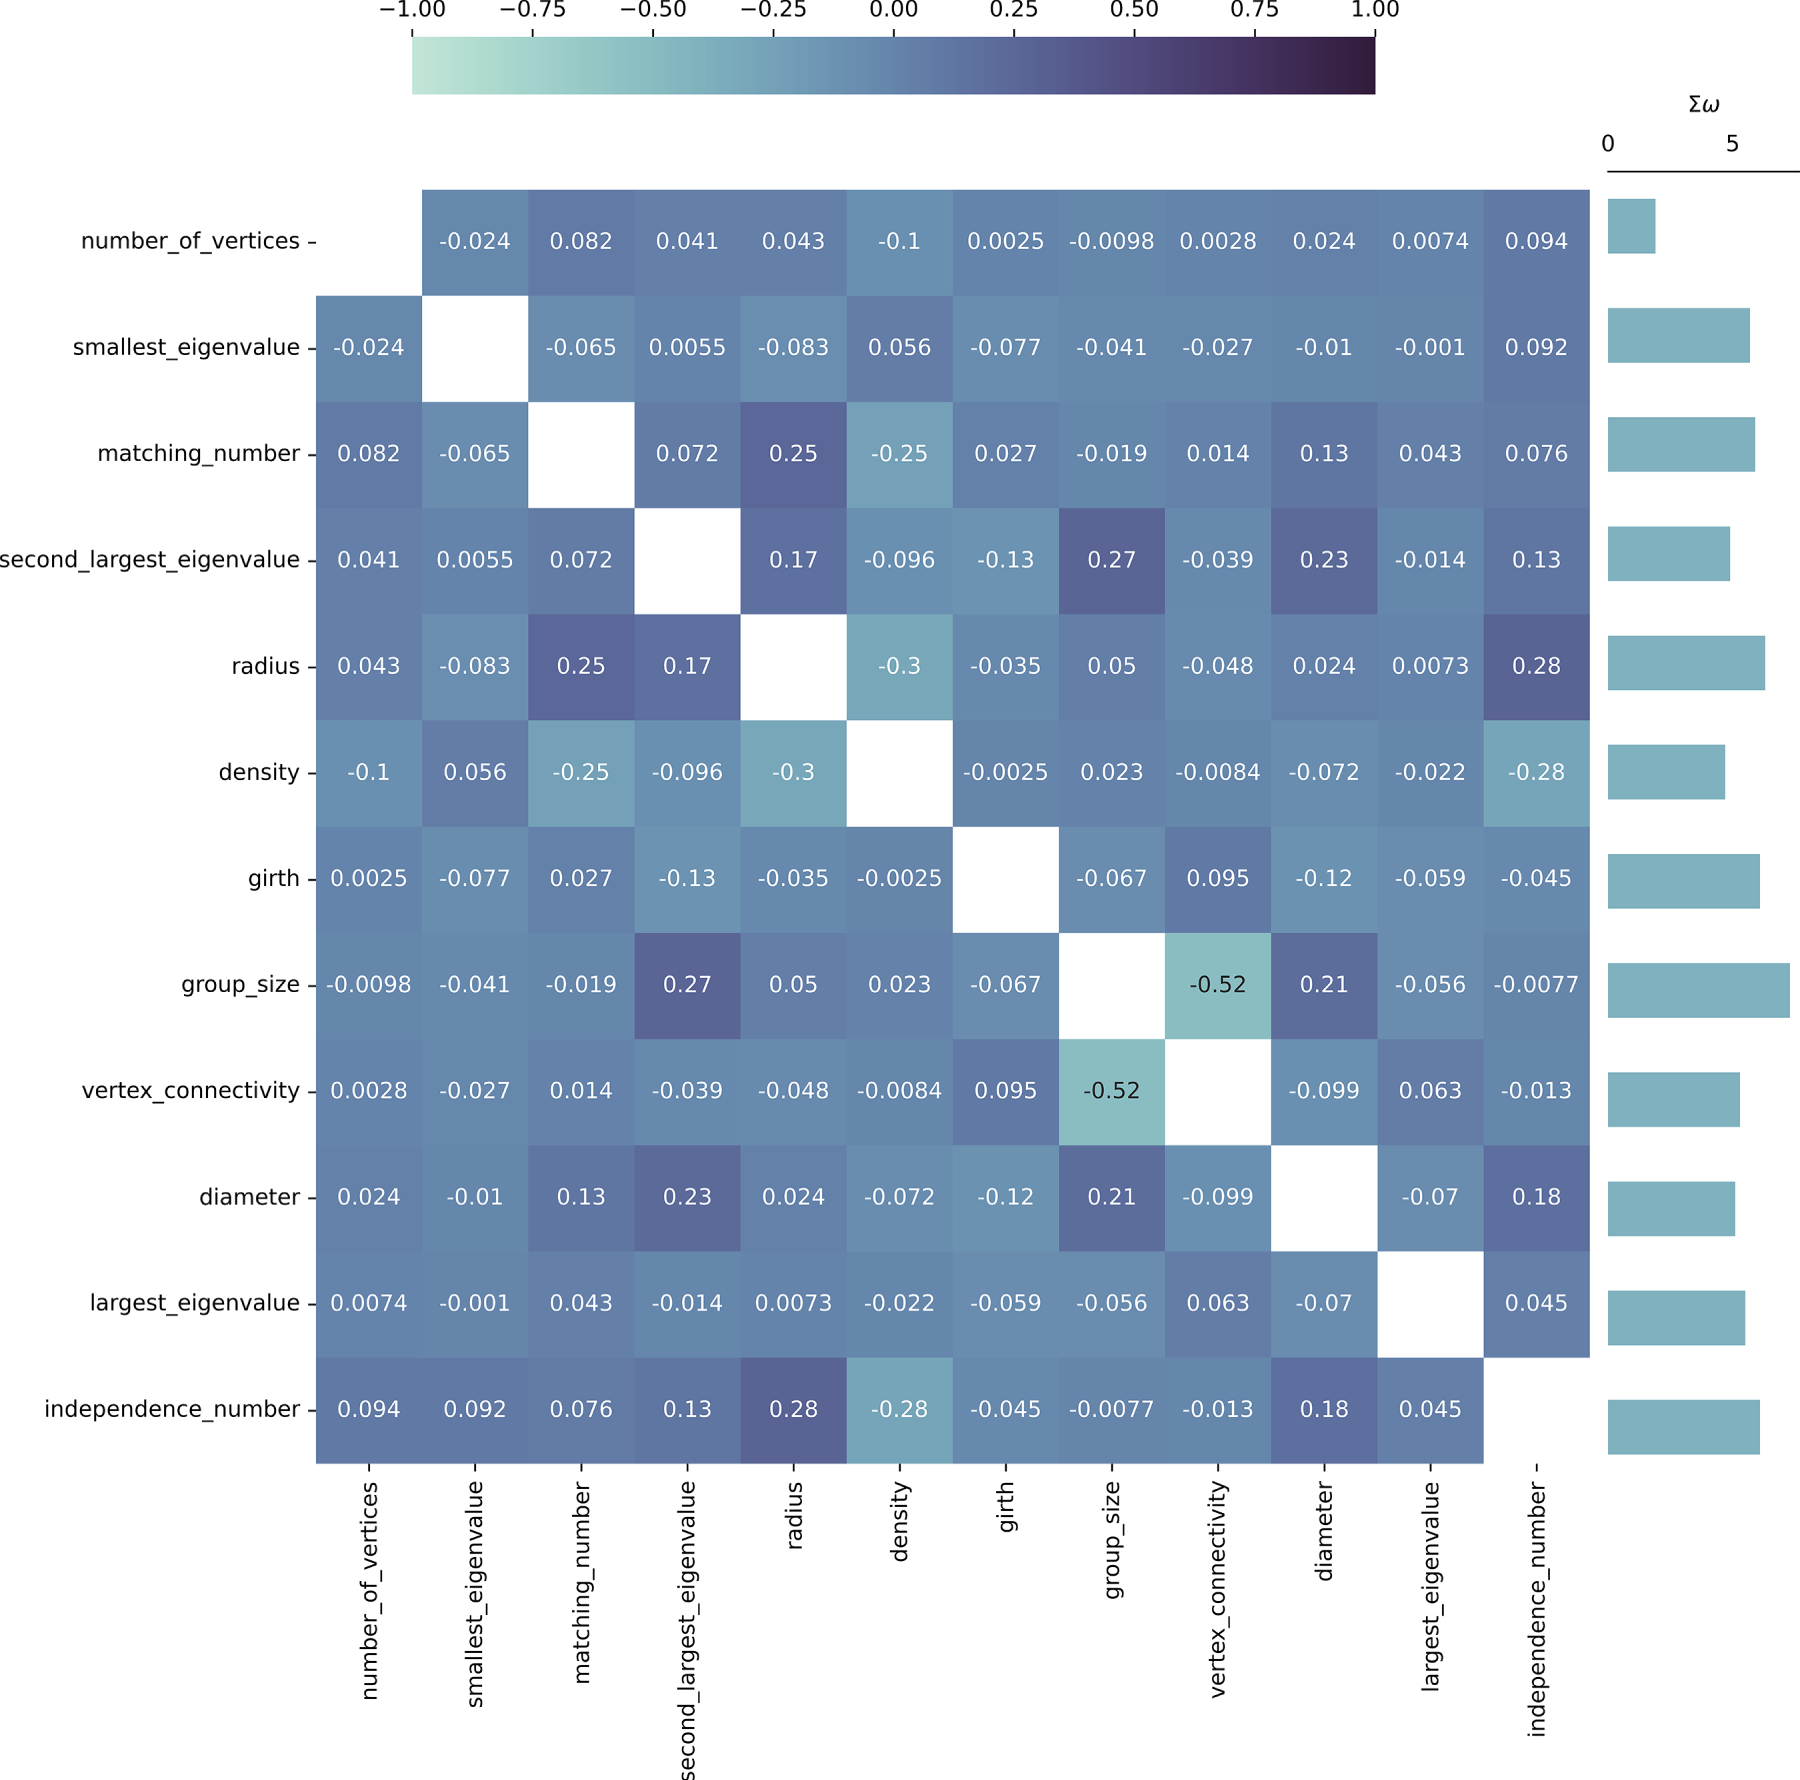
Figure 7: Causal heatmap visualization for graph property dataset with the task of identification of new relationships.
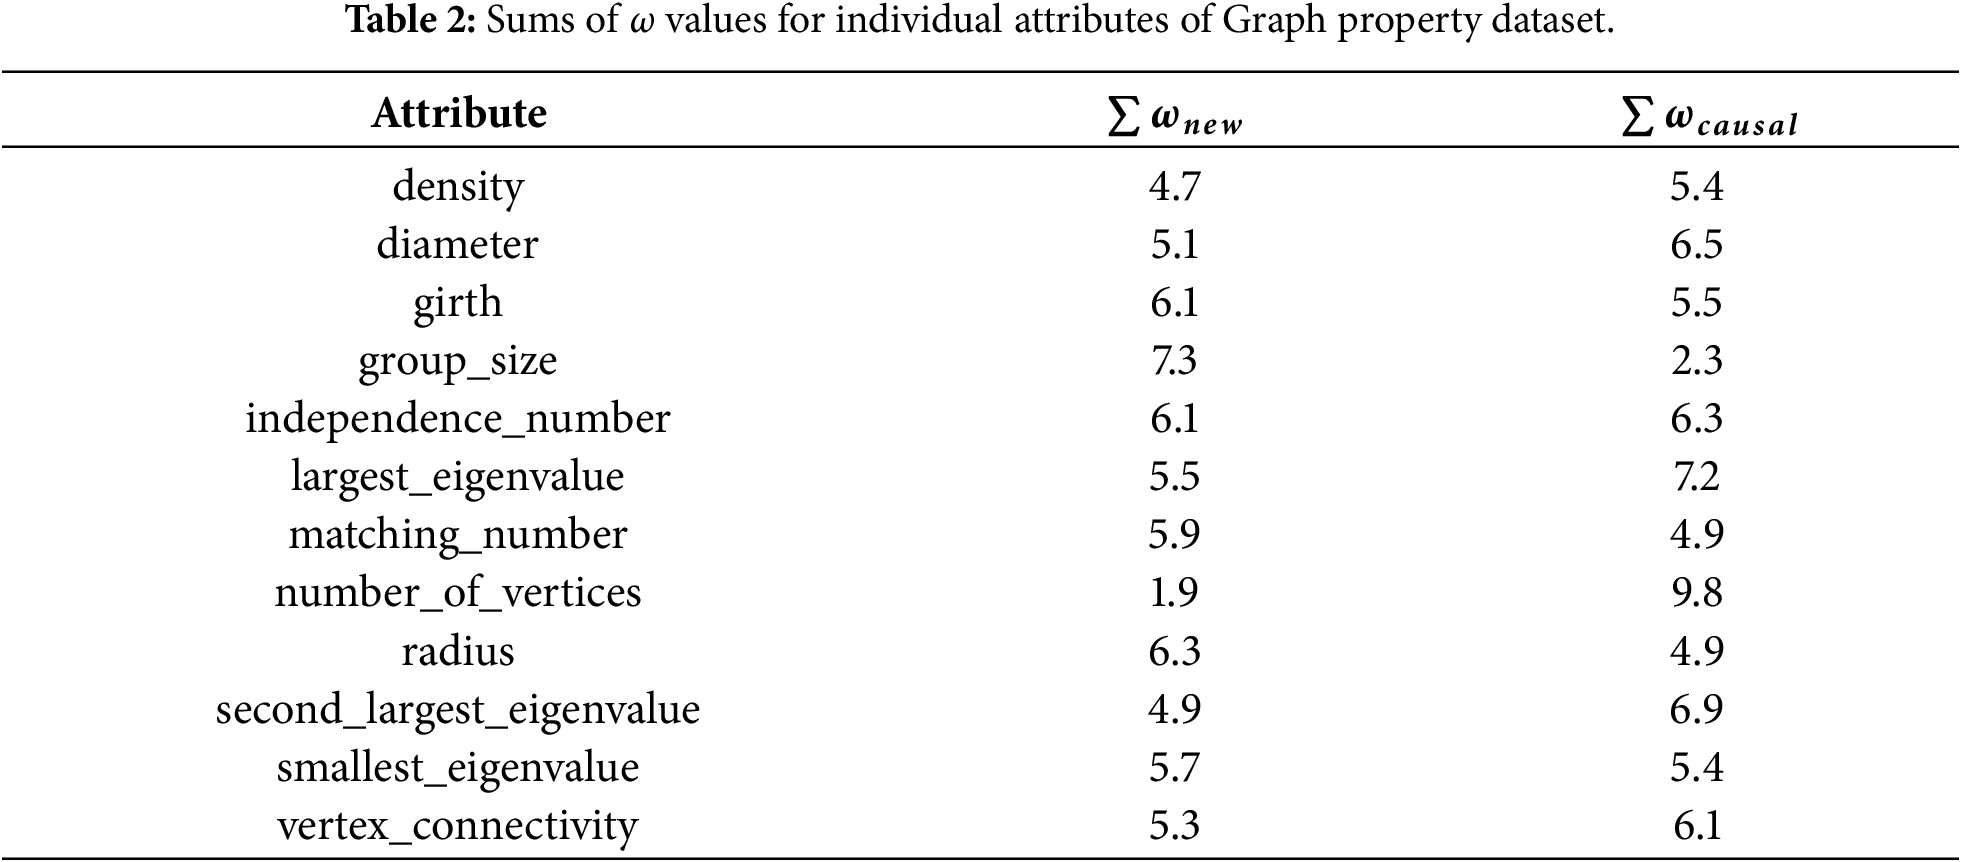
In both presented dataset studies, a clear pattern is evident—the two evaluated tasks behave in a complementary way for extreme values of
Qualitatively, the Causal Heatmap visualization demonstrates its usefulness, since relationships of interest are clearly highlighted (using higher coefficient values), while irrelevant relationships are effectively suppressed toward zero, supporting efficient semantic causal analysis via the visualization model.
4.2 Evaluation of the Large Language Model Use as the Semantic Causal Evaluator
The second aspect evaluated in this section of the presented work focuses on the use of large language models as semantic causal evaluators. Since the language model used in the proposed system evaluates the familiarity of relationships present in data as described above, it is critical for these evaluations (generated
For the purpose of the analysis of generated
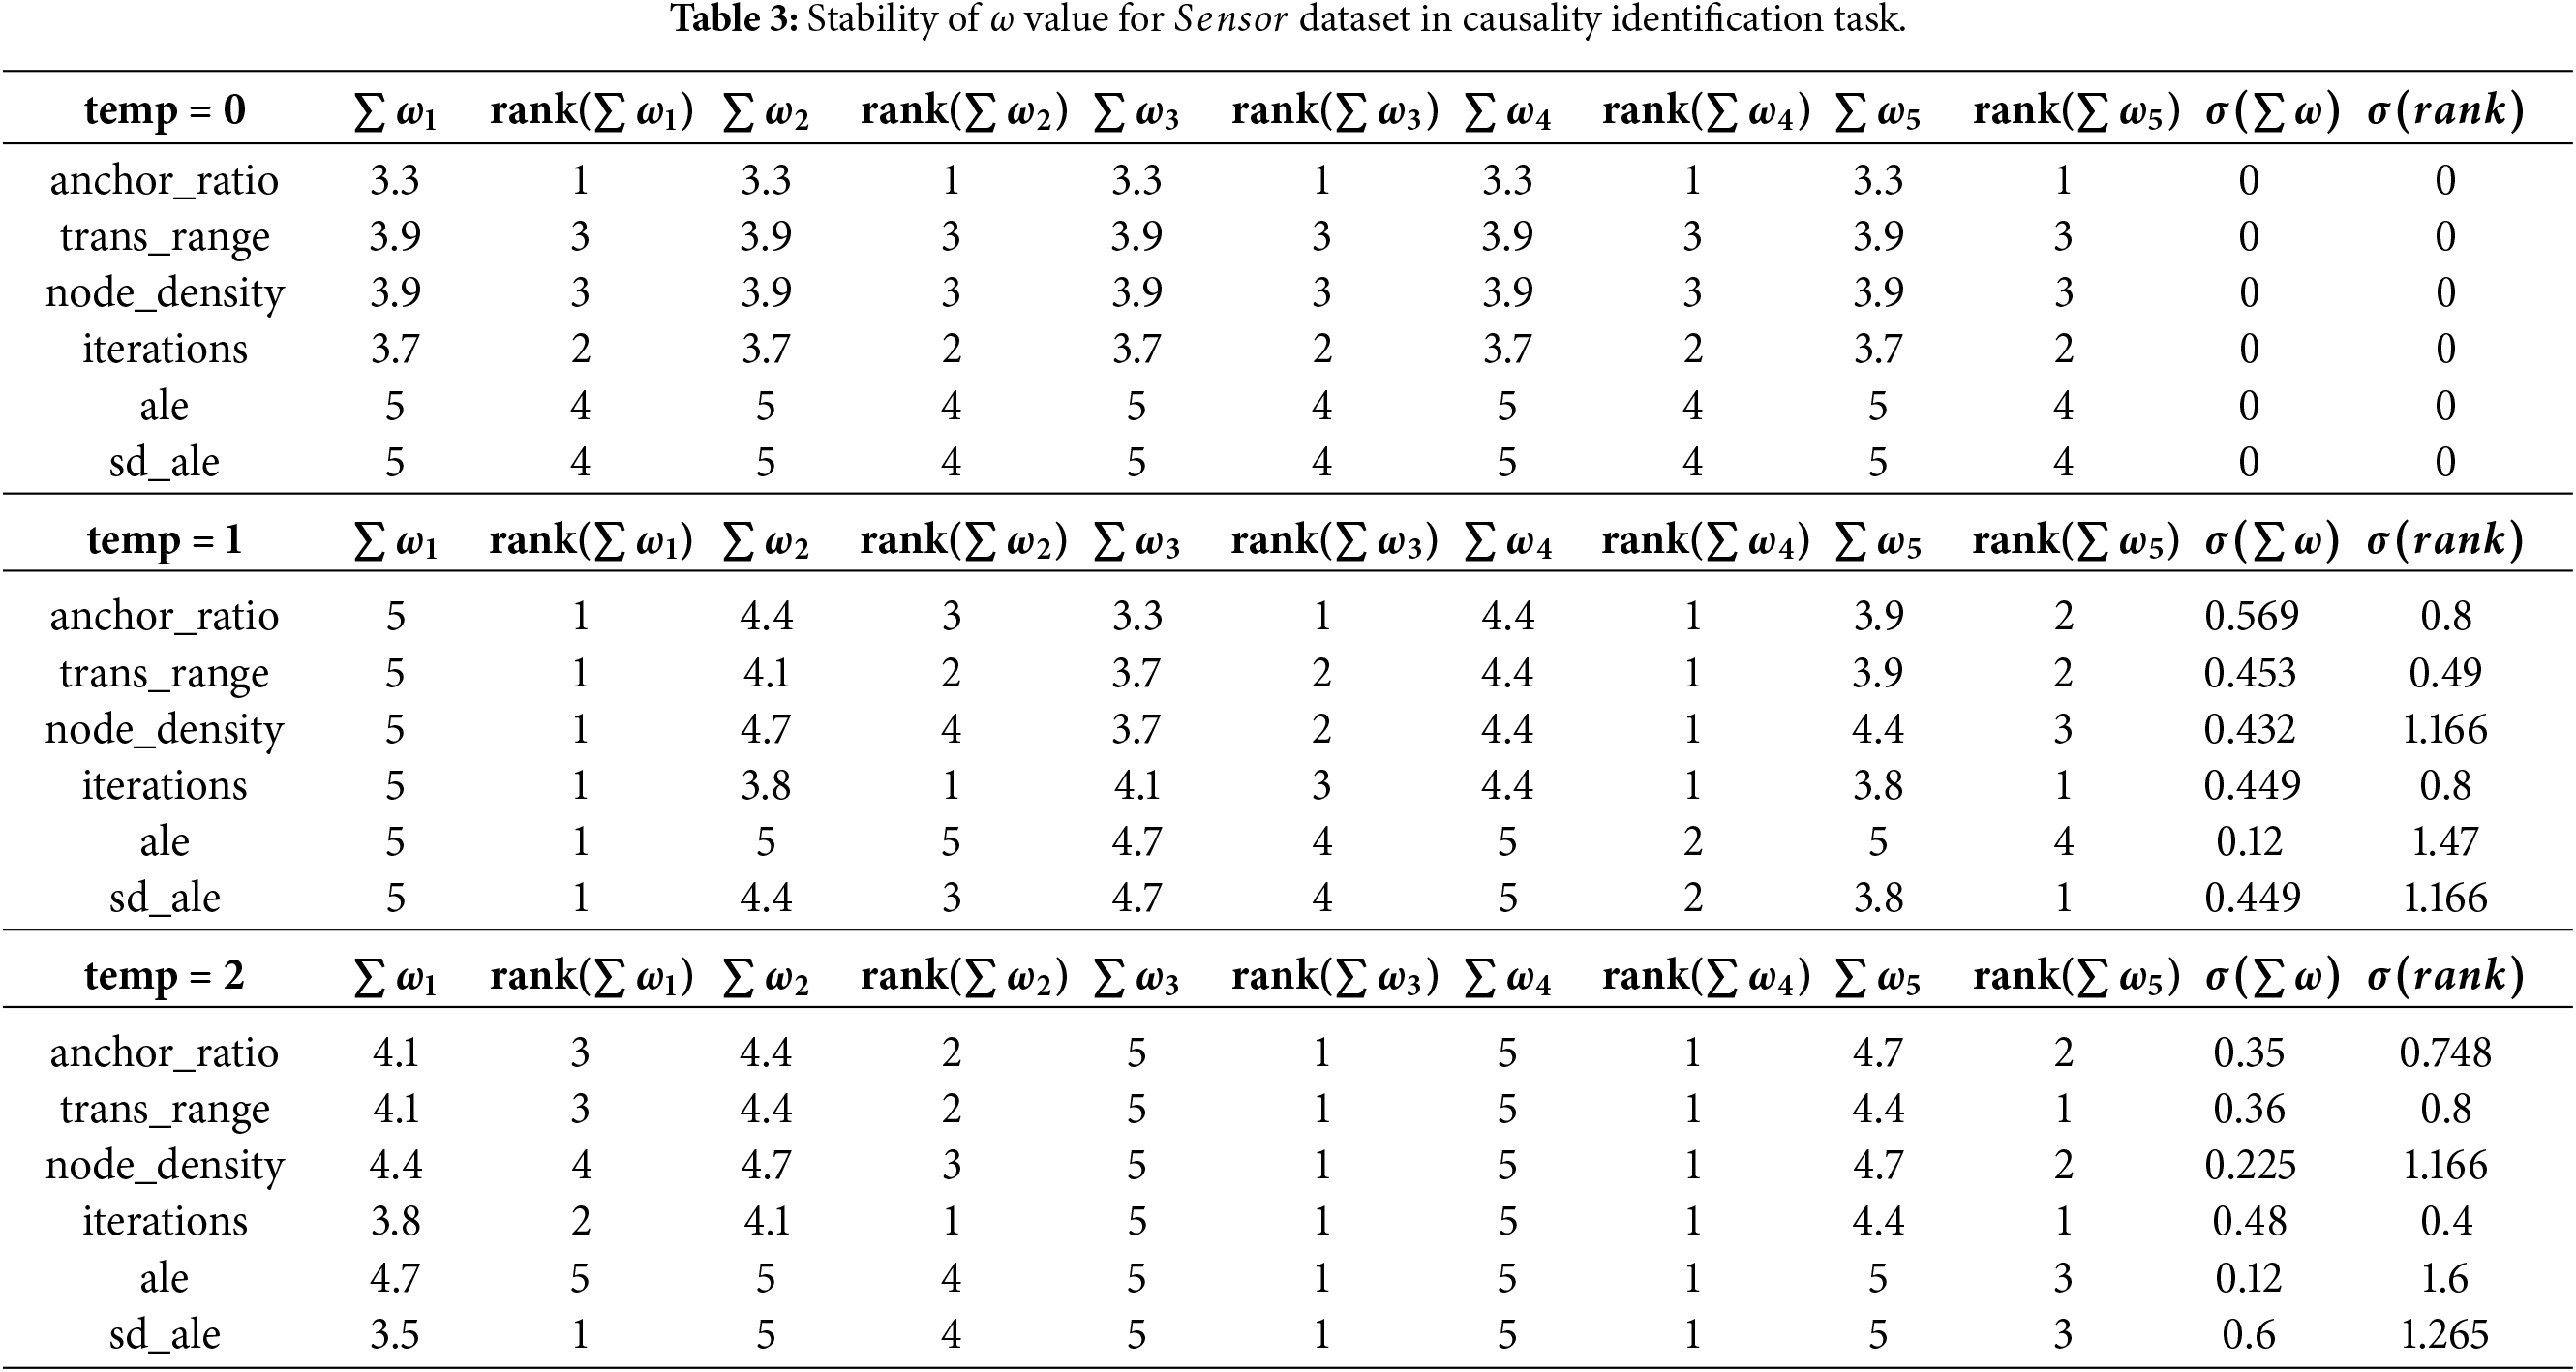
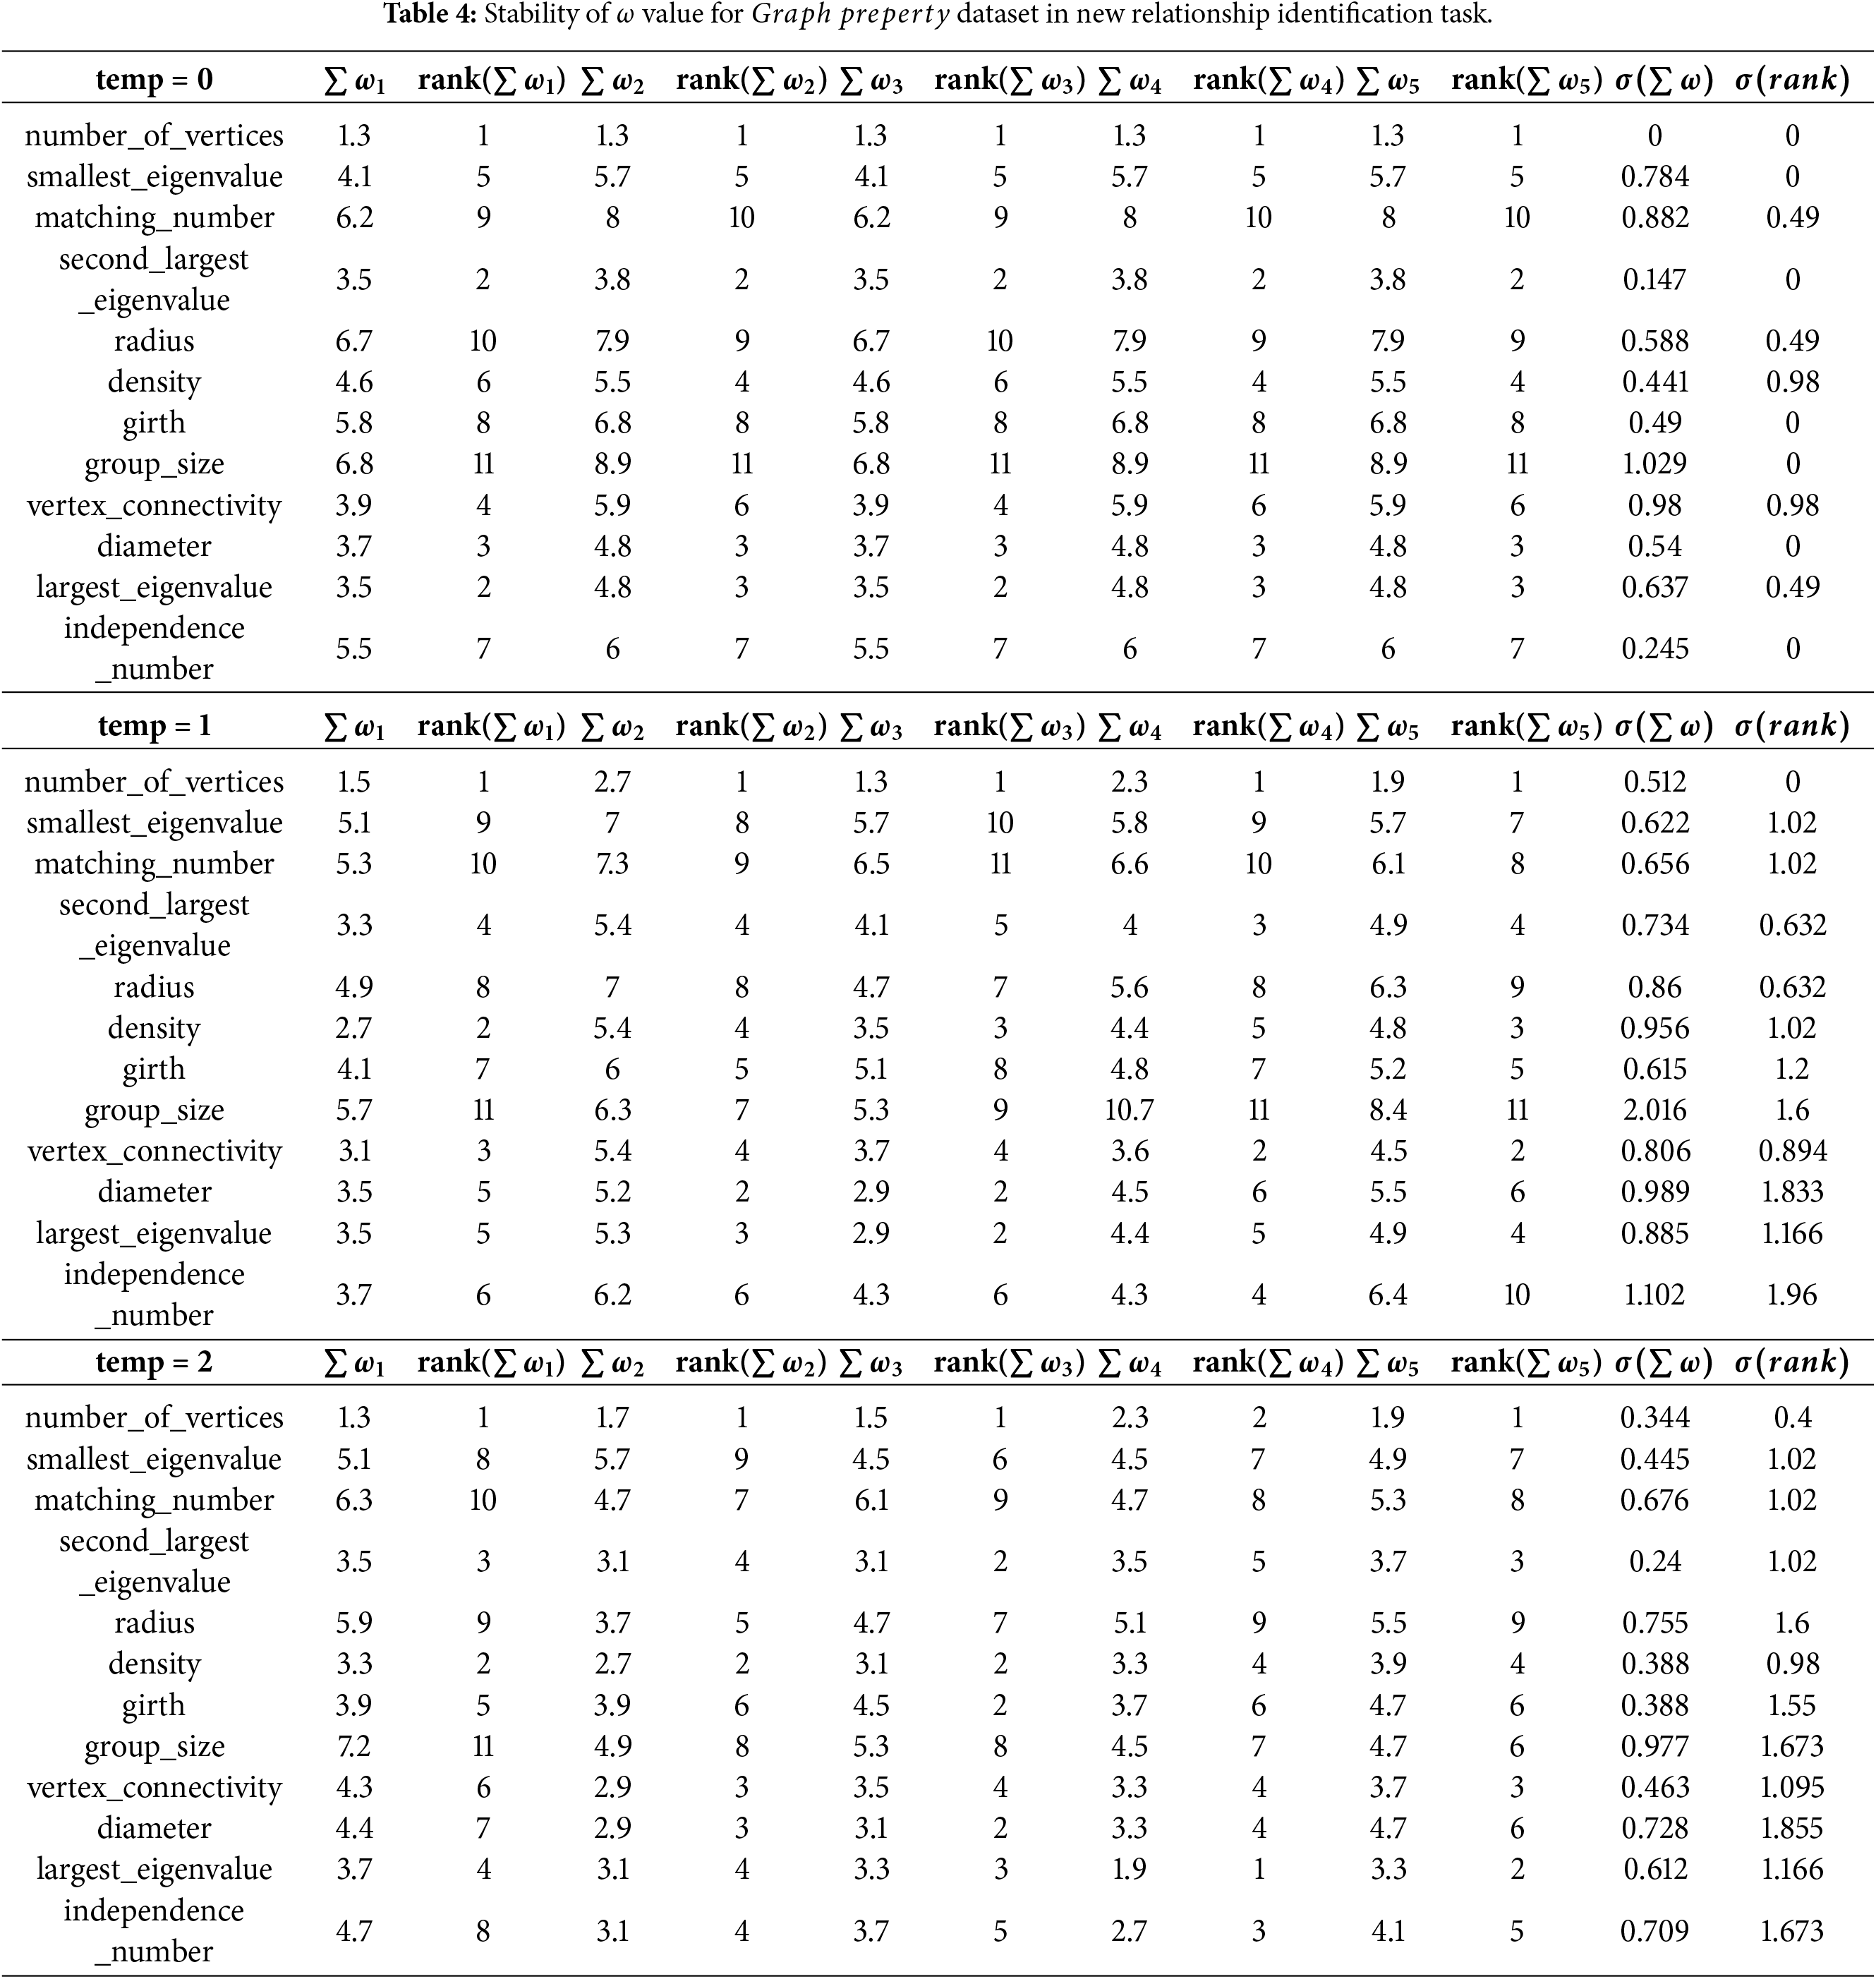
The results of the experiments conducted on the
When considering the
Hence, these results show that temperature significantly influences model stability, with
As the last part of the evaluation, a comparative analysis is conducted from two perspectives. Firstly, in the context of causal relationship identification, the proposed approach is compared with the Peter-Clark algorithm [15] and the Greedy Equivalence Search method [16]. Secondly, within the context of large language models, the behaviour of Gemini—used as part of the proposed approach—is compared with that of OpenAI ChatGPT [17] and Anthropic Claude [18], as the currently most popular large language models in the area.
Both the Peter-Clark and Greedy Equivalence Search methods identify several causal relationships in the data. However, in comparison to the proposed method, their identification remains purely binary, indicating only the presence or absence of a relationship without providing any evaluation of its strength. On the other hand, the proposed method not only identifies the causal relationships, but also supplements their evaluation via causality coefficient values, enabling the classification of relationships into multiple categories based on their relative strength.
Figs. 8 and 9 present the results obtained using the standard Peter-Clark algorithm and the Greedy Equivalence Search method, respectively, for the
Figure 8: Heatmap of Peter-Clark algorithm for sensor dataset.
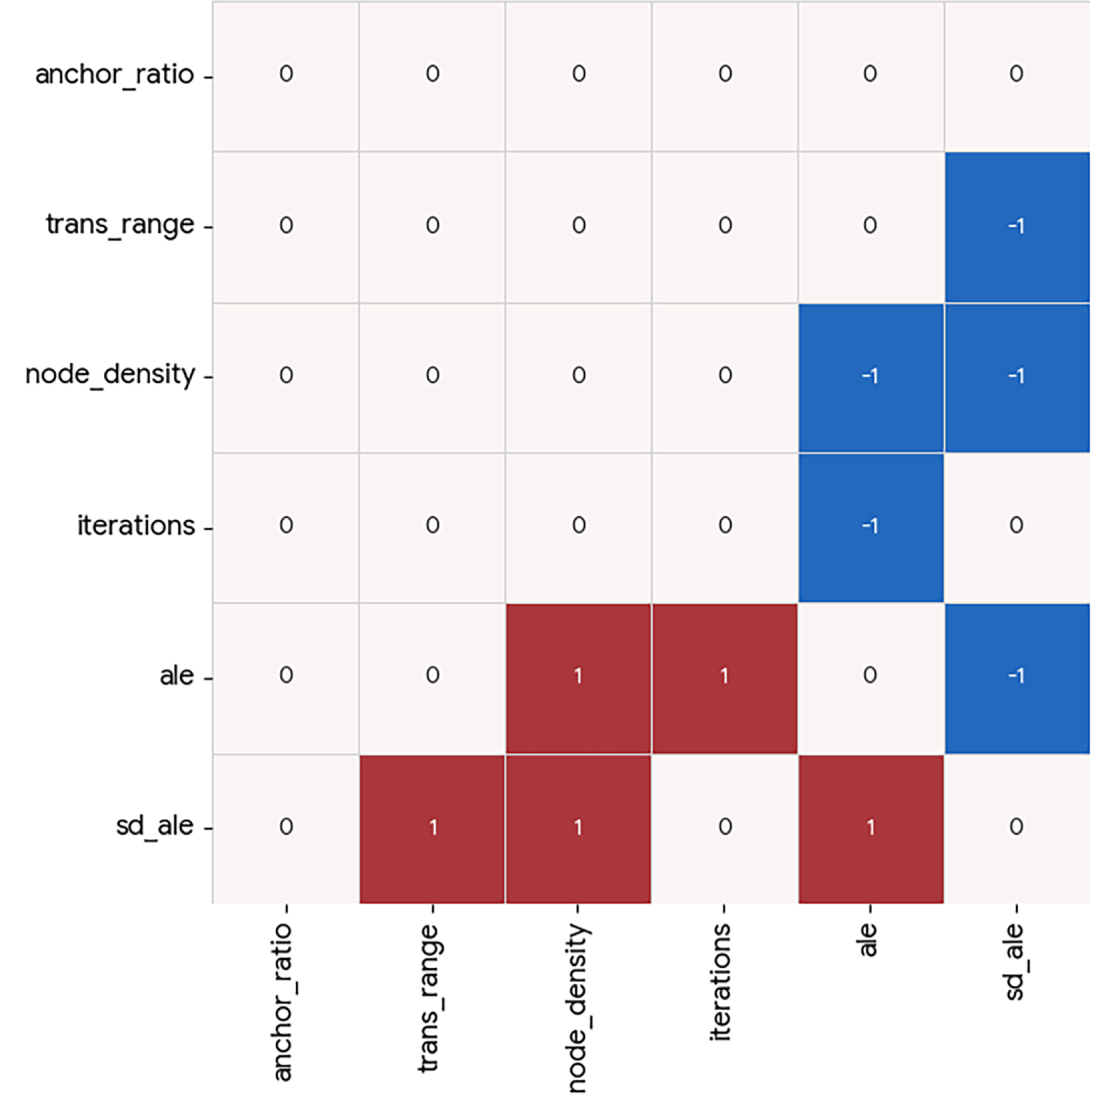
Figure 9: Heatmap of greedy equivalent search approach for sensor dataset.
The method proposed in this study identifies
For the
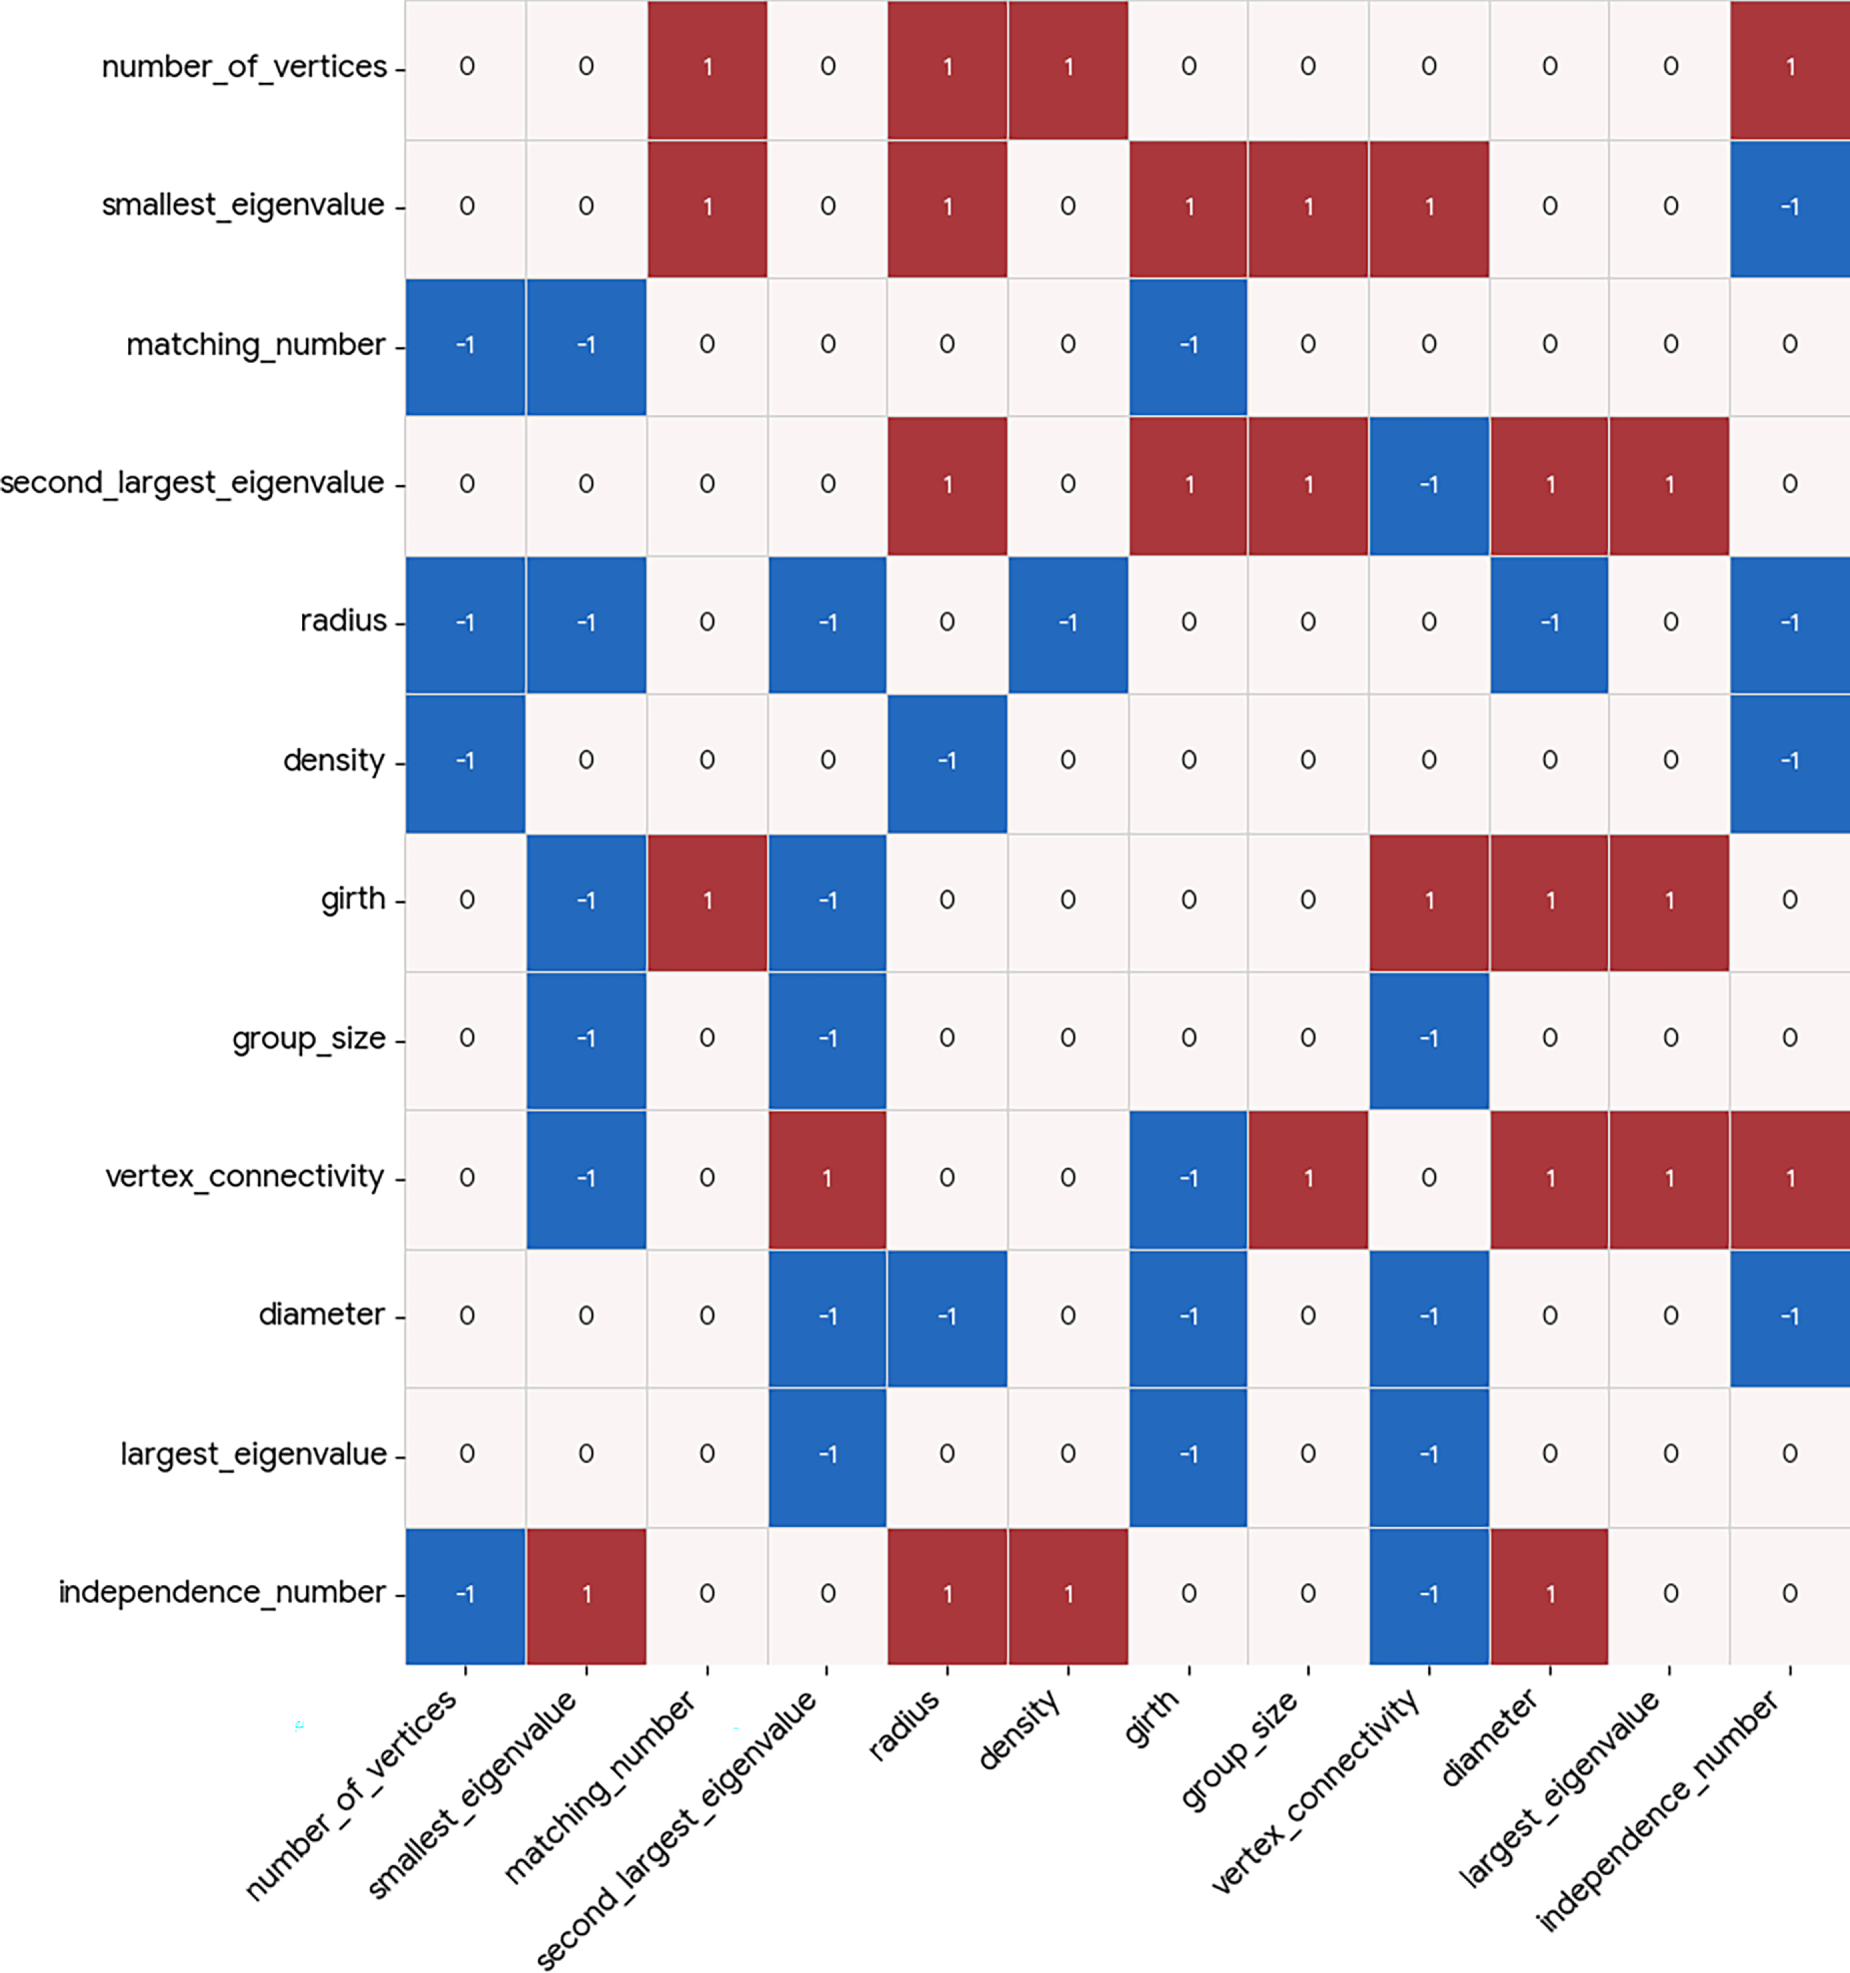
Figure 10: Heatmap of Peter-Clark algorithm for graph property dataset.
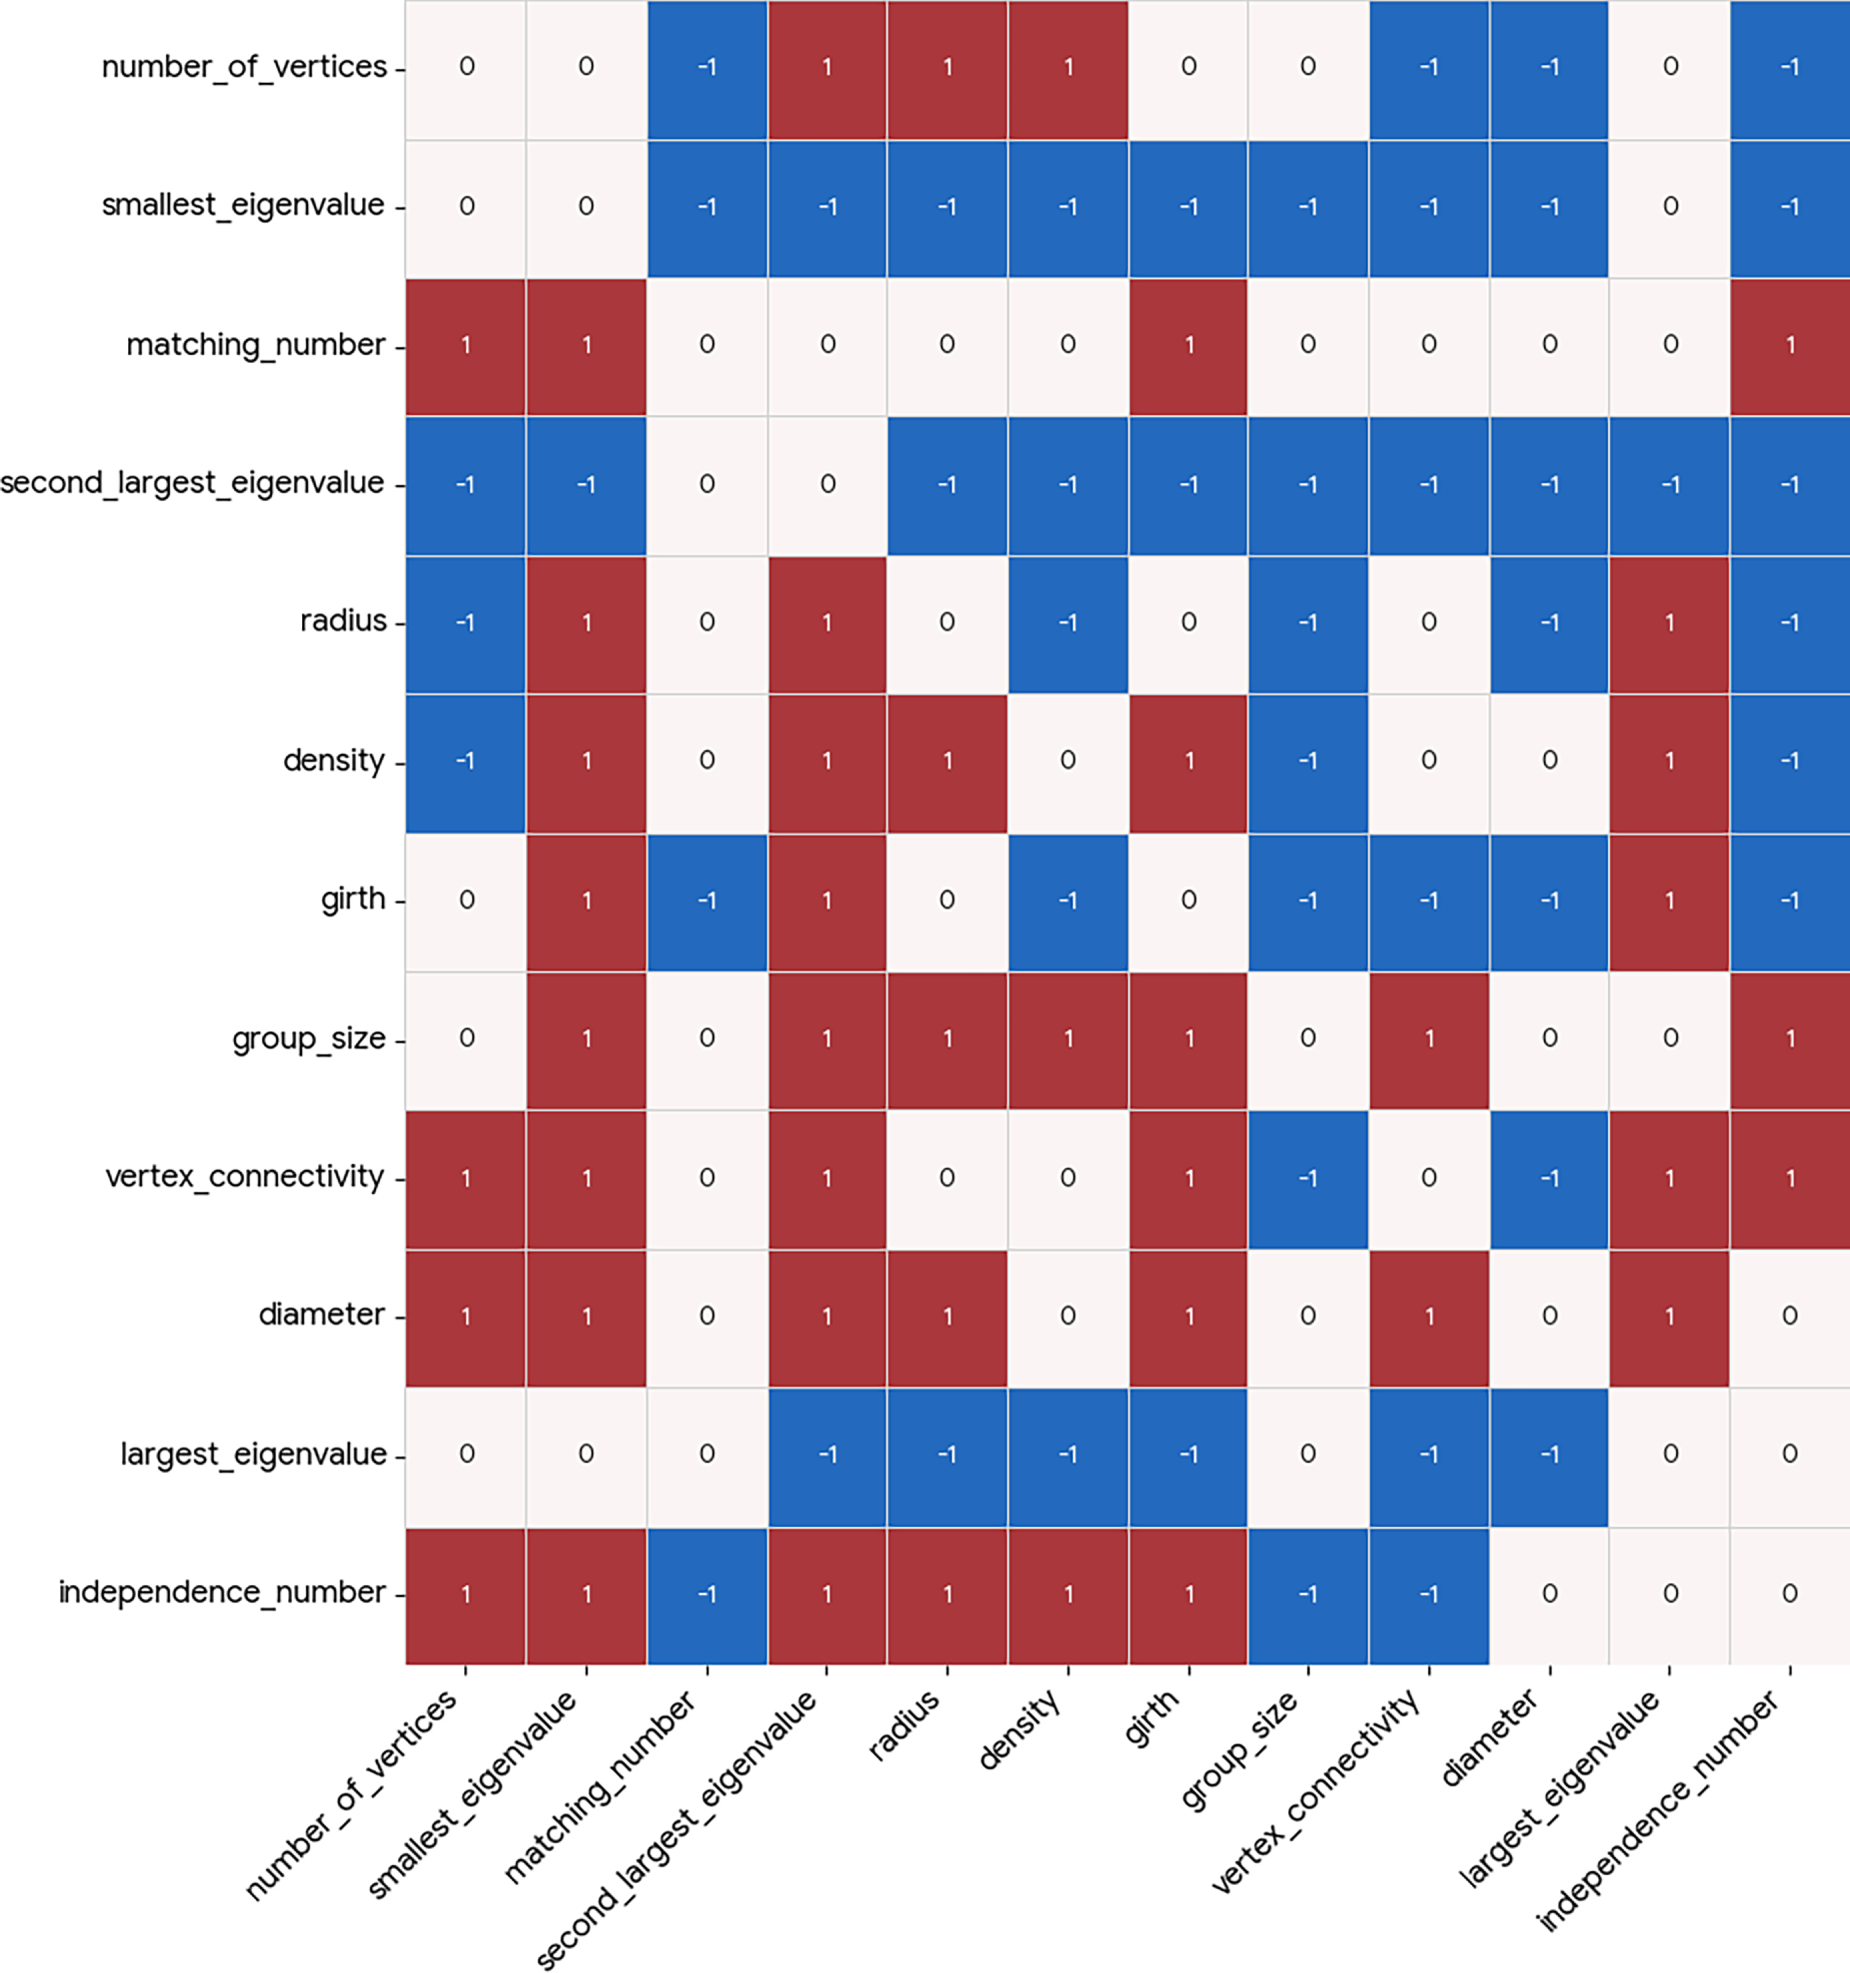
Figure 11: Heatmap of greedy equivalent search approach for graph property dataset.
• Strong causal relationships include the relationship between
• Medium-strength relationships can also be observed in the dataset. These include the relationship between
When comparing the results of the proposed method with those obtained using conventional approaches, it becomes evident that the original proposed method presents more strict strategy to the identification of causal relationships. However, besides the identification of relationships themselves, the proposed method evaluates them quantitatively through the use of causality coefficient values, providing a more nuanced assessment than binary causal discovery methods.
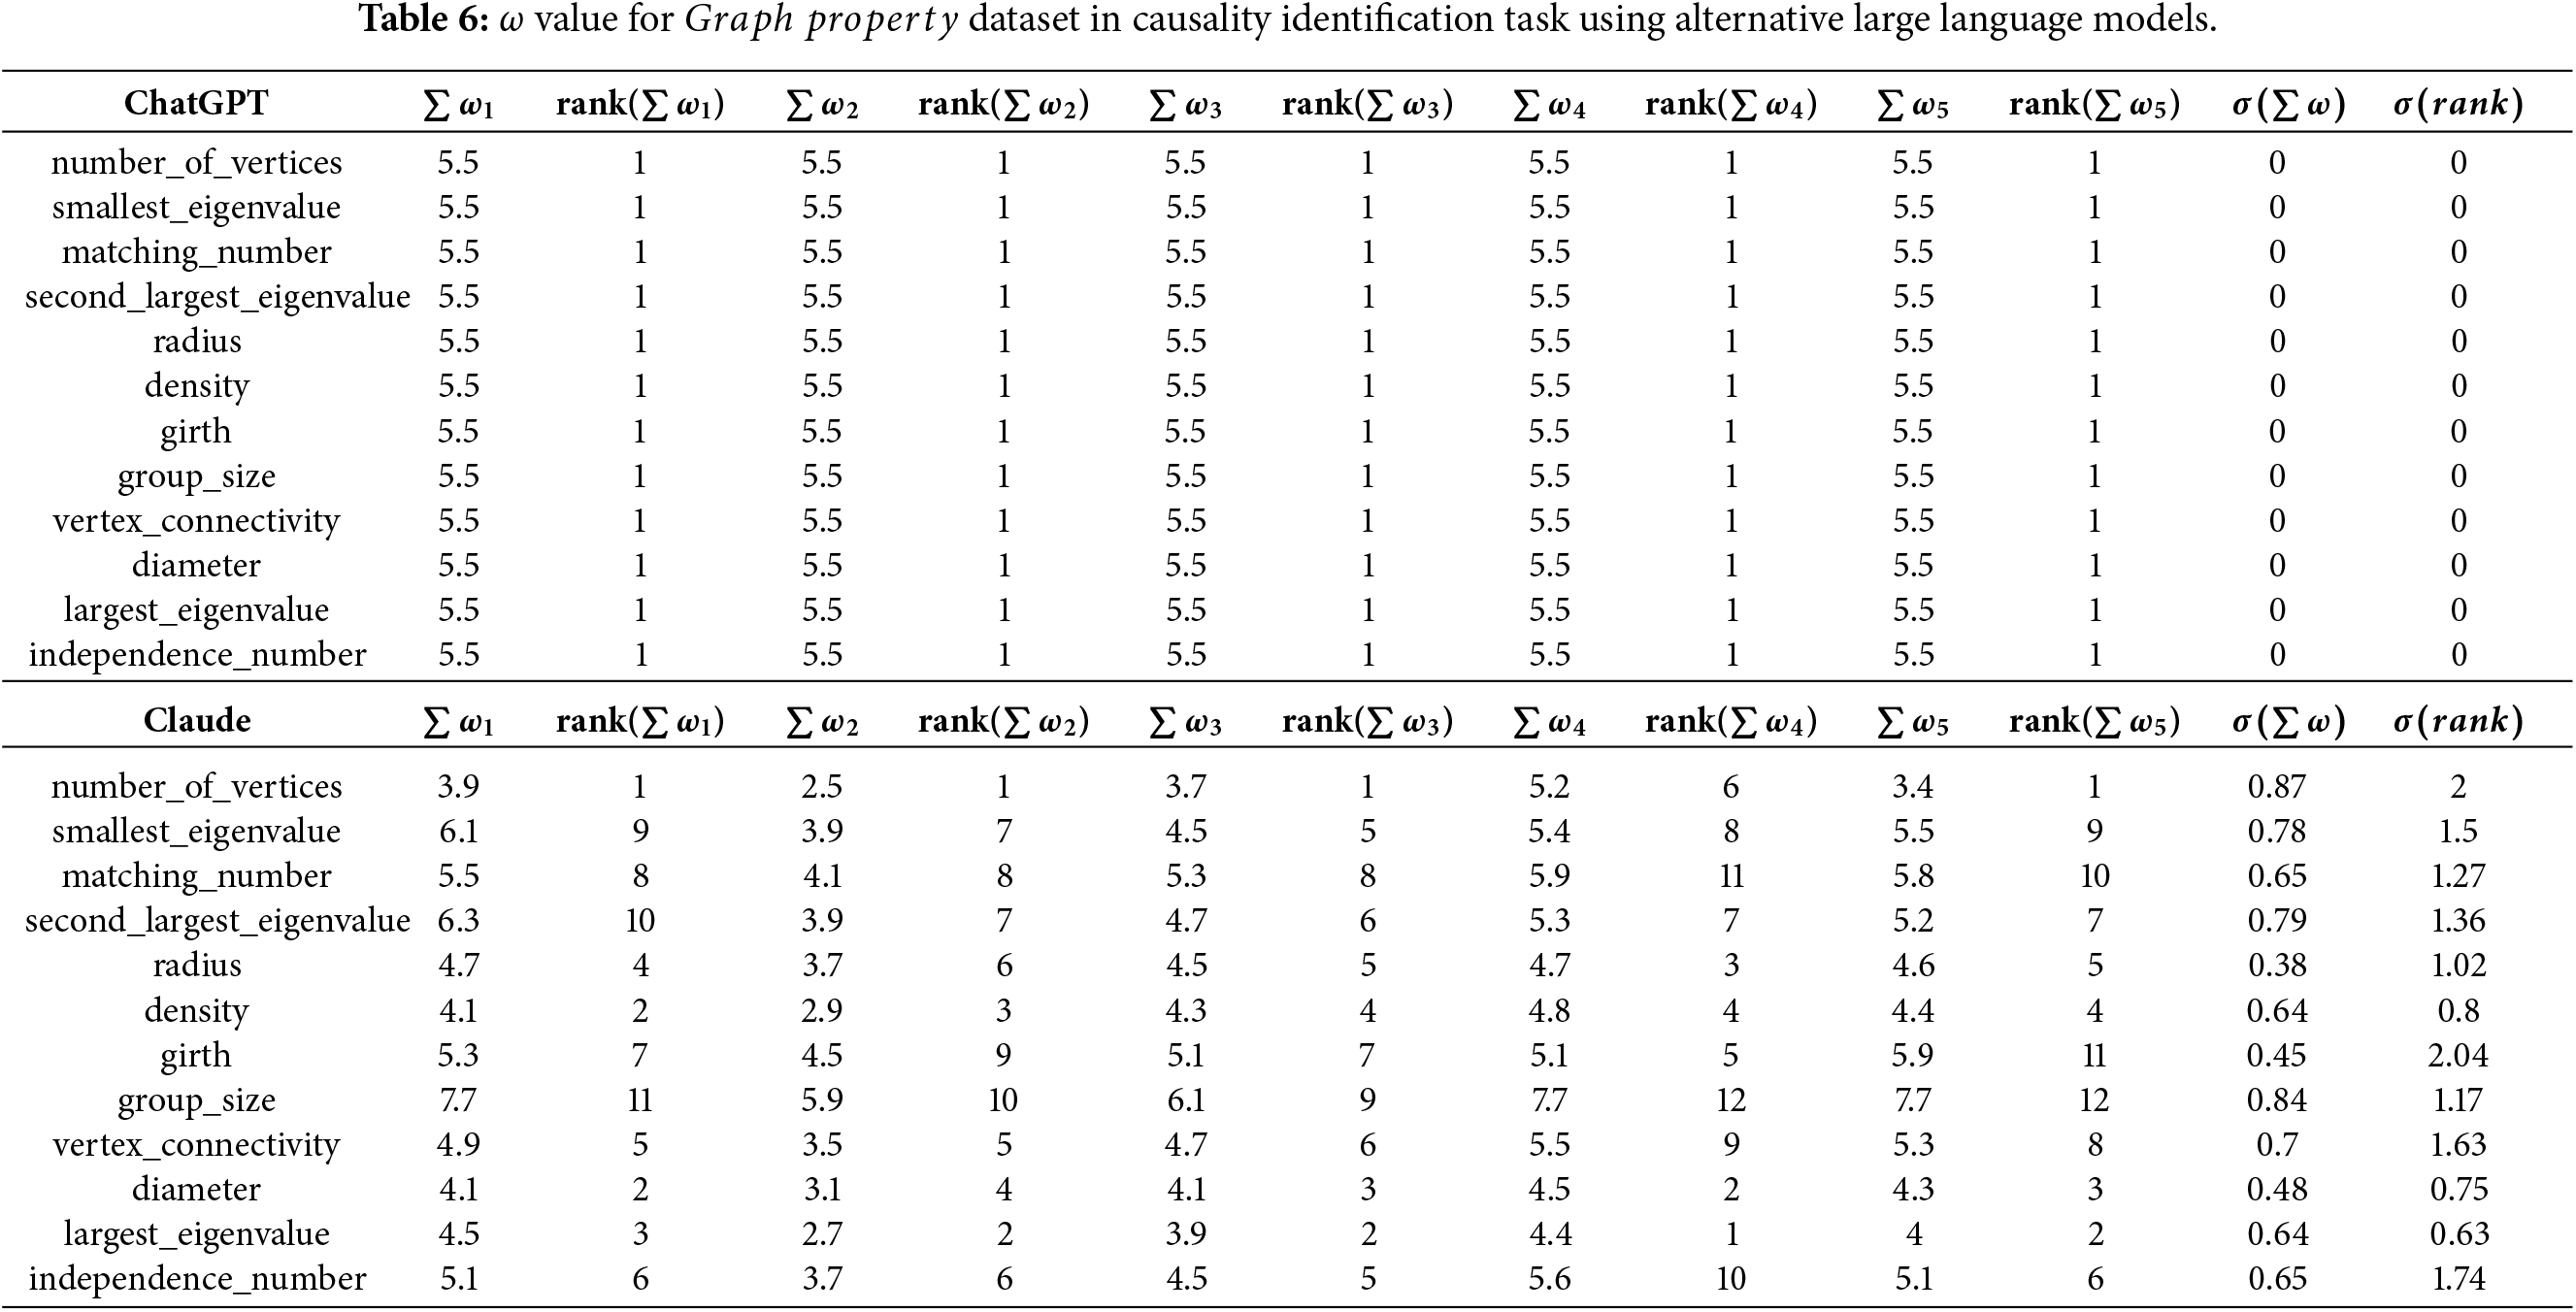
The second aspect of comparative analysis focuses on the utilization of large language models in the evaluatory process. Table 5 presents a comparison of
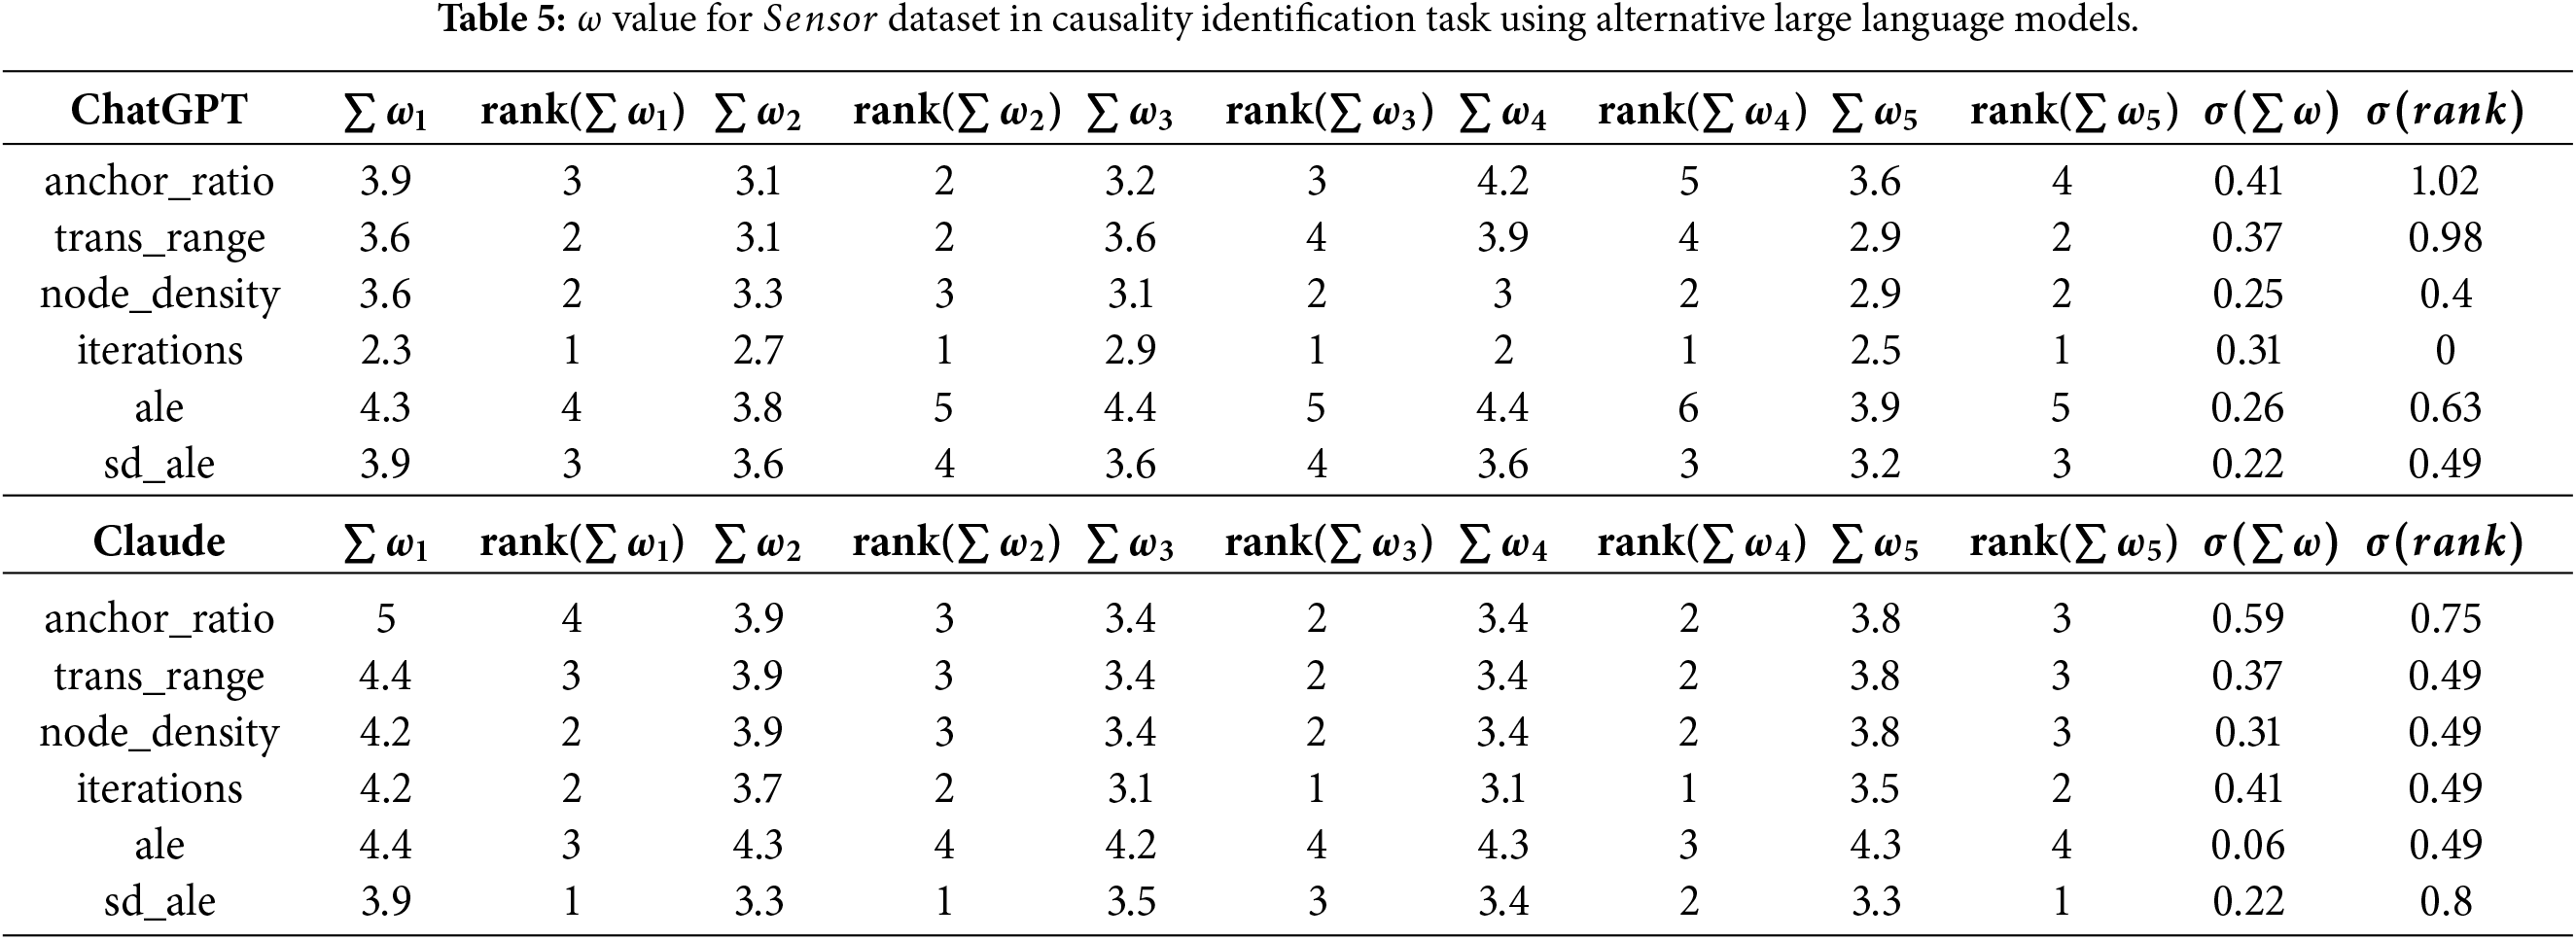
Table 6 presents the corresponding comparison for the
Correlation and causality are frequently examined together, as correlations often motivate deeper causal investigation of the situation identified in data. This study introduces a visual analysis method that utilizes large language models to assess the semantic causality of relationships initially identified through correlation analysis. The proposed approach was experimentally evaluated from two perspectives—its visualization design and its large language model-based causal evaluation, where both of the components produced results deemed satisfactory, while several advantages and disadvantages of the method became evident.
The proposed approach offers several advantages, including automatic semantic causality evaluation rooted in real-world familiarity of relationships, clear highlighting of causal or novel relationships while suppressing weak ones, and the ability to highlight attributes where relationships are well known or largely unexplored. The main disadvantages involve a degree of unstable behaviour of the large language model, which is expected to diminish as future large language model generations improve, and the need for proper labelling of attributes to ensure reliable assessment of the real-world plausibility of relationships.
In future work conducted within the studied area, the visualization of the direct and indirect semantic causality based on large language model causal evaluation needs to be explored via graphical models—two of such causal structures are obvious as extensions of the presented work—causal graphs and causal chains. Secondly, the 5-tier classification of the familiarity of a relationship used in this study can be further replaced with 7-, 9-, or more tiered approaches; the influence on semantic causal evaluation of which needs to be examined.
Acknowledgement: Not applicable.
Funding Statement: The research presented in the study was supported by University Grant Agency of Matej Bel University in Banská Bystrica project number UGA-14-PDS-2025.
Availability of Data and Materials: The code for the proposed causality visualization method and Sensor dataset used in the presented experiments are openly available at: https://github.com/AdamDudasUMB/CausalEvaluation. For additional information, contact the author at adam.dudas@umb.sk.
Ethics Approval: Not applicable.
Conflicts of Interest: The author declares no conflicts of interest.
References
1. Jiang Y, Feng XJ, Hue WG, Wang P. An intelligent causality analysis system for aviation safety based on nonaxiomatic logic graphs. Intell Comput. 2025;4(1):180. doi:10.34133/icomputing.0180. [Google Scholar] [CrossRef]
2. Xi Z, Chen W, Guo X, He W, Ding Y, Hong B, et al. The rise and potential of large language model based agents: a survey. Sci China Inf Sci. 2025;68(2):121101. doi:10.1007/s11432-024-4222-0. [Google Scholar] [CrossRef]
3. Hsu HP. From programming to prompting: developing computational thinking through large language model-based generative artificial intelligence. TechTrends. 2025;59(3):482–506. [Google Scholar]
4. Liu PF, Ren YM, Tao J, Ren ZX. GIT-Mol: a multi-modal large language model for molecular science with graph, image, and text. Comput Biol Med. 2024;171:1–11. [Google Scholar]
5. Zhao TQ, Yogaratham A, Yue M. A large language model for determining partial tripping of distributed energy resources. IEEE Trans Smart Grid. 2025;16(1):437–40. doi:10.1109/tsg.2024.3453649. [Google Scholar] [CrossRef]
6. Quan H, Ni W, Zhang T, Ye X, Xie Z, Wang S, et al. Large language model agents for radio map generation and wireless network planning. IEEE Netw Lett. 2025;7(3):166–70. doi:10.1109/lnet.2025.3539829. [Google Scholar] [CrossRef]
7. Zhan Y, Xiong Z, Yuan Y. Unifying remote sensing vision-language tasks via instruction tuning with large language model. ISPRS J Photogramm Remote Sens. 2025;221(8):64–77. doi:10.1016/j.isprsjprs.2025.01.020. [Google Scholar] [CrossRef]
8. Dudáš A, Vagač M. Diagnostic analysis approach to correlation maps through large language models. In: Proceedings of the 2024 IEEE 17th International Scientific Conference on Informatics (Informatics); 2024 Nov 13–15; Poprad, Slovakia. p. 62–8. [Google Scholar]
9. Vagač M, Dudáš A. Web application for large language model-based diagnostic analysis of correlation maps. IPSI BGD Trans Internet Res. 2025;21(1):62–75. doi:10.58245/ipsi.tir.2502.07. [Google Scholar] [CrossRef]
10. Iantovics LB. Avoiding mistakes in bivariate linear regression and correlation analysis, in rigorous research. Acta Polytech Hung. 2024;21(6):33–52. doi:10.12700/aph.21.6.2024.6.2. [Google Scholar] [CrossRef]
11. Yu H, Hutson AD. A robust Spearman correlation coefficient permutation test. Commun Stat Theor Meth. 2024;53(6):2141–53. doi:10.1080/03610926.2022.2121144. [Google Scholar] [PubMed] [CrossRef]
12. Annoye H, Beretta A, Heuchenne C. Statistical matching using autoencoders-canonical correlation analysis, kernel canonical correlation analysis and multi-output multilayer perceptron. Knowl Based Syst. 2025;330(B):114626. doi:10.1016/j.knosys.2025.114626. [Google Scholar] [CrossRef]
13. Google. Gemini API documentation; 2025 Sep 8. [cited 2026 Feb 1]. Available from: https://ai.google.dev/api. [Google Scholar]
14. Tao Y, Yang R, Wen Y, Zhong Y, Jiao K, Gu X. LLM-KE: an ontology-aware LLM methodology for military domain knowledge extraction. Comput Mater Contin. 2026;86(1):1–17. doi:10.32604/cmc.2025.068670. [Google Scholar] [CrossRef]
15. Biswas R, Mukherjee S. Consistent causal inference from time series with PC algorithm and its time-aware extension. Stat Comput. 2024;34(1):14. doi:10.1007/s11222-023-10330-3. [Google Scholar] [CrossRef]
16. Liu X, Feng Q, Yang Z, Wu S, Gao X, Yang Y, et al. An improved greedy equivalent search method based on relative entropy. Sci Rep. 2025;15(1):37250. doi:10.1038/s41598-025-21219-8. [Google Scholar] [PubMed] [CrossRef]
17. OpenAI. GPT API documentation. [cited 2026 Feb 1]. Available from: https://platform.openai.com/docs. [Google Scholar]
18. Anthropic. Claude API documentation. [cited 2026 Feb 1]. Available from: https://platform.claude.com/docs. [Google Scholar]
Cite This Article
 Copyright © 2026 The Author(s). Published by Tech Science Press.
This work is licensed under a Creative Commons Attribution 4.0 International License , which permits unrestricted use, distribution, and reproduction in any medium, provided the original work is properly cited.
 Downloads
 Citation Tools