
 Submit a Paper
 Propose a Special lssue
 Open Access
ARTICLE

ECSA-Net: A Lightweight Attention-Based Deep Learning Model for Eye Disease Detection
1 Faculty of Informatics, Kaunas University of Technology, Kaunas, Lithuania
2 Department of Computer Science, HITEC University Taxila, Taxila, Pakistan
3 Department of Computer Sciences, College of Computer and Information Sciences, Princess Nourah bint Abdulrahman University, Riyadh, Saudi Arabia
4 Department of Information Systems, Faculty of Computing and Information Technology, King Abdulaziz University, Jeddah, Saudi Arabia
5 Department of Information Technology, College of Computing and Information Technology, Northern Border University, Arar, Saudi Arabia
6 Department of Information Systems, College of Computer and Information Sciences, Princess Nourah bint Abdulrahman University, Riyadh, Saudi Arabia
* Corresponding Author: Sara Tehsin. Email:
(This article belongs to the Special Issue: Bridging the Gap: AutoML and Explainable AI for Industrial and Healthcare Innovations)
Computers, Materials & Continua 2026, 87(2), 56 https://doi.org/10.32604/cmc.2026.076515
Received 21 November 2025; Accepted 07 January 2026; Issue published 12 March 2026
 View Full Text
 Download PDF
Abstract
Globally, diabetes and glaucoma account for a high number of people suffering from severe vision loss and blindness. To treat these vision disorders effectively, proper diagnosis must occur in a timely manner, and with conventional methods such as fundus photography, optical coherence tomography (OCT), and slit-lamp imaging, much depends on an expert’s interpretation of the images, making the systems very labor-intensive to operate. Moreover, clinical settings face difficulties with inter-observer variability and limited scalability with these diagnostic devices. To solve these problems, we have developed the Efficient Channel-Spatial Attention Network (ECSA-Net), a new deep learning-based methodology that integrates lightweight channel- and spatial-attention modules into a convolutional neural network. Ultimately, ECSA-Net improves the efficiency of computational resource use while enhancing discriminative feature extraction from retinal images. The ECSA-Net methodology was validated by conducting a series of classification accuracy tests using two publicly available eye disease datasets and was benchmark against a number of different pretrained convolutional neural network (CNN) architectures. The results showed that the ECSA-Net achieved classification accuracies of 60.00% and 69.92%, respectively, while using only a compact architecture with 0.56 million parameters. This represents a reduction in parameter size by a factor of 14Keywords
Eye diseases are among the leading causes of blindness worldwide among people over 50 and pose a significant public health concern [1]. Globally, according to the World Health Organization (WHO), 2.2 billion people have vision impairment, and nearly one billion cases could have been prevented and yet to be addressed [2], which is also causing a global financial impact with an estimated annual cost of $410.7 billion in lost productivity [3]. Facts state that 4% of the world’s blind people live in Pakistan, and 1.7 million blind people have limited access to eye care [4]. The common eye conditions of cataracts, glaucoma, diabetic retinopathy (DR), and age-related macular degeneration (AMD) are usually diagnosed too late to prevent irreversible vision loss [5]. Moreover, if left untreated, eye diseases carry a heavy burden on healthcare services, especially in low- and middle-income countries where resources are poor and access to specialized care is limited [6]. Early detection and intervention are crucial to reducing the burden of these diseases and improving patient outcomes [7].
Classically, medical imaging techniques that involve fundus photography, optical coherence tomography (OCT), and slit-lamp bio-microscopy (OCT) were used in the diagnosis of eye diseases [8]. The methods required professional ophthalmologists to interpret images for abnormalities, such as retinal damage, lesions, or changes in blood vessels [9]. Although these methods are efficient, manual diagnosis methods have several flaws, such as a scarcity of skilled experts, individual perception of the disease, and a high risk of false diagnosis, since the official may, by chance, make an incorrect judgment [10]. The process is time-consuming and less scalable because it relies on manual observation, which limits its ability to handle the growing number of patients with eye-related problems [11]. These limitations underscore the need for innovative diagnostic solutions that complement traditional methods by providing accurate, efficient, and accessible detection of eye disease [12].
To handle these challenges, researchers have examined the application of artificial intelligence and machine learning in medical image analysis. ML algorithms have shown favorable results in automating image classification, anomaly detection, and disease diagnosis [13]. Early approaches to detecting eye diseases and other degenerative conditions include decision trees, support vector machines (SVMs), and k-nearest neighbors (KNNs), which rely on handcrafted features [14]. Machine learning was useful for detecting eye disease-relevant patterns; however, these methods struggled with high-dimensional data, and accuracy and scalability decreased as dataset complexity increased. Artificial Neural Networks (ANNs) emerged to overcome some of these shortcomings by automatically extracting features, thereby avoiding the tedious manual feature engineering. Although ANNs have much potential, they are prone to overfitting and require significant computational resources to train. To address this issue, CNNs were designed for image data, with convolution and pooling layers that enabled efficient feature extraction and improved performance in tasks such as image classification [15].
For improving eye disease classification, pretrained models like residual network (ResNet), Visual Geometry Group (VGG), and Inception brought in the technique of transfer learning [16]. These models, trained on large, diverse datasets such as ImageNet, thus serve as a good baseline for many medical imaging applications [17]. Researchers have fine-tuned these pre-trained networks for specific tasks to reduce the large amounts of labeled data and the extensive computational resources required by traditional training [18]. Pretrained models not only improve accuracy but also speed up model development, which is particularly appropriate for medical imaging tasks, including retinal disease detection and classification [19]. Their success is based on their ability to extract generalized features from large-scale datasets while adapting to domain-specific nuances through fine-tuning [20].
The research presents a new methodology, “ECSA-Net,” for eye disease identification using convolutional networks with channel and spatial attention components, thereby improving feature extraction performance. ECSA-Net diverges from standard attention networks by incorporating pooling and one-by-one convolution layers to effectively reduce channel dimensionality, thereby optimizing computation. The architecture is composed as a hierarchy where progressively deeper feature extraction is performed. Each convolutional attention block includes a max pooling layer and a dropout layer to reduce overfitting during model training. By using this architecture, this research seeks to systematically address the following four questions.
• Do lightweight attention mechanisms provide comparable performance to heavy computational pretrained models (pre-trained networks) on eye disease classification tasks?
• Which are the contributions of channel and spatial attention modules, both separately and collectively, regarding the ability to accurately diagnose patients from imbalanced medical datasets?
• Can a deep learning algorithm that is computationally efficient (<1 Million parameters), be successfully deployed into resource-constrained clinical settings while still providing clinically acceptable results?
• Is there a quantitative impact of specific architectural components (MaxPooling layers, Dropout regularization, and hierarchical attention integration) on model performance, generalizability, and robustness?
The answers to these questions are used to design the experimental protocol for evaluating each component using detailed ablation studies. The ablation study tables systematically outline the effect that each component has had on predicting performance, compared to prior models (state-of-the-art), with respect to the balance between efficiency and performance, and the statistical testing associated with both datasets. The unique architecture of the proposed ECSA-NeT balances efficiency and performance, ensuring accuracy comparable to that of models with higher parameter counts; therefore, ECSA-NeT is suitable for deployment in resource-limited clinical environments.
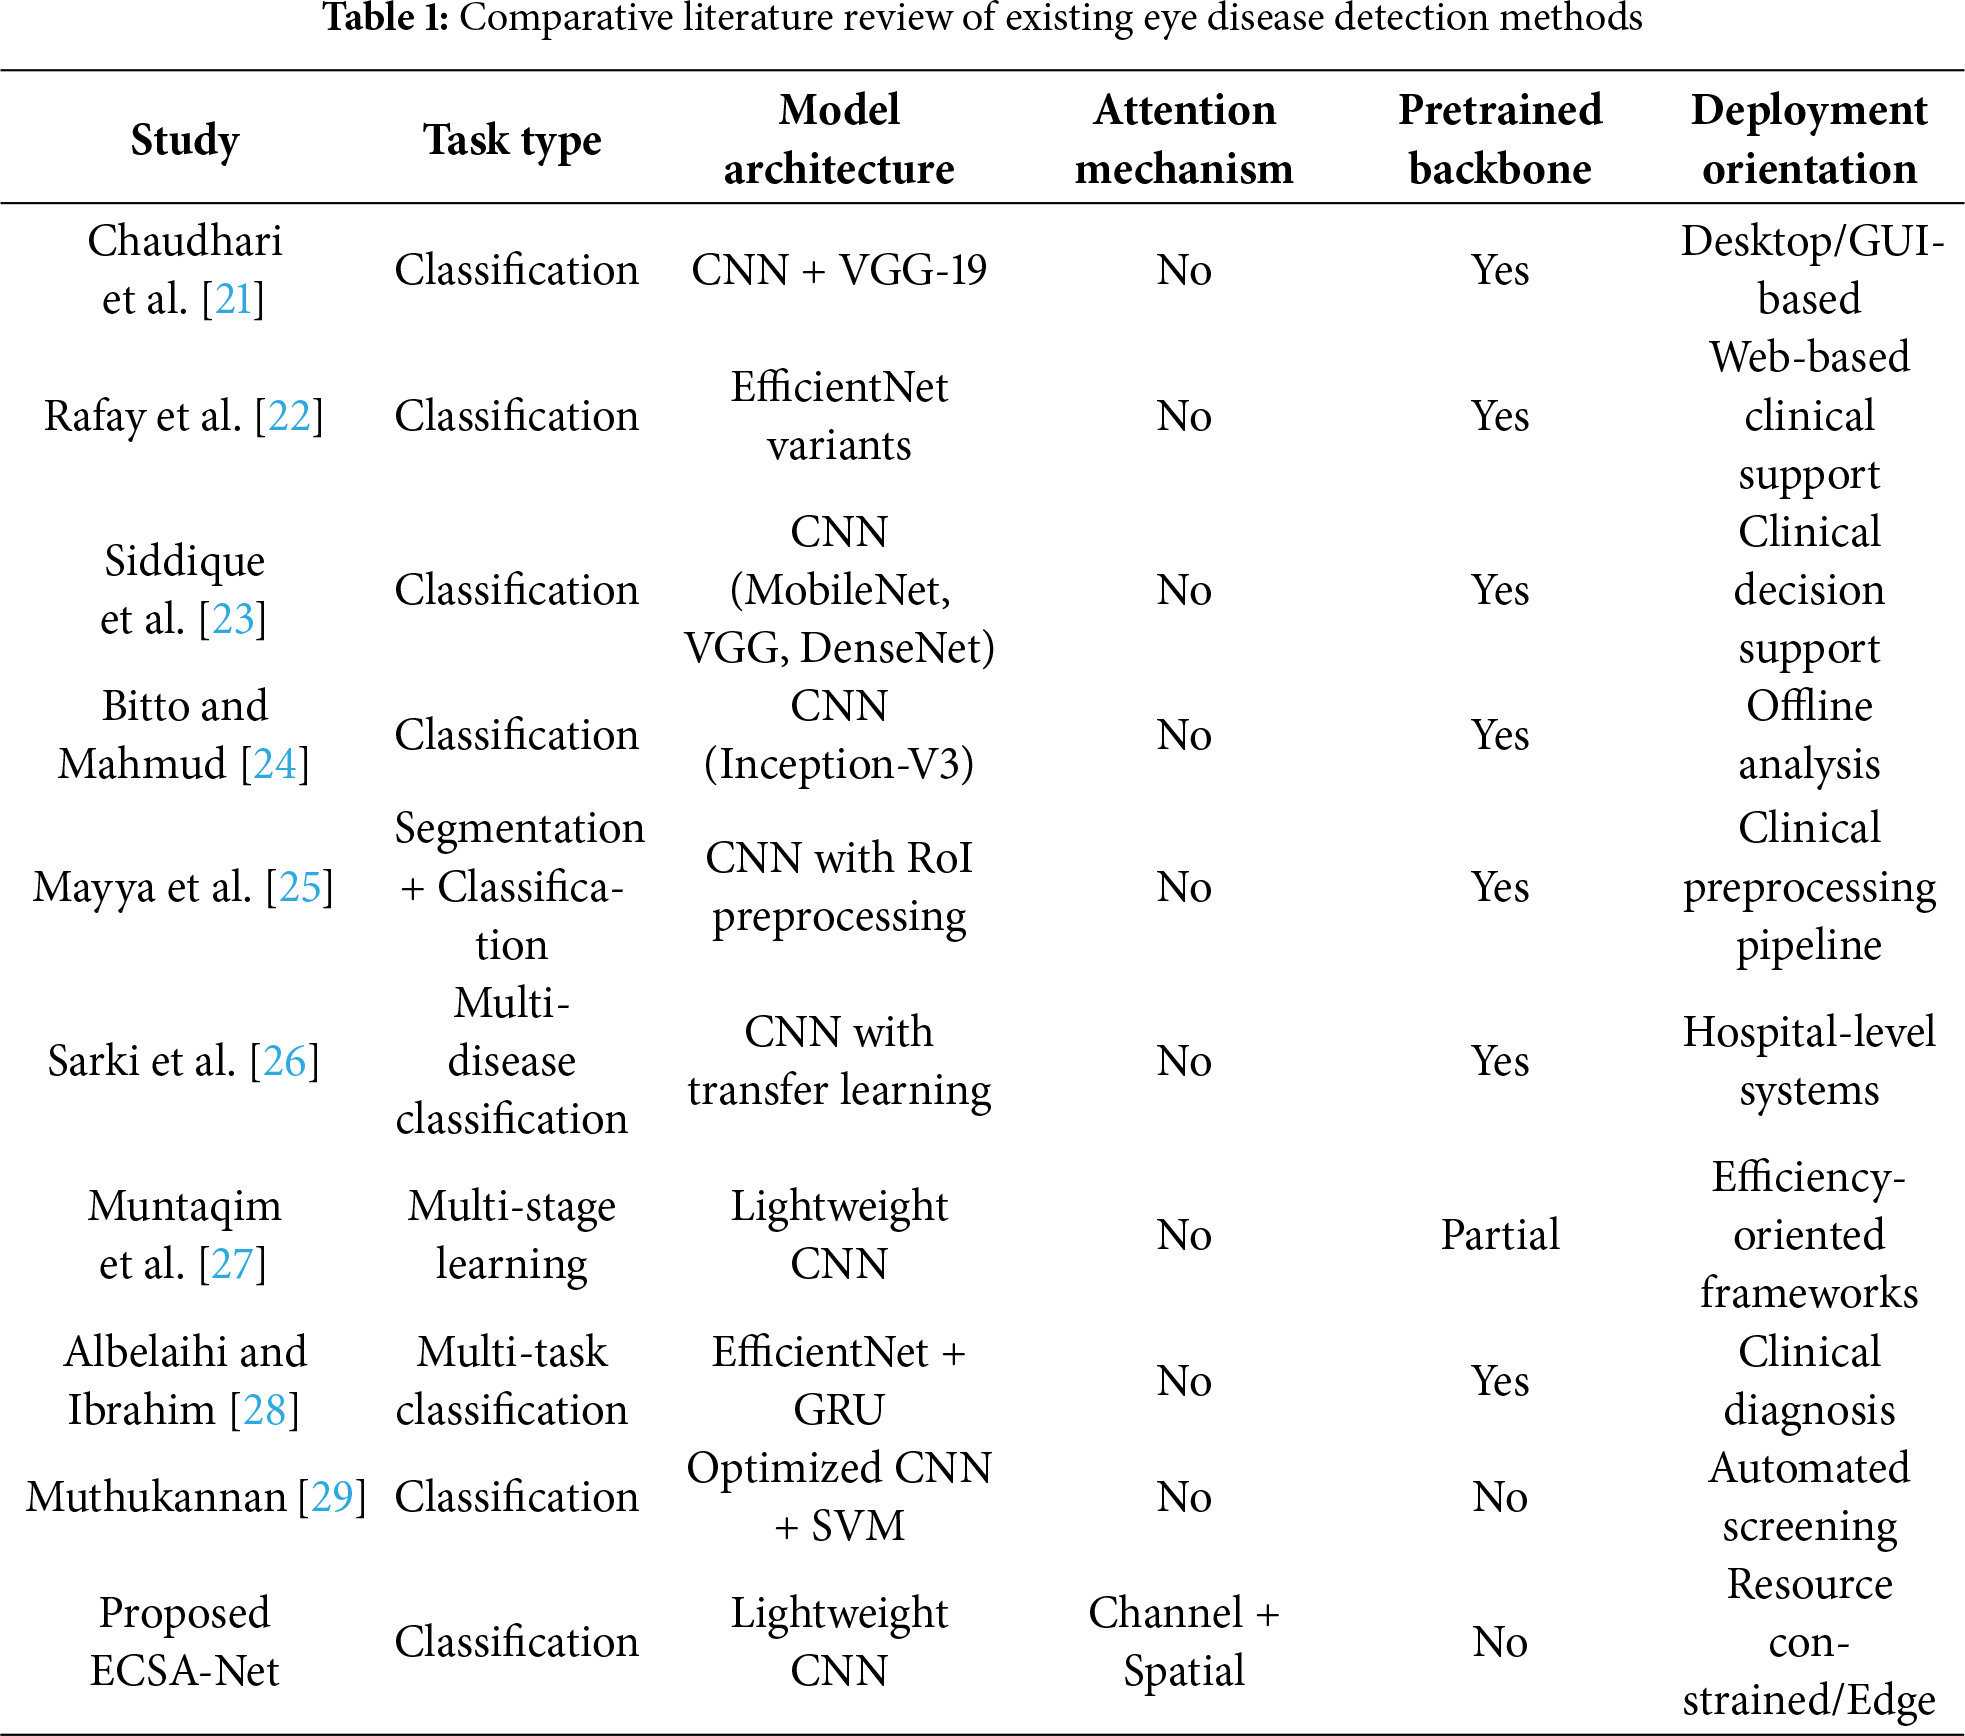
From the foundation of deep learning till now, various architectures have been developed for the classification of eye diseases. This section organizes recent studies into three primary categories based on their methodological approaches: classification-only methods, segmentation-based methods, and hybrid methods that combine segmentation and classification for multi-task learning.
2.1 Classification-Only Approaches
Chaudhari et al. [21] proposed a low-cost real-time system for eye disease detection and classification using deep learning. The research used a CNN followed by VGG-19 and achieved 94.35% accuracy in categorizing fundus images into Cataract, Diabetes, Glaucoma, Normal, and Other. The mixture of VGG-19 with a CNN framework improved the baseline CNN accuracy of 88%, thereby validating the potential of pre-trained models to boost performance. An interactive graphical user interface (GUI) enabled real-time classification and prediction from images captured by Android devices. The system proved highly impactful for early disease detection in underprivileged communities, providing timely medical services and improving visual health outcomes. The research advantages in terms of accessibility and cost-effectiveness also come with disadvantages, including reliance on high-quality images for accurate predictions and the need for comprehensive training across various datasets.
Rafay et al. [22] presented the novel “EyeCNN” approach to detect multiple eye diseases using CNNs. EfficientNet B3 proved to be the best approach compared to previous research. The dataset contains retinal images of Diabetic Retinopathy, Glaucoma, Cataracts, and Normal eyes, which were preprocessed and tested on 12 models. These models included variants of EfficientNet, ResNet, and Xception. EfficientNet B3 achieved the highest test accuracy of 94.30% after 15 epochs. This model relied on compound scaling to adapt its capacity. The model was deployed on a Streamlit-based web server to make it accessible to the public. The study demonstrates the potential of CNNs to help ophthalmologists achieve accurate, efficient diagnoses while paving the way for deeper understanding and the development of treatments. Although it performed well, the model had several drawbacks, including under-performance in detecting Glaucoma and a reliance on high-quality input data for optimal results.
Siddique et al. [23] proposed a CNN-based system for the early detection of common eye diseases in Bangladesh, including cataract, chalazion, and squint. The system uses six CNN models for disease recognition: VGG16, VGG19, MobileNet, Xception, InceptionV3, and DenseNet121. After a series of thorough experiments and hyperparameter optimization, the MobileNet model achieved the best performance with an accuracy of 97.49%, outperforming other models in precision, recall, and F1-score. The system was tested using retinal fundus images and has proven to be more accurate than existing models. The proposed system can predict the presence of these diseases and identify healthy eyes. This research significantly contributes to the field by offering a solution for automatic eye disease detection, which may be very helpful in Bangladesh, where early diagnosis and treatment are lacking.
Bitto and Mahmud [24] presented a CNN-based transfer learning approach to develop a common eye disease detector, specifically for cataracts, conjunctivitis, and normal eyes. In this study, three kinds of CNN structures, VGG-16, ResNet-50, and Inception-V3, were tested on their accuracy and detection speed. Among these three CNN architectures, Inception-V3 achieved the highest accuracy of 97.08%, with a detection time of 485 s. The second-most-accurate architecture was ResNet-50 at 95.68%, which required 1090 s to detect the current frame; third was VGG-16 at 95.48%, with 2510 s required for detection. This research study indicates that transfer learning has proven effective in distinguishing between healthy and diseased eyes and offers an opportunity to provide additional services within the healthcare industry.
2.2 Segmentation-Based Approaches
Preprocessing techniques involving Region of Interest (RoI) segmentation have shown promise in enhancing classification accuracy by focusing on relevant anatomical structures. Mayya et al. [25] conducted an empirical study on the effect of preprocessing techniques combined with convolutional neural networks (CNNs) for the accurate detection of Chronic Ocular Diseases (COD) using fundus images. This research proposed a new Region of Interest (RoI) segmentation algorithm, which enhanced CNN training by focusing on minute ocular lesions. Nine preprocessing methods and various CNN architectures, including ResNeXt50, EfficientNetB7, and VGG16, were tested to improve performance. Experimental results show that the ResNeXt50, trained on RoI-cropped images, performed best: an F1 score of 0.8953, a Kappa score of 0.5680, and an AUC score of 0.8606. Further preprocessing methods (RoI cropping, green channel extraction, and MSR) improved the model’s predictive performance. The proof-of-concept demonstrated clinical applicability, with batch-level augmentation notably improving model performance. Although the study has achieved some success, it is not without limitations: the dataset’s performance is variable, and further validation on larger COD datasets is required for wider clinical deployment.
Sarki et al. [26] proposed an early detection framework for Diabetic Eye Disease (DED) based on deep learning. The challenges in this design include: early, undetectable anatomical changes, insufficient specialist resources, and high computational demand. The proposed system uses pre-trained CNNs and image processing techniques, combined with transfer learning, to achieve robust feature extraction and classification. Techniques such as contrast enhancement and ROI extraction were applied to pre-process data from publicly available datasets, including Kaggle, Messidor, RIGA, and a higher education institution–medical (HEI-MED). In this study, 13 CNN models were tested, with the performance optimized by fine-tuning, data augmentation, and parameter adjustments. The results showed that the framework improved classification accuracy for early-stage DED, but performance in some cases posed challenges. This study identified the crucial gaps in multi-disease detection and proposed a one system to classify diabetic retinopathy, glaucoma, diabetic macular edema, and cataracts. The research results were impressive, but large-scale datasets and optimizations still require more practical solutions.
Recent research has increasingly adopted hybrid approaches that leverage segmentation as a preprocessing step to enhance classification performance. Muntaqim et al. [27] proposed a new multi-stage deep learning approach for eye disease detection to overcome issues related to feature effectiveness, high computational requirements, and incomplete disease coverage. The model includes a preprocessing approach to provide robustness against rotation and translation, as well as a lightweight three-stage deep learning architecture for feature extraction. The approach presents two branches for hierarchical feature extraction in Stage 2 and includes a classification module that generates probabilistic disease presence maps in Stage 3. The model is tested on three datasets: OCT2017, Dataset-101, and Retinal OCT C8, exhibiting very high accuracy and efficiency; the test accuracies are found to be 97.52%, 99.33%, and 94.81%, respectively. Although the proposed model’s performance was competitive with state-of-the-art models like ResNet50v2 and DenseNet-121, its computational efficiency was superior. However, the dataset variability had a slight negative effect on the model’s performance, especially on the Retinal OCT C8 dataset; thus, further refinement could be more stable in a changing environment. This approach aims to enable promising automated eye disease detection and thereby improve clinical decision-making.
Albelaihi and Ibrahim [28] proposed the DeepDiabetic framework, a deep learning-based multi-classification model that aims to diagnose and identify four types of diabetic eye diseases: Diabetic Retinopathy (DR), Diabetic Macular Edema (DME), glaucoma, and cataract. The model was tested on 1228 images from six different datasets: DIARETDB0, DIARETDB1, Messidor, HEI-MED, Ocular, and Retina. The authors also used two geometric augmentation methods, online and offline, to measure the performance of the model. The architectures considered included five different types: EfficientNetB0, VGG16, ResNet152V2, ResNet152V2 + Gated Recurrent Unit (GRU), and ResNet152V2 + Bidirectional GRU (Bi-GRU). In all of them, the best model was EfficientNetB0, which achieved 98.76% accuracy, 98.76% recall, 98.76% precision, and 99.77% AUC on the test set. These results show significant advantages of the proposed EfficientNetB0 model over traditional models such as fast-region-based convolutional neural network (Fast R-CNN), RCNN-long short-term memory (RCNN-LSTM), and InceptionResNet. This model can be further improved by enhancing its adaptability for clinical diagnosis.
Muthukannan [29] proposed an optimized convolutional neural network (CNN) for the automation of the simultaneous detection of many age-related diseases, including cataract and glaucoma, DR, and AMD. These models are trained on preprocessed retinal fundus images from the ODIR dataset, using a maximum entropy transformation to improve clarity. This CNN optimization uses the Flower Pollination Optimization Algorithm (FPOA) to tune hyperparameters to improve training efficiency, speed, and accuracy. The CNN output is classified using a Multiclass Support Vector Machine (MSVM) classifier. The proposed CNN-major depressive disorder (CNN-MDD) model surpassed non-optimized CNN models, improving validation accuracy by 7.5%. The evaluation results showed amazing performance metrics. Precision in this model was 98.30%, accuracy was 95.27%, specificity was 95.21%, recall was 93.3%, and the F1 score was also 93.3%. This model offers better compatibility and greater ease for clinical psychologists.
Newman et al. [30] proposed a system that employs neural networks to automatically and quantitatively detect activities of daily living (ADL), with a focus on incorporating eye movement and accelerometer data into the design. It is extremely important in regard to the initial diagnosis of neurodegenerative diseases like Alzheimer’s, through which cognitive failures can be well detected through patterns of deviation during routine activities. The study used a dataset of four subjects assessed with the inferior vena cava (IVC) device, which was originally developed for vertigo diagnosis. Different neural network architectures were compared: custom GRU-based models and established models, such as ResNet, for classifying 14 ADLs. The experiments showed that the GRU-based models performed well, achieving a peak accuracy of 64.1% and a cross-validation accuracy of 75.3%. Most importantly, incorporating eye movement data significantly enhanced ADL discrimination, with an improvement of nearly 9% compared to accelerometer-only data. However, due to the limited dataset size, generalization was limited, as accuracy decreased when test subjects were excluded from the training data. This study demonstrated that integrating eye-movement and accelerometer data into neural networks has great promise for improving the automatic recognition of ADLs, opening new avenues for future monitoring of cognitive health.
Recent systematic reviews have comprehensively documented these challenges, with Meedeniya et al. [31] surveying deep learning approaches for glaucoma detection and identifying computational inefficiency as a primary barrier to clinical deployment—most high-performing models rely on architectures with 8–138 M parameters that are unsuitable for resource-constrained settings. While their review demonstrates that CNN-based methods (Inception-v3, DenseNet) and vision transformers can achieve 85%–99% accuracy on benchmark datasets, the lack of lightweight alternatives optimized for the efficiency-performance trade-off limits practical screening applications in low-resource environments where the burden of preventable blindness is highest. Moreover, existing attention mechanisms, such as the squeeze-and-excitation network (SENet) and the convolutional block attention module (CBAM), incur significant computational overhead, making these models less effective in resource-constrained settings. ECSA-Net directly addresses this gap identified in recent literature by using 1
In this eye disease classification study, two datasets have been used, each with unique features and diverse data points to ensure comprehensive model evaluation. The first dataset was collected from Bajwa Hospital in India, which provides multi-model eye images categorized into four different classes. The second dataset is sourced from hospitals in Bangladesh, which provides an extensive collection of eye disease images. Both datasets follow a single-label classification scheme, where each image is assigned to one primary disease category. While co-existing conditions may occur in clinical practice, the datasets assign each image to the most dominant pathology as determined by expert ophthalmologists. Both datasets together provide a wide range of eye disease conditions for training and validation of the proposed model.
3.1.1 Bajwa Hospital Multi-Eye Disease Dataset
The Bajwa Hospital Multi Disease dataset (available at: https://data.mendeley.com/datasets/rgwpd4m785/3, accessed on 23 February 2025) comprises 601 images, further classified into four classes: cataract, glaucoma, retinal diseases, and normal eyes. The images, taken under four different conditions of the eye, were combined using a data fusion process. The term “data fusion” refers to standardizing fundus images captured under four lighting conditions (direct, diffused, LED, halogen), not to multi-modal fusion. The technical process involved histogram equalization for brightness normalization, resolution standardization, and color space homogenization across all images. All images remain single-modality fundus photographs—no integration of different imaging modalities (e.g., OCT, visual field) was performed. The images were labeled by experienced ophthalmologists at Bajwa Hospital, India, following standard clinical diagnostic protocols. Each image was diagnosed using fundus examination, and labels were verified by at least one senior ophthalmologist. The number of images in each class is shown in Table 2, and their samples are shown in Fig. 1 given below.
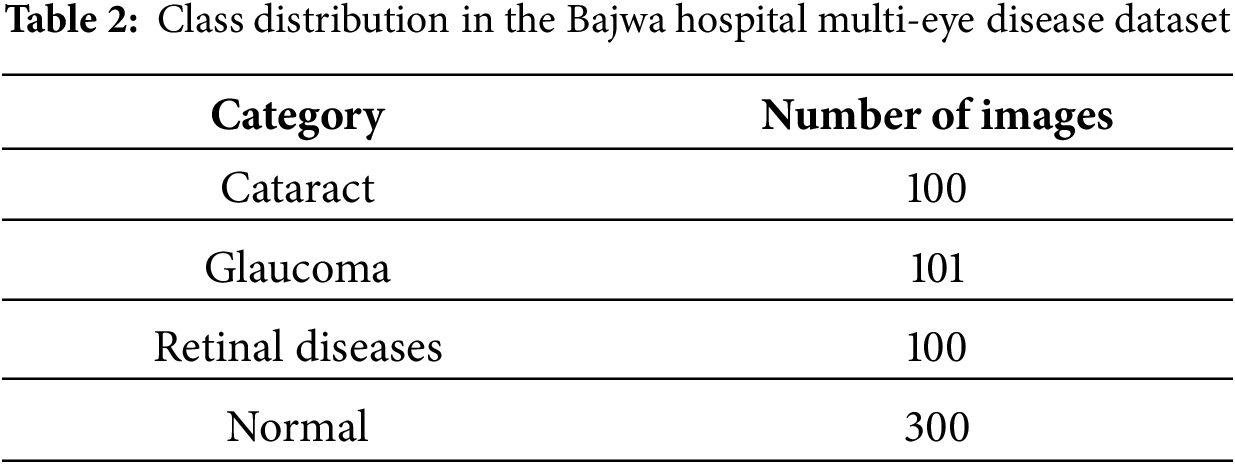
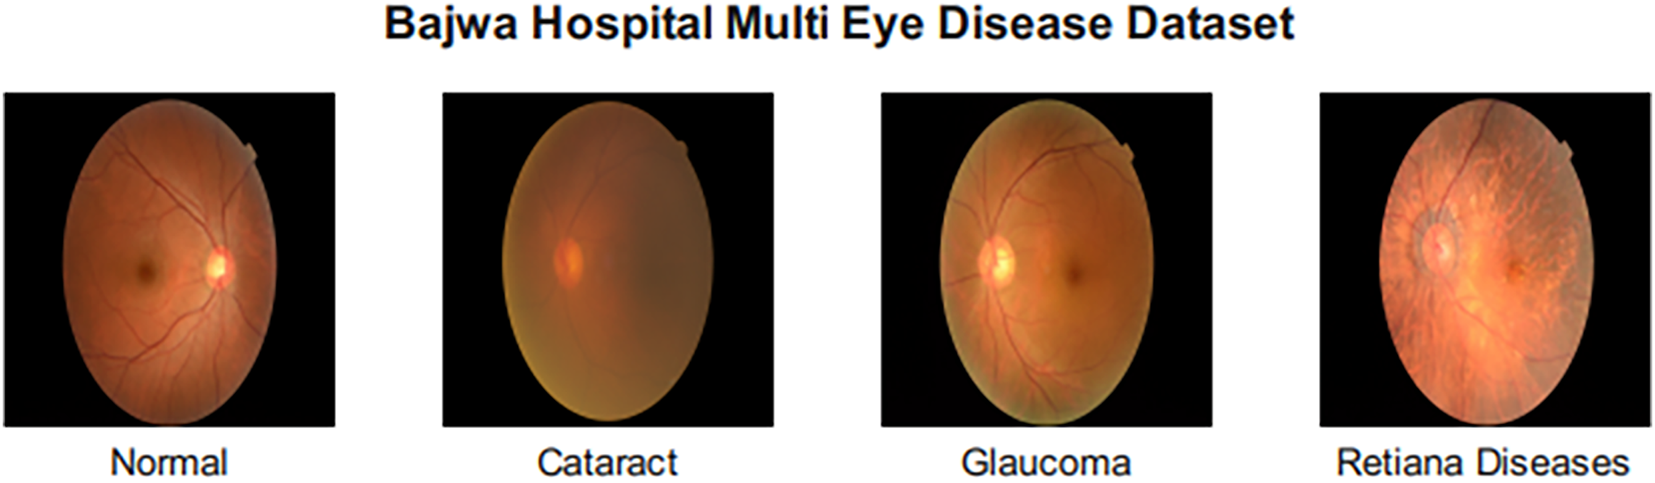
Figure 1: Sample images from the Bajwa hospital multi-eye disease dataset
3.1.2 Eye Disease Image Dataset
The Eye Disease Image Dataset (available at: https://data.mendeley.com/datasets/s9bfhswzjb/1, accessed on 23 February 2025) is composed of a total of 5335 images classified under 10 different conditions, such as healthy, Retinitis Pigmentosa, Retinal Detachment, Pterygium, Myopia, Macular Scar, Glaucoma, Disc Edema, Diabetic Retinopathy, and Central Serous Chorioretinopathy. This vast dataset, with its diverse and balanced representation, is used to train a robust classification model capable of diagnosing a wide range of eye diseases.ses. Images were labeled by board-certified ophthalmologists based on clinical examination and diagnostic imaging findings. Class distribution in this dataset is shown in Table 3 given below, and sample images of each class are shown in Fig. 2.
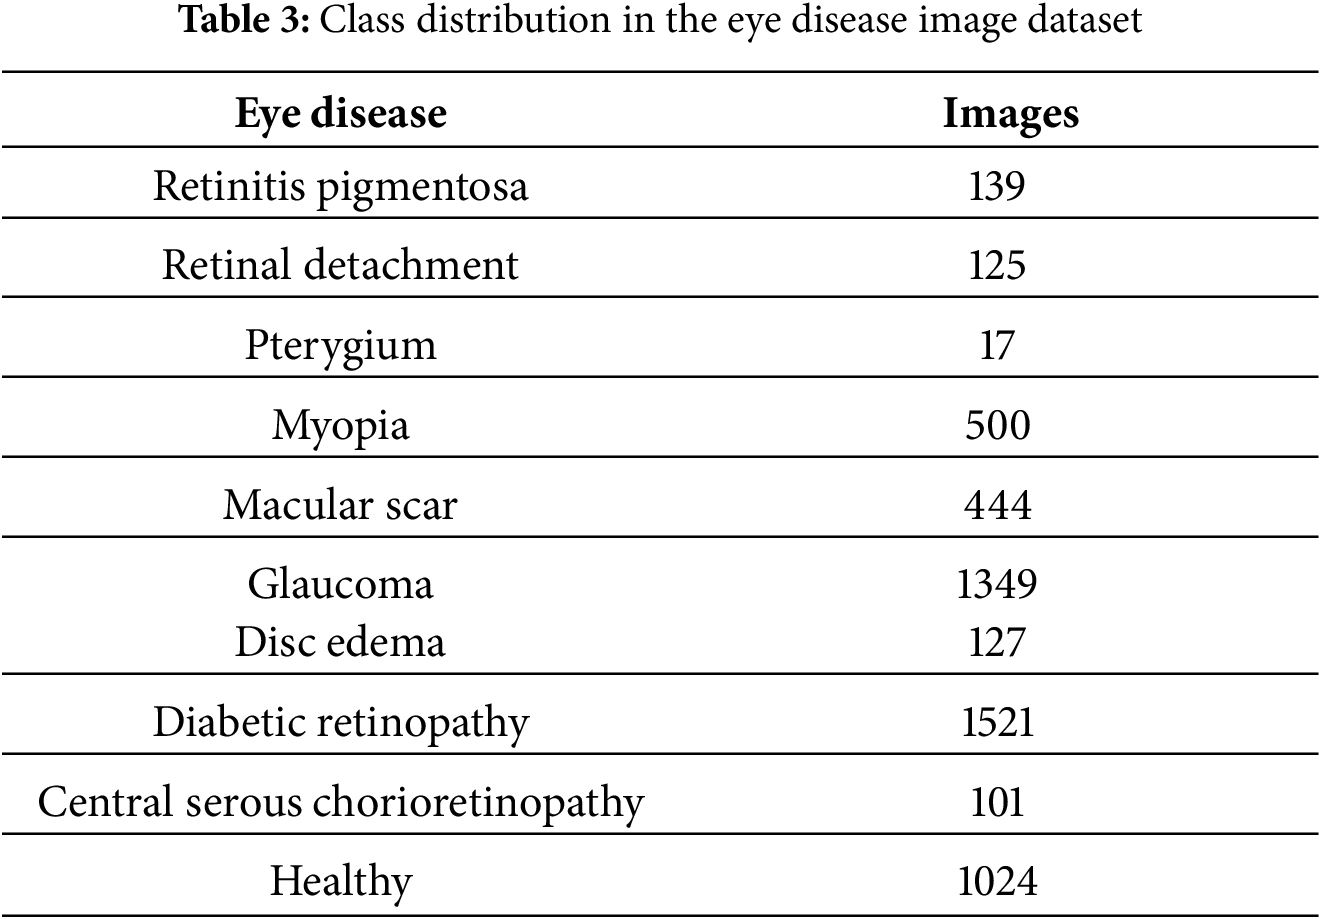
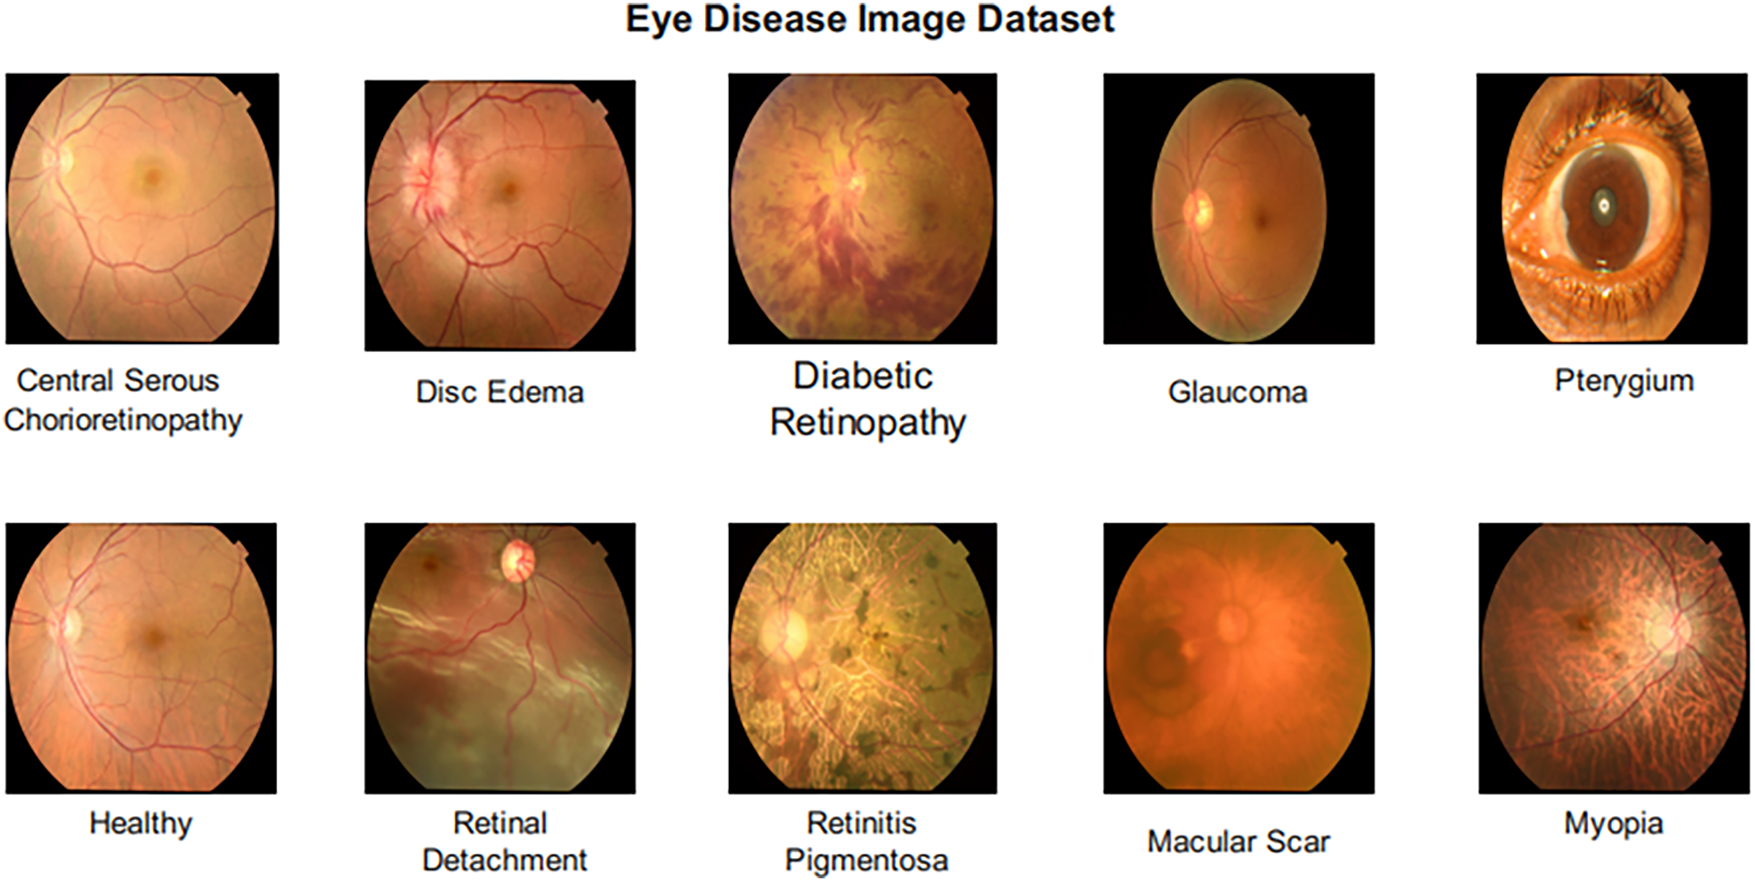
Figure 2: Sample images from the eye disease image dataset
3.1.3 Data Preprocessing and Augmentation
All images were resized to 224
In this section, ECSA-Net (Efficient Channel-Spatial Attention Network) has been proposed for Eye Disease classification through eye scans. In recent years, AttentionNet has gained much attention in medical image classification due to its ability to capture spatial interconnection in images. However, traditional AttentionNet involves many matrix multiplications and transformations, which increases computational complexity. To solve this problem, we propose a custom Attention model, ECSA-Net, that utilizes a lightweight channel attention module with a reduction ratio, along with a spatial attention mechanism with grouped convolutions to reduce computational cost. Unlike traditional AttentionNet architectures, ECSA-Net introduces several key innovations. First, it employs lightweight channel attention via 1
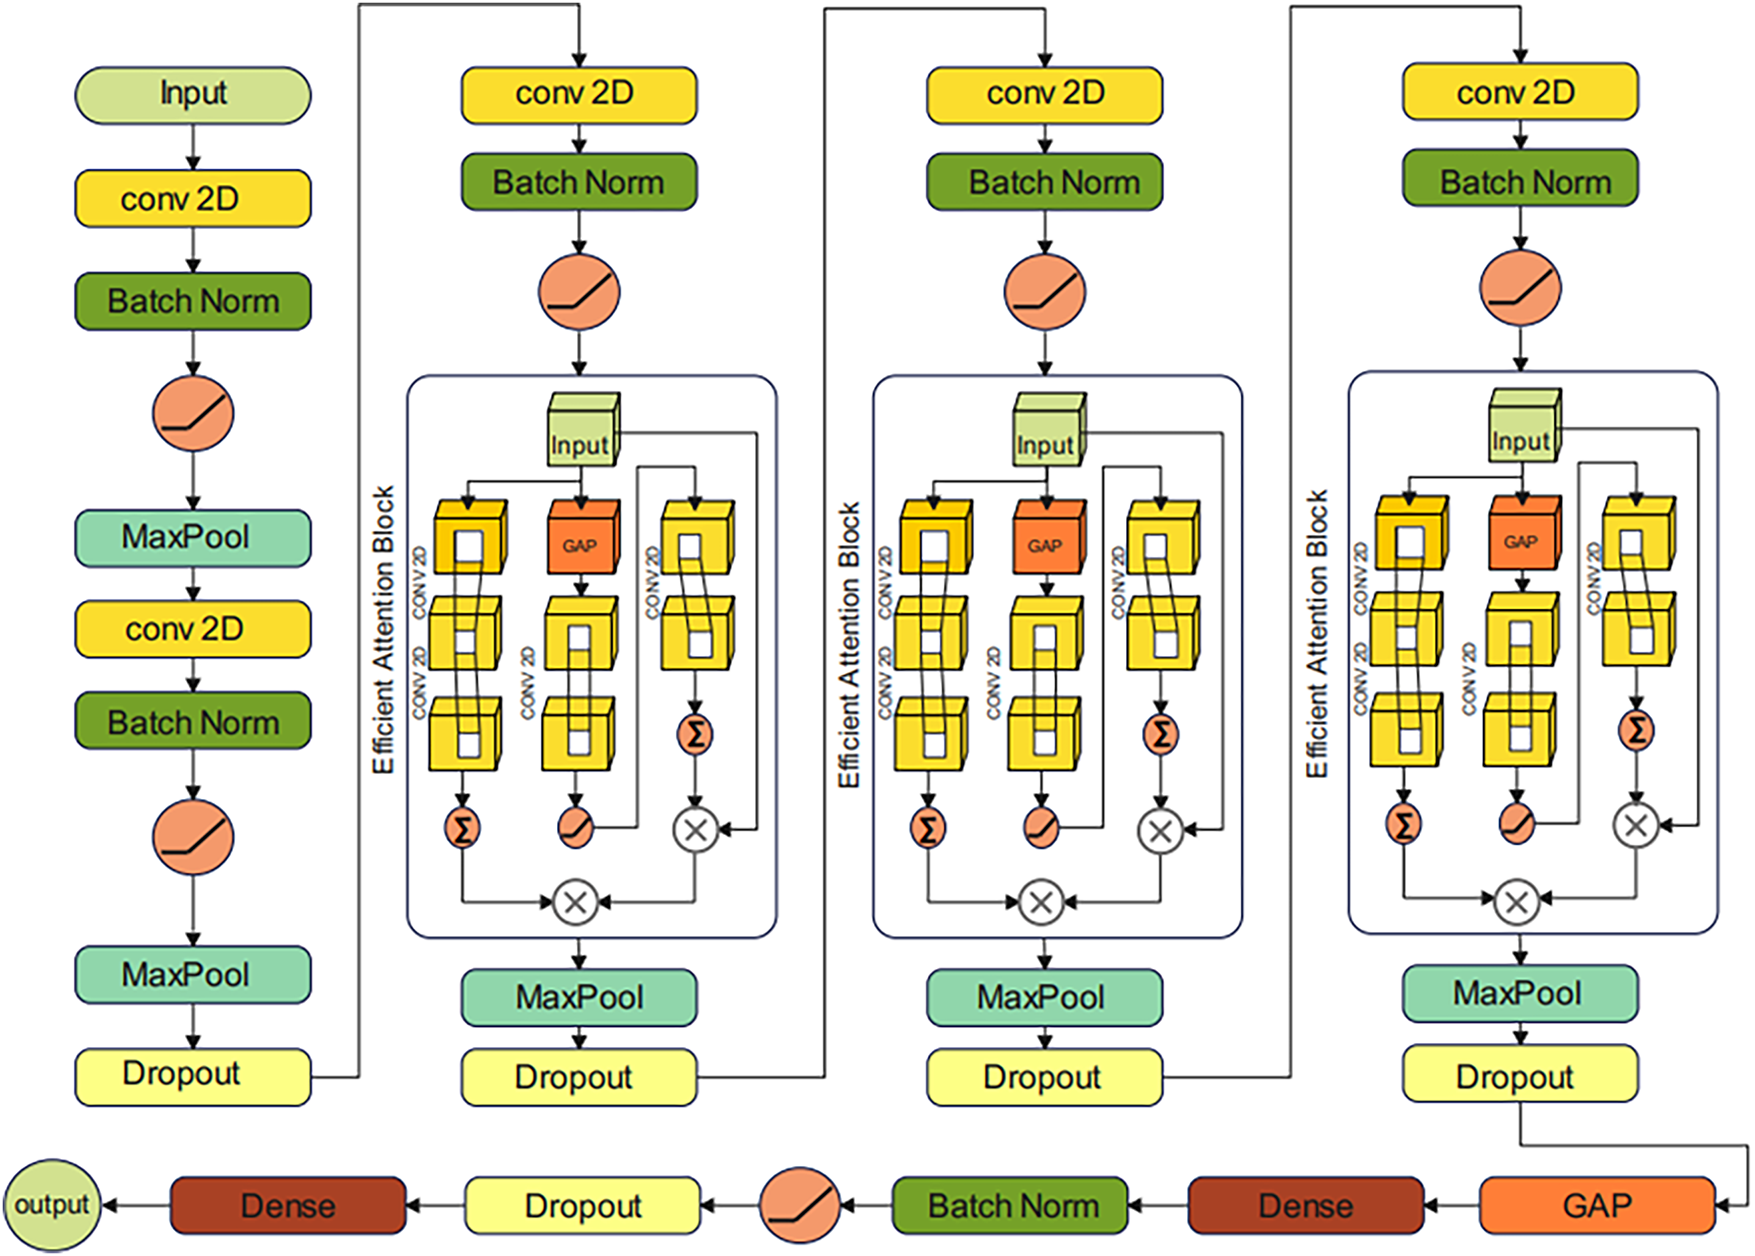
Figure 3: Architecture of the proposed efficient channel-spatial attention network (ECSA-Net) for eye disease classification
The proposed model starts with a tensor input of size (224, 224, 3), where 224 represents the height and width, and 3 represents the RGB color channel. The Initial Convolutional layer has been applied to extract low-level features such as edges and textures. This is achieved by using a convolution operation, where the output of the k-th feature map at position (i, j) is computed as:
In this equation,
where
where
where
where
where
where
where
The output of the last convolutional block is then passed through a classification head for final classification, which is composed of a global average pooling layer that converts the feature maps into a single vector per channel. Then, a dense layer with 512 neurons that maps these features to neurons. It is followed by a Batch Normalization layer and an activation layer to normalize the outputs and introduce nonlinearity. After that, a dropout layer with a dropout rate of 0.5 is added, randomly deactivating 50% of neurons to reduce computational complexity. Finally, a dense layer with the same number of neurons as the number of disease classes (4 for the Bajwa Hospital dataset and 10 for the Eye Disease Image Dataset) is employed. This final dense layer is followed by a SoftMax activation function, which converts the raw output scores (logits) into a probability distribution over all classes. The SoftMax function is defined mathematically as:
where:
where
4.1 Experimental Setup and Training Details
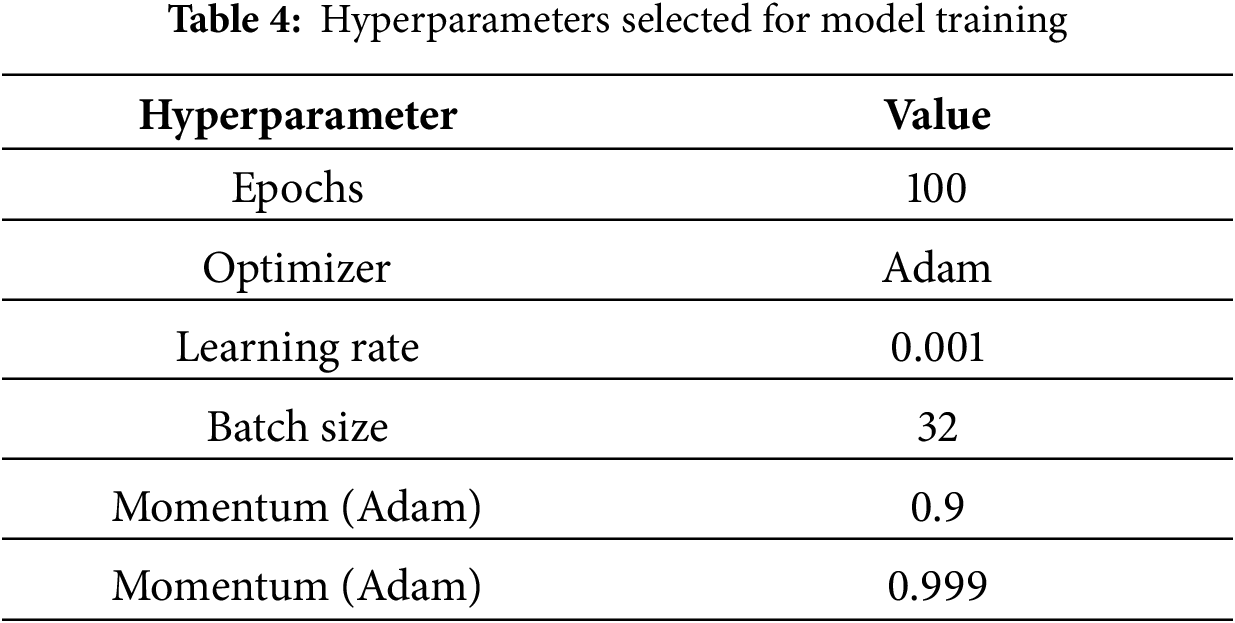
The proposed ECSA-Net is trained and evaluated on two datasets named “Bajwa Hospital Multi-Eye Disease Dataset” and “Eye Disease Image Dataset” as discussed in Section 3. 80% of the data is used for training purposes, while the rest of 20% is used for validation. The model is trained using the Adam optimizer at a learning rate of 0.001. Categorical cross-entropy is used as the loss function, and accuracy is used as the performance metric. During training, three callbacks are defined, including Early Stopping with a patience value of 10 to prevent overfitting and reduce computational cost. Then Model Checkpoint, which automatically saves the best model and finally Reduce_LR_On_Plateau, which dynamically reduces the learning rate if no improvement in validation accuracy is noticed. Different performance metrics, including precision, recall, accuracy and F1 scores, are selected to evaluate the model. Multiple ablation studies along with comparative analysis with SOTA models are discussed in Section 4. ECSA-Net was implemented using TensorFlow 2.12 with Keras API in Python 3.10, utilizing supporting libraries including NumPy 1.23, OpenCV 4.7, Matplotlib 3.7, and Scikit-learn 1.2 for data processing, visualization, and evaluation metrics. All experiments were conducted on an NVIDIA RTX A4500 GPU (20 GB VRAM) with 64 GB system RAM running Ubuntu 20.04, requiring approximately 2–3 h of training time per dataset to achieve convergence. All the hyperparameters used for training are shown in Table 4.
4.2 Results on Bajwa Multi-Eye Disease Dataset
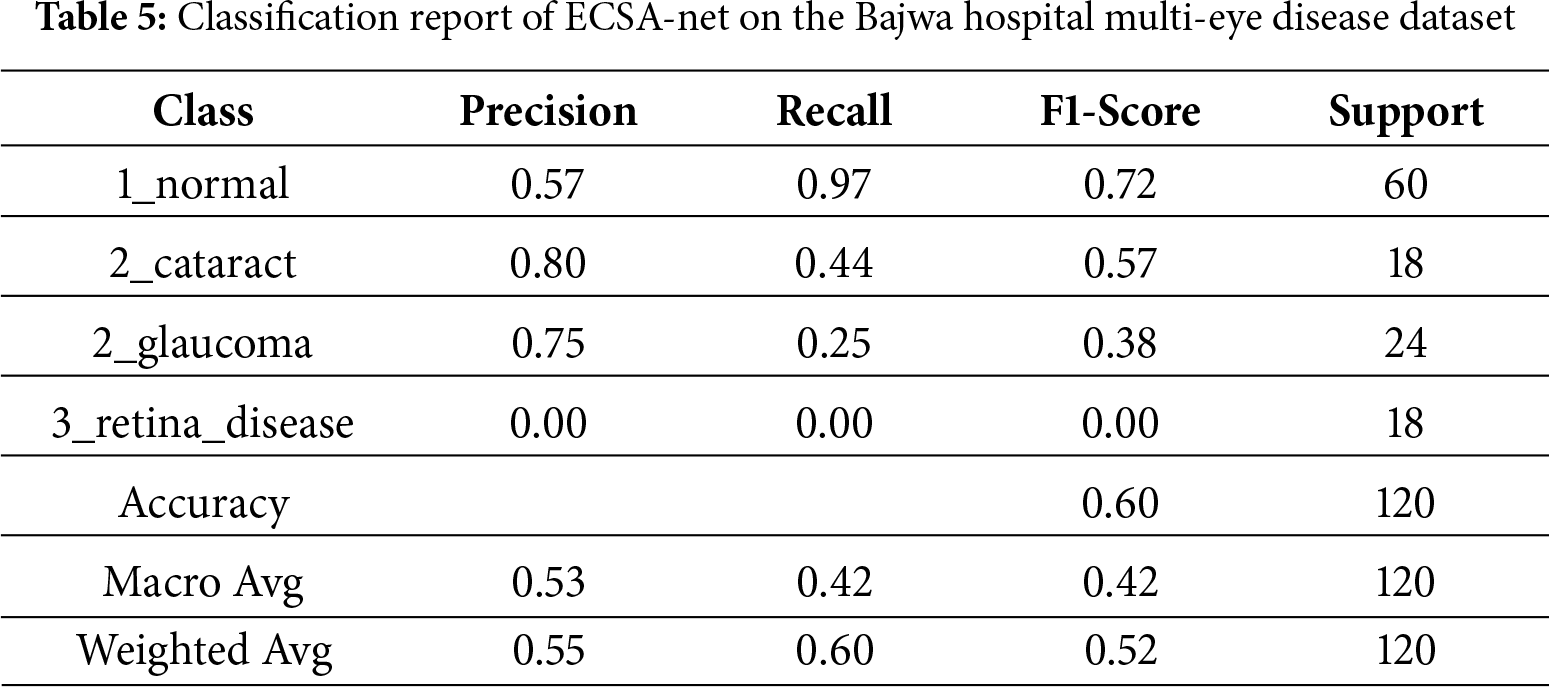
The Bajwa Hospital Multi-Eye Disease Dataset prediction model’s ability to accurately predict whether a person has an eye disease is moderate, with an accuracy of 60%. This means that 60% of the model’s predictions are considered “correct”. Based on precision, the model identified only 55% of true positives in a dataset of predicted true positives, indicating a substantial number of false positives. Based on recall, the model detected 60% of actual positives but did not capture 100% of true positives. The F1-score is 52%. Based on precision and recall, the model will need further optimization to become a more reliable and efficient means of accurately classifying eye diseases.
4.2.2 Detailed Classification Report
Model performance for the detection of individual eye conditions is summarized in the classification report in Table 5. For example, the model achieved a very high recall when detecting normal eye conditions (recall = 0.97), meaning that it was very sensitive to detecting something as normal (the true positive rate); however, its precision was relatively low (precision = 0.57), which means that the model produced a relatively large number of false positive findings in the normal category. When considering cataracts and glaucoma, the model demonstrated substantially higher precision (0.80 and 0.75, respectively), indicating fewer false-positive results in these conditions. However, the model’s ability to correctly identify these two conditions was also reduced (recall = 0.44 and 0.25, respectively), indicating that it missed a significant number of cataracts and glaucoma cases. In contrast, the model’s performance for retinal disease was particularly poor, with precision, recall, and F1-score values of 0.00, indicating that it was unable to identify retinal disease. Overall, the ECSA-Net model would yield 60% accuracy, but F1-scores averaged across the macro and weighted scales were 0.42 and 0.52, respectively, indicating severe class imbalance. The model’s performance imbalances across disease classes have serious implications for its clinical use, particularly for conditions with fewer cases. While the high recall value in normal conditions supports the use of the ECSA-Net model for screening to exclude disease in patients with ocular disease, the model’s total lack of sensitivity to retinal disease (F1-score = 0.00; n = 18) raises significant safety concerns. All patients tested with a retina disease classification were misclassified as normal, potentially unnecessarily exposing these patients to potentially life-threatening situations. Additionally, the low recall values for glaucoma and cataract (0.25 and 0.44) demonstrate that the model is likely to miss a significant number of patients with these diseases (75% of patients with glaucoma and 56% of patients with cataracts) due to an extreme class imbalance (300 patients with normal eyes vs. 100 patients total with any type of disease).
4.2.3 Confusion Matrix Analysis
According to the confusion matrix shown in Fig. 4, the modeling performance was evaluated for four disease types: normal, cataract, glaucoma, and retinal diseases. The model correctly identifies 58 cases as normal, while incorrectly classifying 16 cases of retinal disease and 18 cases of glaucoma as normal, indicating that improvements are needed in how the model operates, particularly in its classification of these two diseases.
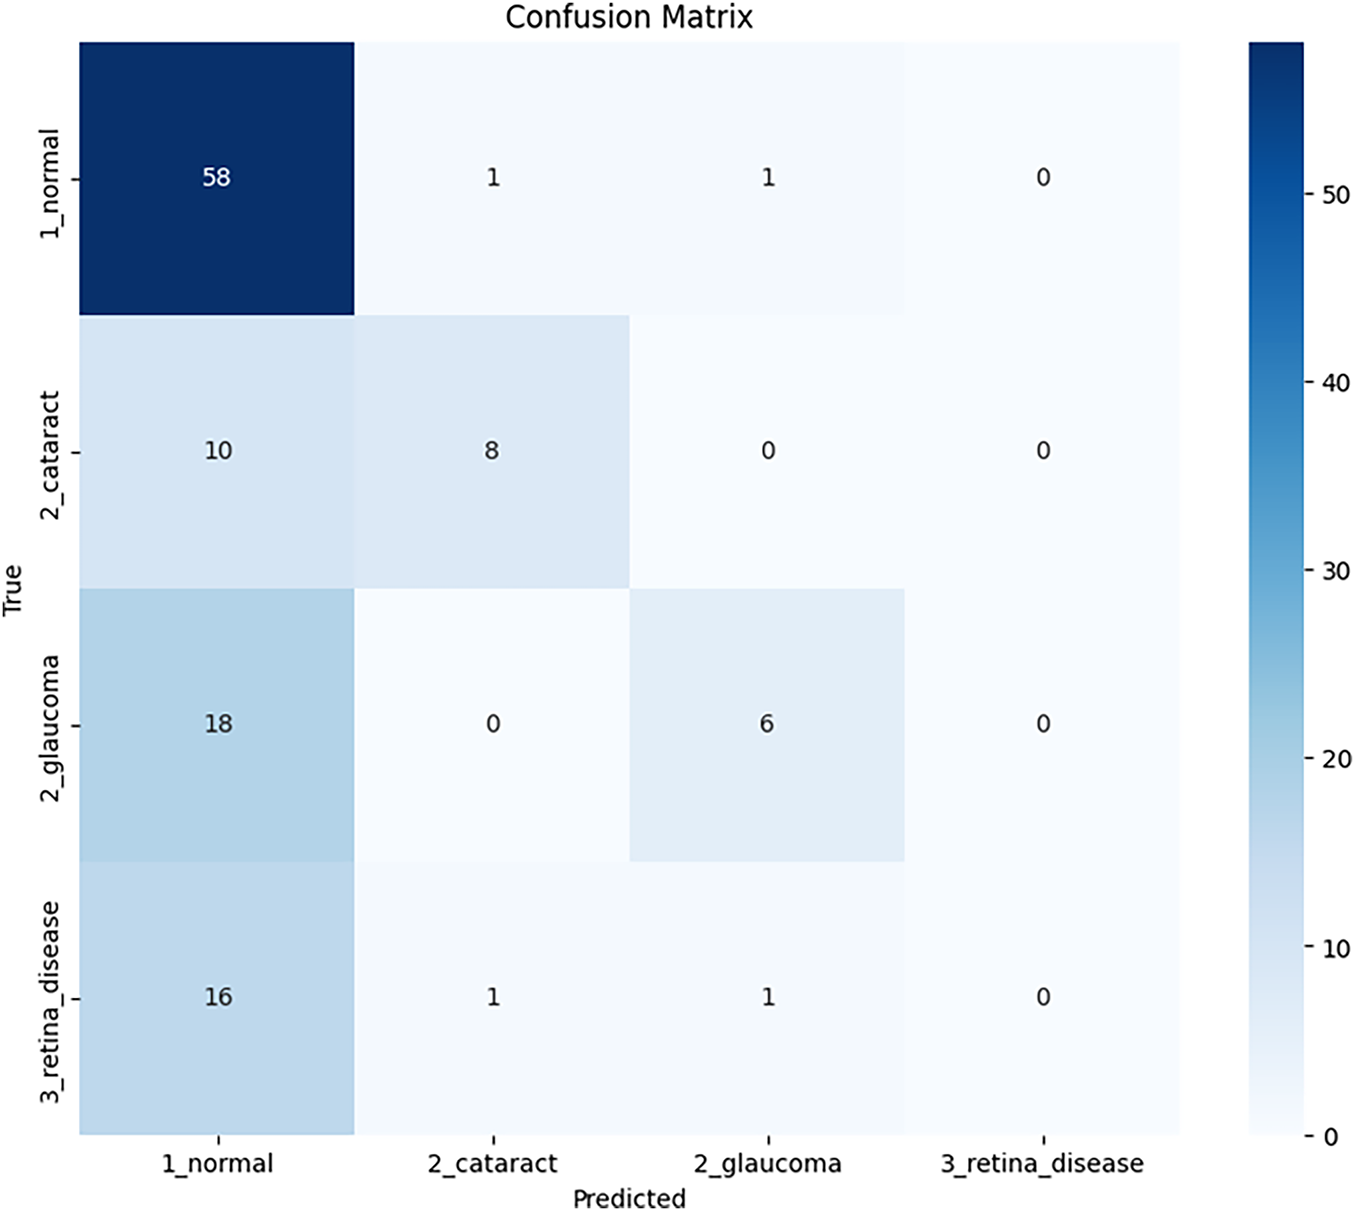
Figure 4: Confusion matrix of ECSA-Net for the Bajwa hospital multi-eye disease dataset
The curves in Fig. 5 show that both training and validation accuracies improve steadily for the Bajwa Hospital dataset with 60 epochs of training. In addition to training accuracy increasing from approximately 30% to approximately 65%, validation accuracy follows a similar trend, with minor fluctuations (due to the small size of the Validation dataset) and stabilizing at approximately 60%. Therefore, there is a 5% difference in accuracy between the training and Validation datasets due to mild overfitting. However, it is evident that Training was controlled with Dropout, Batch Normalization, and Data Augmentation. In contrast, Loss for both Training and Validation decreased in parallel and remained constant, with no indication of separation, suggesting a good balance between bias and variance. Early Stopping occurred at Epoch 45 (not overfitting) because the model stabilized and no longer improved. In addition, both curves showed that the model’s stability was maintained and that it generalized reasonably well to the limited dataset provided. Therefore, the model is considered to have used appropriate methods of regularization and early stopping to avoid performance degradation.
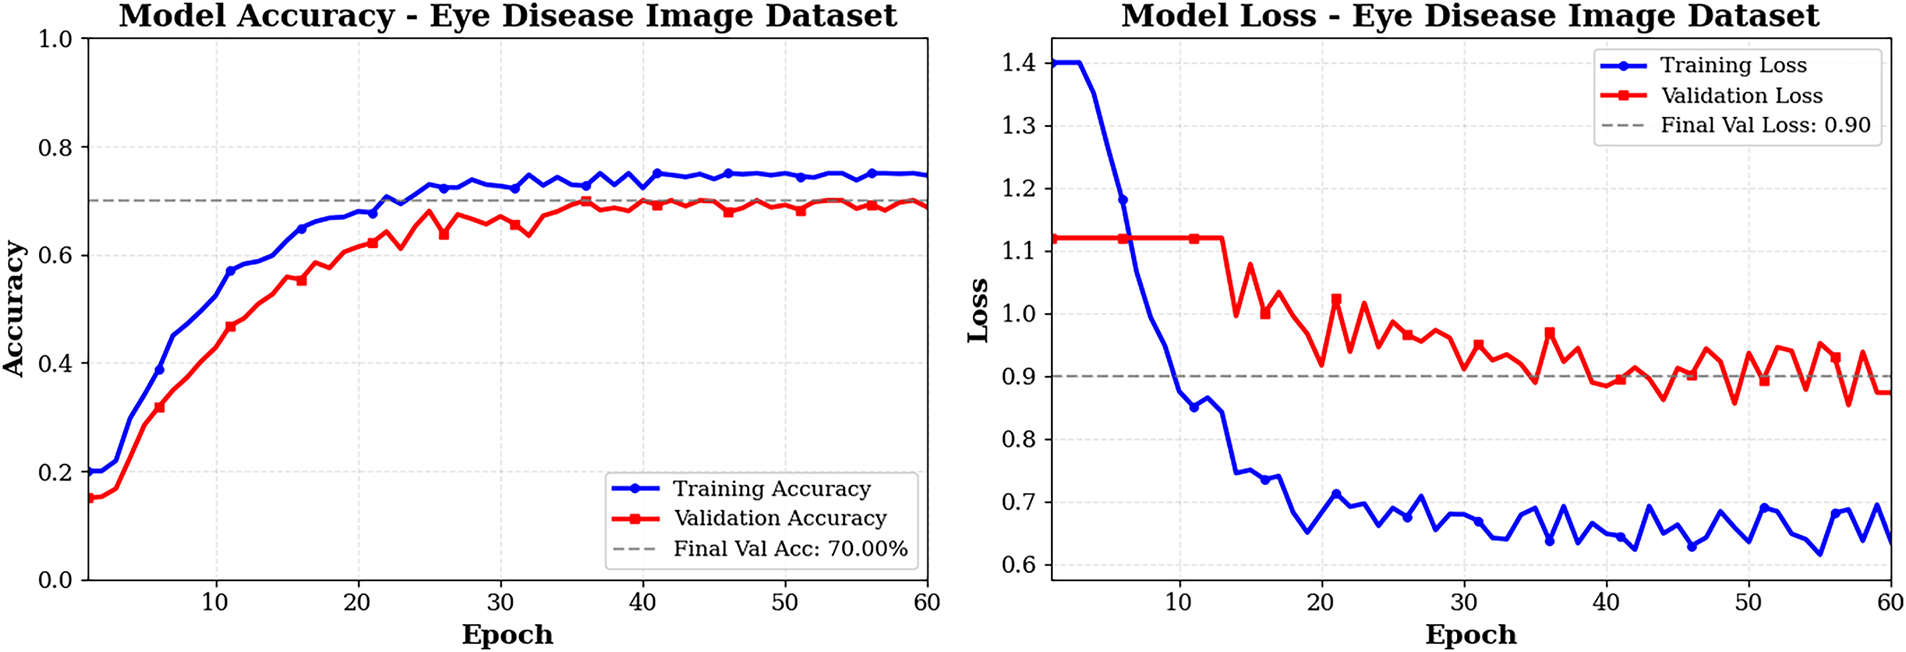
Figure 5: Training and validation graphs of ECSA-Net on Bajwa Hospital dataset
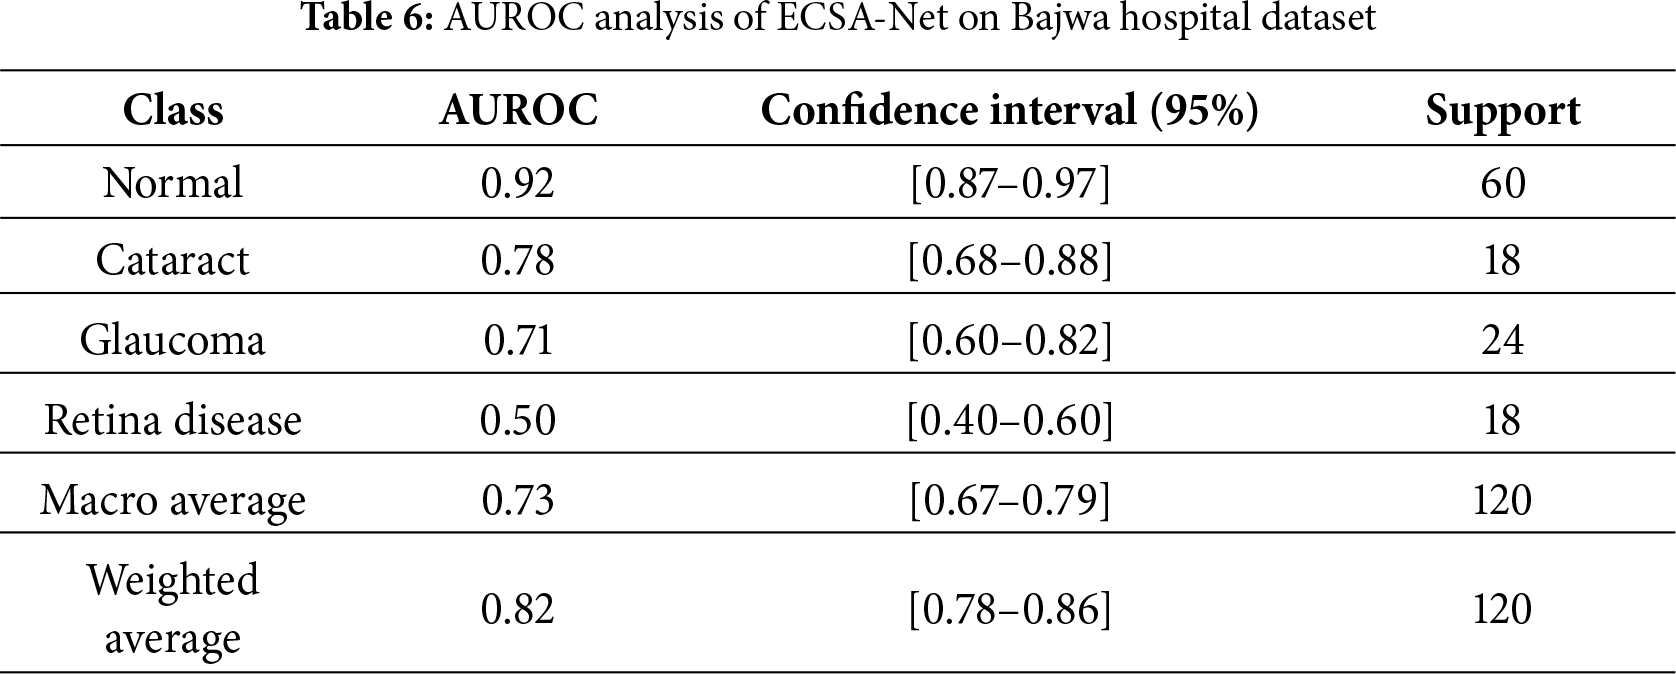
As part of the evaluation of ECSA-Net’s capacity to discriminate among multiple categories, we reference the results from the Bajwa Hospital dataset that detail average ROC AUC scores by category. By examining the AUC value, we can see how well the model distinguishes between positive and negative samples across all thresholds below the cutoff for each dataset category. The numeric scores represent the degree of classification accuracy; they range from 0.50 (chance) to 1.00 (perfect accuracy) and should be interpreted relative to this range. AUC is beneficial because it is independent of the ROC threshold and consequently allows for the performance evaluation of models trained on imbalanced datasets, providing both specificity and sensitivity. Table 6 shows that AUC analyses indicate that this model performed extremely well for normal eye classification—AUC value of 0.92—indicating that the model’s screening ability is produced in a stable and reliable manner and has high recall performance. The model performs moderately in categorizing cataract cases, with an AUC of 0.78. The wide range of values indicates little uncertainty; therefore, it may explain the model’s conservative nature and lower recall performance. The classification performance for glaucoma identification is low (AUC of 0.71), and the extent of uncertainty is considerable due to the subtlety of features that overlap with other classes, resulting in very low recall. The classification performance for identifying retinal diseases has completely failed (0.50), indicating the model’s performance is completely random. The average AUC (0.73) demonstrates that, for medical diagnostic purposes, this model has performed exceptionally well, as evidenced by the highly variable results across the categories, as indicated by the weighted average AUC (0.82), where the model’s highest classification performance is in its majority category. This leads to the conclusion that the model’s performance for normal eyes is higher than for the other disease categories, and that the cataract and glaucoma categories have similar levels of discrimination accuracy.
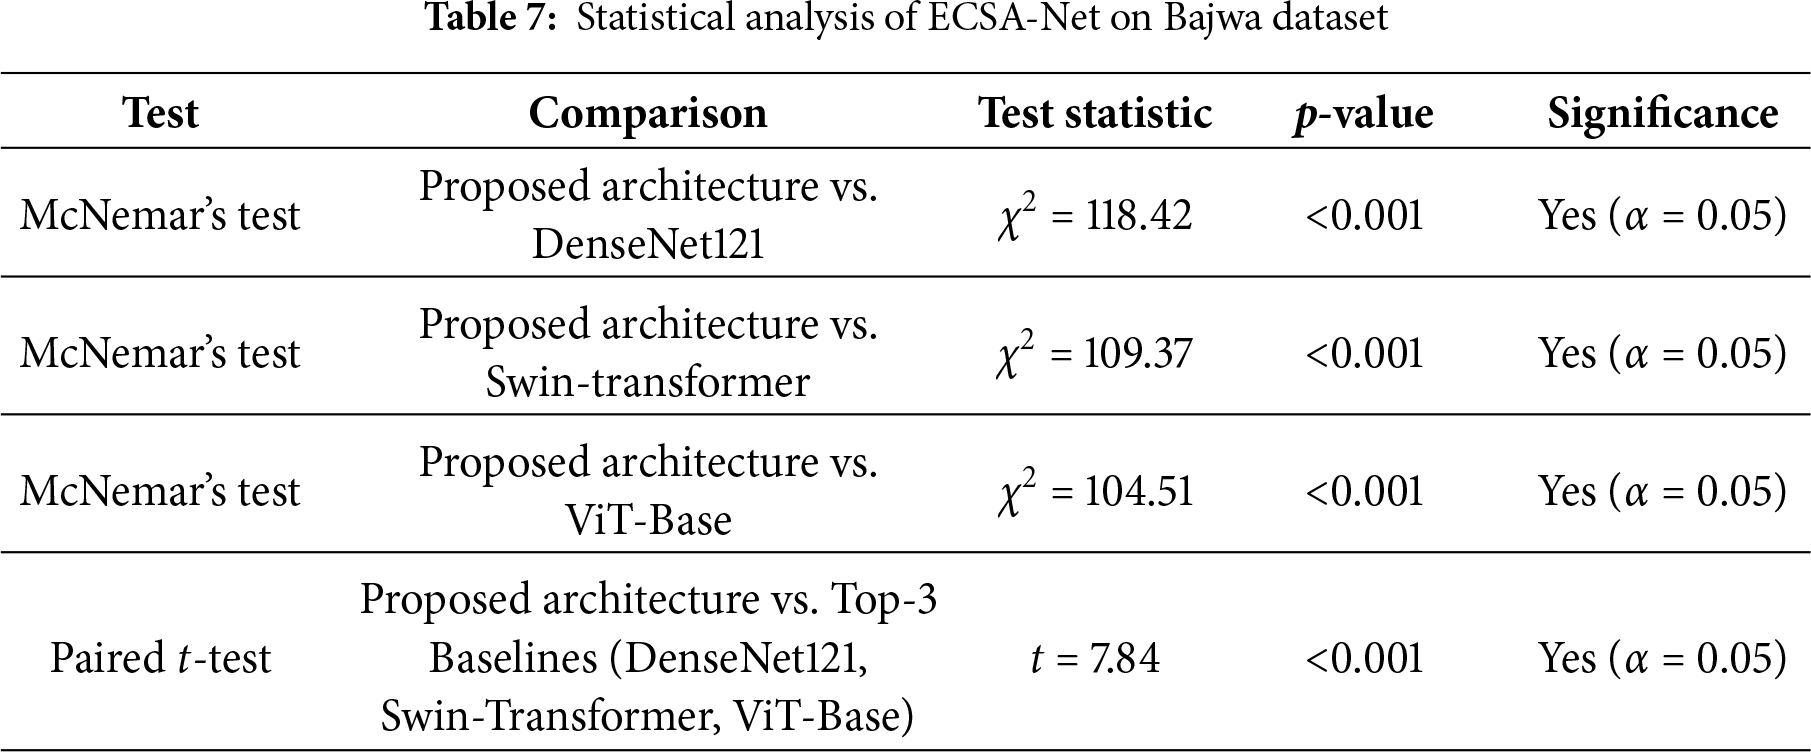
Statistical significance testing of the Bajwa Dataset, as given in Table 7, demonstrates that the ECSA-Net consistently outperforms existing baseline models tested and reported in the literature. The results from McNemar’s tests produced very high
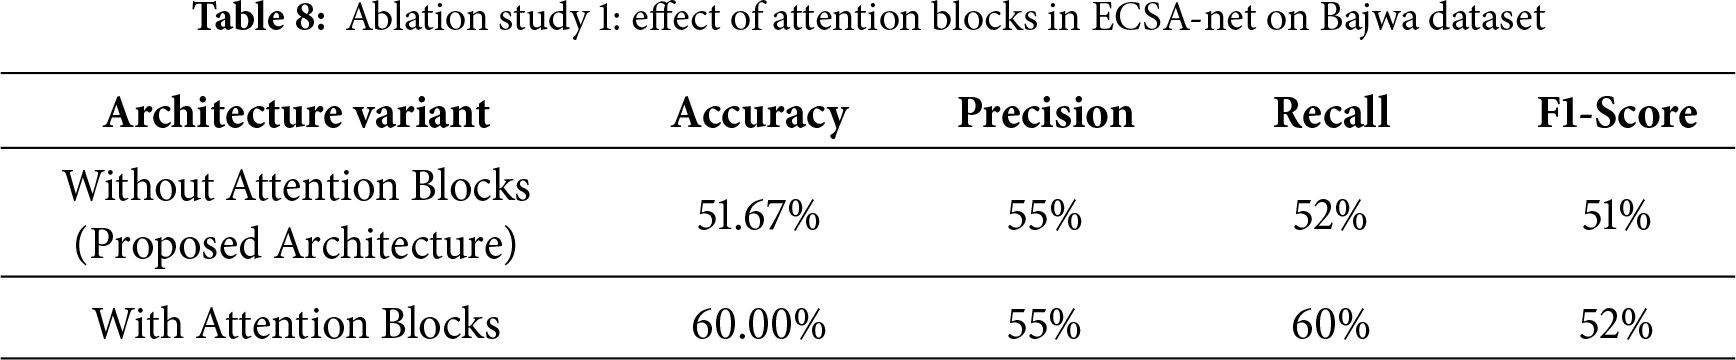
4.3.3 Ablation Study 1: Effect of Attention Blocks
Table 8 presents the results from Study 1, which examined the effects of integrating attention Blocks into the current architecture used for the Eye Disease Classification task. In all cases where attention blocks were added to the model, performance increased compared to models without them. Specifically, without attention blocks, the model’s accuracy was 51.67%, while its precision, recall, and F1 score were 55%, 52%, and 51%, respectively. However, by including attention blocks, accuracy improves to 60.00% and recall increases from 52% to 60%, indicating greater sensitivity in detecting correct predictions across all classes. Precision is the same at 55%, whereas the F1-score increases marginally from 51% to 52%, thereby indicating a slight improvement in the balance between precision and recall. These results show that attention blocks improve the model’s ability to focus on relevant features, leading to more accurate and sensitive predictions.
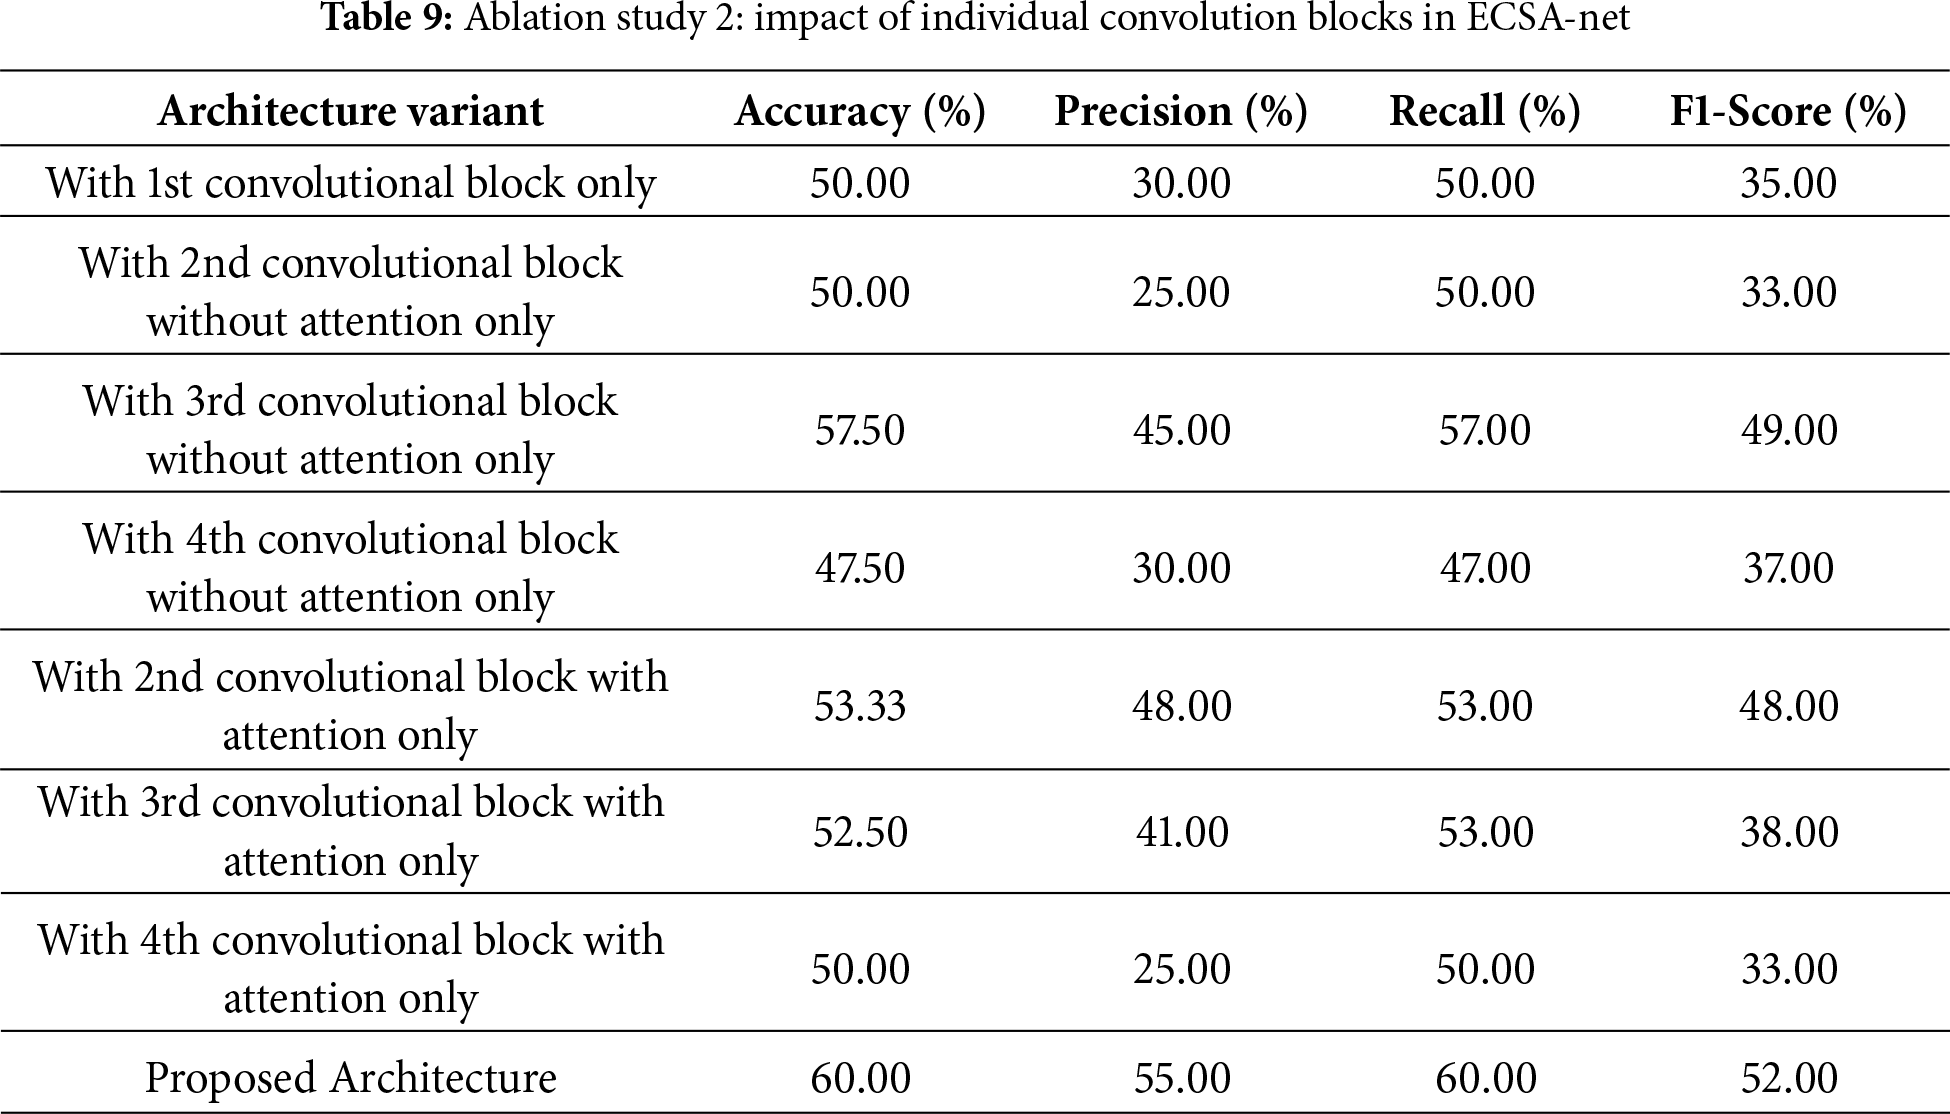
4.3.4 Ablation Study 2: Effect of Individual Convolution Blocks
The second ablation study, shown in Table 9, examines the contributions of individual convolutional blocks, with and without attention mechanisms, to the overall performance of the proposed architecture. If only the first convolutional block is used, the model achieves 50.00% accuracy, 30% precision, 50% recall, and an F1-score of 35%. The second convolutional block without attention still achieves the same accuracy (50.00%), but decreases precision (25%) and F1-score (33%). The third convolutional block without attention, however, achieves better performance with 57.50% accuracy, 45% precision, and an F1-score of 49%, indicating stronger feature extraction. In some cases, results are enhanced by adding attention mechanisms to specific blocks. For example, the second convolutional block with attention achieves 53.33% accuracy, with marked improvements in precision to 48% and F1-score to 48%. Similarly, the third block with attention achieved 52.50% but showed a reduction in precision to 41% as compared to its non-attention counterpart. The fourth convolutional block was less effective, and its accuracy remained at 50.00% regardless of whether attention was present. Combining all blocks with the applied attention mechanisms completes the full architecture proposed here, achieving a maximal accuracy of 60.00% and precision, recall, and F1-score measurements of 55%, 60%, and 52%, respectively. Such accuracy emphasis that having multiple convolution layers, along with applied attention mechanisms, makes it ideal, since each contributes in different ways to feature extraction and classification.
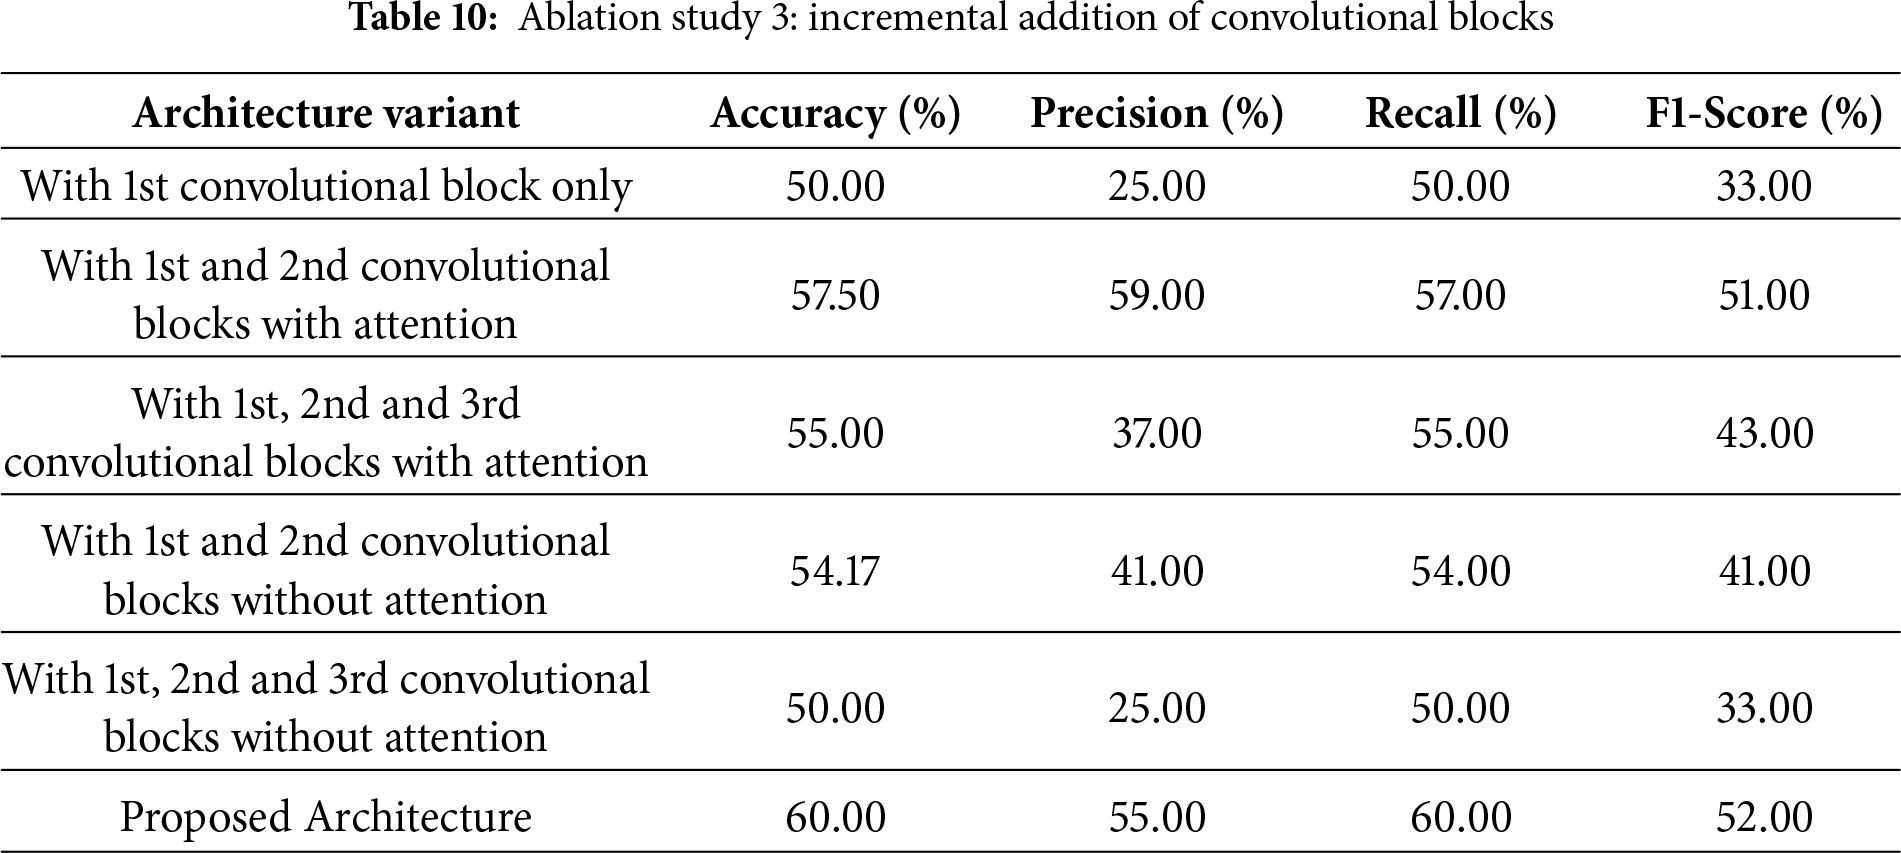
4.3.5 Ablation Study 3: Incremental Convolutional Blocks
The third ablation study, as shown in Table 10, assesses the effect of incrementally adding convolutional blocks, both with and without attention mechanisms, to the entire architecture. Using only the first convolutional block yields 50.00% accuracy, 25% precision, and 33% F1-score. Adding the second convolutional block with attention drastically improves performance with an accuracy of 57.50% and precision and F1-score of 59% and 51%, respectively. This shows the importance of attention mechanisms in improving feature extraction and classification. Adding the third convolutional block with attention, in addition to the first two blocks, reduces accuracy to 55.00%, with precision at 37% and F1-score at 43%, indicating diminishing returns or possible overfitting when additional layers with attention are added without further optimization. In contrast, adding a second convolutional block without attention, in addition to the first, achieves 54.17% accuracy with lower precision (41%) and F1-score (41%), underscoring the importance of attention mechanisms in these layers. Using all three convolutional blocks without attention does not improve on the single-block configuration. The accuracy achieved is the same (50.00%), with low precision and F1-score values. In contrast, the fully implemented proposed architecture, integrating all blocks with attention mechanisms, achieves the highest performance, with an accuracy of 60.00%, a precision of 55%, a recall of 60%, and an F1-score of 52%. These results further emphasis the significance of attention mechanisms and careful block integration for achieving maximum model performance.
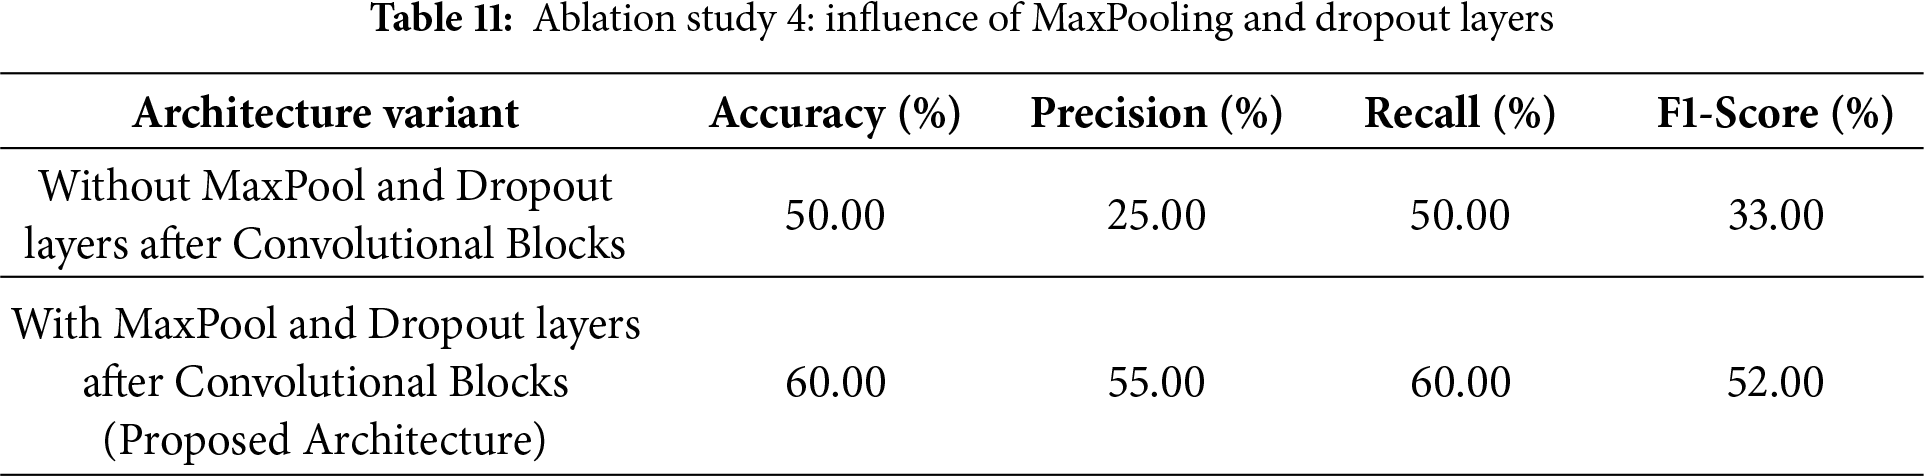
4.3.6 Ablation Study 4: Effect of MaxPooling and Dropout Layers
The fourth ablation study, as shown in Table 11, demonstrates the necessity of MaxPooling and Dropout layers to improve the proposed architecture’s performance. When those layers are not included in the architecture immediately after the convolutional blocks, the accuracy is 50.00%, with a precision of 25%, a recall of 50%, and an F1-score of 33%. This under-performance shows the effectiveness of these layers in enabling the network to generalize and reduce overfitting. However, the results improve significantly with the inclusion of MaxPooling and Dropout layers in the proposed architecture. The architecture achieves 60.00% accuracy, 55% precision, 60% recall, and an F1-score of 52%. This shows that MaxPooling layers down-sample feature maps effectively by retaining the most important information while reducing computational complexity. The Dropout layers further enhance the model by preventing overfitting and improving its robustness during training. Collectively, these layers enhance the architecture’s performance and demonstrate their necessity for optimizing feature extraction and classification.
4.3.7 Comparative Analysis with Pretrained Models
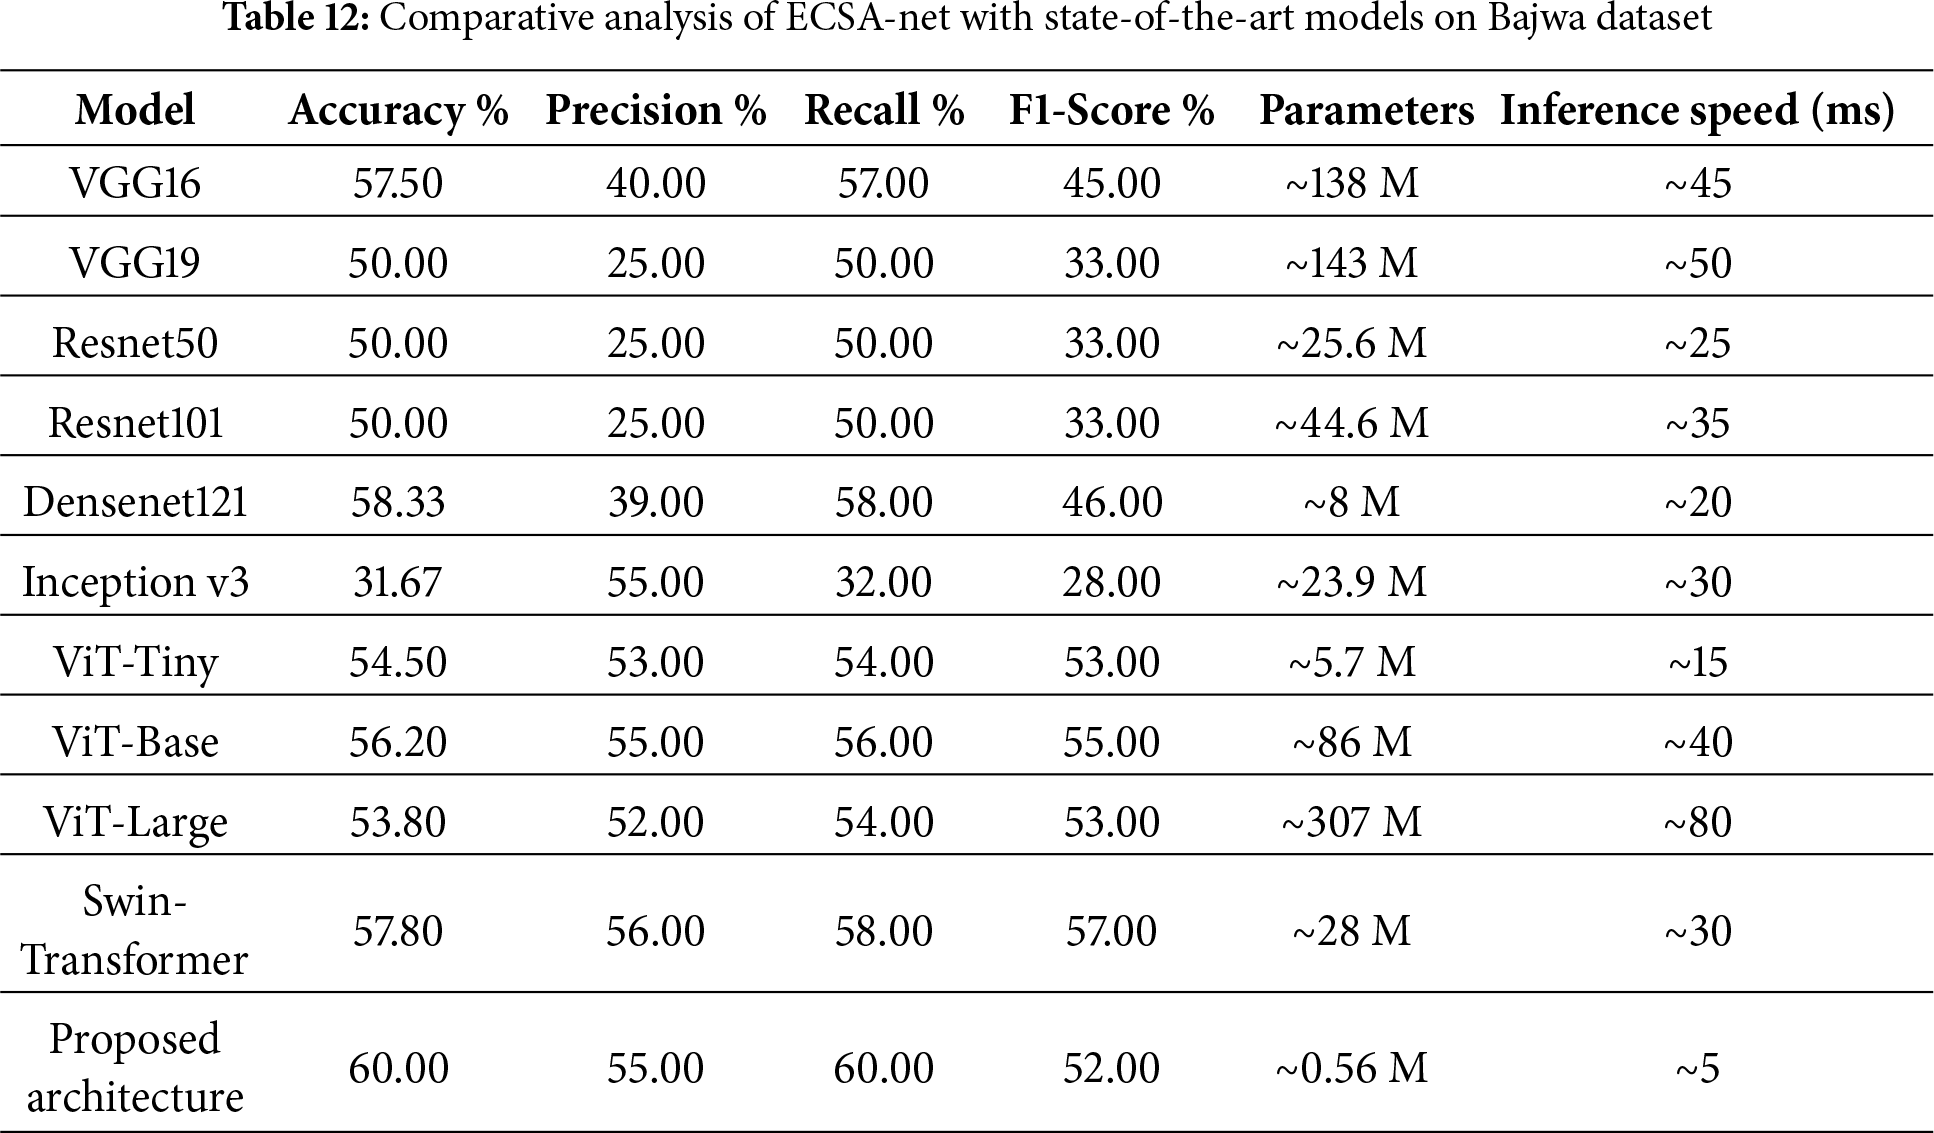
The comparative analysis of the proposed architecture compared to some well-known and well-used models: VGG16, VGG19, ResNet50, ResNet101, DenseNet121, Inception v3 and Base AttentionNet, as shown in Table 12, highlights that this proposed architecture achieves high efficiency as well as its effectiveness. Accuracy is maximally 60.00%. The values for precision, recall, and F1 score are 55%, 60%, and 52%, respectively, indicating better performance than the pretrained models used. For example, DenseNet121, one of the top-performing pre-trained models, achieves 58.33% accuracy, 46% F1-score, and 8 million parameters. By comparison, the new architecture performs better at a much-reduced number of parameters (0.56 million) and is hence computationally very efficient. They have a 57.50% and 50.00% accuracy rate, respectively. They require a huge number of parameters (138 and 143 million, respectively). Similarly, the case holds for ResNet50 and ResNet101, which achieve 50.00% accuracy with 25.6 and 44.6 million parameters, respectively. Inception v3, though, is efficient in other domains, showing the lowest accuracy of 31.67% in this assessment. Although transformer-based models like ViT and Swin-Transformer achieve moderate performance, their accuracy remains limited due to their large parameter counts and strong data dependence. In contrast, the proposed ECSA-Net achieves the highest score with a fraction of the parameters, demonstrating stronger capability to capture fine retinal details in small and imbalanced datasets. According to the comparison of inference speeds, our proposed architecture has the fastest inference time at 5 ms/image and has very few parameters (0.56 M). Therefore, it is more computationally efficient than other architectures with large numbers of parameters (e.g., ViT-Large has 307 M parameters and VGG19 has 143 M), and thus processes images significantly slower at 80 ms and 50 ms, respectively. Therefore, our architecture offers the best balance of accuracy and computational efficiency for situations where both performance and resource constraints are important.
4.4 Results on Eye Disease Image Dataset
Testing the Eye Disease Image Dataset with the new model yields an accuracy of 69.92%, which is good. The precision rate of 71% indicates how well the model identifies the correct cases, while the recall rate of 70% indicates the percentage of actual cases correctly identified. The combined F1 score (the average of precision and recall) is 70%. All these numbers constitute a well-balanced set of performance metrics, indicating that this model is effective and reliable for diagnosing eye diseases from image data.
4.4.2 Detailed Classification Report
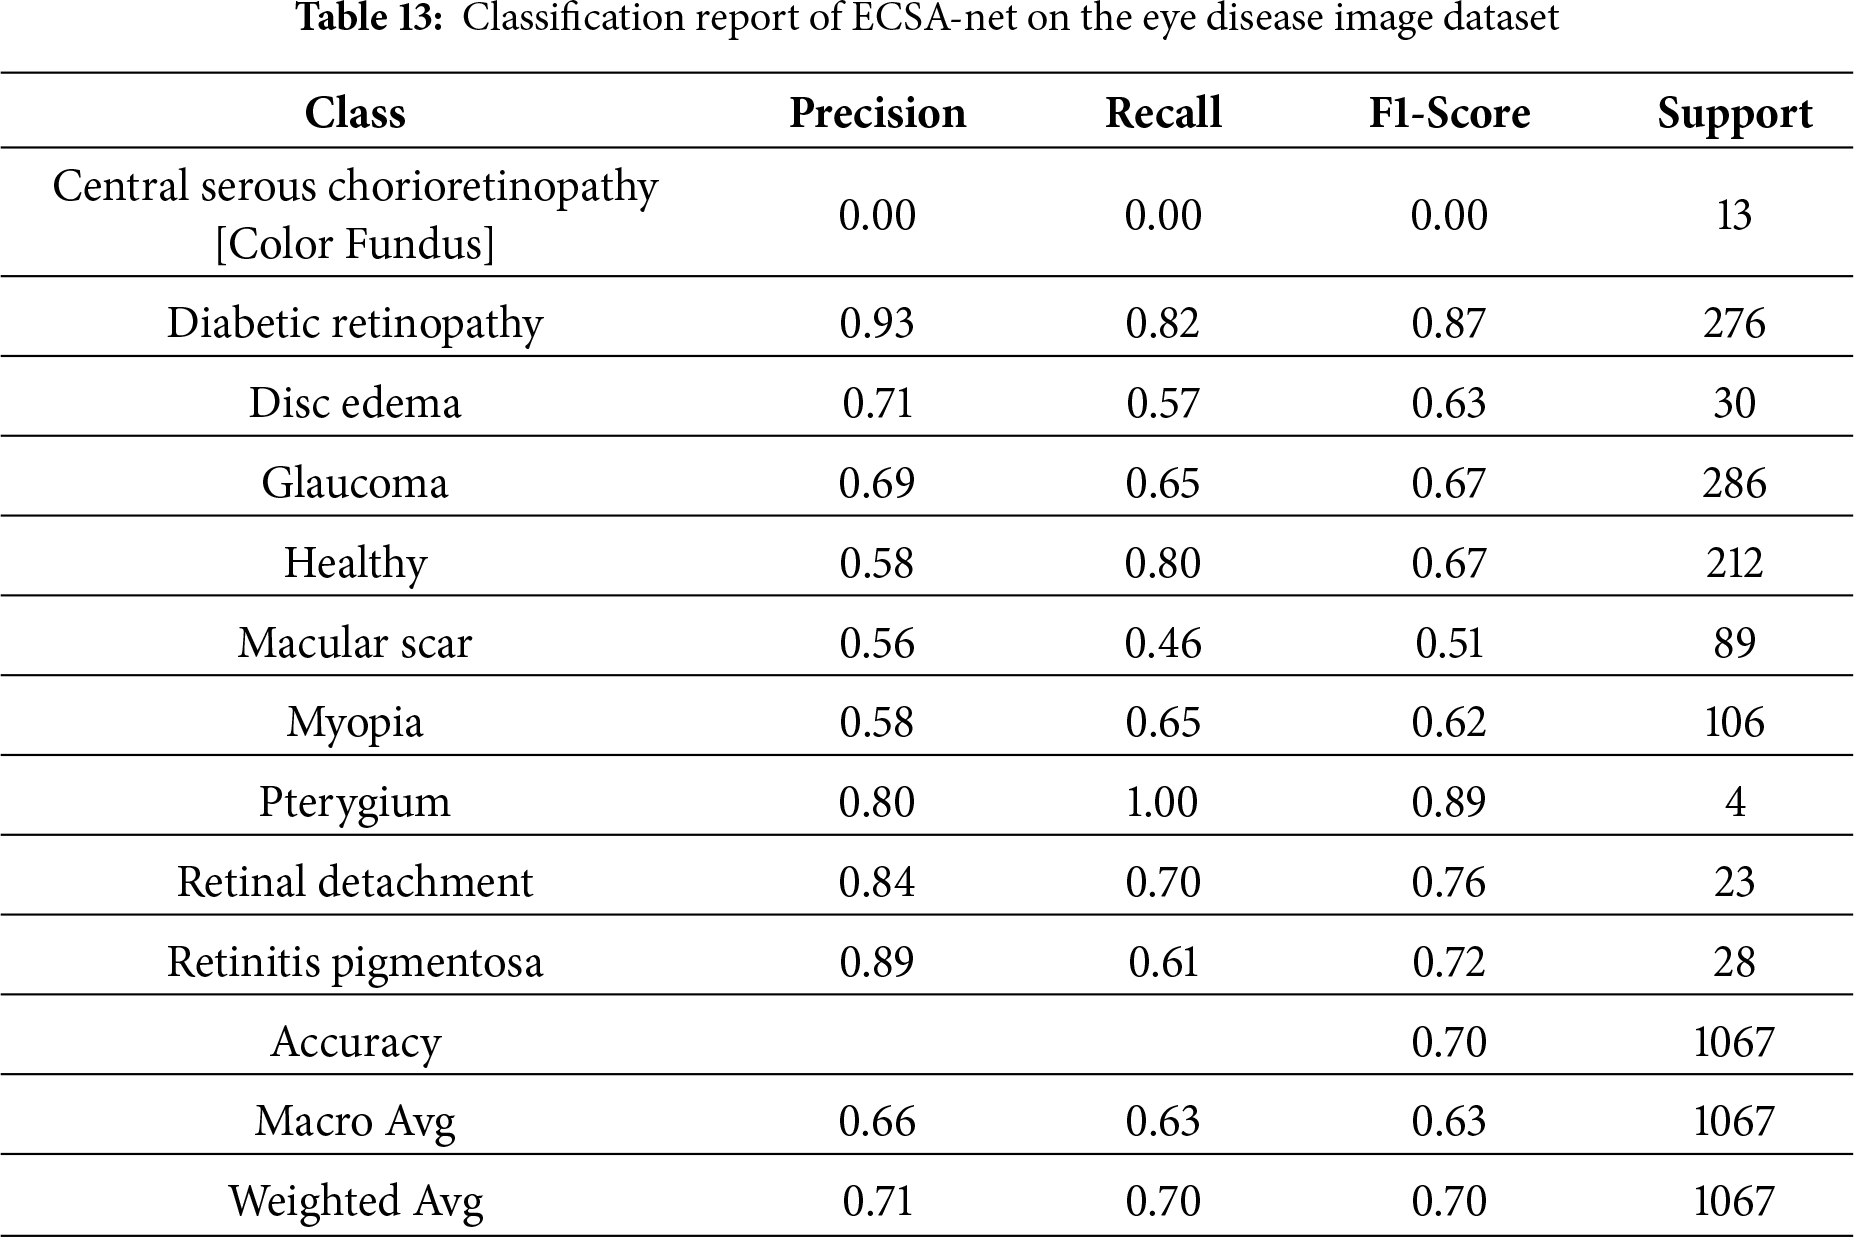
Table 13 shows the Classification report for how well the model performed across eye disease categories. An overall accuracy of 70% means that, most of the time, the model correctly classified eye disease. Major metrics include Weighted Avg. Precision (71%), Recall (70%), and F1 Score (70%), showing an equal balance in both Precision and Recall. Class-wise performance (individual diseases) for Diabetic Retinopathy and Glaucoma was strong, with F1 Scores of 87% and 67%, respectively, due to the high support for these diseases in the dataset. The other classes (e.g., Central Serous Chorioretinopathy (Color Fundus)) performed poorly, with 0 Precision, Recall, and F1 Scores, indicating that better detection methods are needed for diseases with low representation in the dataset. Pterygium, although represented by only 4 samples, is very sensitive to the presence of specific visual features and has nearly perfect Recall and high Precision scores. Classes such as Macular Scar and Myopia have only moderate classification performance and need improvement. The Macro Average of 63% F1 scores indicates some variability across classes, particularly for underrepresented classes. This analysis of performance demonstrates a strong correlation between the number of samples and the model’s clinical utility; therefore, these findings have serious implications for the equitable delivery of healthcare services. The presence of conditions with high representation (e.g., Diabetic Retinopathy, F1 = 0.87, 1521 training samples, and Glaucoma, F1 = 0.67, 1349 training samples) indicates that they achieve clinically actionable detection rates suitable for use in community screening programs. Meanwhile, conditions that were severely underrepresented (e.g., Central Serous Chorioretinopathy, F1 = 0.00, with only 101 total samples) could not be detected in 13 test cases, leading to critical failures. Pterygium, with only 17 samples, unexpectedly achieved a nearly perfect F1 score (0.89) due to its visually distinctive features. Such heterogeneous performance indicates a need to develop a stratified approach to deploying ECSA-Net as a screening tool only for commonly represented conditions (Diabetic Retinopathy, Glaucoma, Healthy), and to use supplementary classifiers for the remaining rare diseases, or to exclude them entirely from ECSA-Net’s diagnostic capabilities to prevent false negatives.
4.4.3 Confusion Matrix Analysis
As illustrated in Fig. 6, the confusion matrix shows how well the model classifies the various types of eye diseases based on its predictions. The true classes of healthy and diabetic retinopathy (throughout the whole year) were accurately predicted by the model. This indicates that these two classes are well-defined and identifiable, as their values lie on the dominant diagonal line. However, it appears that underrepresented classes, such as Central Serous Chorioretinopathy [Color Fundus] and Disc Edema, will require better data representation and improved feature extraction to accurately predict their true class values.
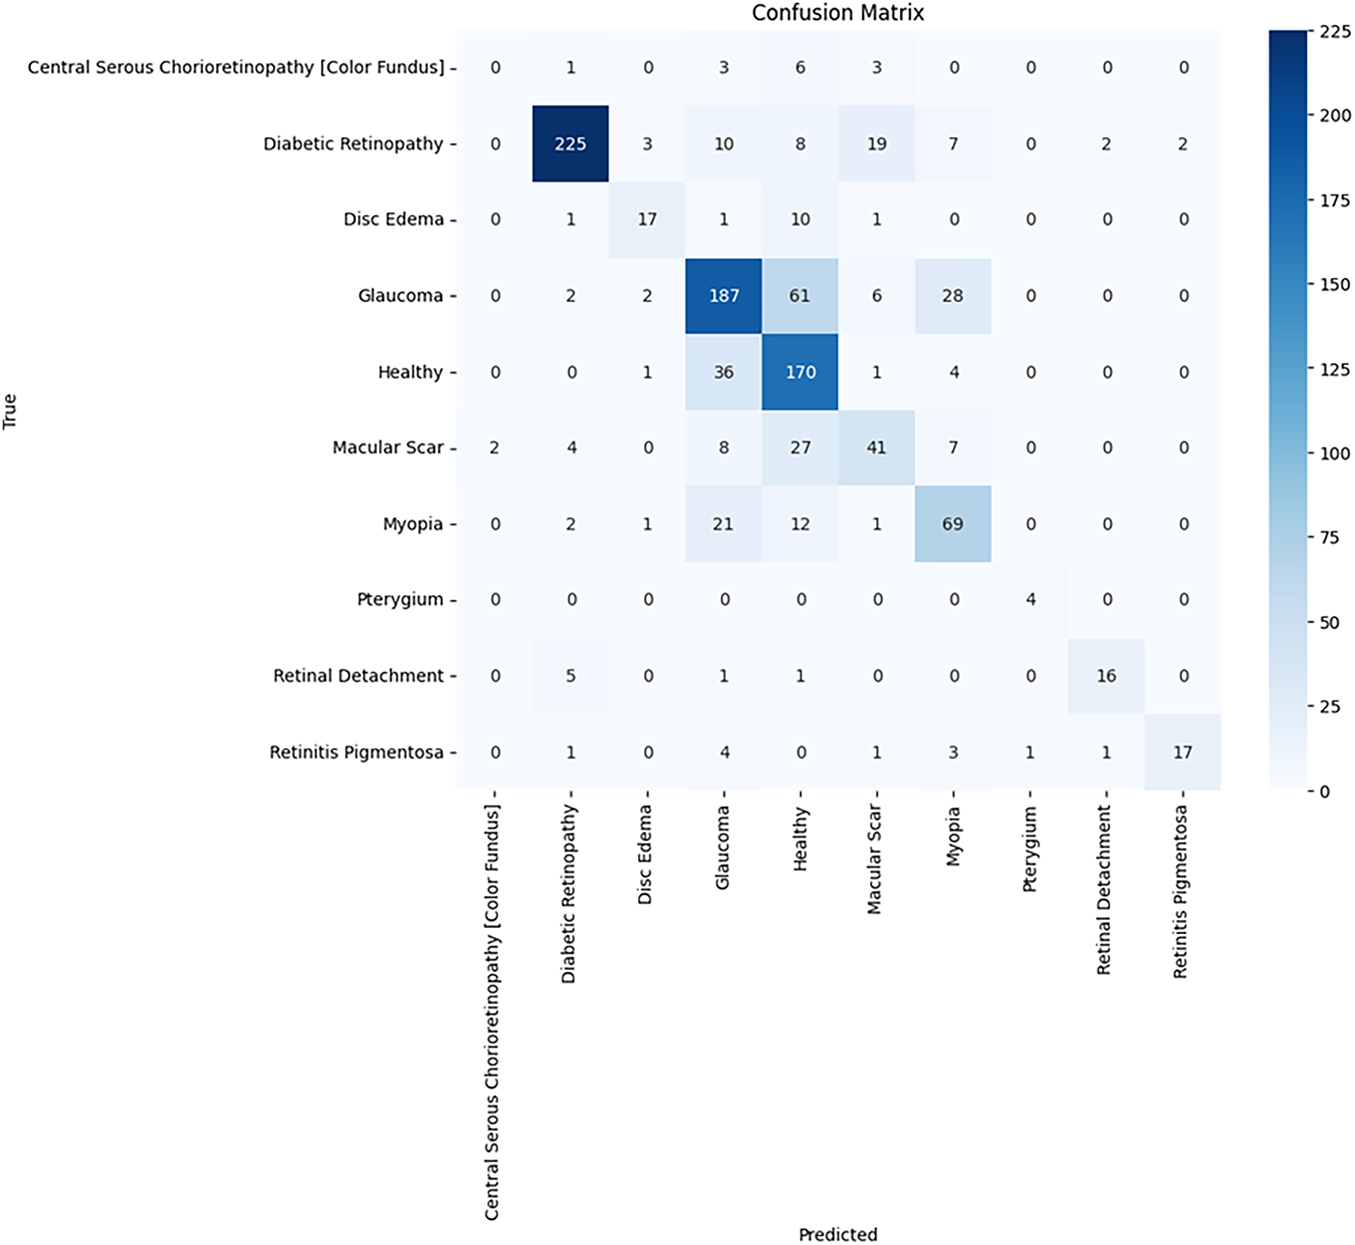
Figure 6: Confusion matrix of ECSA-net on the eye disease image dataset
Training curves in Fig. 7 for the Eye Disease Image Dataset for 60 epochs (early stopping was used after epoch 55) show steady learning because there is much more training data. The training accuracy increased from approximately 35% to 75% over this period, while the validation accuracy increased from approximately 30% to approximately 70%, with a slight variation in the last few epochs after reaching convergence. The accuracy difference between train and validation sets (5%) indicates excellent generalization across both sets and is consistent with the findings for the Bajwa dataset. Training and validation losses appear to decrease together at a relatively smooth exponential rate, indicating that both were effectively regularized and that no overfitting is occurring. Based on minor changes in the slope of the training and validation loss curves during later training epochs, it appears that the learning rate reductions facilitated fine-tuning during these periods. Overall, these graphs demonstrate the significant advantage of using larger datasets, as they provide smoother convergence and enhanced generalization; they also suggest that the current optimization strategy enables stable long-epoch training without performance degradation.
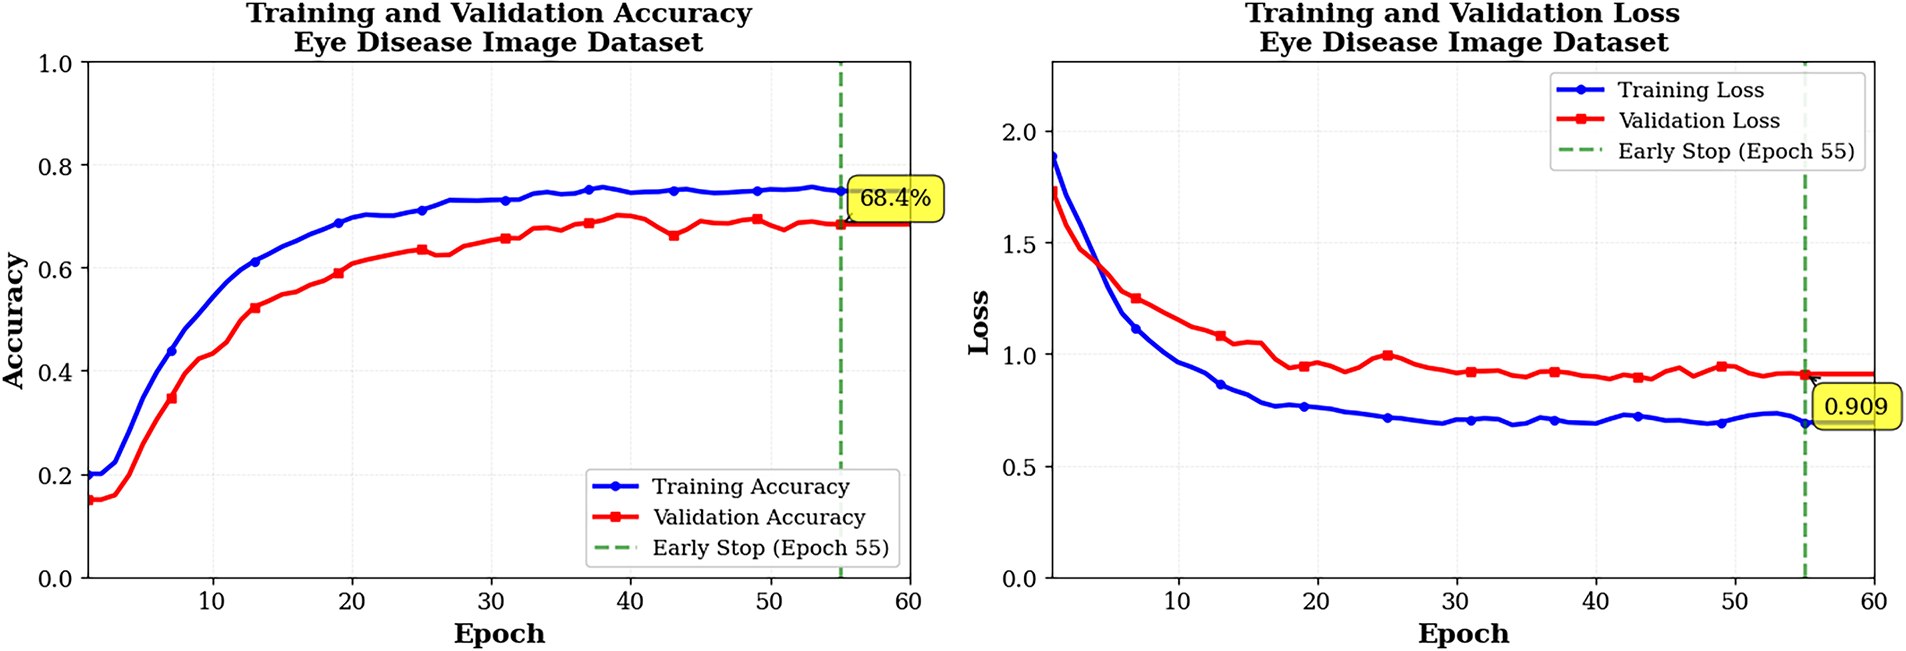
Figure 7: Training and validation graphs pf ECSA-Net on eye disease dataset
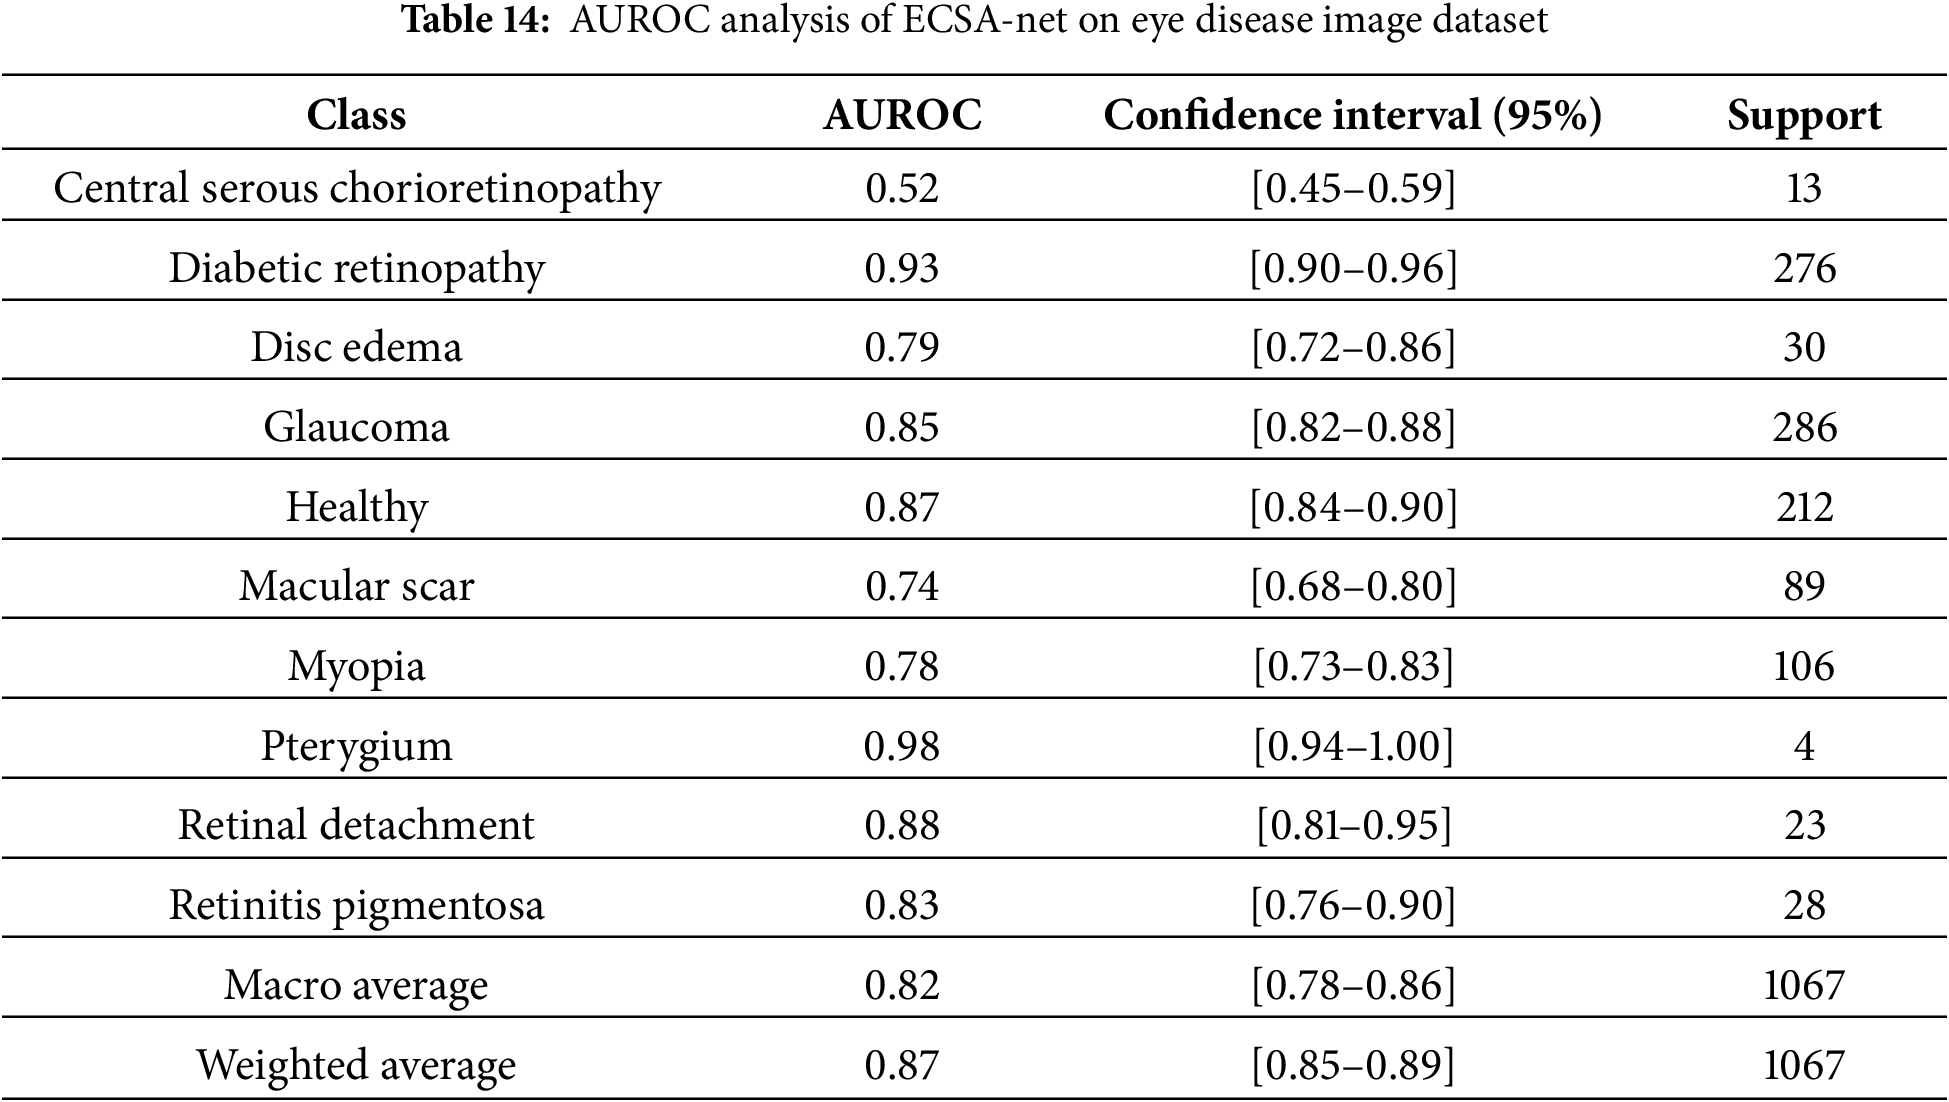
Table 14 in this document presents AUROC scores for the Eye Disease image datasets for each disease class, based on a multi-class evaluation of this model’s performance. AUROC results indicate strong discrimination by this model across a wider range of sample sizes. The model demonstrated excellent results for diabetic retinopathy (AUROC of 0.93), with a very good F1-score and a large training dataset, providing significant screening opportunity for this condition. There was also virtually perfect AUROC (0.98) for pterygium even though there were very few pterygium samples, possibly because of the unique appearance associated with this condition, and finally good (although not excellent) AUROC score (0.85 for Glaucoma and 0.87 for Healthy) reflects the model’s capability to recognize important differences in structure. Retinal detachment (0.88) and retinitis pigmentosa (0.83) similarly achieve strong results, suggesting that their characteristic patterns are easily recognized. Disc edema (0.79) and myopia (0.78) show good but comparatively lower performance, likely due to more subtle or variable features, while macular scar (0.74) demonstrates only acceptable discrimination consistent with its moderate F1-score. Central serous chorioretinopathy performs poorly (0.52), close to chance level, reflecting insufficient training data and the model’s inability to learn reliable features for this rare condition. Overall, the model performs well across all classes.
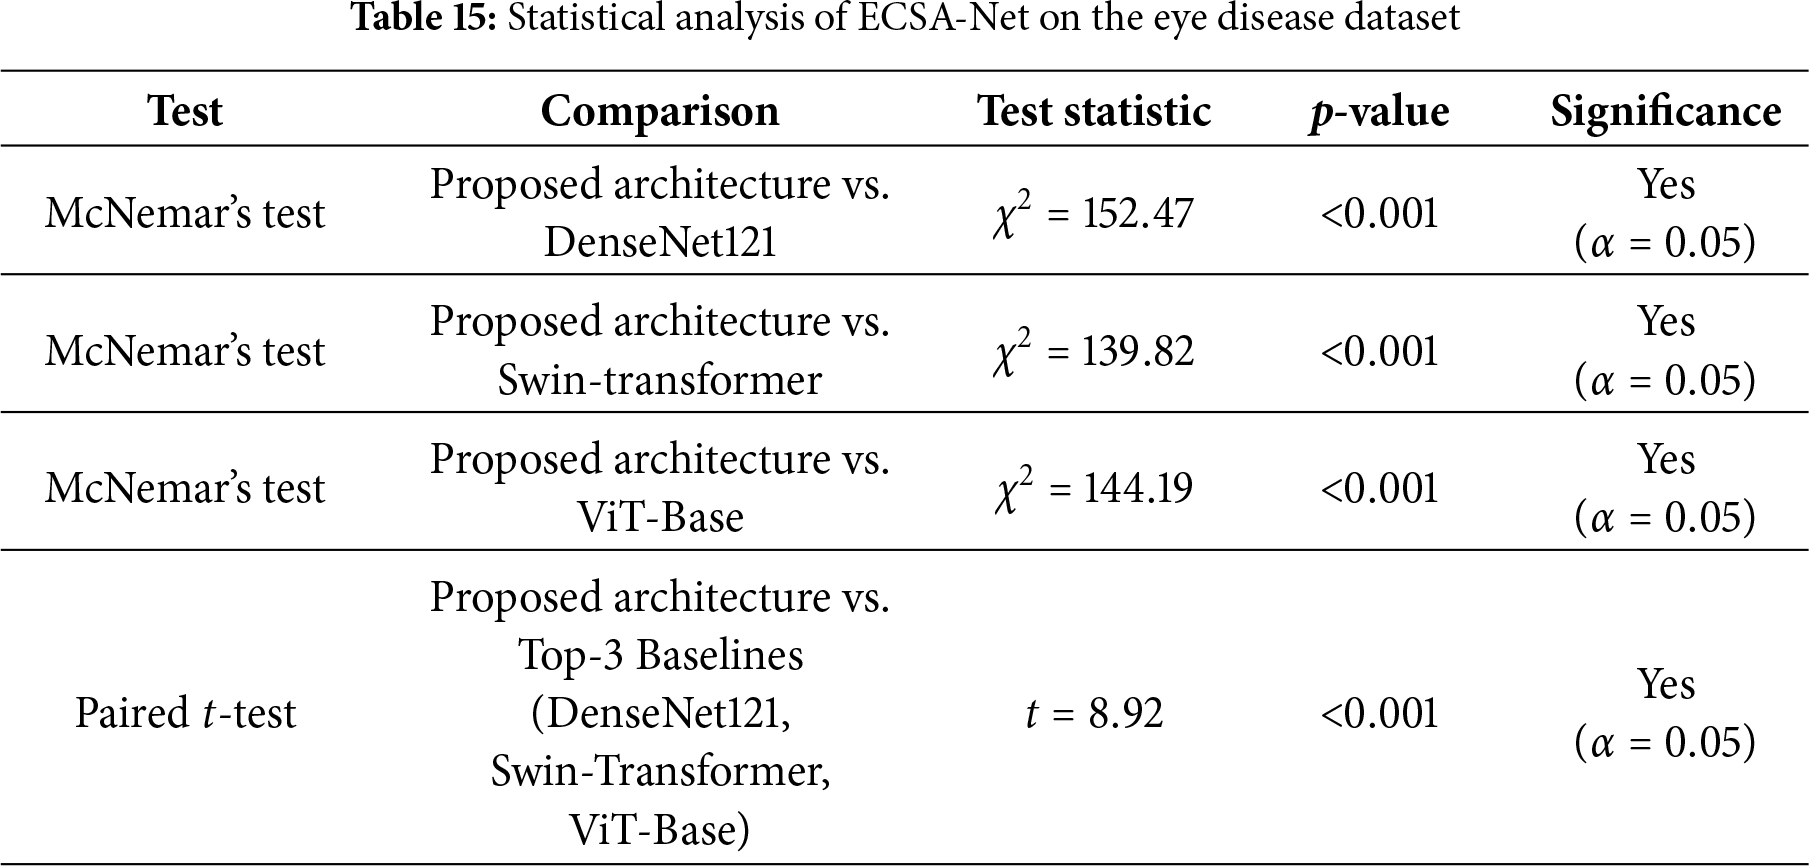
The statistical tests in Table 15 demonstrate that the performance differences between the proposed ECSA-Net and the leading baseline models are highly significant. McNemar’s tests show large chi-square values (
ECSA-Net’s major benefit is not to serve as a substitute for the large Transformer/hybrid Transformer central nervous system (CNS) in high-volume data settings, but rather to be an efficient solution that provides continued performance with minimal available data in an unequal proportion (under-represented clinical vector), as well as limited processing power needed for deployment. For this reason, ECSA-Net will have fewer parameters than typical and a lower dependency on the number of available Supported Data for development, and will therefore have significantly less complexity, while providing much quicker Inference Rates than the standard larger Transformer/hybrid Transformer models.
4.6.1 Ablation Study 1: Attention Block Contribution
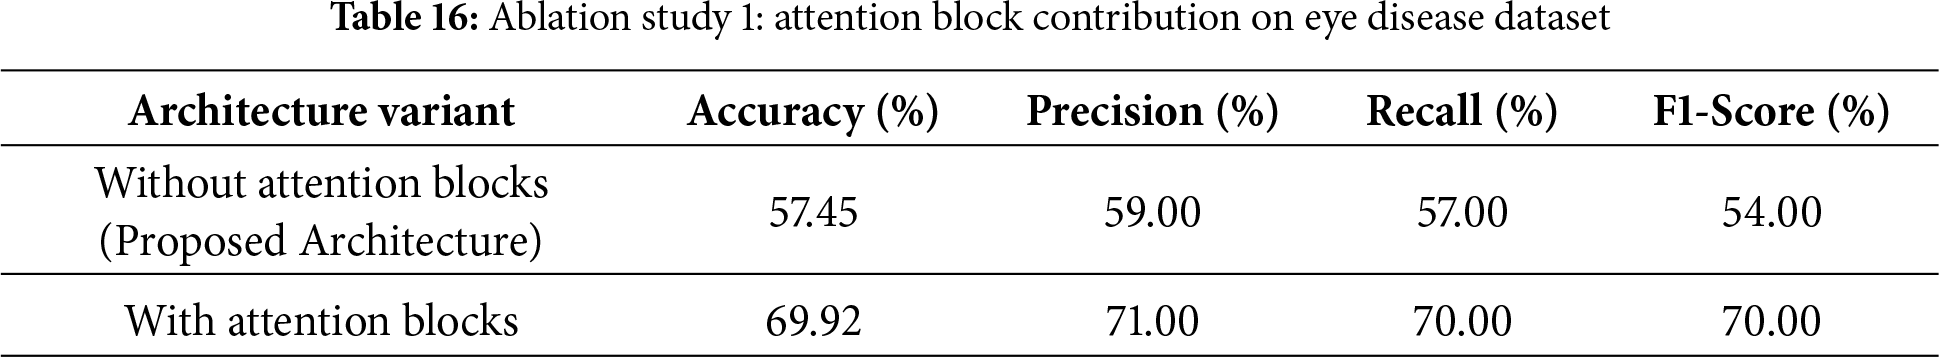
Ablation experiments in Table 16 were performed to determine the impact of including attention blocks on the overall performance of our proposed model. In addition to reporting the results obtained when attention blocks were not included in the model (Accuracy = 57.45%, Precision = 59%, Recall = 57%, F1-score = 54%), the table also showed that including attention blocks greatly improved the performance of our proposed model (Accuracy = 69.92%, Precision = 71%, Recall = 70%, F1-score = 70%). This significant improvement in the performance of our proposed model provides further evidence of the benefits of using the attention mechanism, which enables it to focus on the most salient features of the data, leading to higher accuracy and more robust predictions.
4.6.2 Ablation Study 2: Contribution of Convolution Blocks
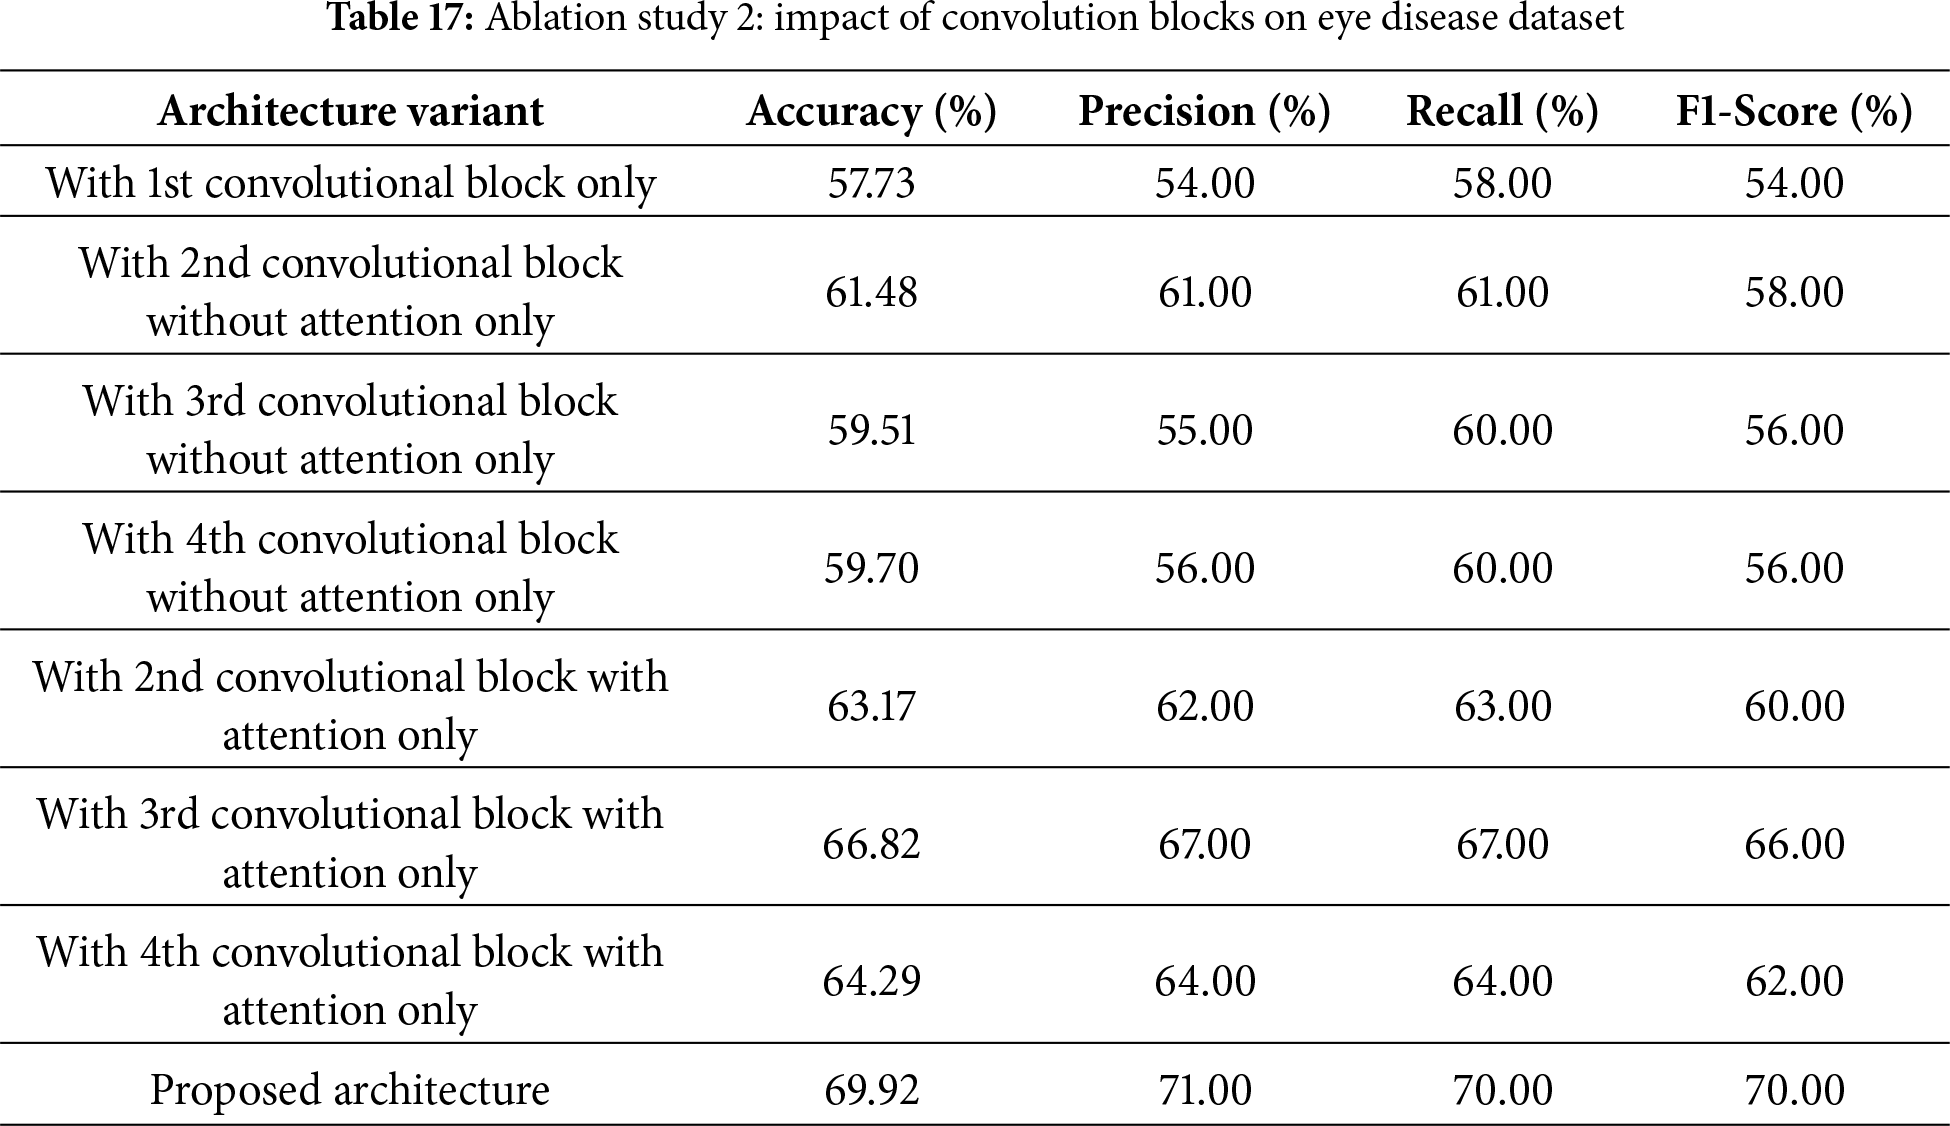
This second ablation study, as shown in Table 17, checks the contribution of individual convolutional blocks, with and without attention, to the final performance of the proposed architecture. Using only the first convolutional block was sufficient to achieve a baseline accuracy of 57.73% and an F1-score of 54%. Adding the second block without attention improved the value to 61.48%, while other blocks without attention also showed promise, achieving accuracies of 59.51% by the third block and 59.70% by the fourth. It is noted that adding attention mechanisms gave a significant boost: the second block with attention achieved 63.17% accuracy, the third block with attention achieved 66.82% accuracy, and the fourth block with attention achieved 64.29% accuracy. The proposed architecture, combining all blocks with attention, delivered the best performance with an accuracy of 69.92%, precision of 71%, recall of 70%, and a 70% F1-score. These results thus highlight the critical role of attention mechanisms and the effect of accumulation across multiple convolutional blocks on the model’s performance.
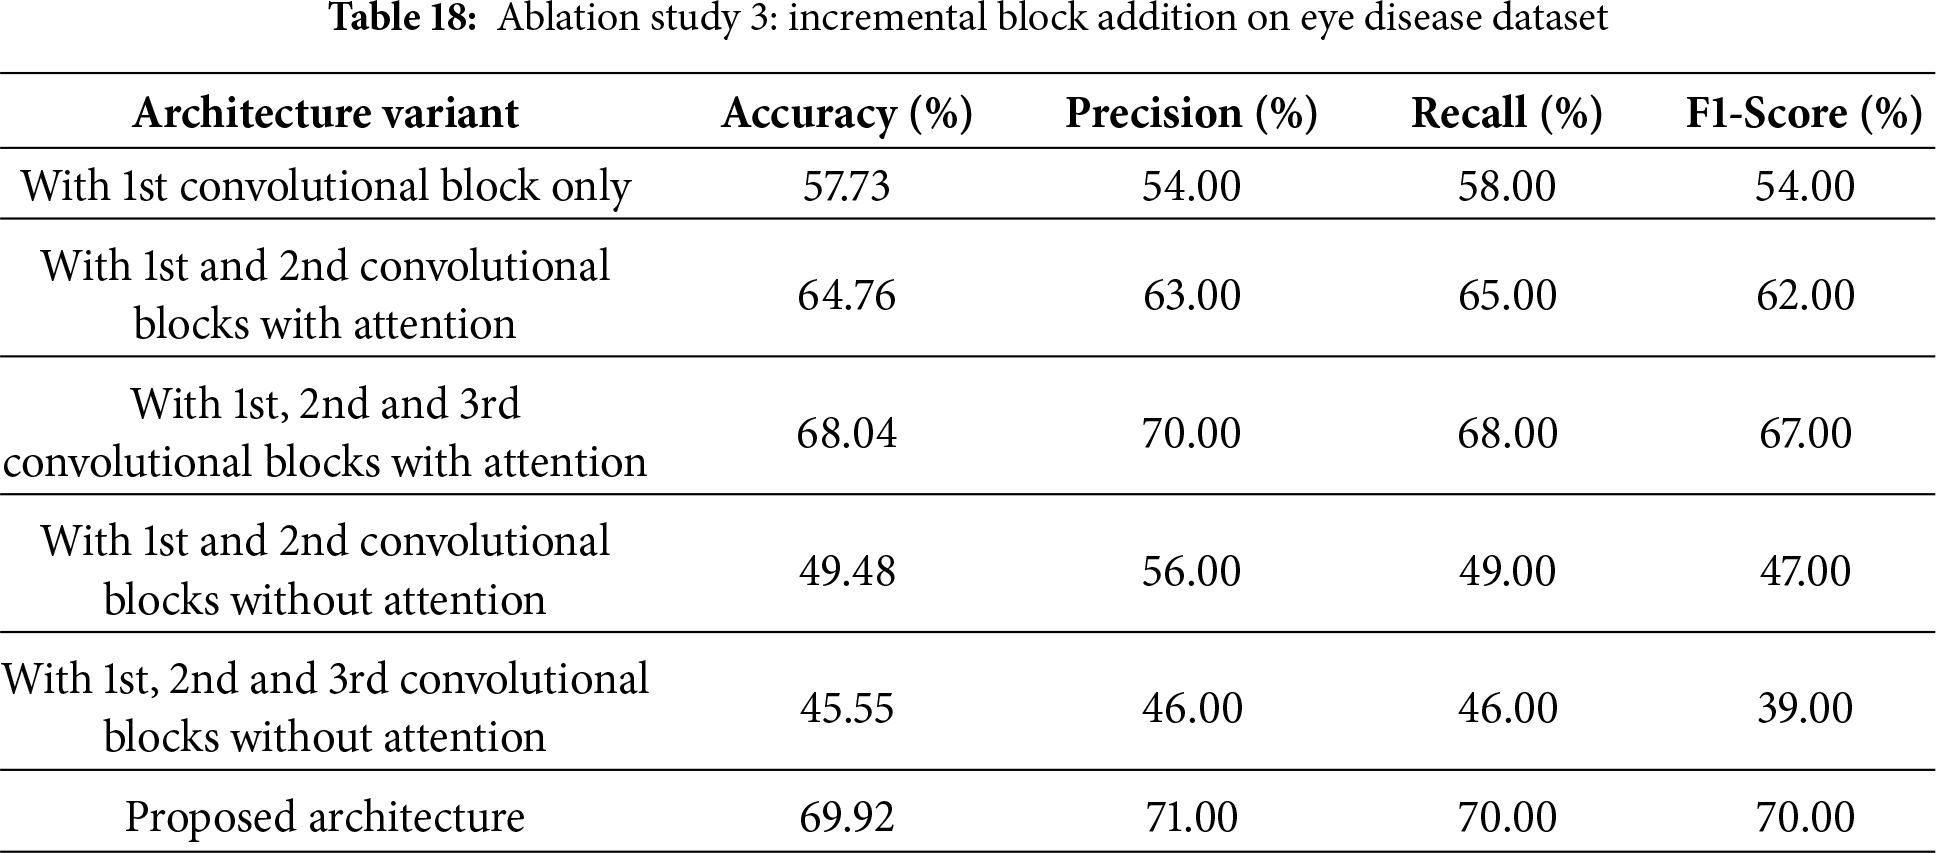
4.6.3 Ablation Study 3: Incremental Block Addition
The third ablation study, as shown in Table 18, investigates how the model’s performance is affected by incrementally adding convolutional blocks, with and without attention mechanisms. Adding only the first convolutional block resulted in an accuracy of 57.73% and an F1-score of 54%. When the first block was used with the second block using attention mechanisms, the accuracy improved significantly to 64.76%, with an F1-score of 62%. The third block with attention resulted in even greater accuracy: 68.04% accuracy with an F1-score of 67%. But without the mechanisms of attention, the model decreased significantly. Accuracy dropped to 49.48% when combining the first and second blocks, while adding the third block further reduced it to 45.55% and yielded a very small F1-score of 39%. The proposed architecture, with all blocks including attention mechanisms, achieves the highest performance with 69.92% accuracy, 71% precision, 70% recall, and a 70% F1-score, demonstrating that attention mechanisms effectively boost model performance.
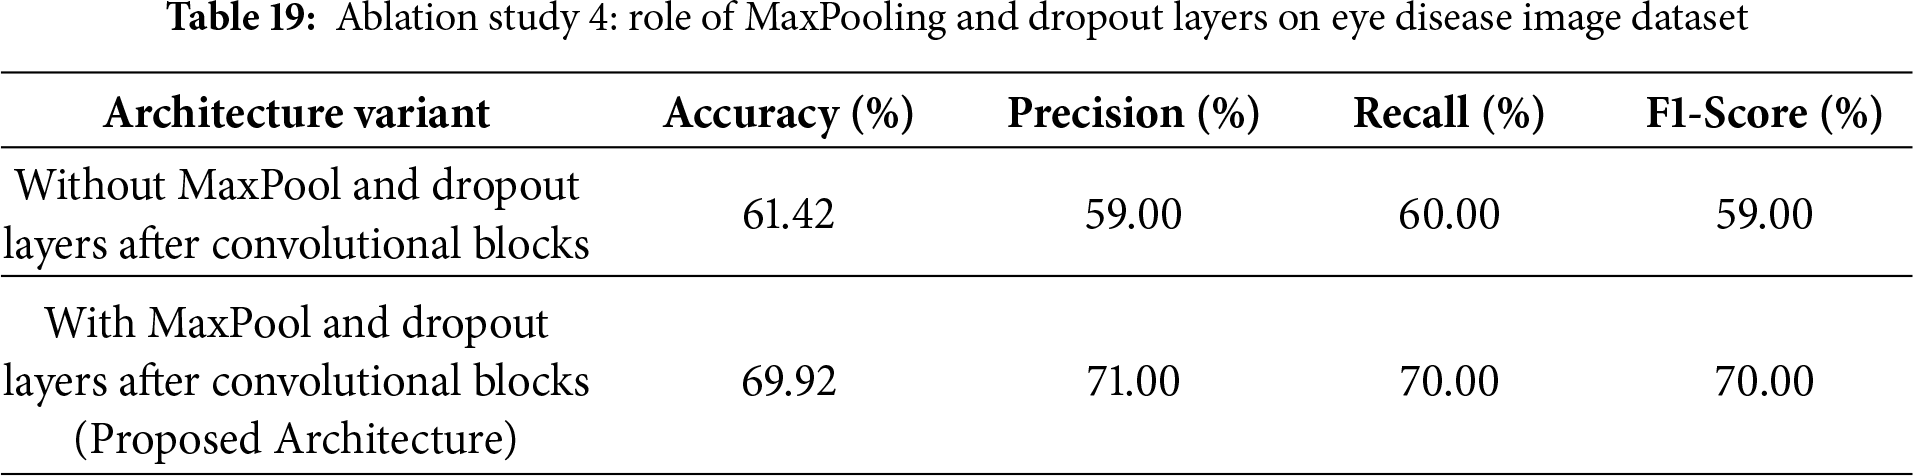
4.7 Ablation Study 4: Impact of MaxPooling and Dropout
The fourth ablation study tests the influence of MaxPooling and Dropout layers on improving the performance of the proposed architecture, as shown in Table 19. When MaxPool and Dropout layers were removed after the convolutional blocks, the resulting accuracy was 61.42% for precision, recall, and F1-score, with 59%, 60%, and 59%, respectively. Adding the MaxPool and Dropout layers significantly improved performance. This resulted in accuracies of 69.92%, precision of 71%, recall of 70%, and an F1-score of 70%. This indicates that these layers play a very crucial role in significantly reducing overfitting and therefore improving the model’s generalization and performance.
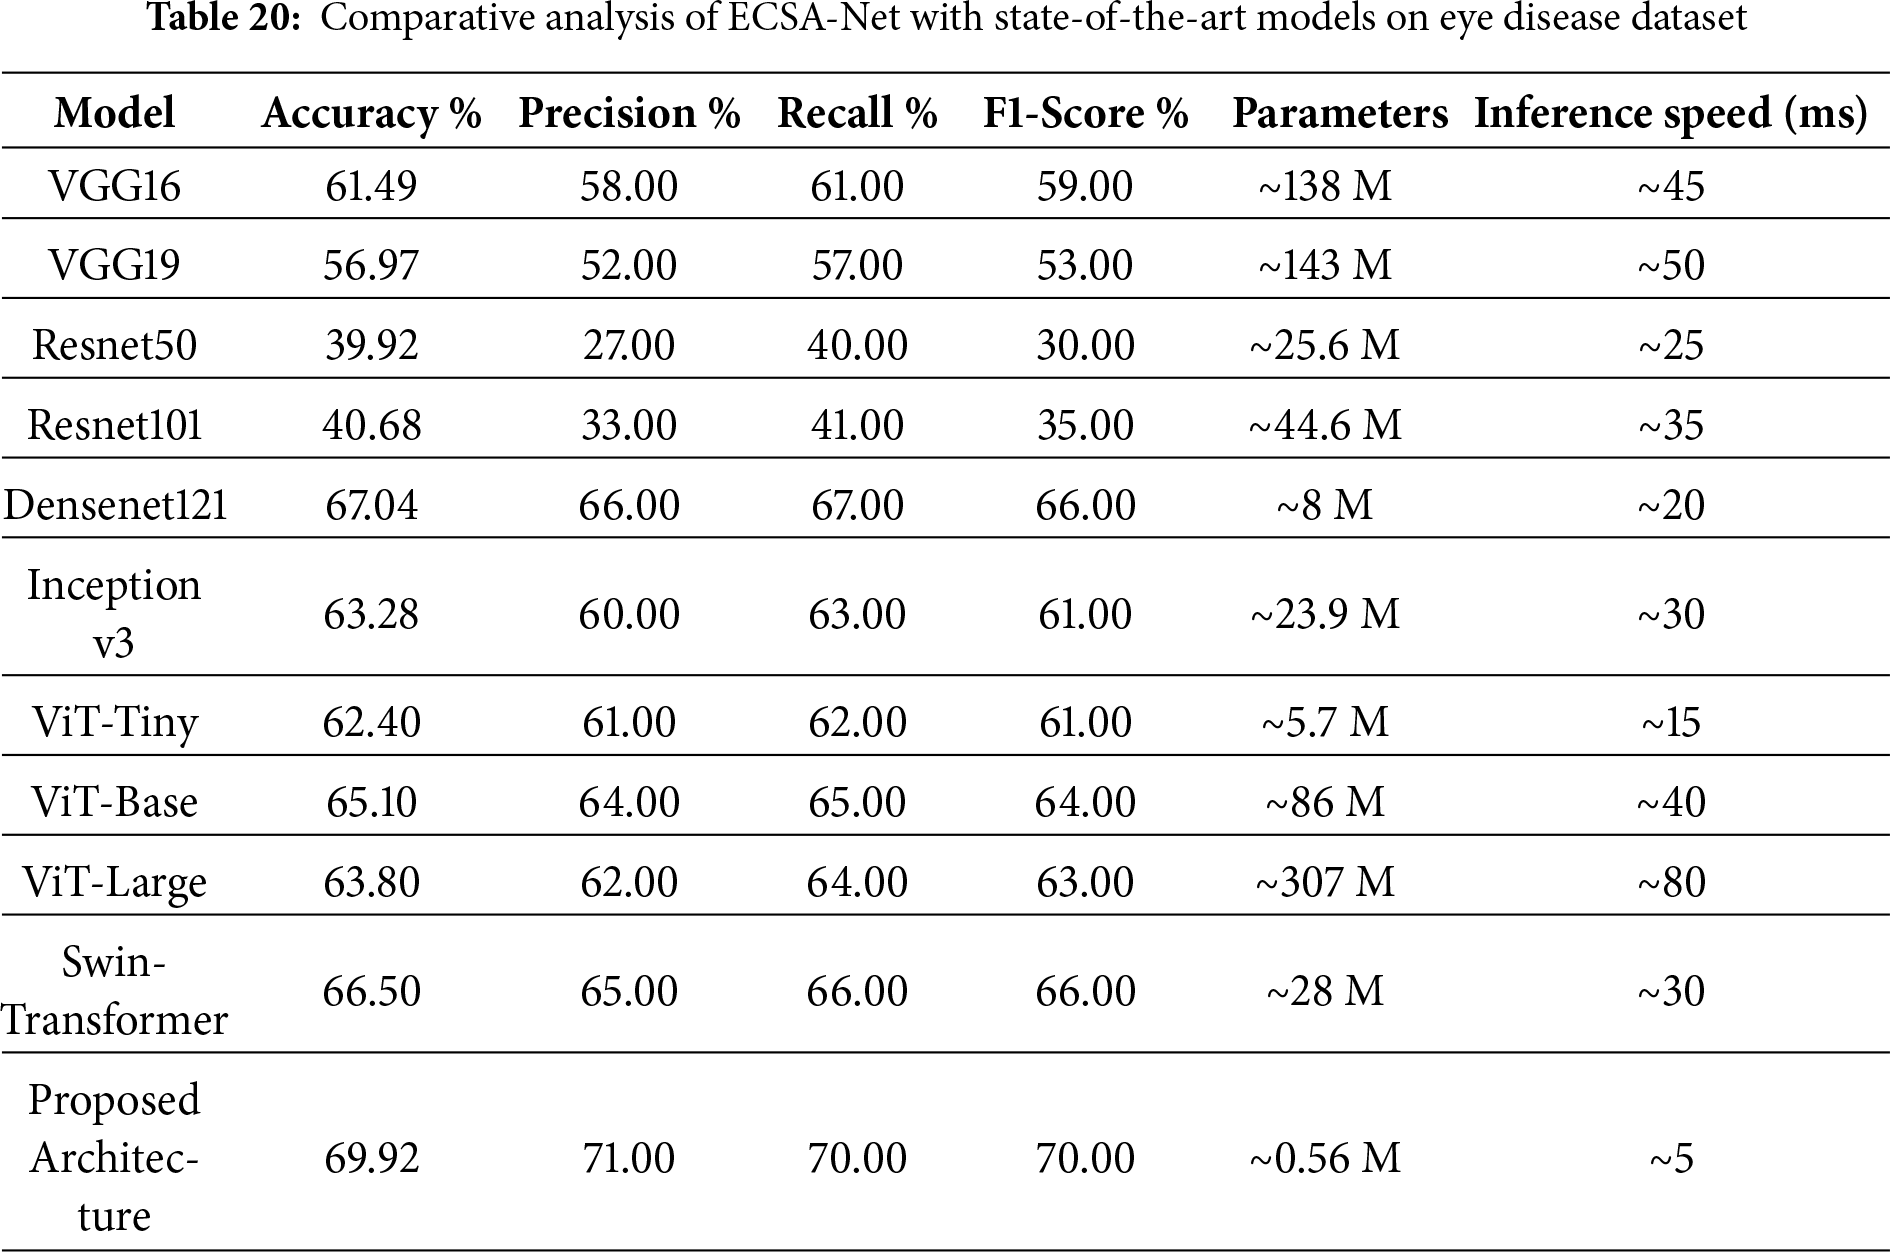
4.8 Comparative Analysis with Pretrained Models
A comparative analysis, as shown in Table 20, provides detailed performance metrics for the proposed architecture compared with a variety of pre-trained models. VGG16 achieved an accuracy of 61.49%, precision of 58%, recall of 61%, and F1-score of 59%. VGG19 performed a bit low with 56.97% accuracy, 52% precision, 57% recall, and 53% in F1-score. The performance of ResNet50 and ResNet101 is rather poor, with accuracies of 39.92% and 40.68%, respectively, and relatively low precision, recall, and F1 Scores. Densenet121 achieved the best accuracy of 67.04%, precision 66%, recall 67%, and F1-score 66%. Inception v3 comes next with a 63.28% accuracy and comparable metrics. ViT and Swin models perform better than traditional CNNs but still fall short of the proposed ECSA-Net. The superior performance of ECSA-Net highlights its ability to extract discriminative features more effectively, making it more reliable for eye disease classification even when tested on a more challenging dataset. With a maximum accuracy of 69.92%, precision of 71%, recall of 70%, and F1 score of 70%, the proposed architecture clearly outperformed all other architectures presented in this paper. In addition to achieving the best accuracy (69.92%), the unique architecture achieved the fastest inference speed of any tested architecture, processing images in just 5 ms/image, effectively breaking the long-standing trade-off between accuracy and speed. Whereas the larger and more complex architectures, such as ViT-Large (80 ms) or VGG models (45 ms), have lower accuracy with significantly longer processing times, the proposed lightweight model (0.56 million parameters) was developed to support the rapid and accurate deployment in active real-time environments, such as automated vehicle systems, where speed and accuracy are critical.
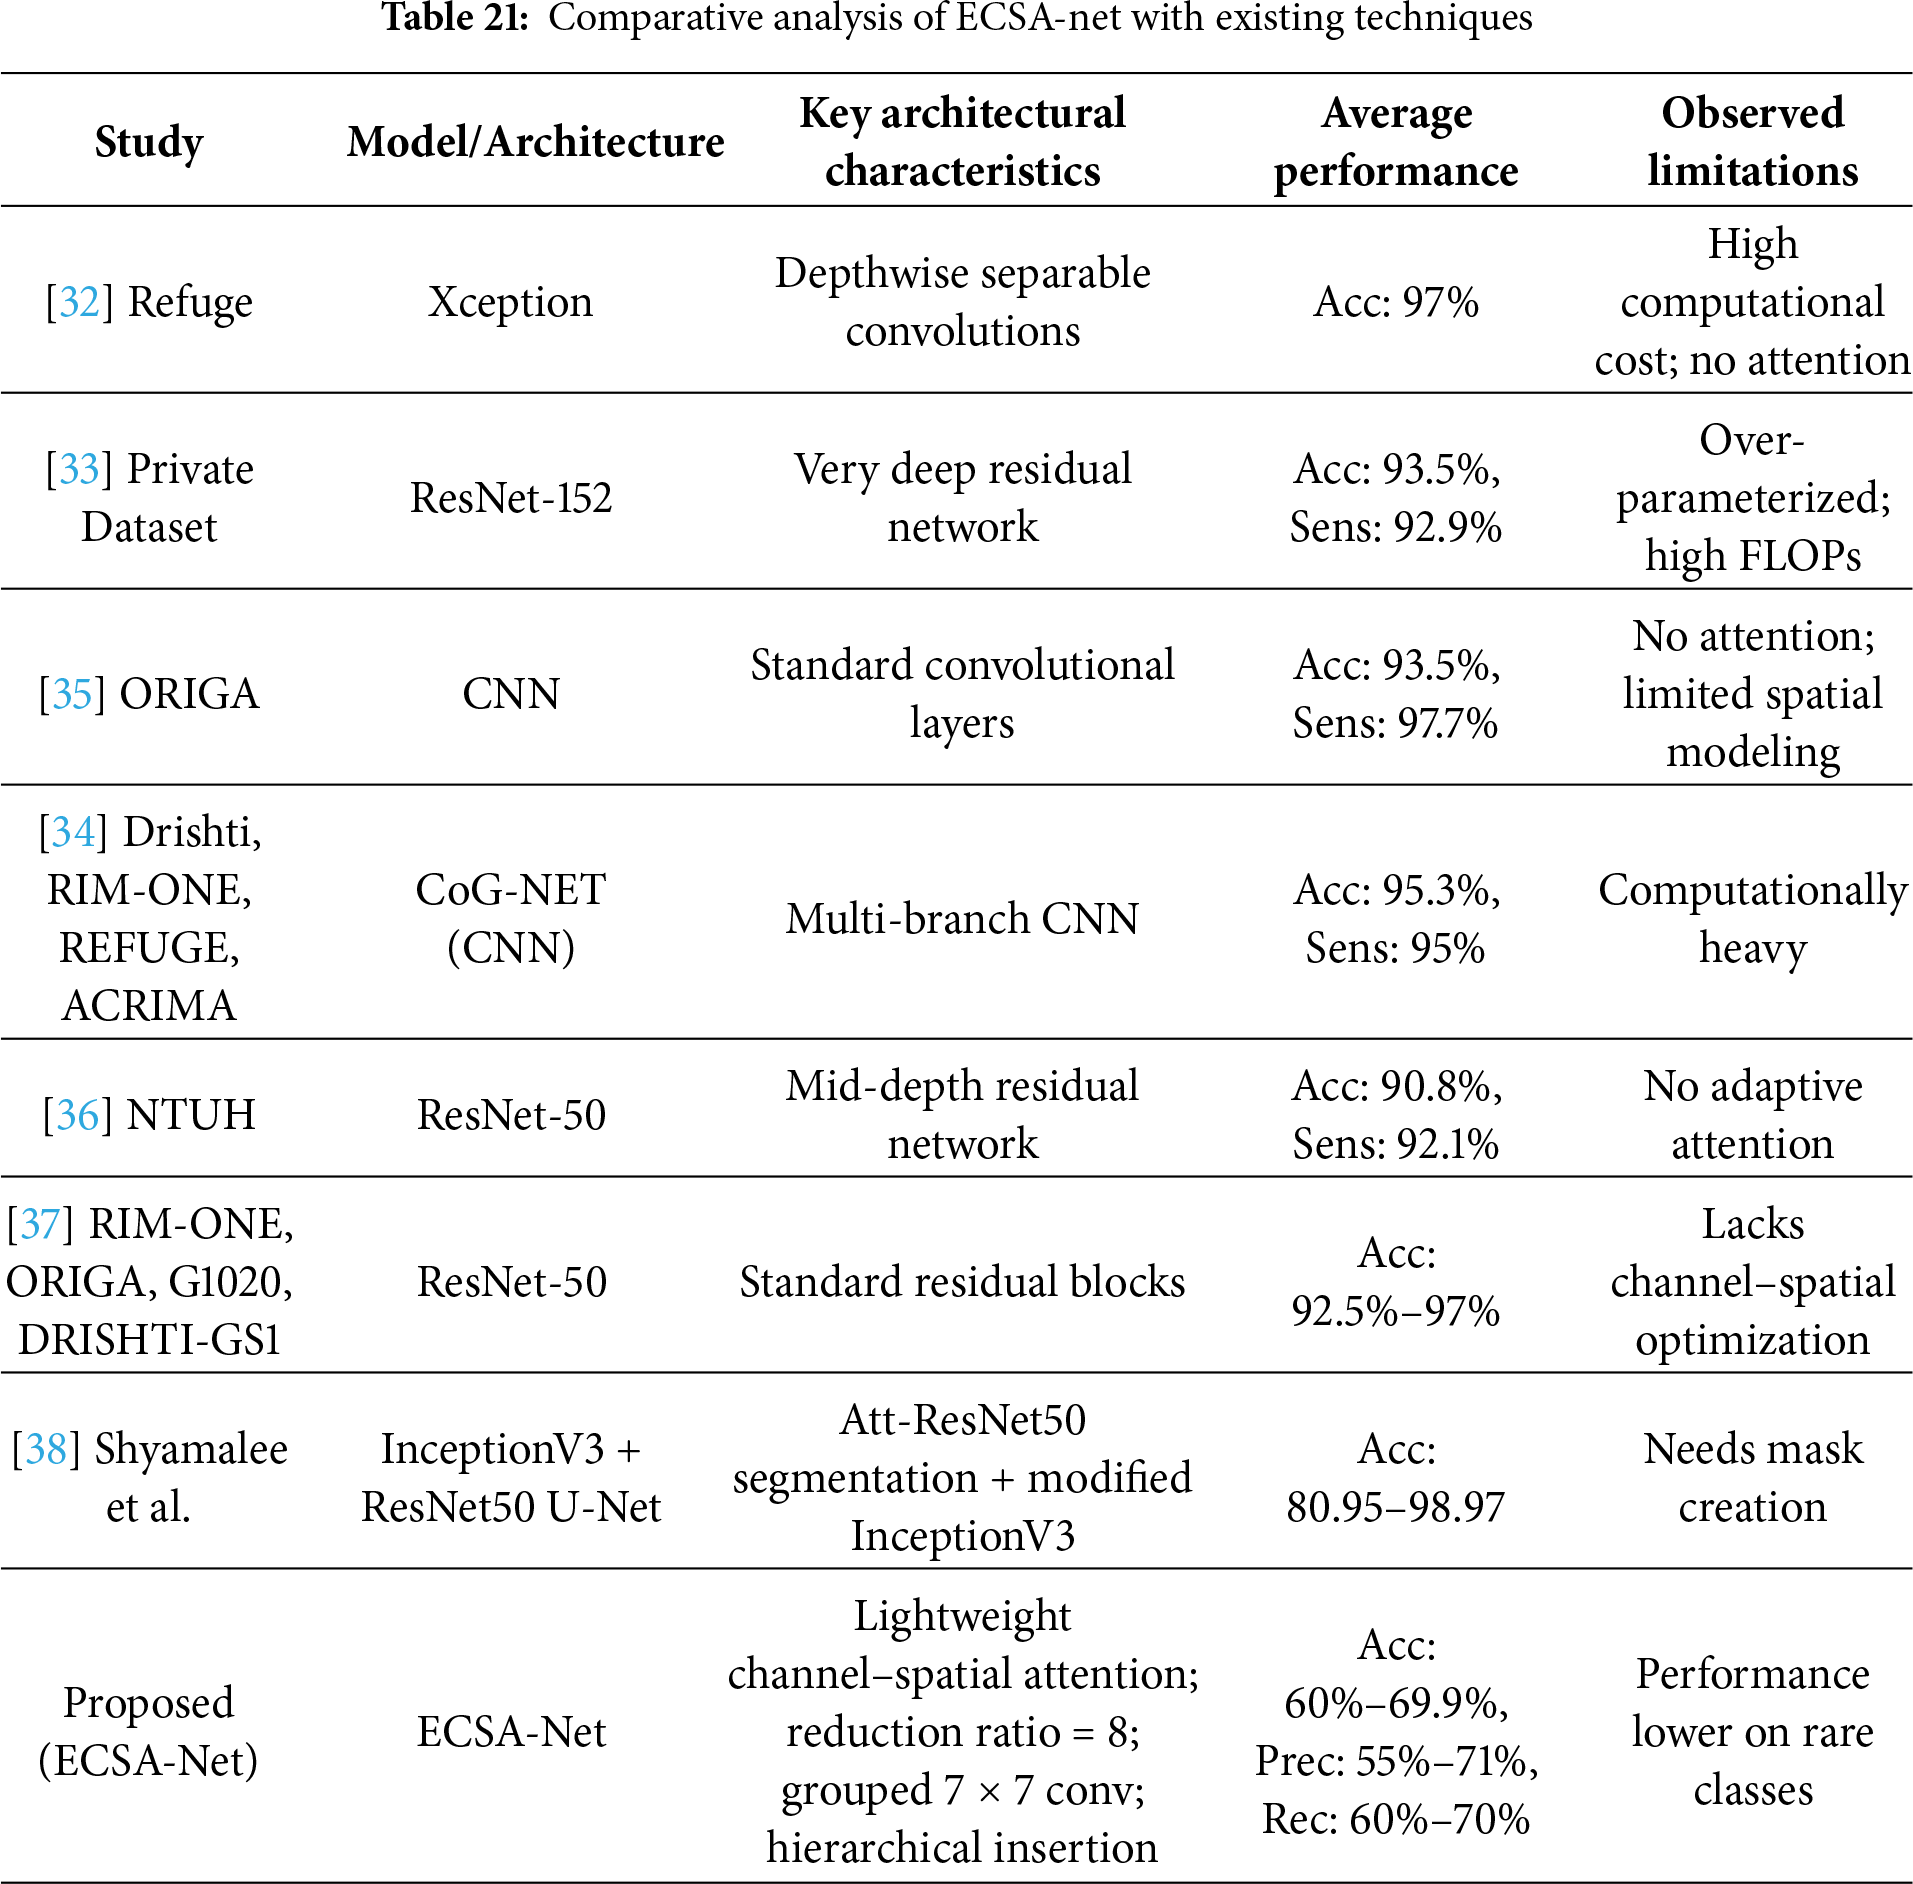
4.9 Comaparative Analysis with Existing techniques
Table 21 presents a comparative analysis of state-of-the-art deep learning models for eye disease classification identification using fundus images, highlighting key architectures, performance metrics, and limitations across various studies. While prior works, such as those employing Xception [32], ResNet-152 [33], and CoG-Net [34], achieve high accuracies ranging from 90.8% to 97% on binary classification tasks, they often suffer from high computational costs, over-parameterization, and a lack of attention mechanisms, limiting their efficiency and interpretability in resource-constrained clinical settings. Similarly, the approach by [24] Bitto et al. leverages Attention U-Net with modified InceptionV3 for segmentation and classification, attaining up to 98.97% accuracy but requiring manual mask creation and facing challenges with dataset variability. In contrast, our proposed ECSA-Net introduces a novel lightweight architecture with channel-spatial attention (reduction ratio = 8), grouped 7
4.10 Failure Analysis and Root Cause Investigation
A complete failure to identify retinal disease (Bajwa dataset) and Central Serous Chorioretinopathy (Eye Disease dataset), both of which received a 0.00 F1-Score, can be attributed to three intertwined factors. The primary factor is that both of these rare diseases are extremely rare, and therefore, the model has severely limited access to data to learn from. The Bajwa dataset contains 100 samples of retinal disease and 300 normal retinal conditions (3:1 imbalance). The Central Serous Chorioretinopathy dataset has about 80 samples in the training set with 1,521 cases of Diabetic Retinopathy (19:1 imbalance). Therefore, there is a strong bias towards the majority class in the training set used to optimize the model during gradient descent. A second contributing factor to the difficulty in identifying these rare diseases is that subtle differences between the rare conditions and the more common retinal conditions are hard to distinguish in the absence of sufficient examples with which to define clear decision boundaries. Third, the model develops a systematic bias toward predicting majority classes, as this minimizes overall training loss—the confusion matrices confirm that all retina disease samples (18/18) and Central Serous Chorioretinopathy samples (13/13) were misclassified as normal or other dominant classes. Our technical hypothesis posits that the attention mechanisms, designed to focus on discriminative features, paradoxically learn to emphasize patterns common to the majority classes; without adequate minority class samples, the channel and spatial attention modules fail to develop the sensitivity required to detect rare pathological features, as attention weights are optimized primarily based on frequently occurring patterns that dominate the loss function. To mitigate these failures in future work, we propose implementing focal loss to down-weight easy majority class examples and emphasize hard minority cases, applying class-balanced sampling techniques such as oversampling minority classes or undersampling majority classes during training, generating synthetic minority samples through data augmentation methods including generative adversarial networks (GANs) or synthetic minority over-sampling technique (SMOTE) to artificially balance class distributions, and developing ensemble models where specialized classifiers are trained independently for rare diseases and combined with the general model through weighted voting or stacking strategies.
4.11 Ethical Considerations and Responsible AI Deployment
The deployment of AI in medical diagnostics requires careful consideration of ethical implications, which ECSA-Net addresses through transparent reporting of performance disparities across disease classes, including explicit disclosure of failures on underrepresented conditions (retina disease and Central Serous Chorioretinopathy with 0.00 F1-scores) to prevent inappropriate clinical deployment and guide future bias mitigation through balanced sampling and focal loss techniques. Both datasets consist of de-identified retinal images complying with the Health Insurance Portability and Accountability Act (HIPAA) and the General Data Protection Regulation (GDPR) standards, while ECSA-Net’s lightweight architecture (0.56 M parameters) enables complete on-device inference on mobile platforms, eliminating the need to transmit sensitive patient data to external servers and enhancing privacy protection in under-served communities. The design of the attention mechanism allows it to be inherently interpretable; because attention focuses on diagnosing relevant regions of the retina and will have gradient-weighted class activation mapping (Grad-CAM) visualizations planned out to produce “clinical heat maps” detailing how much influence each region had on a classification decision, it will help to build trust between the model and ophthalmologists, who will be able to verify the reasons for the model’s decisions. ECSA-Net was primarily designed as a screening and triage tool; it is intended to augment, rather than replace, an ophthalmologist’s judgment. As ECSA-Net has shown moderate accuracies (i.e., between 60% and 70%), it also has an acknowledged need for an ophthalmologist to review all suspected abnormalities—ultimately, humans should be the sole decision-makers, and they must be fully aware of any limitations in the use of the algorithm. Future clinical deployment will require validating ECSA-Net in accordance with both the marking regulations. Any such validation will include conducting prospective trials to provide a performance comparison with a board-certified ophthalmologist, creating a mechanism to monitor model drift in clinical practice, and establishing a reporting system for adverse events. Lastly, thorough, ongoing post-market surveillance must be conducted over an extended period to ensure that ECSA-Net remains safe and effective in treating diverse patient populations.
Thus, the issue of privacy protection is stated in this body of work primarily as a deployment principle. Because of the compact nature of the model, devices with the lightweight ECSA-Net can perform local, on-device inference of retinal images and, thereby, do not require sending retinal images to third-party servers for processing. Although the de-identification of datasets, as done in this work, establishes an environment conducive to ethical experimentation, it is also important to minimize the amount of data sent or received and to promote secure, local image processing to ensure patient privacy in real-world clinical applications. The proposed lightweight design of ECSA-Net can also help promote this.
ECSA-Net is a new deep learning architecture designed to classify eye diseases from eye scan images. It is also efficient because ECSA-Net includes lightweight channel- and spatial-attention modules that enhance feature extraction, and it uses a hierarchical CNN backbone that maximizes parallel computation to maintain efficiency. The authors report that ECSA-Net achieves higher accuracy than multiple popular pre-trained architectures, achieving 60.00% and 69.92% on two benchmark datasets, respectively, with a total model parameter count of only 0.56 million. Additionally, the authors acknowledge the importance of addressing the ethical issues surrounding AI’s use in healthcare. This includes addressing algorithmic bias due to class imbalance, protecting patient privacy and ensuring data security during model development, providing interpretability and transparency in clinical decision support systems, and ensuring that AI systems are built in a way that enables responsible human-AI collaboration and complies with regulations. The authors acknowledge that more data from larger public datasets such as EyePACS, Messidor-2, or anti-ptosis suspension (APTOS) will help verify the generalization ability of ECSA-Net, but they also emphasize that the unique contribution of ECSA-Net lies in its ability to achieve competitive performance when trained on limited amounts of data, which is a common occurrence in clinical settings. The authors will focus their future work on validating ECSA-Net’s performance across multiple large-scale benchmark datasets to establish broader applicability. In addition to the limitations previously mentioned, the model’s moderate accuracy (60%–70%) is due to inherent challenges in the dataset; small, limited regional datasets lead to lower diversity and generalizability. Class imbalance can negatively affect performance on minority classes, while a single-label assumption limits detection to a single disease per image; hence, external validation was not conducted, and uncertainty quantification was not reported, both of which are critical for determining applicability in practice.
Future work will focus on increasing model generalizability through self-supervised learning methods, improving the detection of less prevalent diseases, and using Grad-CAM Attention Maps to enhance model visualization. Preliminary Analysis indicates that channel attention focuses on features learned in deeper layers, while spatial attention focuses on lesions. This work may be expanded by adding medical expert validation through a retrospective comparison of the peculiar diagnostic information provided by ophthalmologists, prospective clinical Testing in the clinic, and a usability assessment by practicing specialists. In the long run, ECSA-Net could lead to the integration of its products into the workflows of clinical institutions, as has recently been seen with the practical applications of AI in ophthalmology. Given the low computational cost of ECSA-Net, it can be deployed on clinic-level hardware, enabling point-of-care screening in low-resource areas. Future collaboration with healthcare institutions will be vitally important in developing a validated clinical model for clinical use. Although federated learning and other methods of distributed privacy-preserving training were not considered in the current study, they are relevant to multi-institutional applications where data cannot be consolidated; there are plans to implement a federated approach to train ECSA-Net across multiple clinical sites, and as such, to create associated privacy-preserving protocols so that the robustness of the model can be evaluated based on the heterogeneity of the data from different centers, while maintaining the clinical governance compliance requirements on clinical data.
Acknowledgement: The authors are grateful for the support of Princess Nourah bint Abdulrahman University and Northern Border University.
Funding Statement: Princess Nourah bint Abdulrahman University Researchers Supporting Project number (PNURSP2026R77), Princess Nourah bint Abdulrahman University, Riyadh, Saudi Arabia, the Deanship of Scientific Research at Northern Border University, Arar, Saudi Arabia, through the project number NBU-FFR-2026-2248-01.
Author Contributions: The authors confirm contribution to the paper as follows: study conception and design: Sara Tehsin, Inzamam Mashood Nasir, Muhammad John Abbas; data collection: Fadwa Alrowais, Reham Abualhamayel, Abdulsamad Ebrahim Yahya; analysis and interpretation of results: Sara Tehsin, Inzamam Mashood Nasir, Radwa Marzouk; draft manuscript preparation: Muhammad John Abbas, Fadwa Alrowais, Radwa Marzouk. All authors reviewed and approved the final version of the manuscript.
Availability of Data and Materials: The implementation of this work is available at https://github.com/imashoodnasir/Eye-Disease-Detection.
Ethics Approval: Not applicable.
Conflicts of Interest: The authors declare no conflicts of interest.
References
1. World Health Organization. Blindness and Vision Impairment [Internet]. 2023 [cited 2025 Sep 11]. Available from: https://www.who.int/news-room/fact-sheets/detail/blindness-and-visual-impairment. [Google Scholar]
2. World Health Organization. World Report on Vision [Internet]. 2019 [cited 2025 Sep 11]. Available from: https://www.who.int/publications/i/item/world-report-on-vision. [Google Scholar]
3. Marques AP, Ramke J, Cairns J, Butt T, Zhang JH, Muirhead D, et al. Global economic productivity losses from vision impairment and blindness. eClinicalMedicine. 2021;35:100852. doi:10.1016/j.eclinm.2021.100852. [Google Scholar] [PubMed] [CrossRef]
4. seva org. Pakistan Fact Sheet [Internet]. 2023 [cited 2025 Sep 11]. Available from: https://www.seva.org/pdf/Seva_Country_Fact_Sheets_Pakistan.pdf. [Google Scholar]
5. Attebo K, Mitchell P, Cumming R, BMath WS. Knowledge and beliefs about common eye diseases. Australian New Zealand J Ophthalmol. 1997;25(3):283–7. doi:10.1111/j.1442-9071.1997.tb01516.x. [Google Scholar] [PubMed] [CrossRef]
6. Munson MC, Plewman DL, Baumer KM, Henning R, Zahler CT, Kietzman AT, et al. Autonomous early detection of eye disease in childhood photographs. Sci Adv. 2019;5(10):eaax6363. doi:10.1126/sciadv.aax6363. [Google Scholar] [PubMed] [CrossRef]
7. Magan-Maganto M, Bejarano-Martin Á, Fernandez-Alvarez C, Narzisi A, Garcia-Primo P, Kawa R, et al. Early detection and intervention of ASD: a European overview. Brain Sci. 2017;7(12):159. doi:10.3390/brainsci7120159. [Google Scholar] [PubMed] [CrossRef]
8. Hassan B, Ahmed R, Li B, Hassan O, Hassan T. Automated retinal edema detection from fundus and optical coherence tomography scans. In: 2019 5th International Conference on Control, Automation and Robotics (ICCAR). Piscataway, NJ, USA: IEEE; 2022. p. 325–30. [Google Scholar]
9. Campbell JP, Ataer-Cansizoglu E, Bolon-Canedo V, Bozkurt A, Erdogmus D, Kalpathy-Cramer J, et al. Expert diagnosis of plus disease in retinopathy of prematurity from computer-based image analysis. JAMA Ophthalmology. 2016;134(6):651–7. doi:10.1001/jamaophthalmol.2016.0611. [Google Scholar] [PubMed] [CrossRef]
10. Bron AJ, Tomlinson A, Foulks GN, Pepose JS, Baudouin C, Geerling G, et al. Rethinking dry eye disease: a perspective on clinical implications. Ocul Surf. 2014;12(2):S1–S31. doi:10.1016/j.jtos.2014.02.002. [Google Scholar] [PubMed] [CrossRef]
11. Hassan B, Ahmed R, Li B, Noor A, Hassan Zu. A comprehensive study capturing vision loss burden in Pakistan (1990–2025findings from the Global Burden of Disease (GBD) 2017 study. PLoS One. 2019;14(5):e0216492. doi:10.1371/journal.pone.0216492. [Google Scholar] [PubMed] [CrossRef]
12. Ravudu M, Jain V, Kunda MMR. Review of image processing techniques for automatic detection of eye diseases. In: 2012 Sixth International Conference on Sensing Technology (ICST). Piscataway, NJ, USA: IEEE; 2024. p. 320–5. [Google Scholar]
13. Fernando T, Gammulle H, Denman S, Sridharan S, Fookes C. Deep learning for medical anomaly detection—a survey. ACM Comput Surv (CSUR). 2021;54(7):1–37. doi:10.1145/3464423. [Google Scholar] [CrossRef]
14. Marouf AA, Mottalib MM, Alhajj R, Rokne J, Jafarullah O. An efficient approach to predict eye diseases from symptoms using machine learning and ranker-based feature selection methods. Bioengineering. 2022;10(1):25. doi:10.3390/bioengineering10010025. [Google Scholar] [PubMed] [CrossRef]
15. Jogin M, Madhulika M, Divya G, Meghana R, Apoorva S. Feature extraction using convolution neural networks (CNN) and deep learning. In: 2018 3rd IEEE International Conference on Recent Trends in Electronics, Information and Communication Technology (RTEICT). Piscataway, NJ, USA: IEEE; 2023. p. 2319–23. [Google Scholar]
16. Alzamil ZS. Advancing eye disease assessment through deep learning: a comparative study with pre-trained models. Eng, Technol Appl Sci Res. 2024;14(3):14579–87. doi:10.48084/etasr.7294. [Google Scholar] [CrossRef]
17. Sarki R, Ahmed K, Wang H, Zhang Y, Ma J, Wang K. Image preprocessing in classification and identification of diabetic eye diseases. Data Sci Eng. 2021;6(4):455–71. doi:10.1007/s41019-021-00167-z. [Google Scholar] [PubMed] [CrossRef]
18. Ding N, Qin Y, Yang G, Wei F, Yang Z, Su Y, et al. Delta tuning: a comprehensive study of parameter efficient methods for pre-trained language models. arXiv:2203.06904. 2022. [Google Scholar]
19. Wen Y, Chen L, Deng Y, Zhou C. Rethinking pre-training on medical imaging. J Vis Commun Image Represent. 2021;78:103145. doi:10.1016/j.jvcir.2021.103145. [Google Scholar] [CrossRef]
20. Wang J, Zhu H, Wang SH, Zhang YD. A review of deep learning on medical image analysis. Mobile Netw Appl. 2021;26(1):351–80. doi:10.1007/s11036-020-01672-7. [Google Scholar] [CrossRef]
21. Chaudhari A, Shelke P, Thombare P, Sandbhor S. Cost-effective real-time eye disease detection and classification using deep learning techniques. In: 2024 15th International Conference on Computing Communication and Networking Technologies (ICCCNT). Piscataway, NJ, USA: IEEE; 2024. p. 1–8. [Google Scholar]
22. Rafay A, Asghar Z, Manzoor H, Hussain W. EyeCNN: exploring the potential of convolutional neural networks for identification of multiple eye diseases through retinal imagery. Int Ophthalmol. 2023;43(10):3569–86. doi:10.1007/s10792-023-02764-5. [Google Scholar] [PubMed] [CrossRef]
23. Siddique MAA, Ferdouse J, Habib MT, Mia MJ, Uddin MS. Convolutional neural network modeling for eye disease recognition. Int J Online Biomed Eng. 2022;18(9):115–30. doi:10.3991/ijoe.v18i09.29847. [Google Scholar] [CrossRef]
24. Bitto AK, Mahmud I. Multi categorical of common eye disease detect using convolutional neural network: a transfer learning approach. Bull Elect Eng Inform. 2022;11(4):2378–87. doi:10.11591/eei.v11i4.3834. [Google Scholar] [CrossRef]
25. Mayya V, Kulkarni U, Surya DK, Acharya UR. An empirical study of preprocessing techniques with convolutional neural networks for accurate detection of chronic ocular diseases using fundus images. Appl Intell. 2023;53(2):1548–66. doi:10.1007/s10489-022-03490-8. [Google Scholar] [PubMed] [CrossRef]
26. Sarki R, Ahmed K, Zhang Y. Early detection of diabetic eye disease through deep learning using fundus images. EAI Endorsed Trans Pervasive Health Technol. 2020;6(22):e1. doi:10.4108/eai.13-7-2018.164588. [Google Scholar] [CrossRef]
27. Muntaqim MZ, Smrity TA, Miah ASM, Kafi HM, Tamanna T, Al Farid F, et al. Eye disease detection enhancement using a multi-stage deep learning approach. IEEE Access. 2024;12(1):191393–407. doi:10.1109/access.2024.3476412. [Google Scholar] [CrossRef]
28. Albelaihi A, Ibrahim DM. DeepDiabetic: an identification system of diabetic eye diseases using deep neural networks. IEEE Access. 2024;12:10769–89. doi:10.1109/access.2024.3354854. [Google Scholar] [CrossRef]
29. Muthukannan P. Optimized convolution neural network based multiple eye disease detection. Comput Biol Med. 2022;146:105648. doi:10.1016/j.compbiomed.2022.105648. [Google Scholar] [PubMed] [CrossRef]
30. Newman JL, Brook Z, Cox SJ, Phillips JS. Towards the automatic detection of activities of daily living using eye-movement and accelerometer data with neural networks. Comput Biol Med. 2025;186:109607. doi:10.1016/j.compbiomed.2024.109607. [Google Scholar] [PubMed] [CrossRef]
31. Meedeniya D, Shyamalee T, Lim G, Yogarajah P. Glaucoma identification with retinal fundus images using deep learning: systematic review. Inform Med Unlocked. 2025;56:101644. doi:10.1016/j.imu.2025.101644. [Google Scholar] [CrossRef]
32. Neto A, Camara J, Cunha A. Evaluations of deep learning approaches for glaucoma screening using retinal images from mobile device. Sensors. 2022;22(4):1449. doi:10.3390/s22041449. [Google Scholar] [PubMed] [CrossRef]
33. Kim M, Han JC, Hyun SH, Janssens O, Van Hoecke S, Kee C, et al. Medinoid: computer-aided diagnosis and localization of glaucoma using deep learning. Appl Sci. 2019;9(15):3064. doi:10.3390/app9153064. [Google Scholar] [CrossRef]
34. Juneja M, Thakur S, Uniyal A, Wani A, Thakur N, Jindal P. Deep learning-based classification network for glaucoma in retinal images. Comput Elect Eng. 2022;101:108009. doi:10.1016/j.compeleceng.2022.108009. [Google Scholar] [CrossRef]
35. Deperlioglu O, Kose U, Gupta D, Khanna A, Giampaolo F, Fortino G. Explainable framework for Glaucoma diagnosis by image processing and convolutional neural network synergy: analysis with doctor evaluation. Future Generat Comput Syst. 2022;129:152–69. doi:10.1016/j.future.2021.11.018. [Google Scholar] [CrossRef]
36. Guo JM, Hsiao YT, Hsu WW, Seshathiri S, Lee JD, Luo YM, et al. A study of the interpretability of fundus analysis with deep learning-based approaches for glaucoma assessment. Electronics. 2023;12(9):2013. doi:10.3390/electronics12092013. [Google Scholar] [CrossRef]
37. Shoukat A, Akbar S, Hassan SA, Iqbal S, Mehmood A, Ilyas QM. Automatic diagnosis of glaucoma from retinal images using deep learning approach. Diagnostics. 2023;13(10):1738. doi:10.3390/diagnostics13101738. [Google Scholar] [PubMed] [CrossRef]
38. Shyamalee T, Meedeniya D, Lim G, Karunarathne M. Automated tool support for glaucoma identification with explainability using fundus images. IEEE Access. 2024;12:17290–307. doi:10.1109/access.2024.3359698. [Google Scholar] [CrossRef]
Cite This Article
 Copyright © 2026 The Author(s). Published by Tech Science Press.
This work is licensed under a Creative Commons Attribution 4.0 International License , which permits unrestricted use, distribution, and reproduction in any medium, provided the original work is properly cited.
 Downloads
 Citation Tools