
 Submit a Paper
 Propose a Special lssue
 Open Access
ARTICLE

A Digital Twin Approach for Agile Additive Manufacturing of Automotive Components
1 Department of Mechanical Engineering, National Taipei University of Technology, No. 1, Sec. 3, Zhongxiao East Rd., Taipei, Taiwan
2 High Value Biomaterials Research and Commercialization Center, National Taipei University of Technology, No. 1, Sec. 3, Zhongxiao East Rd., Taipei, Taiwan
3 Department of Mechanical Engineering, School of Bioscience, Technology, and Innovation, Atma Jaya Catholic University, Tangerang, Indonesia
4 Faculty of Mechanical Engineering and Ship Technology, Gdańsk University of Technology, Narutowicza 11/12, Gdańsk, Poland
5 College of Science and Engineering, Flinders University, Sturt Rd., Bedford Park, SA, Australia
* Corresponding Author: Cho-Pei Jiang. Email:
(This article belongs to the Special Issue: Design, Optimisation and Applications of Additive Manufacturing Technologies)
Computers, Materials & Continua 2026, 87(3), 38 https://doi.org/10.32604/cmc.2026.075197
Received 27 October 2025; Accepted 11 March 2026; Issue published 09 April 2026
 View Full Text
 Download PDF
Abstract
This study aims to develop a digital twin framework for fabricating automotive components through additive manufacturing (AM) technology. The framework comprises topology optimization (TO), finite element analysis (FEA), and fabrication analysis using Simufact Additive, which ensures the first-time-right fabrication of the component. Using TO-FEA, the component is designed with reduced overall weight without compromising the structural and functional performance. After the successful design of the component, it is analyzed for fabrication feasibility before undergoing the actual fabrication process. In the present study, an automotive flange fork is designed and fabricated through AM laser powder-bed fusion technology using Inconel-718 material. The optimized process parameters of 180 W laser power, 600 mm/s scan speed, 100 µm hatch spacing, and 30 µm layer thickness were used for the fabrication of the flange. The Simufact analysis revealed that the optimized design’s out-of-tolerance was reduced from 18% to 6.1%. In addition, the surface deviation of the optimized design was increased by 2%, compared to the original design. Furthermore, the optimized design showed better thermal characteristics, resulting in reduced residual stress and distortion. Precision analysis of the component showed the dimensional discrepancy between the 3D model and printed part to be less than 1%. The fabricated component showed it can withstand a torque of 300 Nm, which is generated in 4-wheel automobiles. The torque analysis successfully demonstrated the component’s performance, showing no signs of damage or cracks. This study shows the potential of integrating digital twins and additive manufacturing to promote Sustainable Development Goals (SDG) goals across many industries.Keywords
Abbreviations
| L-PBF | Laser powder bed fusion |
| UN | United Nations |
| SDG | Sustainable Development Goals |
| TO | Topology optimization |
| AM | Additive manufacturing |
| DoLS | Design of lattice structures |
| CAD | Computer-aided design |
| IN718 | Inconel 718 |
| FoS | Factor of safety |
| SEM | Scanning electron microscope |
| EDS | Energy dispersive spectroscopy |
| WEDM | Wire electric discharge machining |
| FEA | Finite Element Analysis |
The automobile sector has been distinguished by its significant innovations, sophistication, and intense competition that incorporates massive supply chains [1]. The direct annual growth rate of the automotive industry is expected to be approximately 1%–2% [2]. Due to its large workforce and substantial revenue, this industry plays a major role in global climate change. The per capita carbon footprint of the automotive industry is substantial due to production and associated supply-chain emissions. Thus, the United Nations (UN) has stepped up to resolve the issue by proposing sustainable development goals (SDGs) [3]. The sustainable manufacturing of automotive components emphasizes minimizing environmental impact while ensuring efficiency, quality, and cost-effectiveness. An essential element is material efficiency, which entails utilizing lightweight, high-mass-specific components to minimize vehicle weight and maximize fuel efficiency. Reducing energy consumption is a key focus, with businesses adopting more energy-efficient production methods and enhancing designs to decrease carbon emissions. In this regard, additive manufacturing (AM) technologies can produce optimized designs with efficient materials, thereby reducing carbon footprints. Thus, it is becoming one of the important assets of sustainable manufacturing technologies that adhere to the SDG policies [4]. In the automotive sector, AM is now regarded as more than a prototyping technology. The use of AM in the fabrication of automotive components is exponentially increasing due to its high mass-specific strength, lightweight, and sustainability. Bugatti, known for its luxury car manufacturing, has developed an AM-fabricated Ti-6Al-4V brake caliper for all future variants. BMW and Audi have also adopted AM-fabricated components, such as the window guide rail (i8 Roadster) and water adapter (W12 engine), in their respective automobiles [5].
The topology optimization (TO) approach has the potential to reduce material usage and energy consumption in the production of automotive components without compromising their intended performance [6–10]. However, traditional manufacturing routes have constrained the production of these optimized designs. Complex designs with interconnected pores and curvatures are either impossible or prohibitively expensive to produce using traditional manufacturing processes [11]. Integration of topology optimization (TO) and additive manufacturing (AM) can overcome these shortcomings [7,12,13]. Researchers worldwide have long studied the conceptual design approach of weight-restricted shape optimization [12,14–17]. This strategy enables the distribution of the material based on the locations of components that experience high stress [11]. Topology optimization is considered one of the major tools, along with the Design of Lattice Structures (DoLS), for fabricating lightweight, high-performance, customizable automotive components [12,13].
In the current study, topology optimization is applied to the flange fork, a crucial component of the automobile transmission. A flange fork is a component found in automotive drivetrains, particularly in universal joints (U-joints) and driveshafts. It acts as a link between various components of the vehicle’s drivetrain, transferring rotational force from the engine to the wheels while providing mobility and flexibility. The flange fork allows the driveshaft to accommodate minor angular and translational movements that arise as the vehicle traverses rough terrain or as the suspension oscillates vertically. This adaptability prevents components from seizing or failing under load [14]. Traditionally, flange forks were fabricated by hot forging. The hot metallic billet is transformed into a flange fork by applying stepwise pressure in several forging steps using a die. Because the forging operation occurs at elevated temperatures, the forging dies often undergo extensive wear. Moreover, thermal fatigue cracks and high-temperature deformation often led to the replacement of forging dies. This includes overhead charges and substantial energy requirements for maintaining high temperatures. According to Lange et al., repeated wear cycles account for 70% of failures in dies used in hot-forging processes [15]. Die wear results in folding of the fabricated components, striations, a lack of material filling in sharp or intricate corners, and pre-forging die scrap [16]. Luo et al. reported the phenomenon of thermal softening in forging dies due to repeated heating and cooling cycles [17]. Moreover, die geometry plays an important role in wear, thereby restricting the design’s freedom [18]. Zheng et al. conducted die wear analysis of the flange fork and reported that the forged component exhibited a worn surface due to adhesive, abrasive, and oxidative wear [16]. Such a surface defect reduces the component’s service life and may increase the risk of failure under extreme operating conditions.
This study emphasizes a unidirectional digital twin framework in which TO, FEA, and fabrication analyses were used in parallel to optimize the design and ensure safe stress levels and first-time-right fabrication. The interconnected feedback provides substantial information between stages, enabling appropriate modifications. It is important to note that the present work employs a predictive, pre-fabrication digital twin rather than a real-time, in-situ monitoring digital twin. In digital twin classifications, such a model is often referred to as an offline or digital shadow, where high-fidelity simulations (TO-FEA-Simufact in this case) are used to forecast manufacturability, thermal behavior, deformation, and performance prior to physical fabrication [19]. Although this framework does not yet incorporate real-time sensor feedback such as melt-pool temperature or powder-bed density, it provides the essential predictive capability required for “first-time-right” additive manufacturing. Future work will extend this framework toward a closed-loop digital twin with real-time monitoring.
Specifically, this study aims to reduce the mass of the automotive component, namely the flange fork, while maintaining its static torque-carrying capacity. This is achieved by the collective results of TO and FEA. Furthermore, manufacturability is predicted using Simufact Additive software to ensure the component’s accuracy and precision. Furthermore, the digital twin’s capability is validated through experimental fabrication of the component, followed by precision analysis and static torque assessment. By establishing a simulation-driven workflow that enables “first-time-right” fabrication, this work demonstrates how computational optimization and process modeling can accelerate the development of lightweight designs for metal AM automotive applications.
The manuscript is organized into 5 major sections, with the first section highlighting the need to implement the Sustainable Development Goals in the automotive sector and the shortcomings of the traditional hot forging process. Section 2 finite-element methodology, powder preparation, and fabrication are discussed. Section 3 deals with the detailed analysis of the results and discussions, followed by conclusions in Section 4. Section 5 highlights the limitations of the current study and outlines directions for future research.
Fig. 1 shows the overall methodology implemented in the study. The digital twin integrated topology optimization, finite element analysis, and Simufact Additive software to optimize the weight and fabrication of the automotive flange fork. The CAD model was designed based on the description provided by Zheng et al. [16] and optimized using the results of topology optimization and finite element analysis. Following the design optimization, the model was imported into Simufact Additive software to evaluate the fabrication optimization. After the process parameters and fabrication were assessed, the component was fabricated using laser powder-bed fusion.
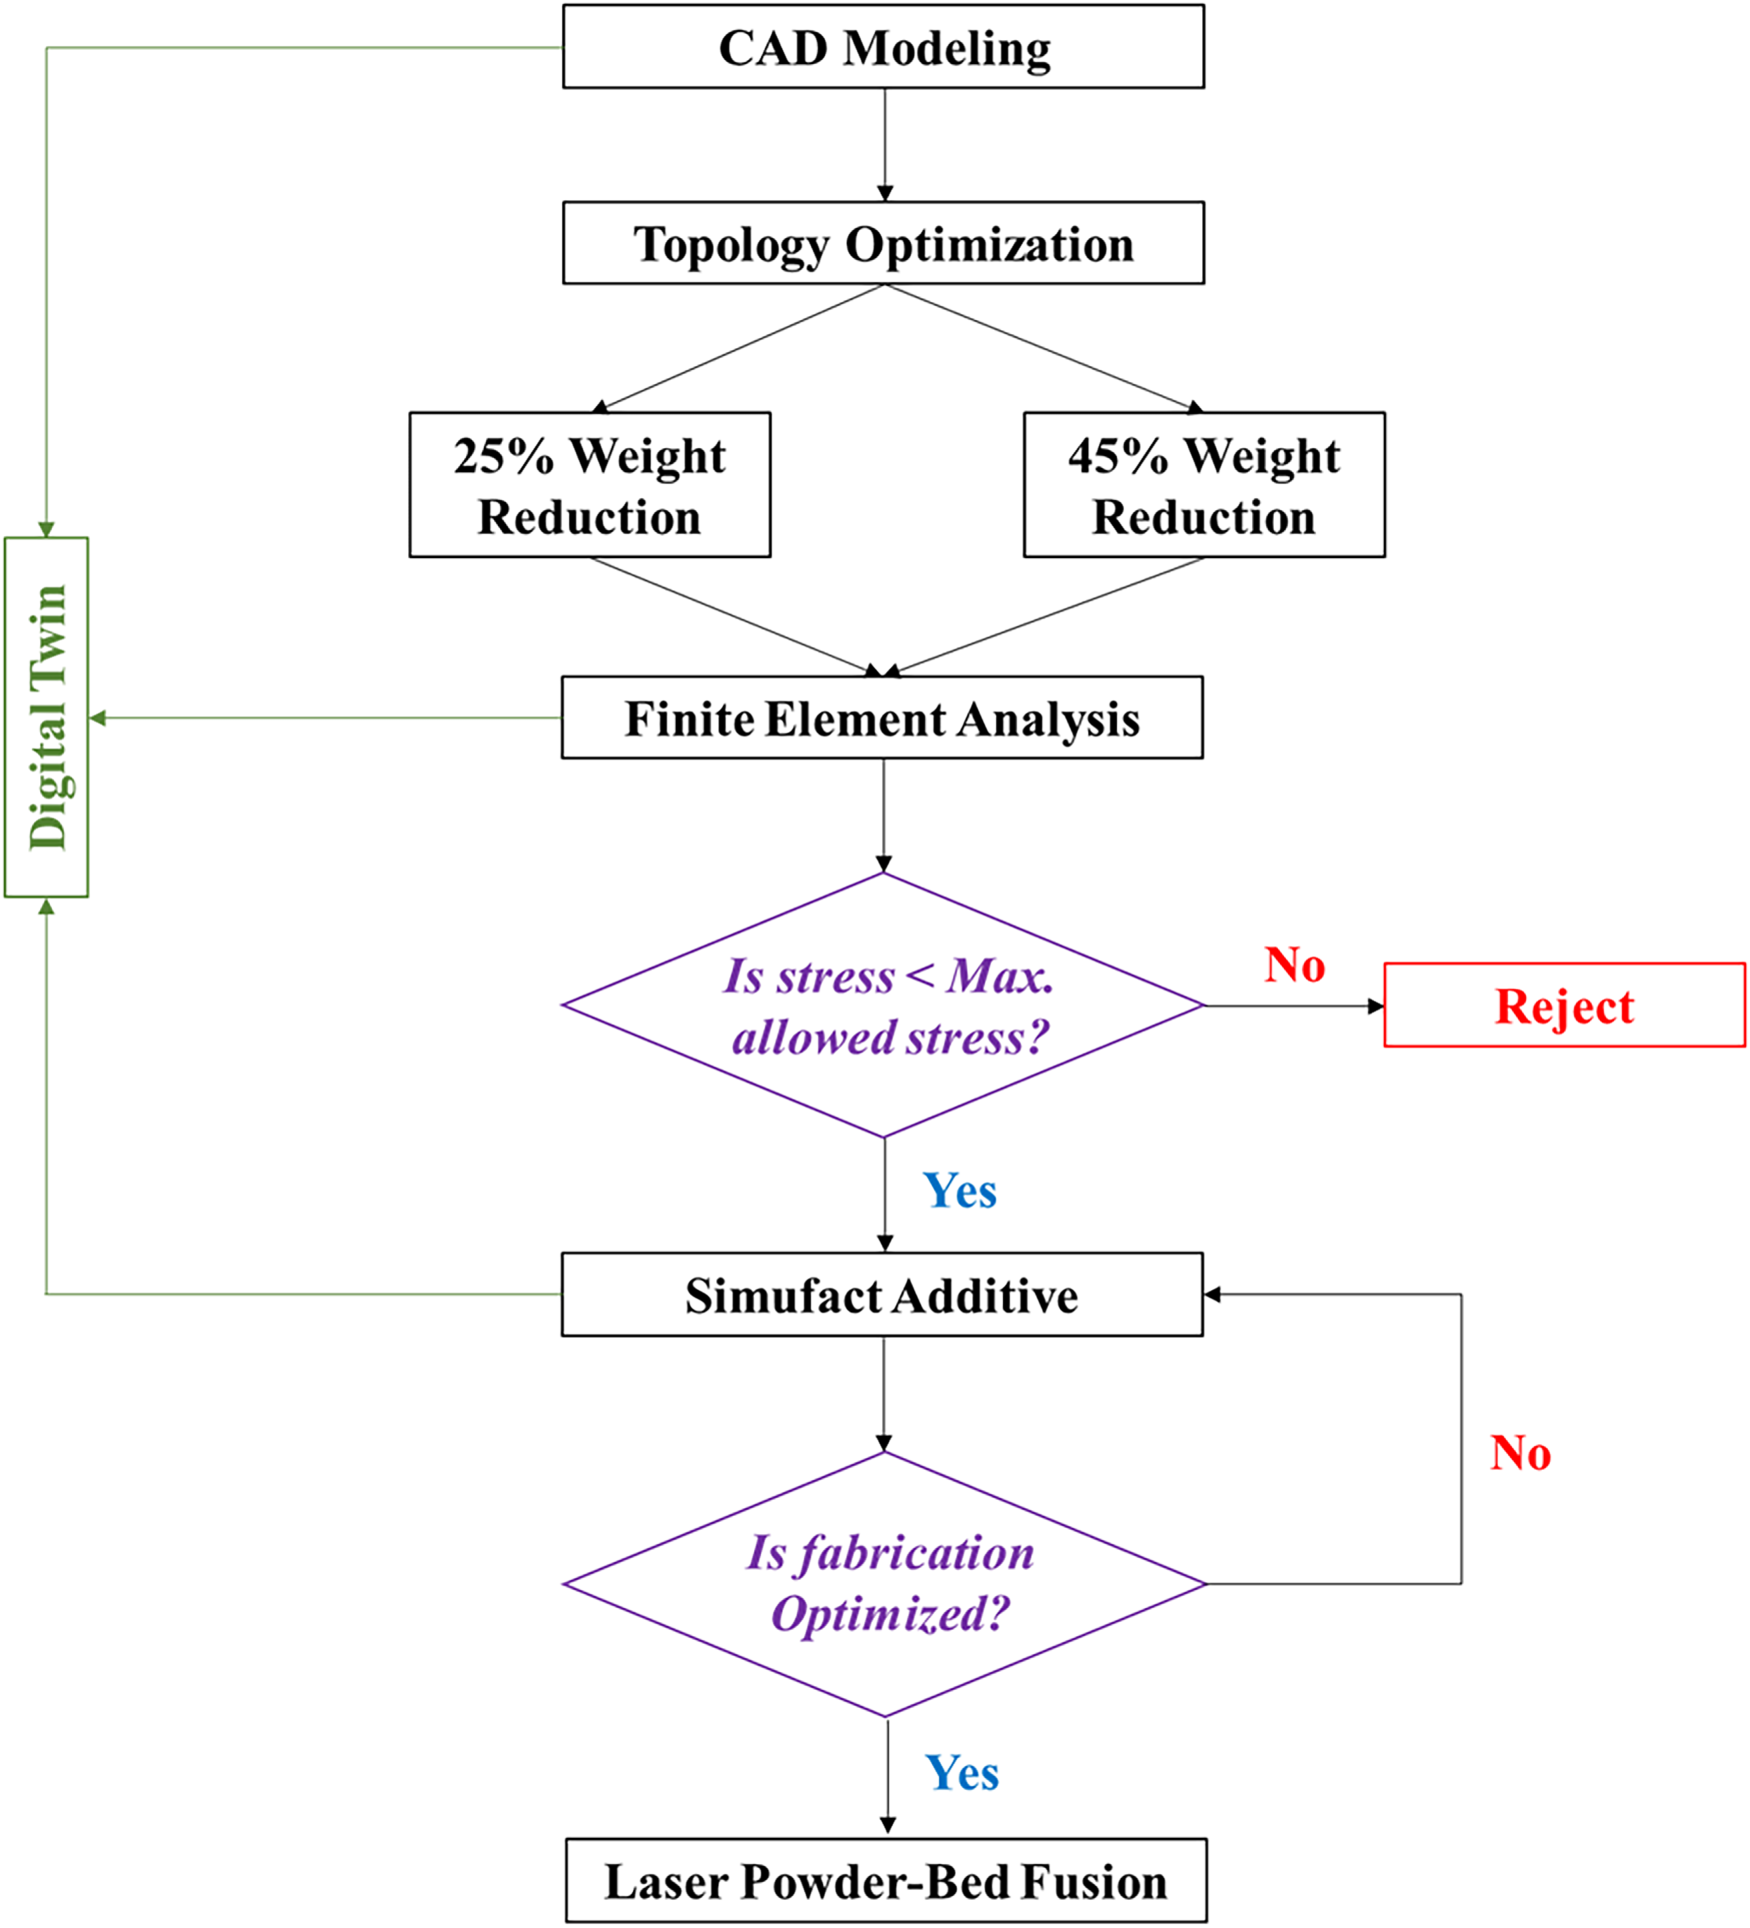
Figure 1: The overall methodology implemented in the study.
SolidWorks® software was used to design the CAD model of the automotive flange fork. The CAD model of the automotive flange was prepared based on the description given by Zheng et al. [16]. Fig. 2a–d represents the front view, side view, top view, and isometric view of the designed flange fork, respectively, along with various dimensions.
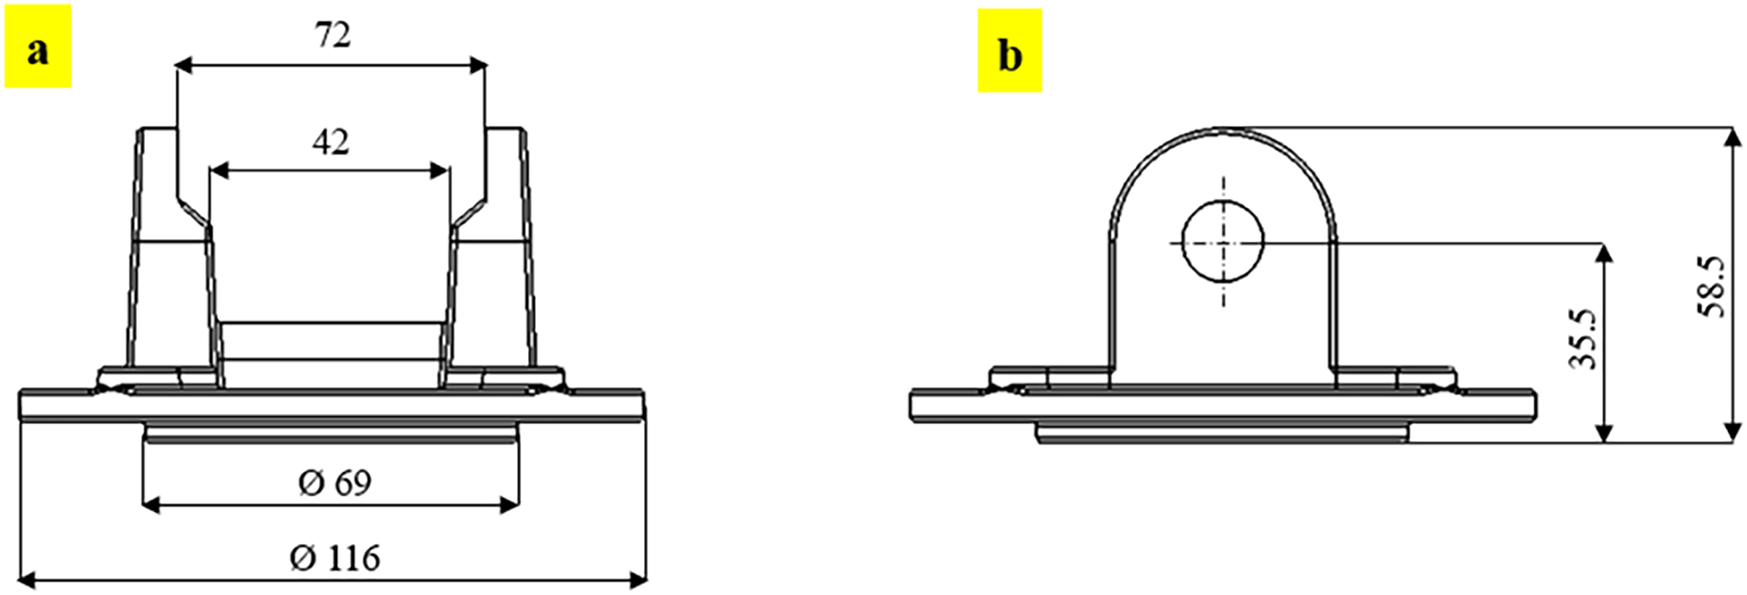
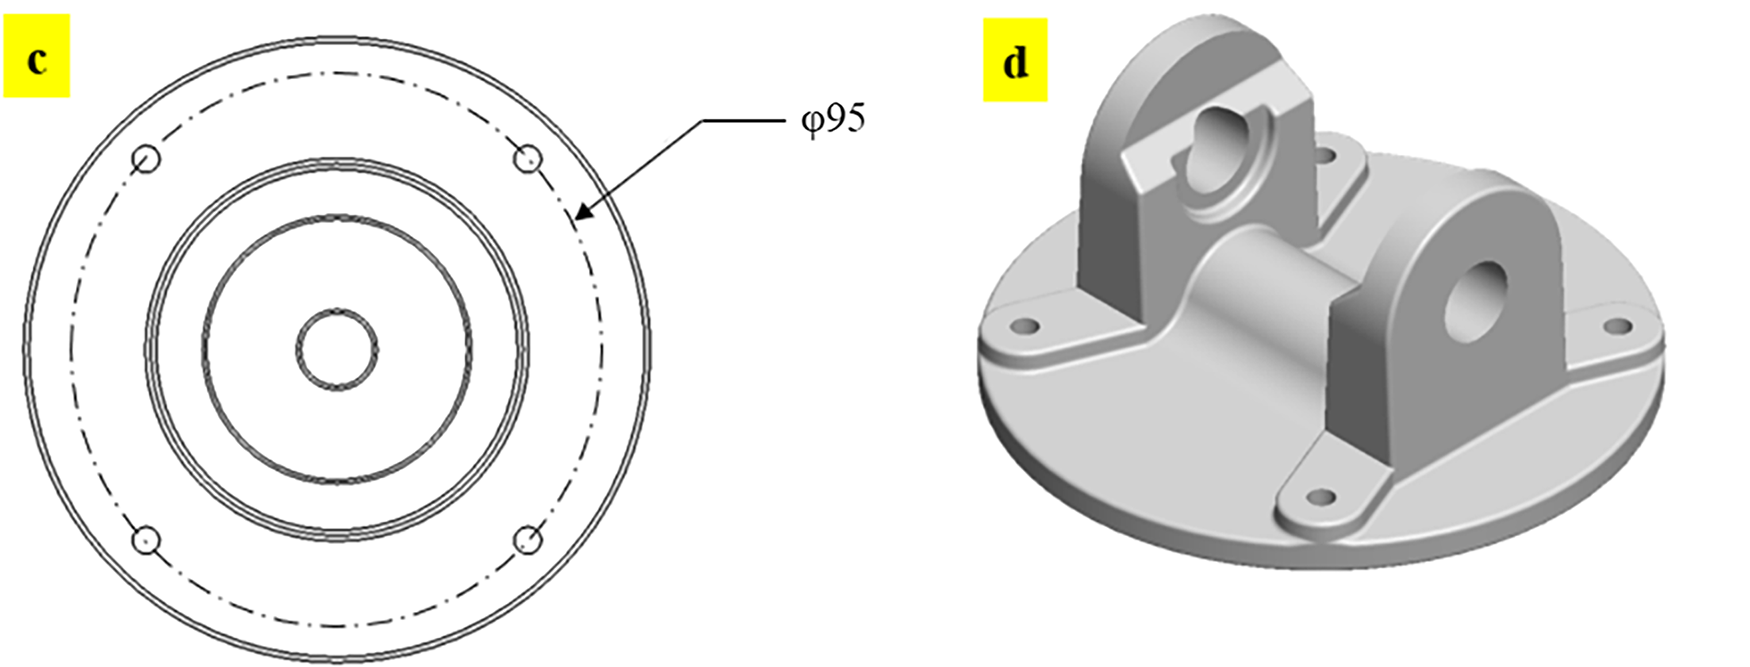
Figure 2: The design of the flange fork: (a) front view, (b) side view, (c) top view, and (d) isometric view [all the dimensions are in mm].
Fabrication analysis was conducted using Simufact Additive© (Hexagon, Sweden) to evaluate the powder bed fusion process for both the optimized design and the original flange fork models. This simulation allows for a detailed understanding of the AM process. It provides extensive information on heat distribution, process-induced stresses and distortions, and potential areas of structural weakness that may arise during fabrication. Before starting the simulation, several preprocessing steps are required, including importing the .stl file, selecting materials, defining process parameters, selecting support structures, and setting the printing orientation. The model material is defined as IN-718, and its properties are detailed in Table 1.
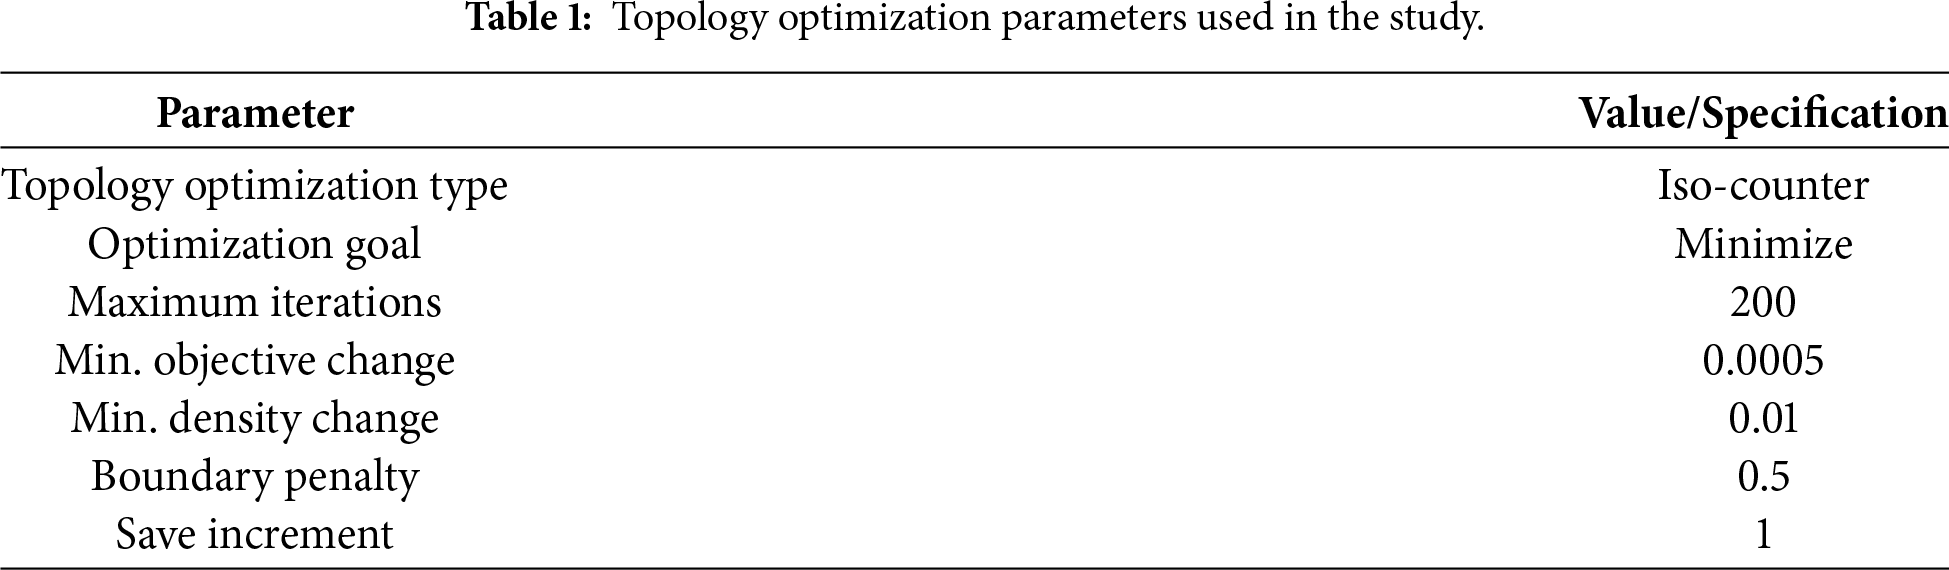
The CAD model shown in Fig. 2 was imported from the SolidWorks® platform to the nTop® platform. The weight-optimization function was employed, which involves a numerical design operation to minimize the solid volume. The process begins by generating a grid, into which the CAD part was imported into the nTop platform using the ‘Import part block’. The subsequent step after importing is the application of the ‘Remesh Surface block’. This step aims to correct defects in the mesh, reduce the number of elements, and adjust the mesh density spatially. The refined mesh was then inserted into the ‘Volume Mesh block’, sized at 1 mm to facilitate subsequent detailed analysis. Upon configuring the shape to a triangle, the volume mesh generation begins. The solid mesh was then converted to a finite element mesh to establish the basic part for TO. Two opposing forces of 4615.4 N each are applied as the force boundary condition. These two opposing forces of 4615.4 N each exert a torque of 300 Nm on the body. The maximum torque of 300 Nm is used in this research, based on the torque experienced by the actual cars [20]. The volume fraction is chosen as the design response, thereby defining the optimization objective. The detailed topology optimization parameters are outlined in Table 1.
Given the objective, the function evaluates the optimal solid variant that achieves the objective while minimizing volume. Eq. (1) displays the weight optimization function [21,22]:
where, ‘
The initial optimization was performed using arbitrary volume fractions of 25% and 45%. The designs’ ability to withstand 300 Nm of torque was subsequently evaluated using FEA. The rationale for selecting ~25% and ~45% is to provide insight into the safe range of weight reduction that is achievable without compromising the objectives (i.e., withstanding torque). The volume constraints used are as shown in Eq. (2) [21].
where ‘
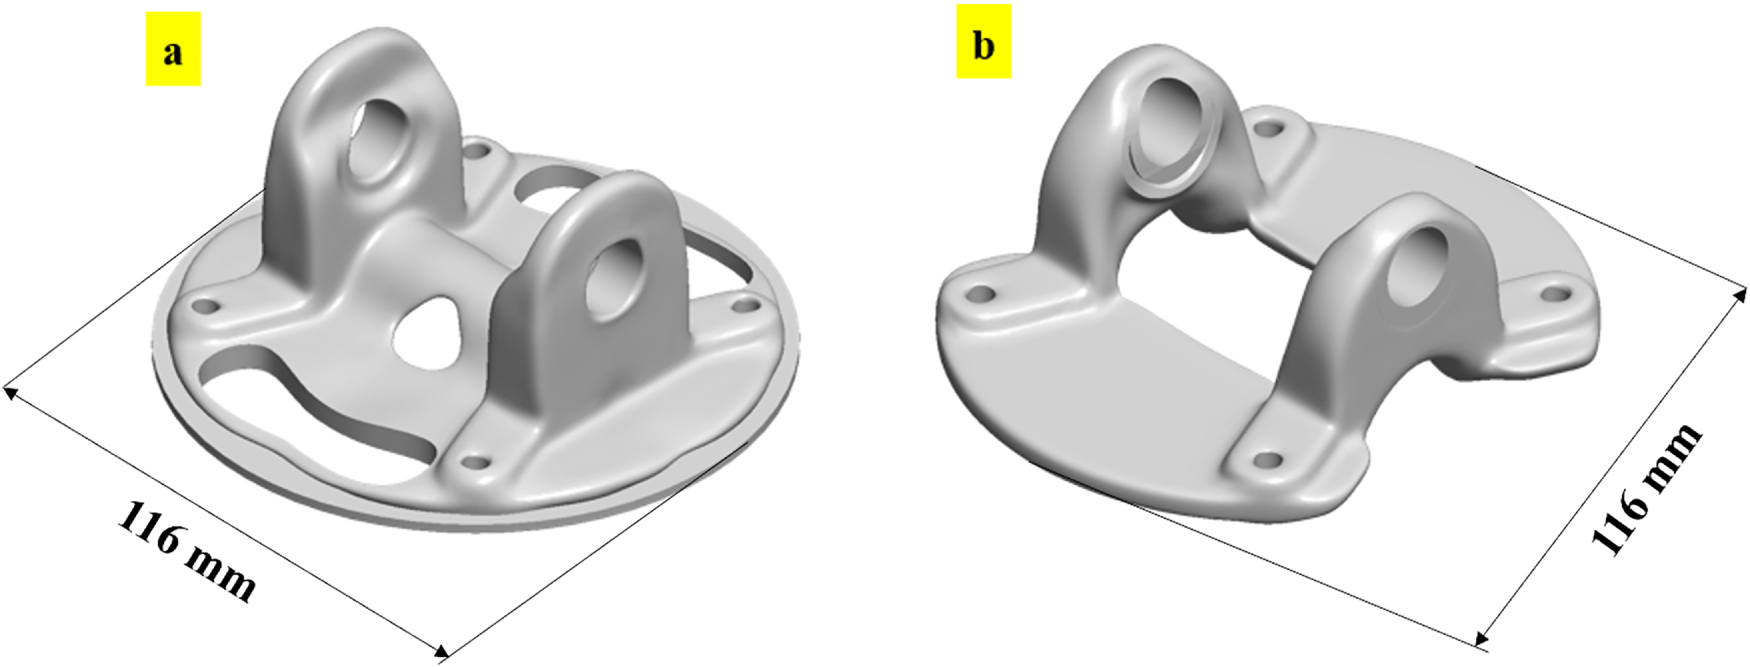
Figure 3: Optimization of flange fork: (a) design 1 and (b) design 2.
2.4 Finite Element Analysis (FEA)
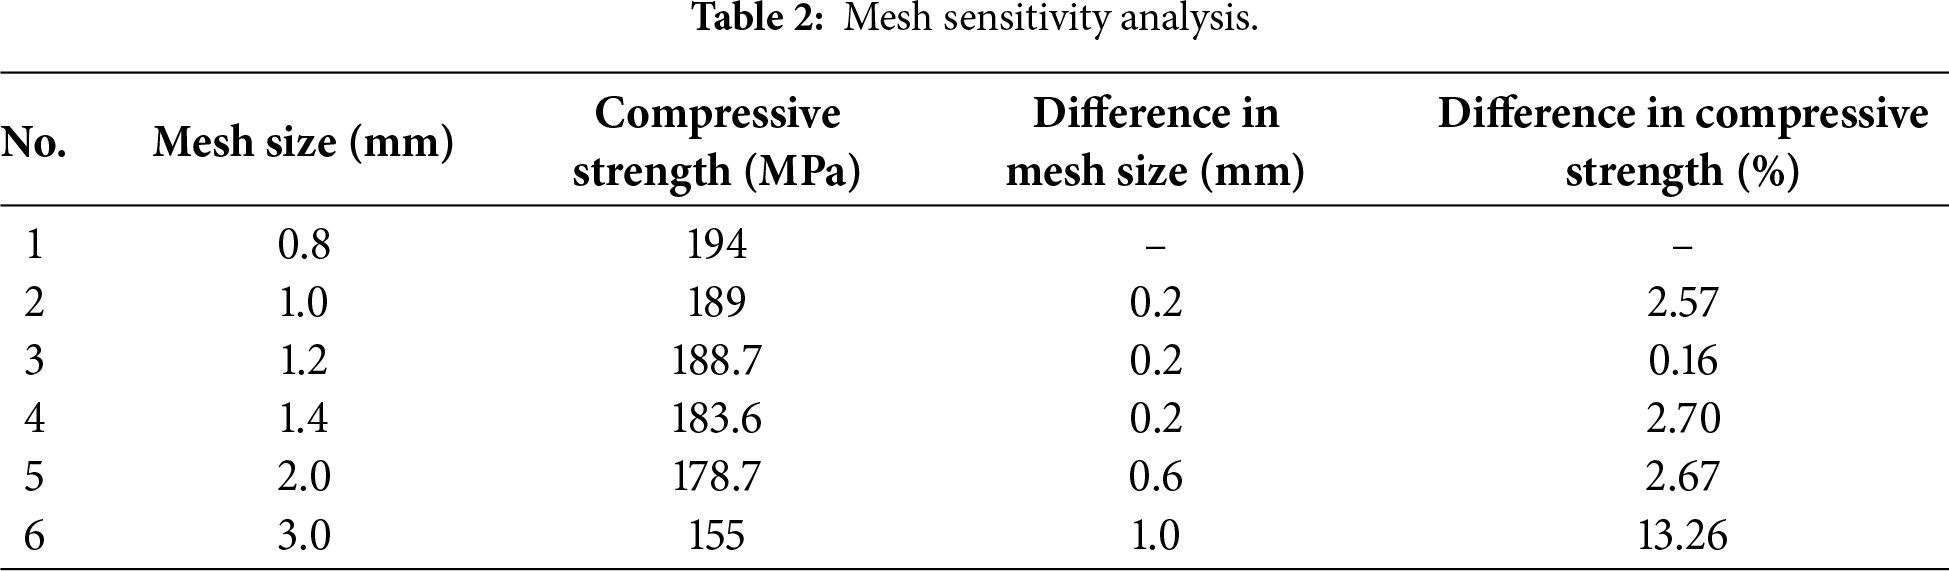
In this study, FEA was conducted since FEA gives more accurate results than the classical method [23]. The FEA analysis was conducted using the static structure module of ANSYS Workbench. The stepwise analysis would help evaluate the flange fork’s resistance under maximum loading conditions. The CAD files of the two optimal designs were imported from the nTop platform to ANSYS® Workbench. The next step in the FEA involves establishing the mesh, with a mesh size of 1 mm. This mesh size was selected based on the mesh sensitivity analysis outlined in Table 2. The mesh sensitivity analysis was performed by varying the mesh size from 0.8 to 3 mm for Design-1, as shown in Fig. 3a. The stress on the shaft has been analyzed to assess the mesh sensitivity. From Table 2, it can be observed that the stress variation becomes considerable only at the mesh size of 3 mm. Nevertheless, a mesh size of 1 mm was used in this study because the computational cost was not significantly high. Moreover, a smaller mesh size improved the accuracy of the prediction.
The mesh structure of the model comprises approximately 32,000 linear tetrahedral elements and 122,000 nodes. The optimal designs are assigned with the material properties of the IN718 superalloy, as shown in Table 3 [24]. The dog-bone samples were fabricated with varying orientations, and the corresponding average properties were examined as a function of process parameters in Section 3.3. The stress analysis was performed using the maximum von Mises equivalent stress criterion. The von Mises stress criterion was selected because IN718 is a ductile metallic alloy, and its yielding behavior under multiaxial loading is governed by distortional energy rather than normal stress [25].
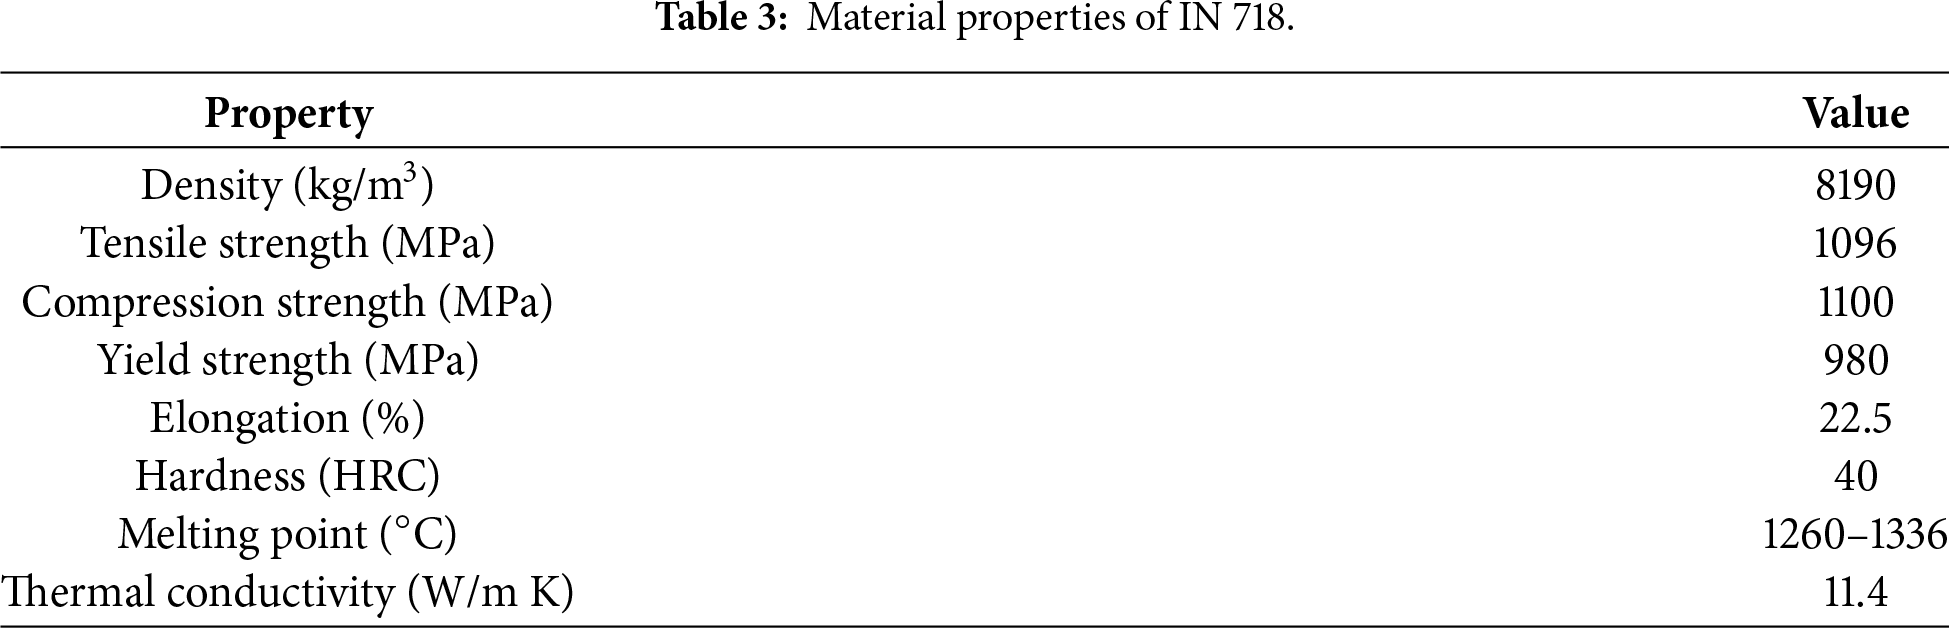
Fig. 4a,b demonstrates that the flange fork comprises two sets of holes, namely the upper and lower ones. The numerical analysis consists of two conditions as follows:
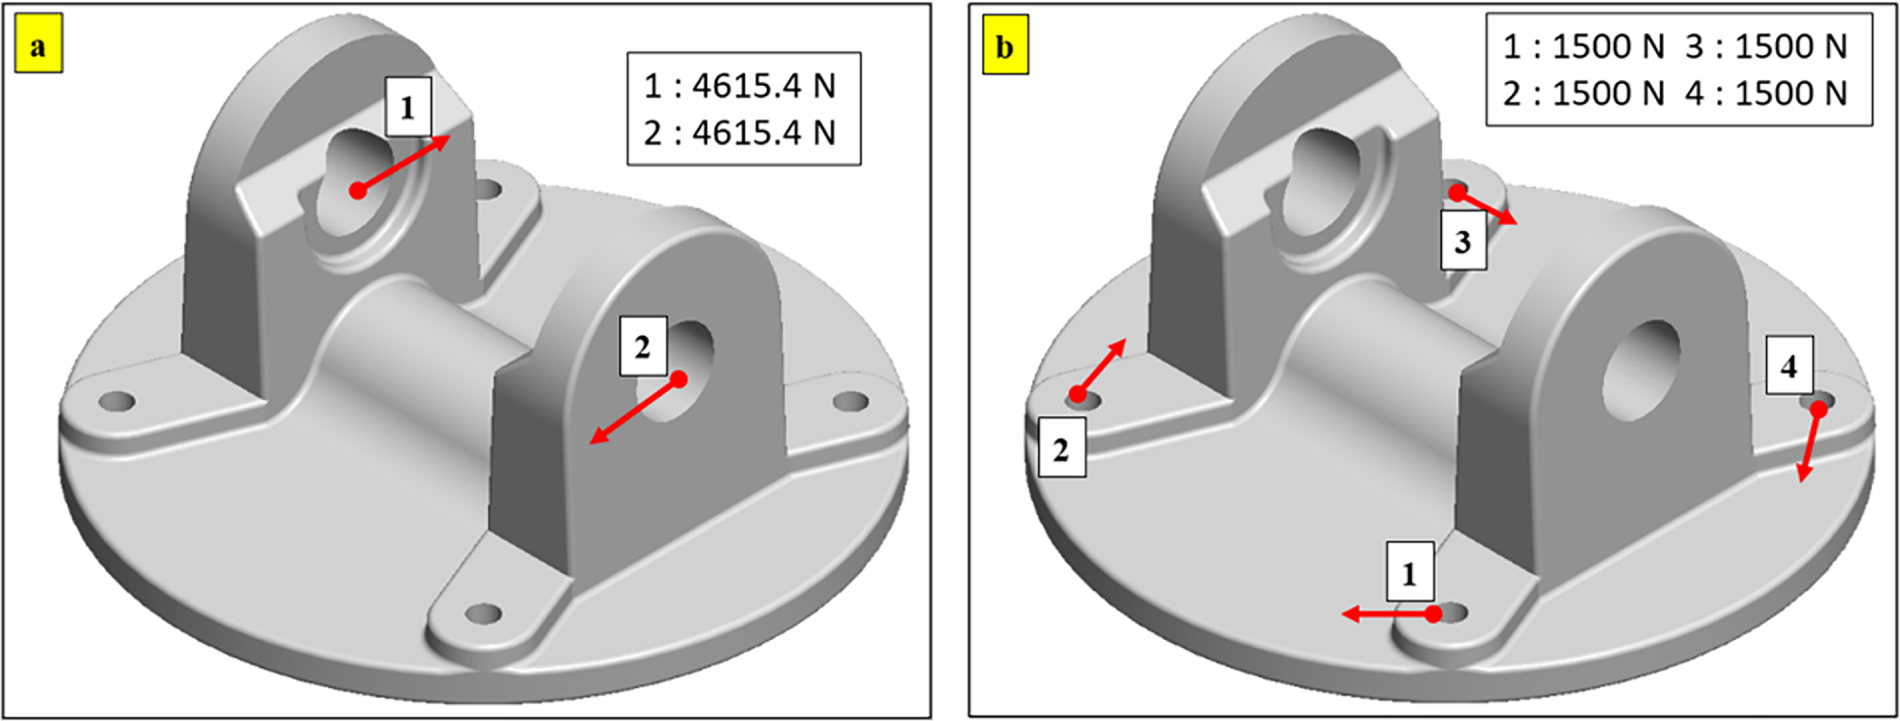
Figure 4: Loading conditions on the flange fork: (a) as per case 1, wherein the load is transferred from the shaft, and (b) as per case 2, wherein the load is transferred to the chassis.
(1) Case 1: The upper two circular holes bear the load of the shaft, and the lower four circular holes are fixed to it, as shown in Fig. 4a.
(2) Case 2: The upper two circular holes are fixed, and the four lower circular holes will be loaded to simulate the force on the chassis as shown in Fig. 4b.
Considering the torque (T) of 300 Nm, the force (F) on each of the holes is calculated using Eq. (3) [26].
where ‘
(1) Case 1: The force exerted on each of the upper holes = 4615.4 N, as shown in Fig. 4a.
(2) Case 2: The force exerted on each of the lower holes = 1500 N, as shown in Fig. 4b.
It is important to include the factor of safety (FoS) as a fail-safe design criterion. Eq. (4) represents the calculation for FoS. The FoS of 2.5 is considered for the flange fork [16,27].
where ‘
The Inconel 718 powder required for the laser powder bed fusion (L-PBF) process is procured from Chung Yo Materials Co., Ltd., Kaohsiung City, Taiwan. The selection of this material was based on its advantages at elevated temperatures and its corrosion resistance. Fig. 5a shows the micrograph of IN 718 captured by Field Emission Scanning Electron Micrography (FE-SEM JSM-7610F, Tokyo, Japan). Fig. 5b shows the powder particle size distribution obtained using ImageJ software (ImageJ version 1.52n, NIH and LOCI, USA).
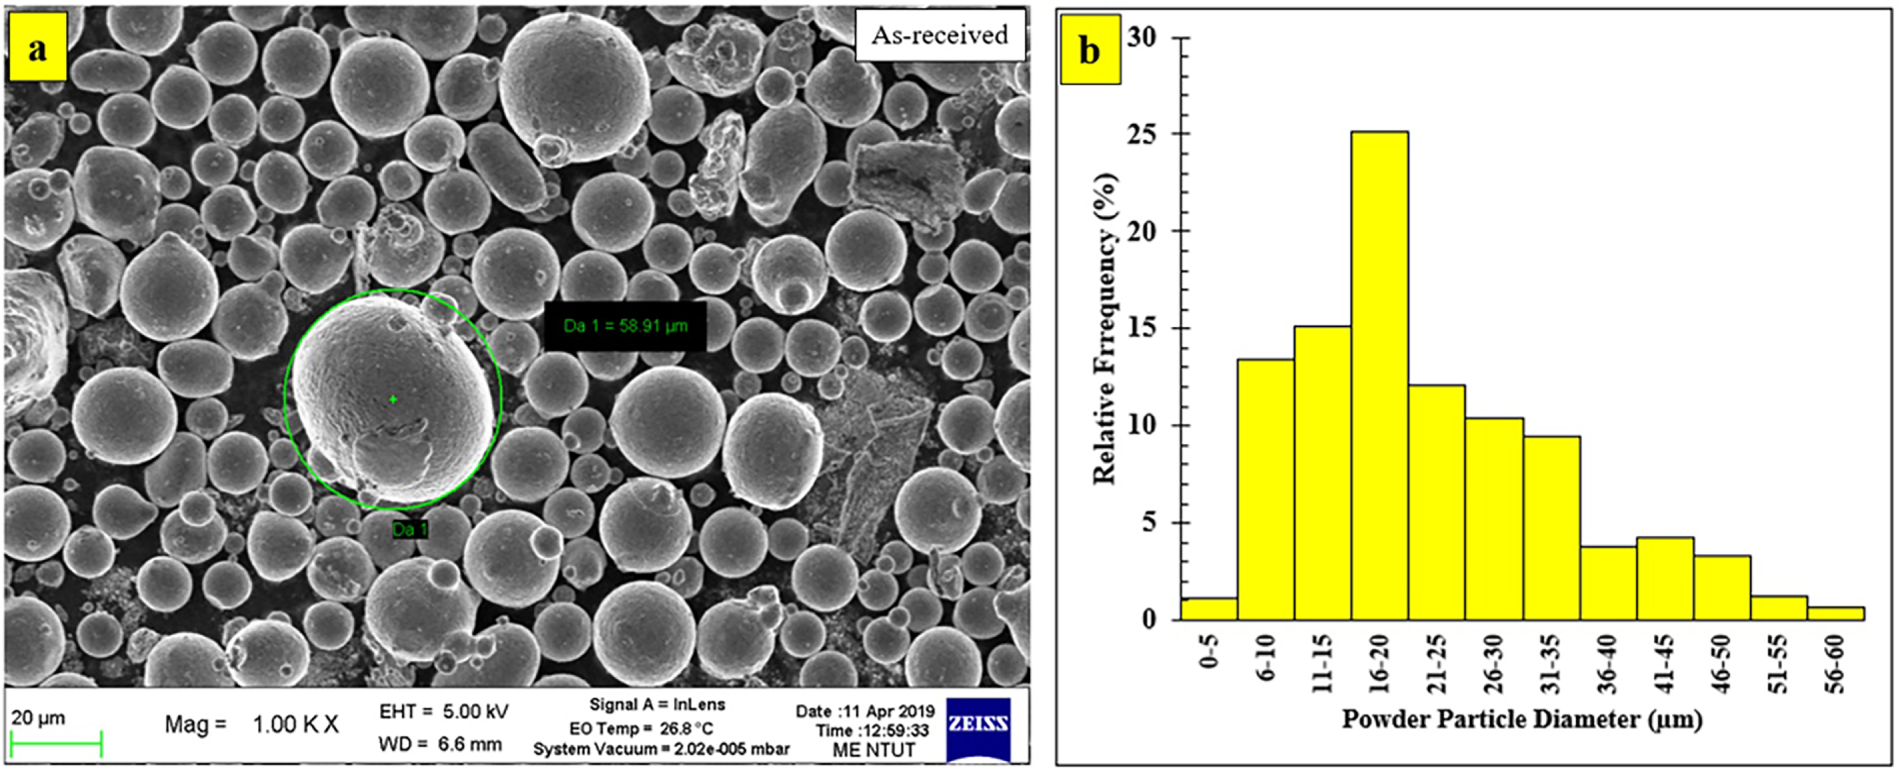
Figure 5: Micrograph of IN 718 powder (a) morphology of powder captured by SEM (b) powder size distribution analysis.
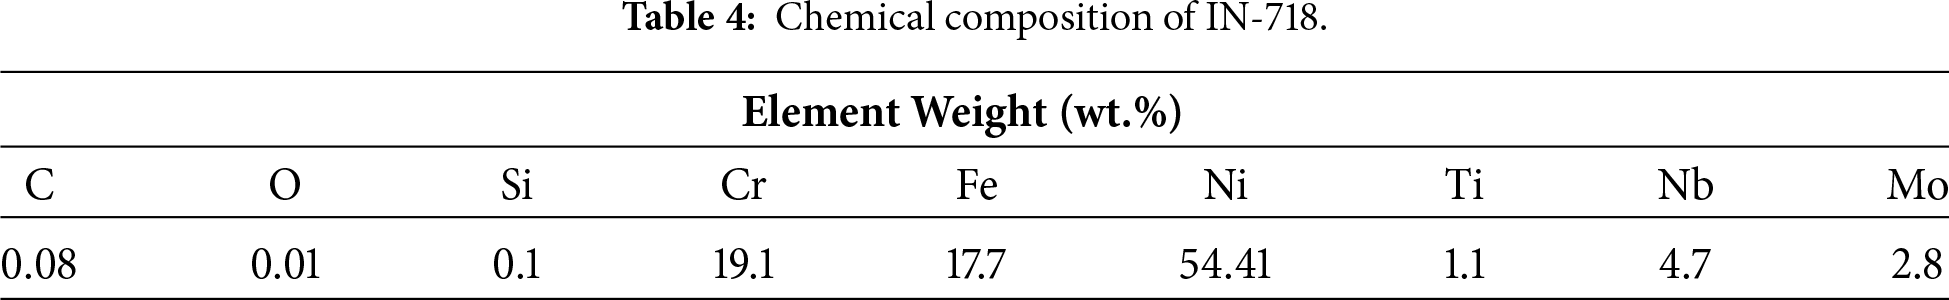
IN-718 powder has a critical chemical composition that improves corrosion and oxidation resistance at high temperatures. The two main components in these properties are nickel (Ni) and chromium (Cr), as listed in Table 4. The chemical composition data were obtained using Energy-Dispersive X-ray Spectroscopy (EDS). The presence of a significant amount of nickel provides strong corrosion resistance, while chromium contributes to oxidation resistance at high temperatures. The combination of the right proportions of these two elements in IN-718 powder provides the material with advantages for high-temperature applications. The powder was sieved through a 50 µm mesh to obtain a uniform particle size.
2.6 Laser Powder Bed Fusion (L-PBF) Process
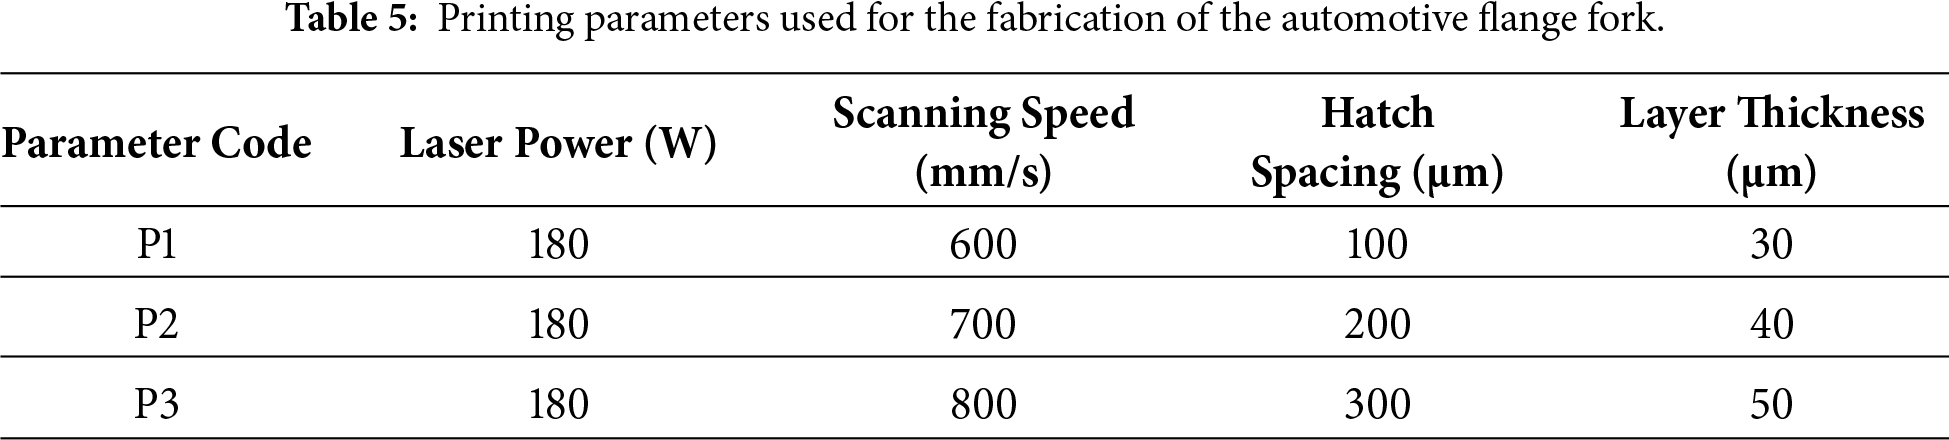
The experimental specimens were fabricated using a laser powder bed fusion (L-PBF) 3D printer (AMP-160, Tongtai Co., Kaohsiung, Taiwan). The specimen model was imported into Materialise software (Magics 23.1, Leuven, Belgium) to slice the 3D model into two-dimensional layers with the parameters listed in Table 5. The slicing software was instrumental in generating the scanning path, which was based on specified printing parameter values. This ensured precise, controlled layer-by-layer fabrication during additive manufacturing.
2.6.1 Precision Fabrication through Process Parameter Optimization
In this study, several variable parameters were used to obtain optimal settings. Four major variable parameters (i.e., laser power, scan speed, hatch spacing, and layer thickness) were considered to evaluate the precision of the fabricated flange fork. Based on previous research, a laser power of 180 W was regarded as the most optimal parameter for the laser [28,29]. Thus, the laser power was kept constant. The other variables, such as scanning speed, hatch spacing, and layer thickness, were evaluated to obtain high precision and dimensional accuracy. Optimized scanning speed, hatch spacing, and layer thickness would limit the residual stress generation, warpage, and distortion, thereby providing high precision of the fabricated component. Table 5 illustrates parameter codes for each set of process parameters. The range of each parameter is decided based on the literature [28].
The laser scanning strategy was developed using a zigzag motion pattern. The fabrication process was carried out layer by layer, with settings that varied the scanning angle for each additional layer. Specifically, the scanning angle was rotated by 67.5° before the start of each new layer. This approach established an effective, coordinated scanning pattern for precise structure formation, with enhanced interlayer bonding and reduced anisotropy [29]. Low-vacuum conditions were maintained within the fabrication chamber. This condition ensured that the oxygen concentration remained low, specifically less than 10,000 ppm. Maintaining a controlled vacuum and oxygen concentration is key to ensuring the success of the process. Low oxygen level reduces the potential for contamination or oxidation during the printing process.
2.6.2 Selection of Optimal Process Parameters through Tensile Test
Five tensile specimens were fabricated using different parameters to identify the optimal settings. The testing was conducted using a universal testing machine (CY-20, Chun-Yen Co., Taiwan) to determine these optimal parameters. The tensile test was designed to simulate the forces experienced during flange fork use. The ASTM E8 standard was employed for this testing [24]. Fig. 6 illustrates the test specimen of the tensile test.
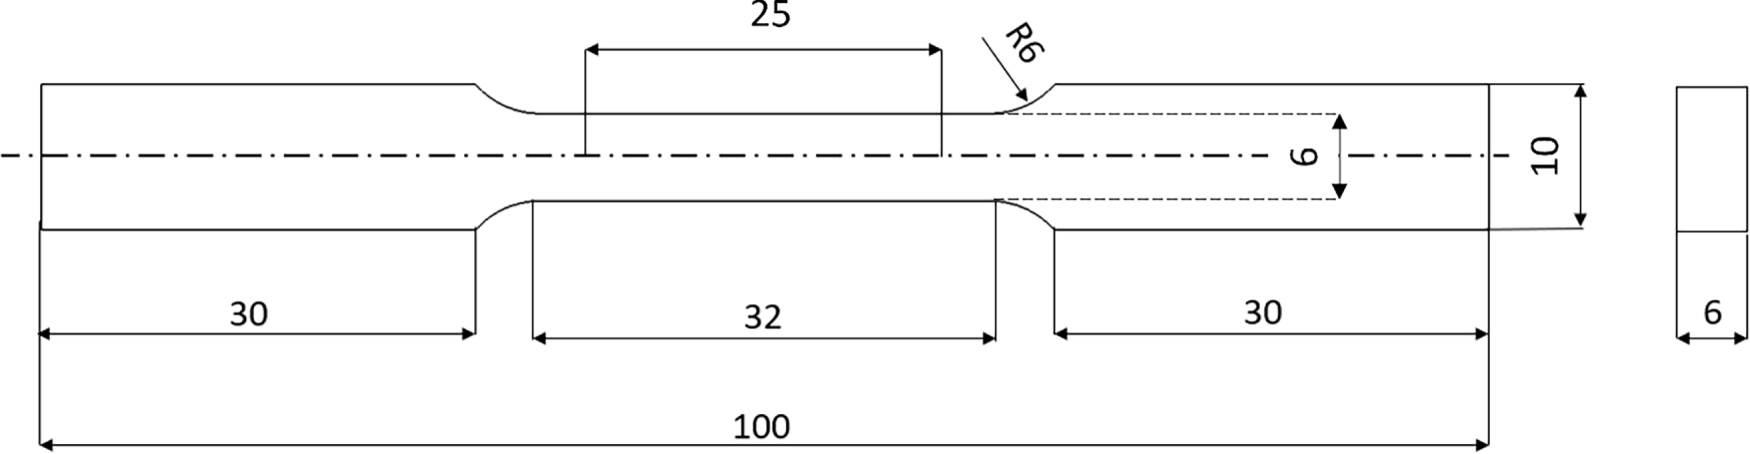
Figure 6: Tensile test specimen (all the dimensions are in mm).
Once the printing parameters were optimized, the precision of the fabricated flange fork was evaluated by examining dimensional discrepancies at critical locations. The hatch spacing was also analyzed using scanning electron microscopy (Hitachi SU-70 field emission SEM).
3.1 Optimized Designs of Flange Fork
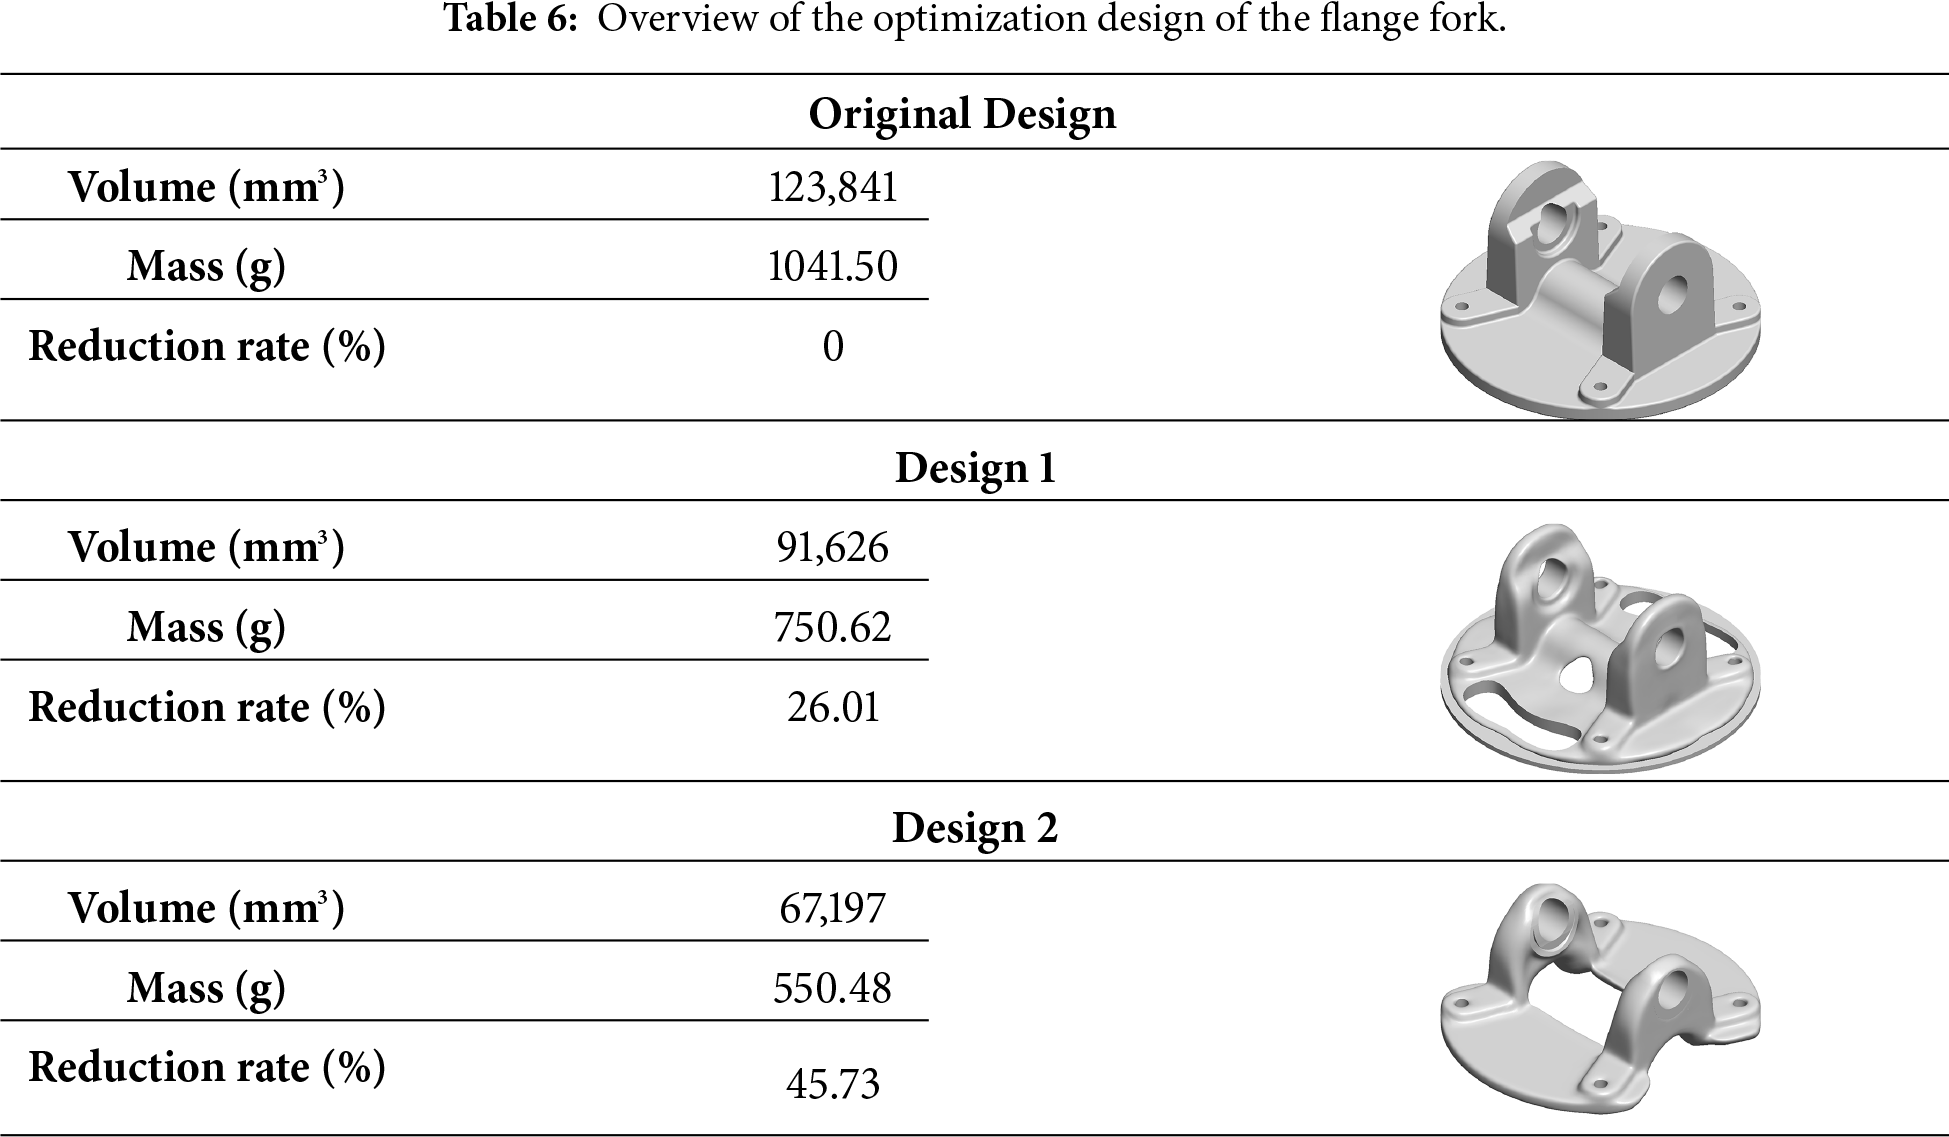
Two optimized designs were developed with the volume fraction as the primary objective. The first design achieved a 26.01% (~25%) volume reduction and a 27.92% mass reduction. In contrast, the second design achieved a 45.73% (~45%) reduction in volume and a 47.14% reduction in mass. Table 6 compares the volume and mass of the flange fork before and after optimization. The results obtained reflect the effectiveness of the optimization techniques in identifying more efficient structures. Reducing the mass can provide significant benefits in terms of implementing SDGs without compromising the overall performance [30].
3.2 Force Analysis through FEA
The compressive stress exerted on the shaft (as per case 1 in Section 2.3) and on the chassis (as per case 2 in Section 2.3) was analyzed using FEA. Fig. 7 shows the result of compressive stress on the shaft and chassis in different design considerations of the flange fork. Fig. 7 also highlights the maximum allowable stress in the component, considering the factor of safety (FoS) of 2.5. The original and optimized designs generate stresses within the FoS limit, thereby making them fail-safe. Moreover, the analysis results show a 16.51% reduction in shaft stress for design 1 compared with the original design. However, the stress on the chassis increased by 72.29% in design 1 relative to the original design.
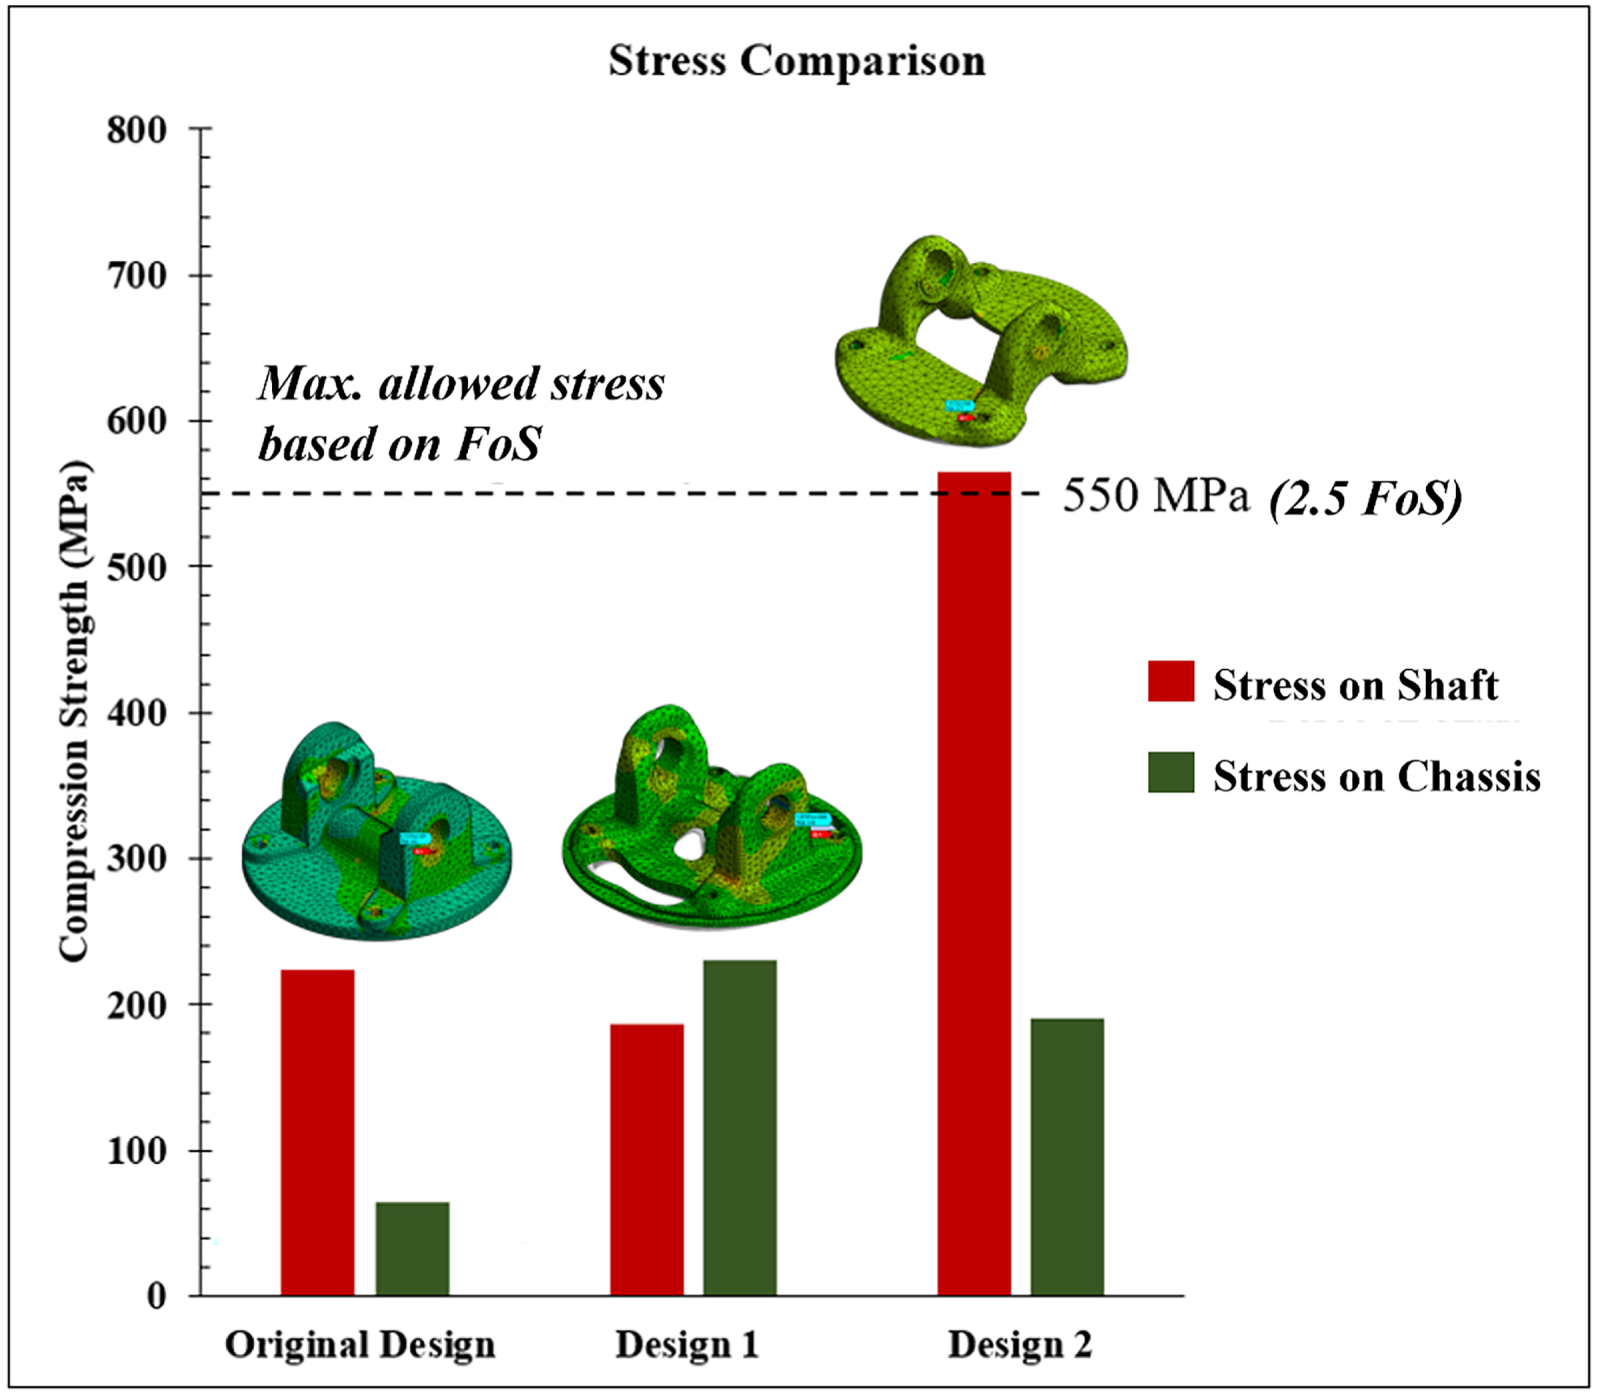
Figure 7: Stress exerted on the shaft and chassis by different designs of flange fork.
Although the optimized design 2 reduces the volume by 45% relative to the original design, the maximum compressive stress in the shaft exceeds the FoS. Design 2 yields a shaft stress of 565 MPa, which exceeds the safe limit of 550 MPa (Eq. (2)).
3.3 Optimized Parameters of the L-PBF Process for the Fabrication of the Flange Fork
Three parameters were used to print tensile specimens, as outlined in Table 4. The average stress-strain results for the samples under the three sets of process parameters are shown in Fig. 8. The results indicated that P1 achieved the highest strength (1096.51 MPa), followed by P2 (1036.20 MPa) and P3 (855.27 MPa). From these results, it is evident that the best parameters were 180 W laser power, a scanning speed of 600 mm/s, a hatch spacing of 100 µm, and a layer thickness of 30 µm.
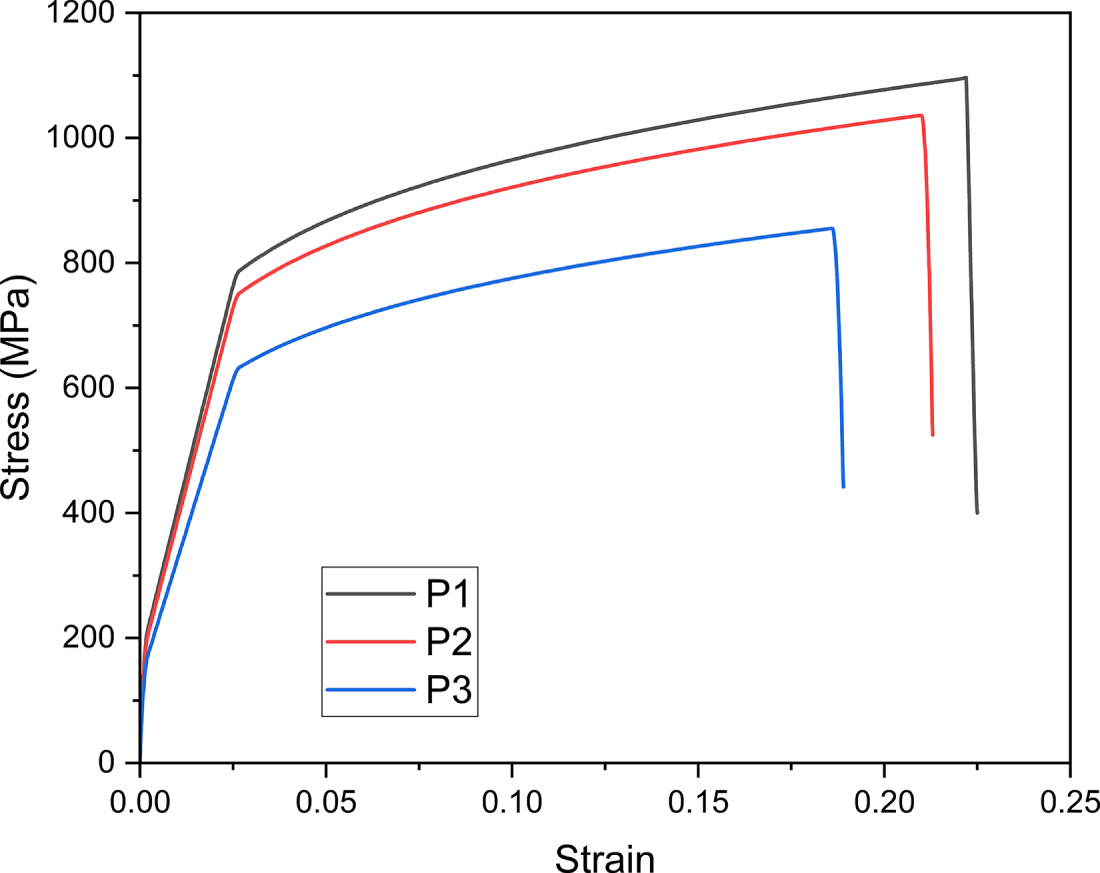
Figure 8: Tensile testing results of the specimens were obtained using P1, P2, and P3 sets of parameters.
At a constant laser power, differences in results among the three parameters can be attributed to scanning speed and layer thickness, which are crucial factors in the LPBF process. A lower layer thickness results in greater energy absorption by the object during printing. Similarly, a slower scanning speed and a higher hatch spacing allow more energy to be transferred from the laser to the material surface.
3.4 Fabrication Analysis Using Simulation
Simufact Additive software compares the fabrication of the optimized flange fork with the original design, taking into account the optimized printing parameters. The comparison is made by focusing on critical factors affecting the structural and dimensional integrity. The analysis explored tolerance levels, total displacement, and surface deviation, as illustrated in Fig. 9. The analysis was conducted with a tolerance threshold of ±0.5 mm, which aligns with the stringent dimensional requirements for automotive components as per the ISO 2768 industrial standard [31]. Fig. 9a compares the tolerance of the original and optimized flange fork models. In this analysis, the original model exhibited an out-of-tolerance of 18%, with only 82% of the part within the tolerance range. Furthermore, the 6 holes constitute a critical region of the flange, as they serve as contact points between the shaft and the chassis. As shown in Fig. 9a, a significant dimensional deviation occurs around the holes in the original model. Thus, this would require extensive post-processing. On the other hand, the out-of-tolerance is significantly reduced to 6.1% in the optimized model, indicating a substantial improvement in dimensional accuracy. Furthermore, the in-tolerance portion of the optimized model reached 93.9%, an increase of 18.2% over the original model. Moreover, most out-of-tolerance features are observed around the outer rim, which is less significant than the holes. Thus, the optimized design would require substantially less post-processing compared to the original model. These results confirm that although both models can be fabricated without support requirements, the optimized model exhibits a notable improvement in dimensional accuracy. A more detailed examination of the precision testing results will be presented in Section 3.5.
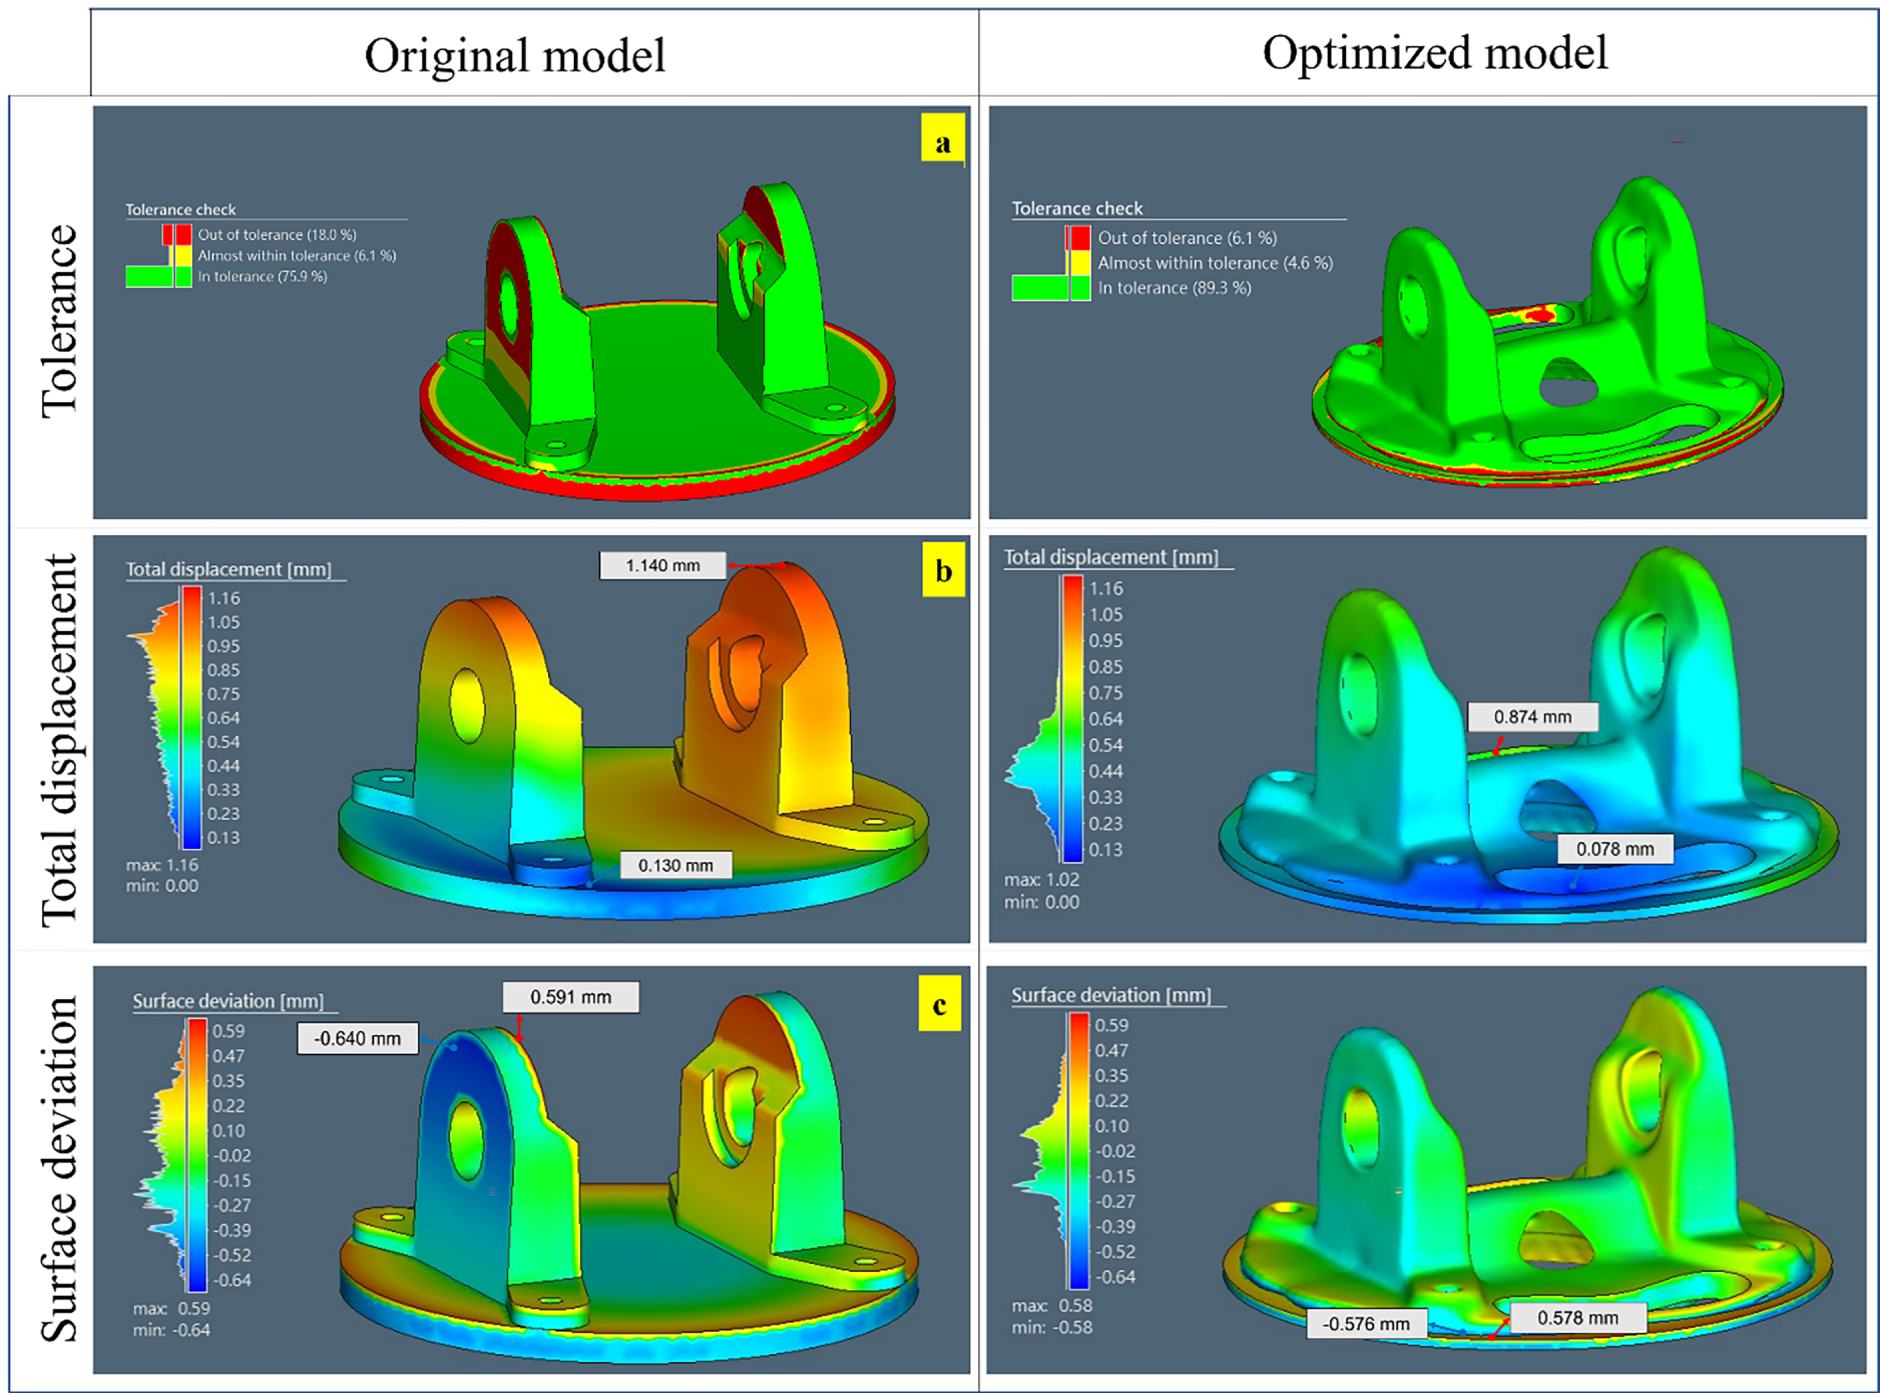
Figure 9: Fabrication analysis of original and optimized automotive flange fork using Simufact Additive software: (a) tolerance, (b) total displacement, and (c) surface deviation.
Fig. 9b shows the total displacement for both the original and optimized models. In the original model, the highest displacement reached 1.140 mm at the top of the flange fork structure. In contrast, the optimized model exhibited a lower maximum displacement of 0.874 mm, indicating improved stability and rigidity under the same printing conditions. Additionally, the displacement distribution in the original model was highly variable, whereas the optimized model exhibited a more uniform range of 0.13–0.89 mm. This reduced range in the optimized model highlights the effectiveness of the optimization process in minimizing structural distortions and improving stability under operation.
Fig. 9c, which displays surface deviation results for both models, also exhibits a similar trend. The optimized model demonstrates a 2% reduction in surface deviation relative to the original model, indicating improved dimensional accuracy. In the original model, deviations were more pronounced, suggesting less stable surface formation during manufacturing. Moreover, the original model exhibited significant surface deviation around the critical hole locations, which would require excessive post-processing. On the contrary, the optimized model’s tighter control over surface deviation reinforces its suitability for high-precision applications, where reduced deviations are crucial for meeting stringent tolerance requirements.
Additionally, thermal characteristics, such as heat flux and temperature rate, were examined to assess the model’s thermal stability during the printing process. Fig. 10a illustrates the heat flux distribution between the original and optimized flange fork models. In the original model, the maximum heat flux reached 307.353 W/m2, while the minimum was 6.171 W/m2. In comparison, the optimized model exhibited a significantly lower maximum heat flux of 157.583 W/m2 and a minimum of 1.078 W/m2. The study indicates that the optimized model effectively reduces heat concentration by approximately half. This reduction in heat flux for the optimized model was advantageous, as excessive heat flux can lead to residual stresses during manufacturing. Residual stresses often contribute to warping, cracking, and distortion [32,33], which aligns with the higher displacement and surface deviation in the original model as observed in Fig. 10b,c. Lower heat flux in the optimized model thereby minimizes the risk of these defects, improving the overall dimensional stability and structural integrity of the part.
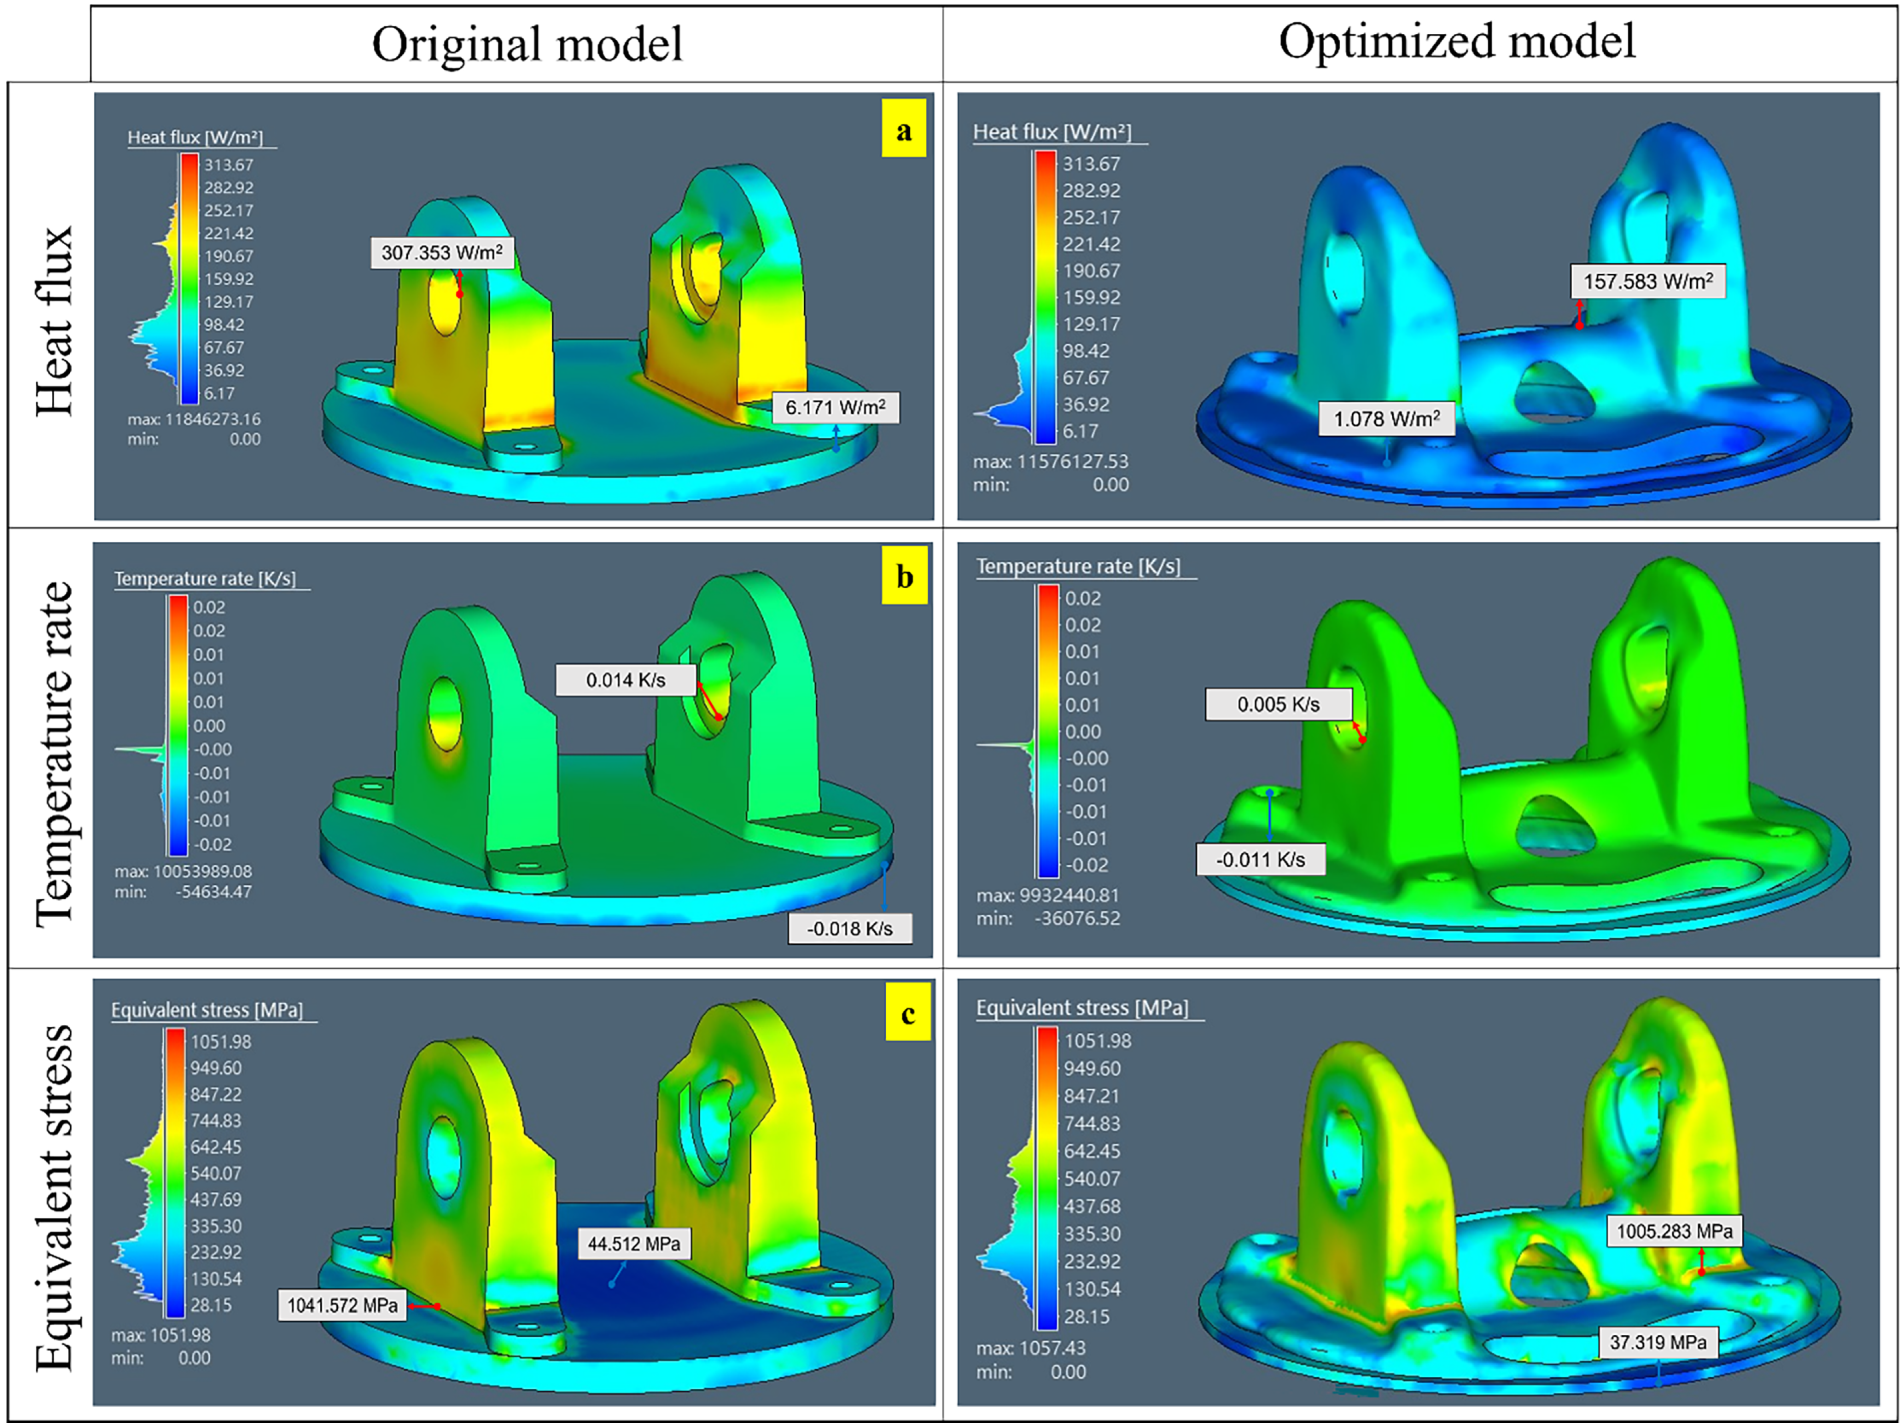
Figure 10: Fabrication analysis of original and optimized automotive flange fork using Simufact Additive software: (a) heat flux, (b) temperature rate, and (c) equivalent stress.
The simulation results for residual stress correspond closely with the heat flux analysis. The original model exhibits a 4% higher residual stress than the optimized model, indicating a greater likelihood of defects such as warping and distortion.
Fig. 10b shows the temperature rate across the flange fork models during manufacturing. In the original model, the temperature rate varies significantly, spanning the range from the top of the flange fork to the base. This greater temperature differential can induce warping and other deformations during additive manufacturing. Such variations can also result in porosity, incomplete fusion between layers, and other internal defects, reducing the density and overall strength of the component [34,35]. The optimized model, however, shows a narrower temperature range, which reduces the likelihood of these issues and contributes to a more uniform thermal distribution.
The equivalent stress distribution, shown in Fig. 10c, further supports these findings. The original model experiences higher stress concentrations, with a peak of 1.041 GPa, whereas the optimized model reaches a lower maximum of 1.005 GPa. Lower equivalent stress in the optimized model indicates improved load-bearing capacity and a reduced risk of failure during operation. By achieving more uniform stress distribution, the optimized model demonstrates enhanced durability, which is critical for applications demanding high reliability.
3.5 Fabrication of Design 1 Using Laser PBF
After evaluating the stress on the shaft and chassis (Section 3.2), the optimized design 1 is fabricated using L-PBF, as shown in Fig. 11. The print quality was acceptable, with all features printed accurately. However, the fabricated component must still undergo post-processing to obtain the final product. This post-processing involves separating the fork flange from the platform using Wire Electrical Discharge Machining (WEDM). In addition to separating the component from the build platform, support removal and polishing were to be performed. This post-processing was necessary to achieve the desired tolerance and surface quality and to ensure that the final product met the specified requirements and design specifications.
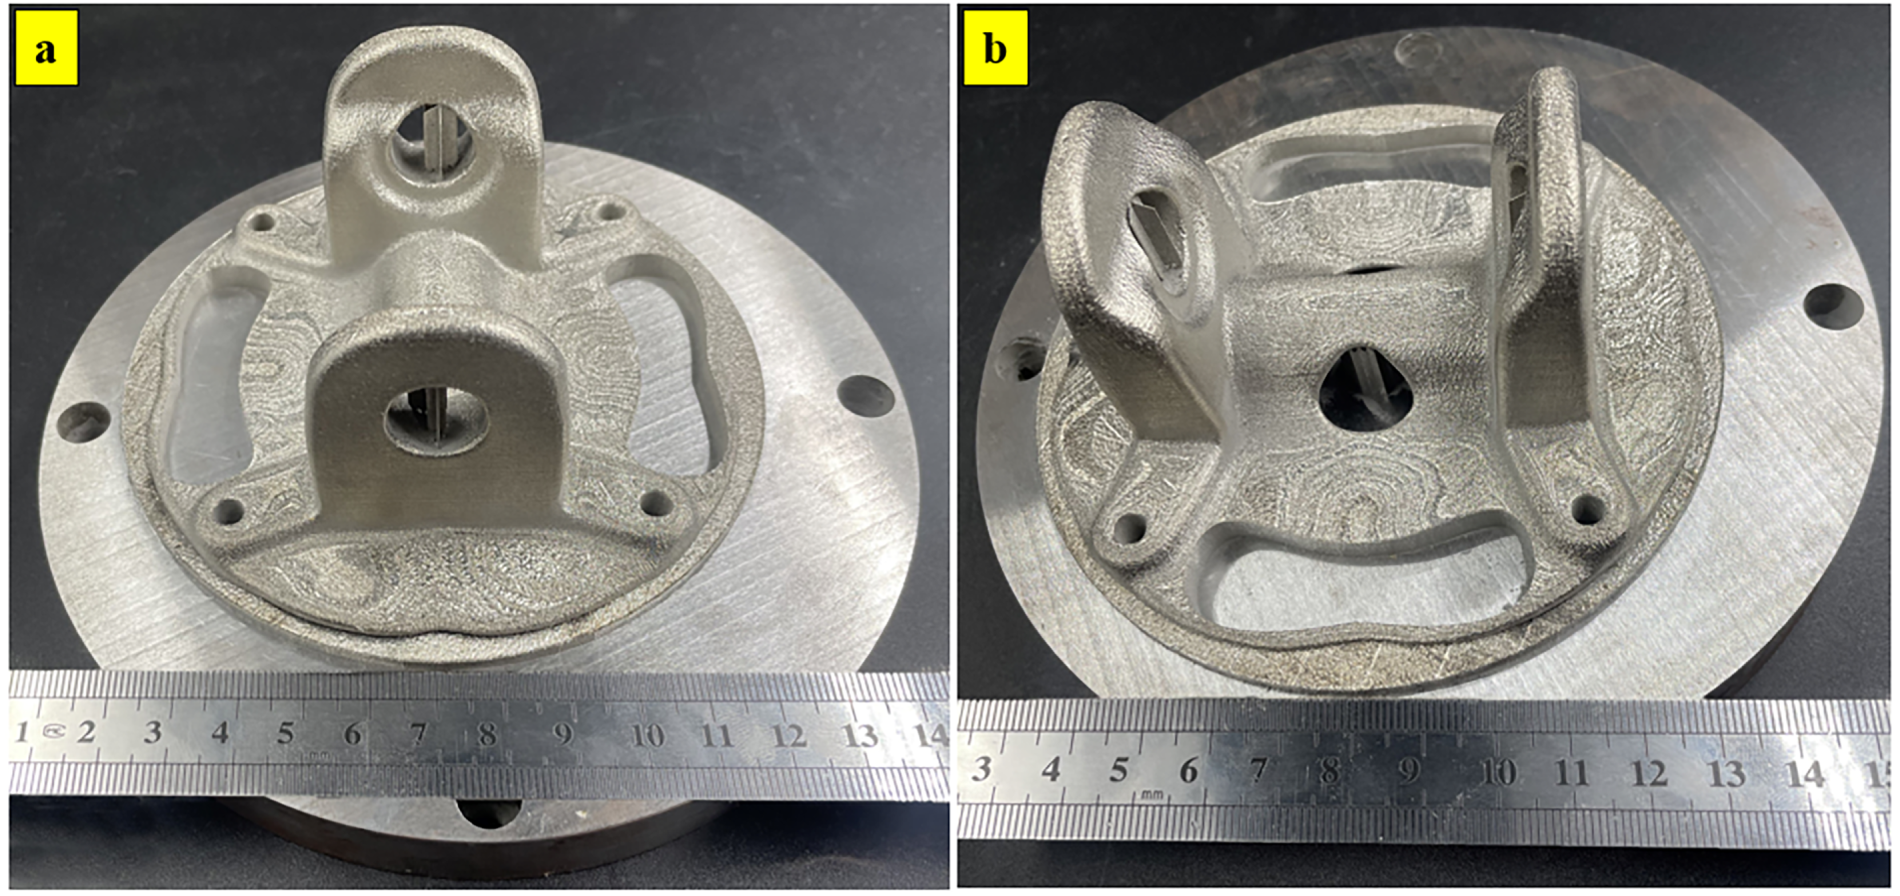
Figure 11: Fabrication of optimized design 1 of flange fork using laser powder bed fusion process: (a) side view and (b) front view.
The weight of the L-PBF-fabricated flange fork is compared with that of the CAD model. The printed sample weighed 1.7% less than the CAD model. This disparity can be attributed to the porosity of AM-fabricated parts. The accuracy of the printing process can also cause the CAD model and the printed part to differ in size.
3.6 Fabrication Precision Assessment
3.6.1 Examining Dimensional Discrepancies between the CAD Design and the Fabricated Component
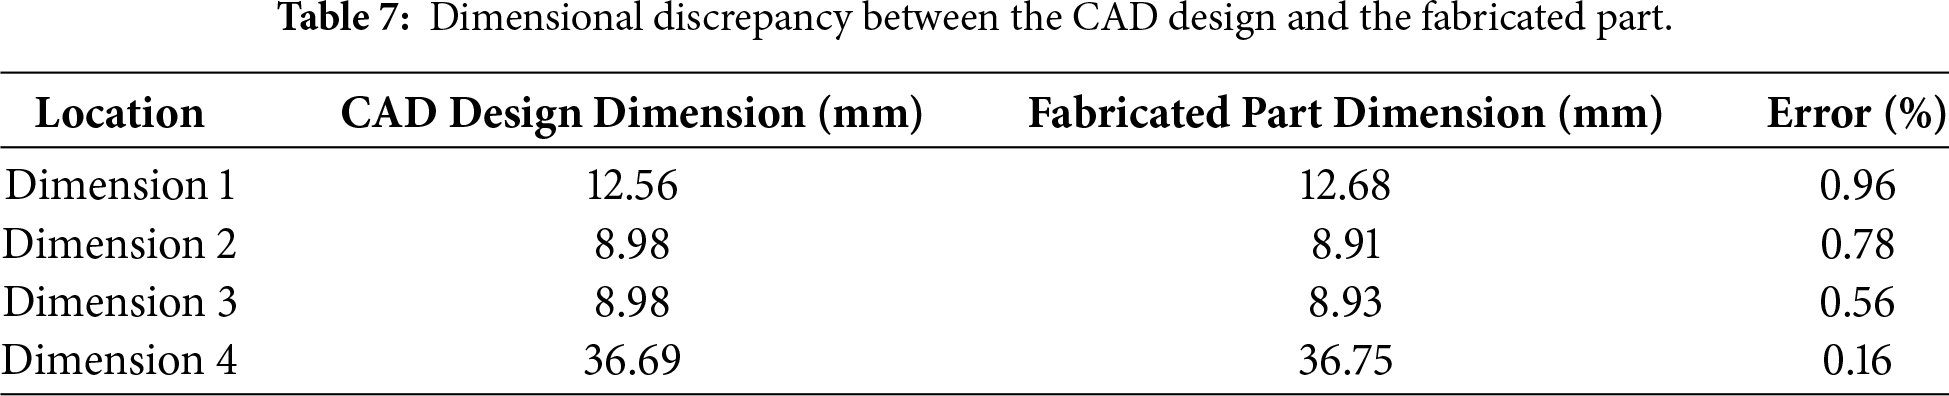
After successful fabrication of the automotive flange fork, a 3D measurement was conducted on the most critical part to assess the dimensional accuracy and precision of the optimal printing parameters. Fig. 12 demonstrates the precision and accuracy evaluation of the printing part. Table 7 outlines the corresponding dimensional discrepancies between the CAD model and the fabricated component. Table 7 shows that the CAD model and the fabricated part exhibit an error of less than 1%, indicating high precision. The optimized combination of process parameters, such as laser power, scanning speed, and layer thickness, affected the result of precision [36,37].
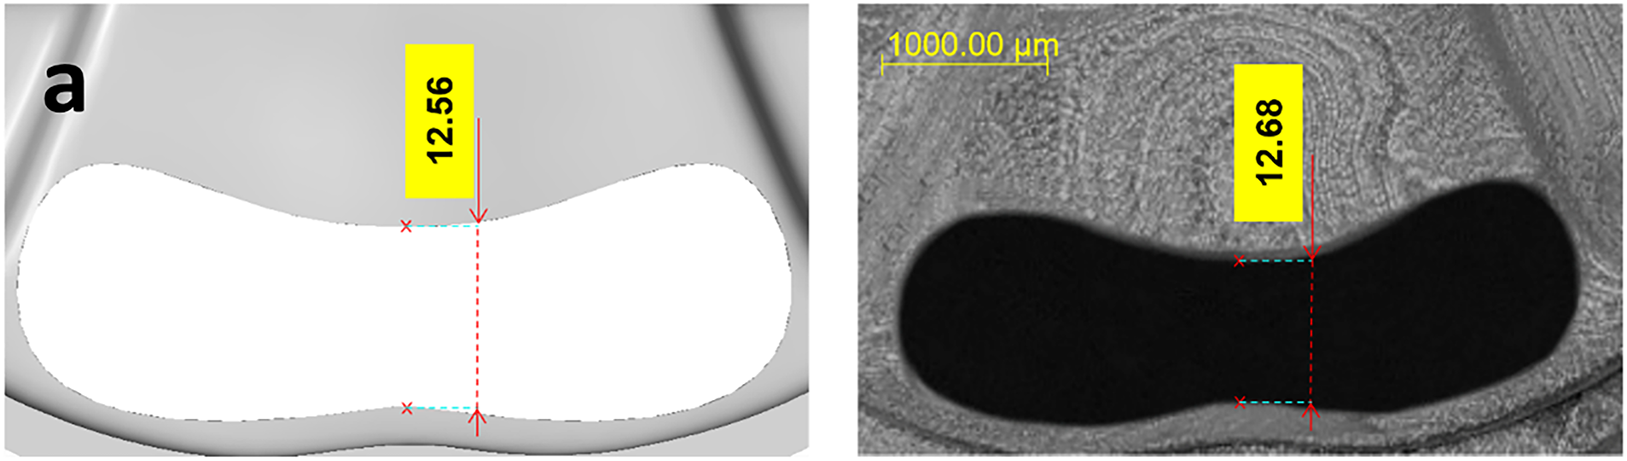
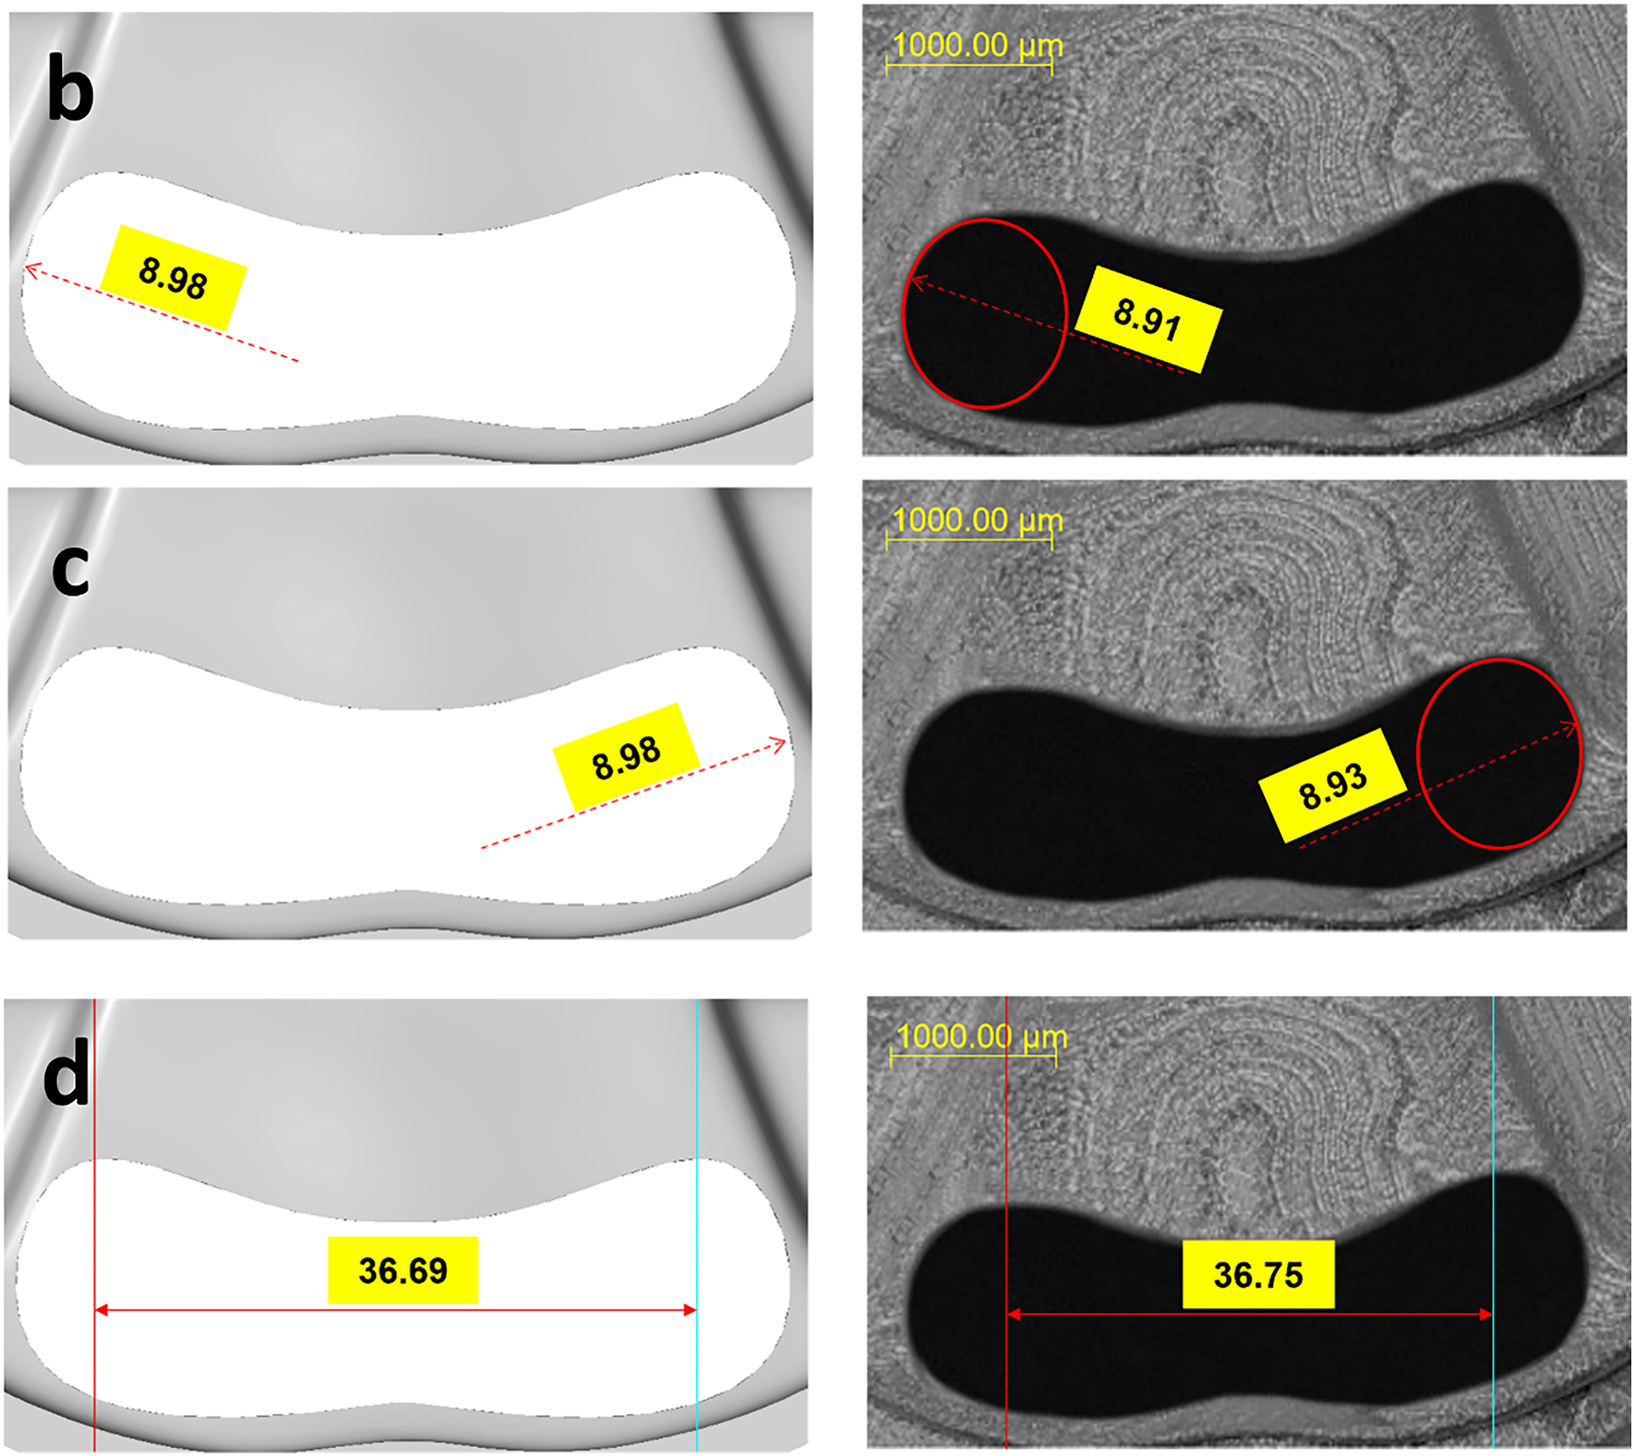
Figure 12: Precision and accuracy evaluation of fabricated flange fork using the optimized printing: (a) dimension 1, (b) dimension 2, (c) dimension 3, and (d) dimension 4.
3.6.2 Hatch Spacing Analysis through SEM
The SEM image of the surface shown in Fig. 13 reveals the hatch distance of 95.75 µm. The printed component shows a difference of 4.25% relative to the hatch distance of 100 µm set during printing (Table 5). This difference may be due to variations in powder diameter during the PBF process. With variations in powder size ranging from 20 to 50 µm, the printing process tends to produce hatches that vary in size from 35 to 105 µm [38].
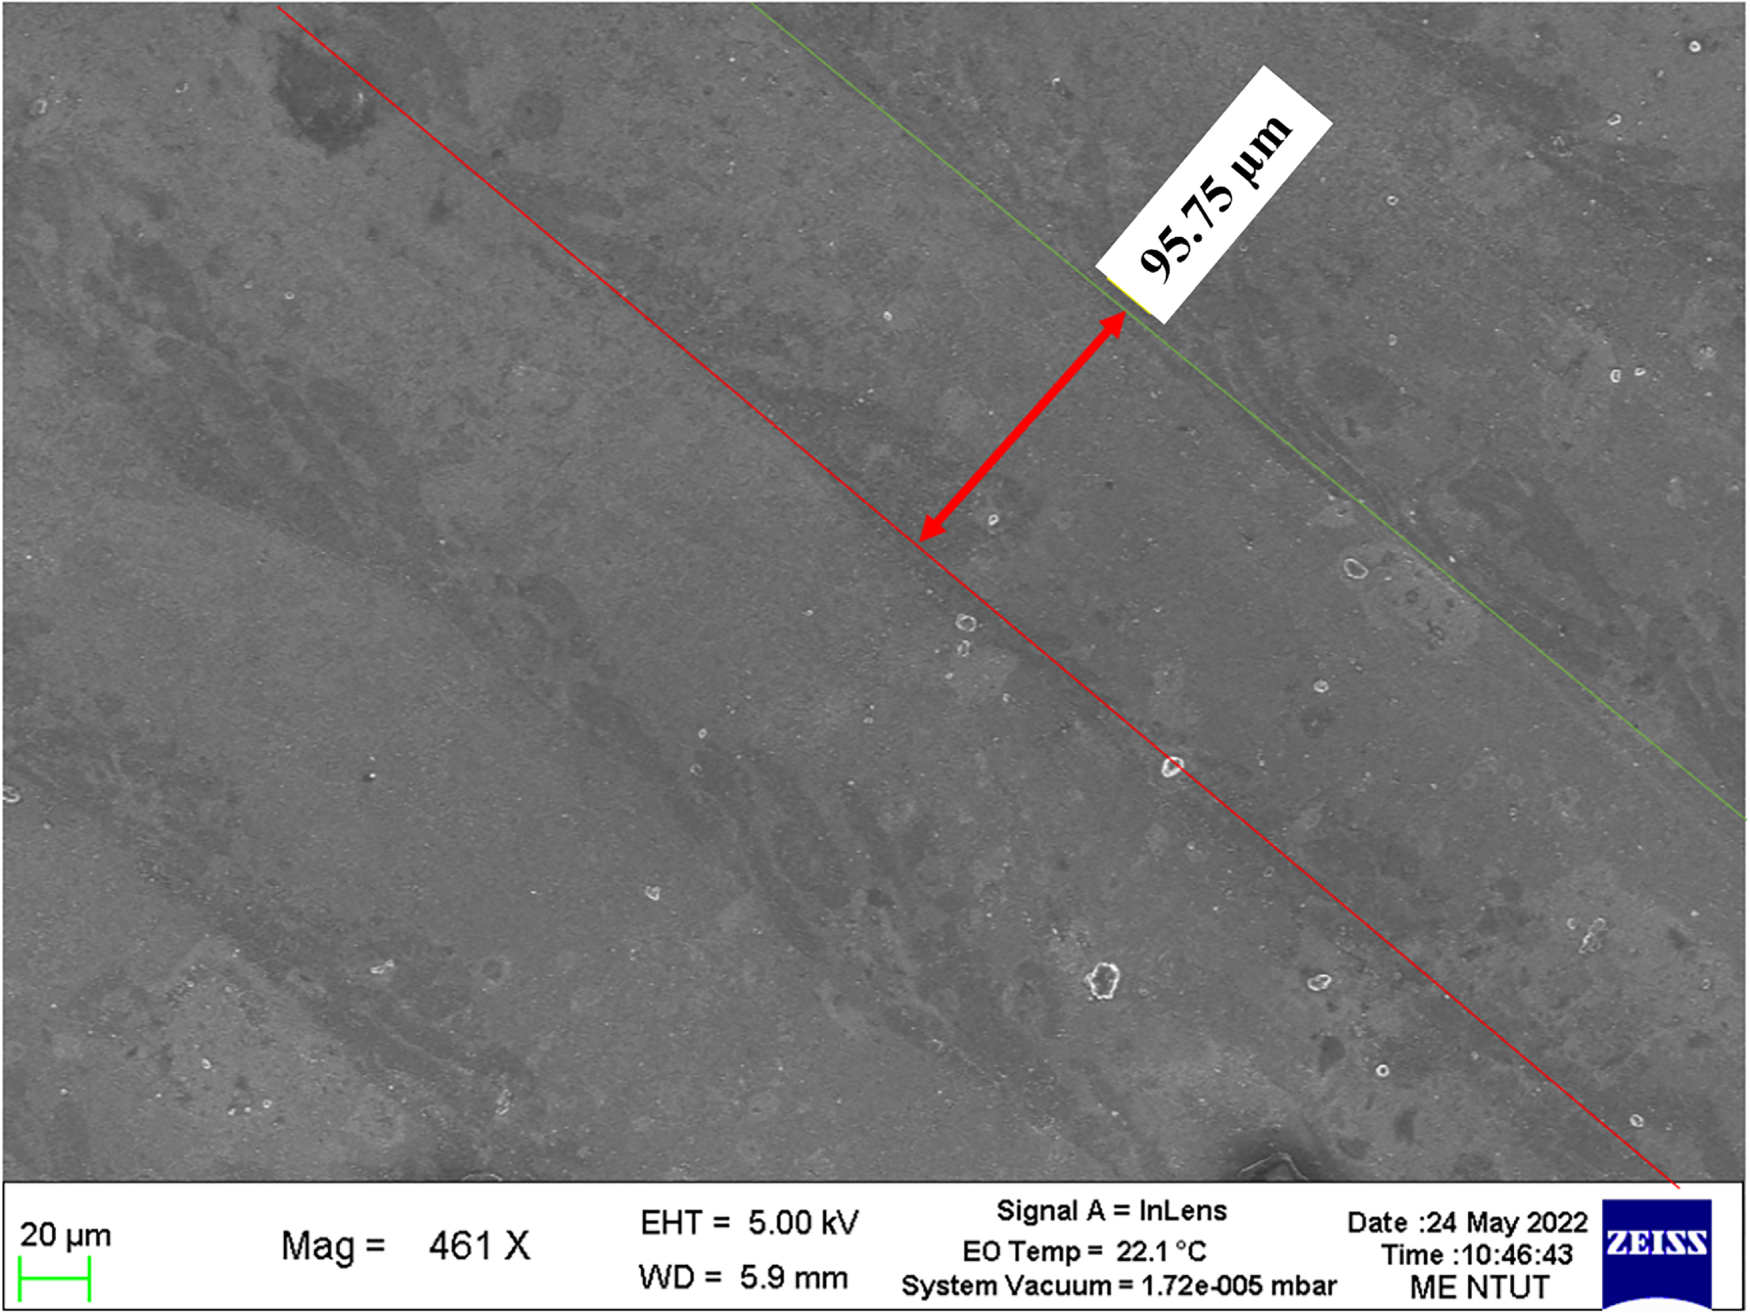
Figure 13: Hatch spacing of the fabricated component examined through SEM analysis.
The L-PBF process varies due to differences in laser precision and energy output. It is crucial to recognize that the parameter set for hatch distance significantly influences the relative density, tensile strength, and elongation of the part [39,40]. However, it’s essential to consider that a larger hatch distance also results in increased surface roughness, reduced hardness, and reduced heat accumulation [40,41]. Therefore, the selection of hatch distance is a crucial aspect of the L-PBF process. Increasing the homogeneity of the powder particle sizes and decreasing the overall size can reduce the hatch distance discrepancy [28,29].
3.7 Experimental Proof-of-Strength Verification
After the successful fabrication of the component, additional torsion tests were conducted to validate the accuracy of the numerical results. Since it was not possible to use a conventional torque testing machine, an alternative method was employed: an extended shaft was installed in the center of the fork flange, as shown in Fig. 14a. This shaft is used to simulate torque-induced motion of the fork flange. Thereafter, a long moment arm was attached to the shaft as shown in Fig. 14b, and a weight was placed at the end of the moment arm. The arm’s end load was converted into a torque, which generates stress on the fork flange. This approach provides a practical representation of the torque conditions that may occur in the actual fork flange. Since this method does not replicate dynamic torque spikes, transient loading, or multi-axial vibration effects encountered in real operation, it should be interpreted strictly as a ‘static proof-of-strength verification’ rather than a full qualification test.
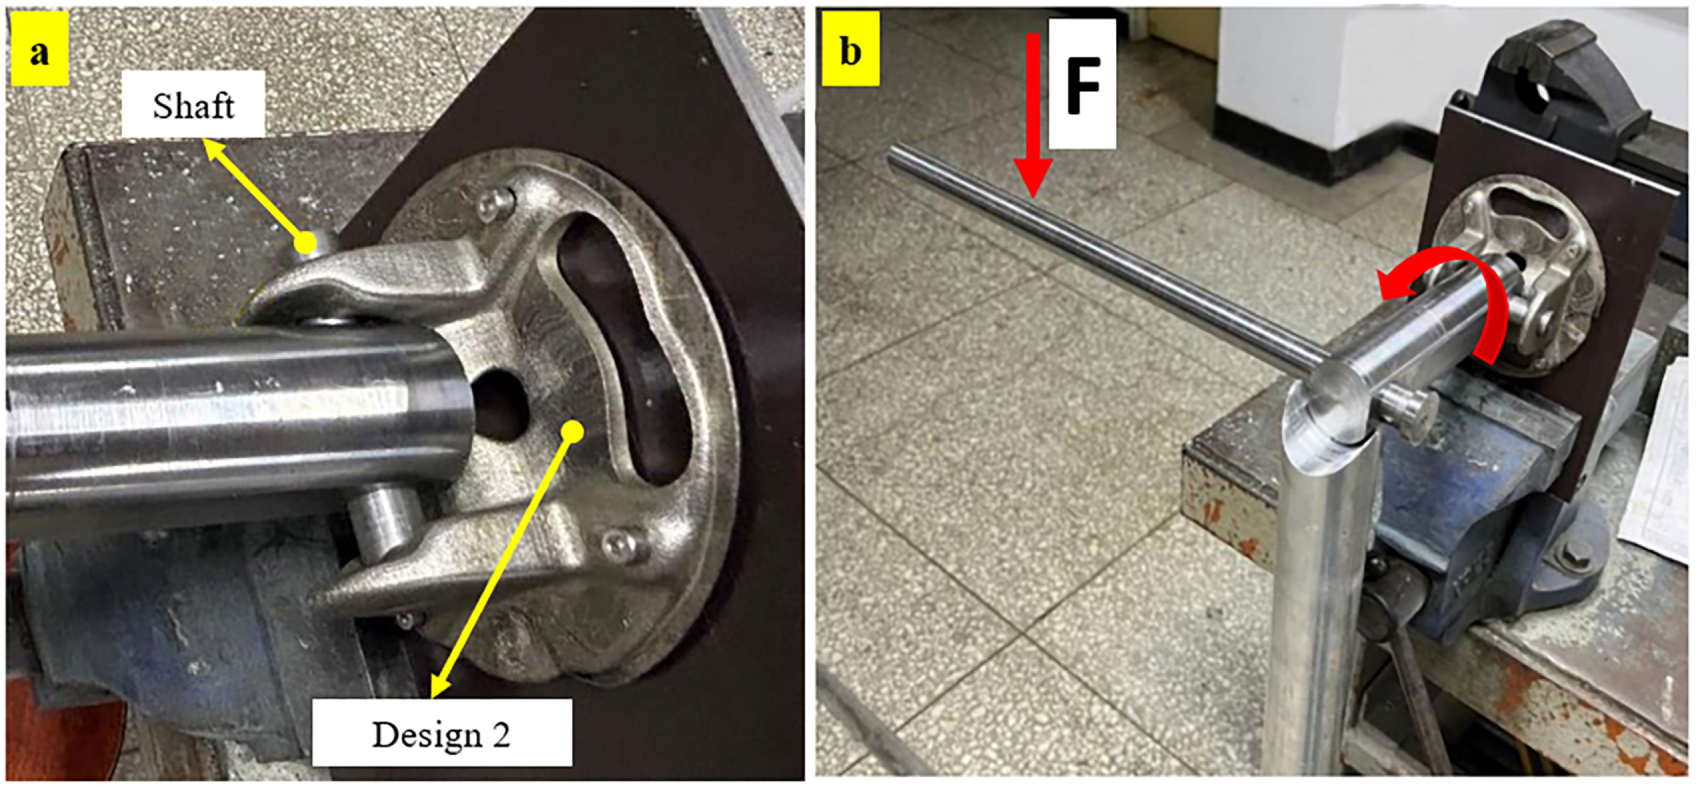
Figure 14: Experimental proof-of-strength analysis: (a) shaft connected to the flange fork and (b) arm of 0.4 m length on which the load is applied to generate torque.
Considering a maximum torque of 300 Nm for the actual 4-wheeler, the weight is calculated using Eq. (3) (Section 2.3). With the arm length of 0.4 m and the angle between the force and arm = 90°, the maximum weight to generate a torque of 300 Nm is calculated to be 76.53 kg. The weights are gradually added to the arms with each step, as shown in Table 8. The test is conducted until the total weight reaches the required value (i.e., 76.53 kg). It is important to note that the experiment is repeated five times to ensure the reliability of the results. The average values of total torque after each stepwise weight increment are reported in Table 8.
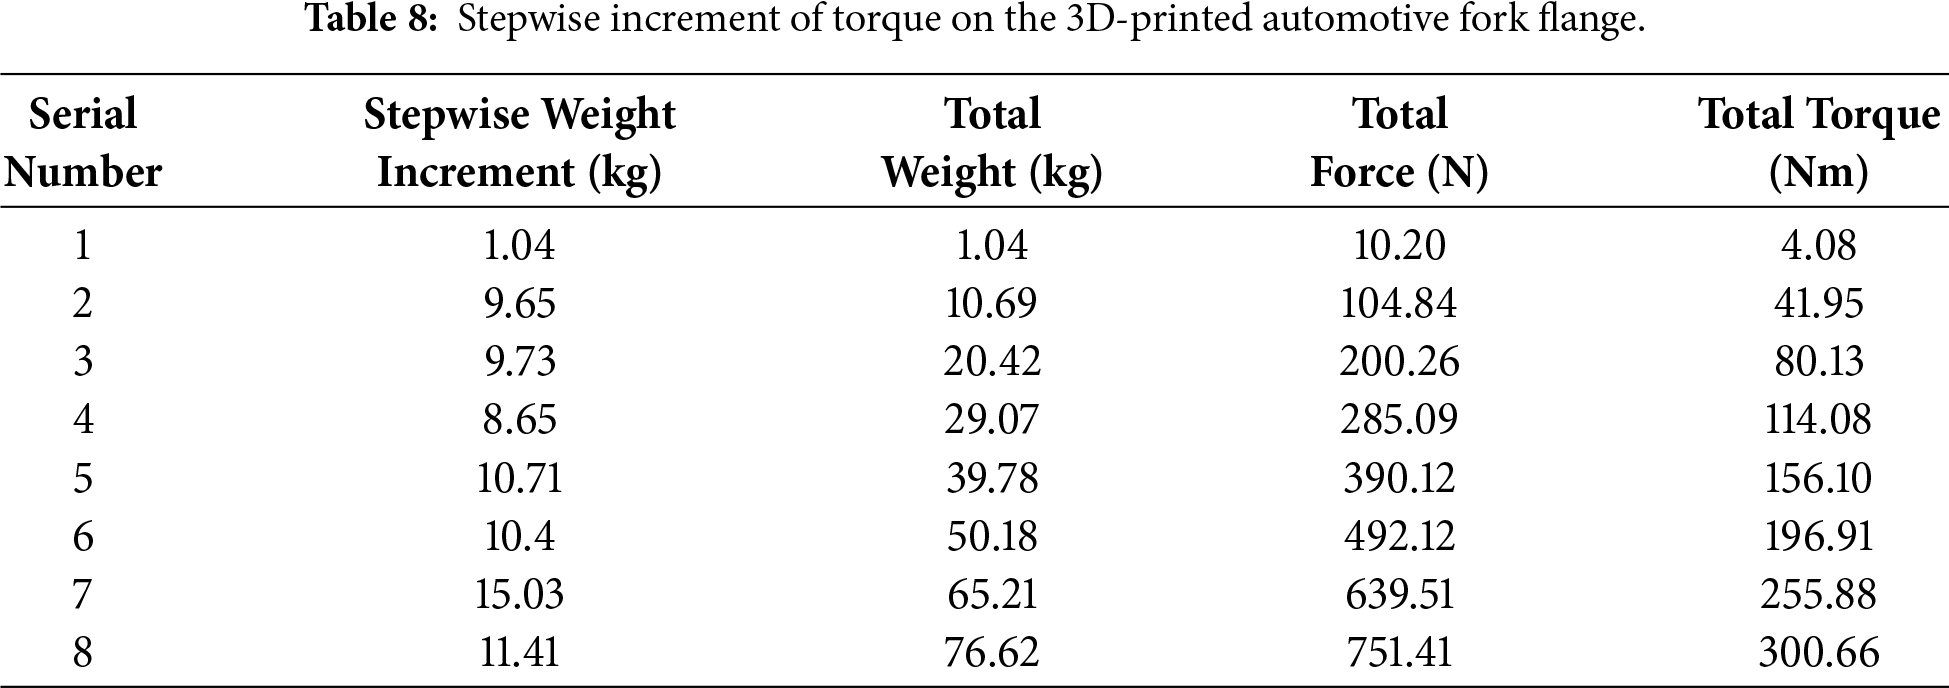
This approach provides a comprehensive understanding of the fork flange’s capacity to withstand the intended maximum torque loads. It establishes a testing framework that accurately simulates real operational conditions in automotive vehicles.
As shown in Table 8, the 3D-printed fork flange can withstand a total torque of 300 Nm without any signs of deformation or defects. Thus, the simulation results demonstrate that the system handles the intended maximum torque of 300 Nm without failure. Furthermore, the digital image analysis shown in Fig. 15 confirms that no deformation or physical damage was present in the critical regions predicted by the simulation. The high-magnification image further illustrates the surface integrity, reinforcing the reliability of the simulation results in evaluating the mechanical performance of the flange fork under operational torque conditions.
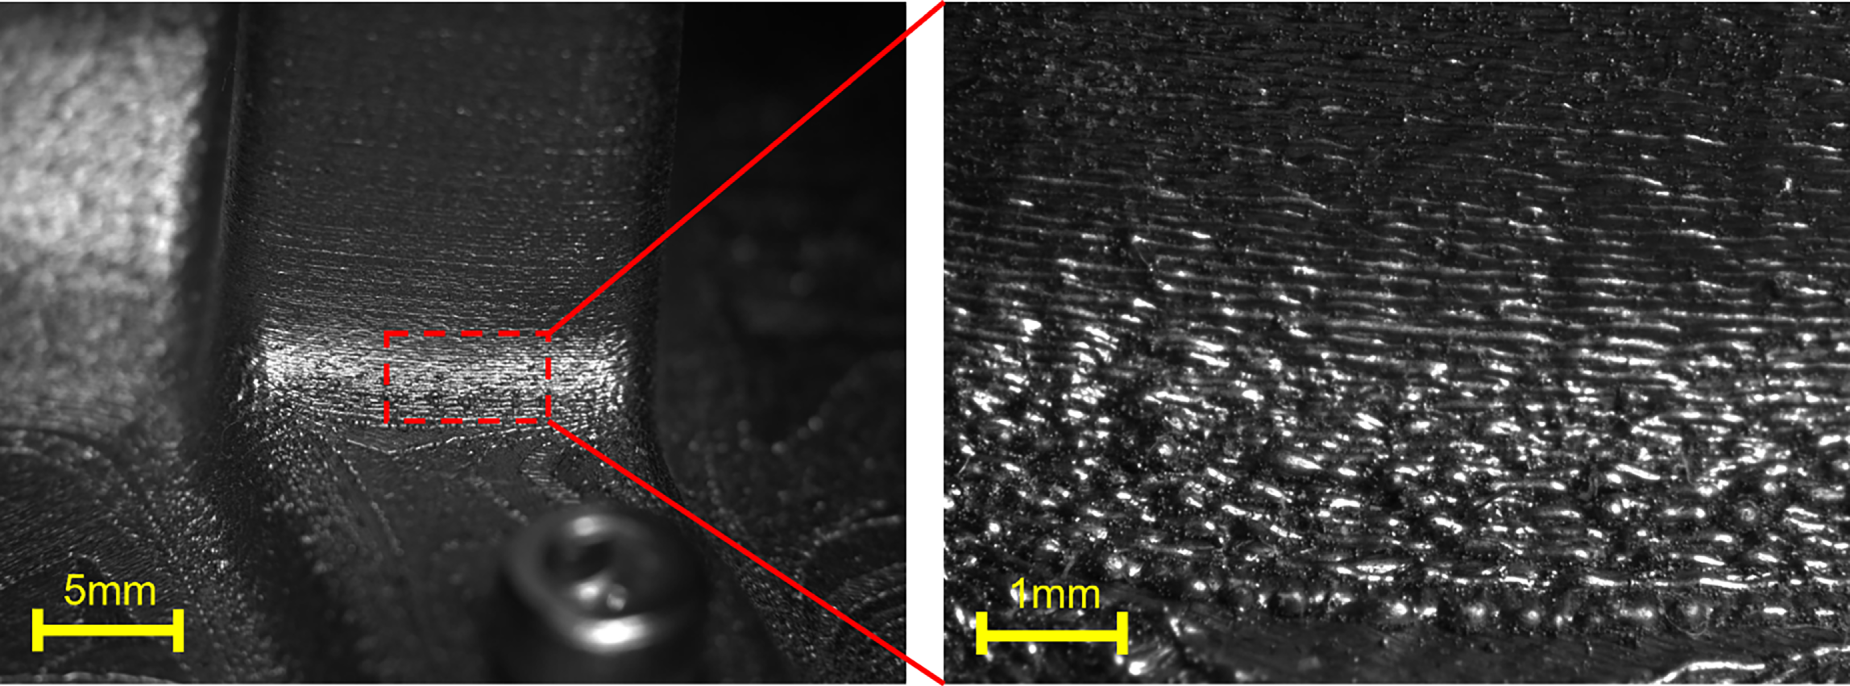
Figure 15: Digital image analysis of flange fork after loading.
This study aimed to develop a digital twin framework comprising topology optimization (TO), finite element analysis (FEA), and Simufact Additive, which can be integrated with additive manufacturing (AM). The integration of digital twin and additive manufacturing (AM) technologies enables the production of cleaner, more efficient automotive components. In addition to supporting cleaner manufacturing, AM technology offers design flexibility for implementing topology optimization (TO). The combined use of digital twin methodologies and AM enables the fabrication of automotive parts that require less energy and materials while maintaining optimal performance. In this study, two topology-optimized designs with 25% and 45% volume reductions were generated using nTop software. Numerical simulations were conducted to assess the stress distribution in the shaft and chassis under an applied torque of 300 Nm. The flange fork design, optimized by 45%, exhibited shaft stress levels exceeding the maximum safety threshold of 550 MPa and was therefore excluded from further consideration. Conversely, the design with a 25% volume reduction achieved a shaft stress 16.51% lower than that of the original configuration and was subsequently fabricated via laser powder-bed fusion (L-PBF). The component was manufactured with optimized printing parameters: laser power of 180 W, scan speed of 600 mm/s, hatch spacing of 100 µm, and layer thickness of 30 µm. Dimensional analysis revealed that discrepancies around curvilinear features were less than 1% relative to the CAD model. Furthermore, experimental torque testing demonstrated that the L-PBF-fabricated flange fork sustained a total load of 76.62 kg and generated a torque of 300 Nm without physical damage or defects.
In addition to experimental analyses, Simufact Additive software was employed to assess manufacturability. Thermal analysis revealed that the original design exhibited a maximum heat flux of 307.353 W/m2, which is 95% higher than the optimized design’s maximum heat flux of 157.5 W/m2. This reduction in heat flux enhances thermal stability and minimizes residual stresses that can cause warping, cracking, and distortion. These findings align with the equivalent stress results, which indicated a 4% decrease in the optimized design compared to the original. Regarding fabrication tolerance, the original flange fork model exhibited 72.9% out-of-tolerance, which was significantly reduced to 53.5% in the optimized design. Most out-of-tolerance measurements in critical regions were eliminated in the optimized model. Furthermore, the optimized design demonstrated a 2% reduction in surface deviation relative to the original, indicating improved dimensional accuracy. The optimized model’s improved control over surface deviation enables its use in high-precision applications, where strict tolerance requirements are essential.
This study highlights the relative ease of fabricating components using a combined digital twin and additive manufacturing process, which is challenging with traditional hot forging methods. Additive manufacturing reduces the high energy demands associated with maintaining constant forging temperatures and eliminates the need for frequent die replacement. Future work will extend this research to evaluate the performance of the fabricated automotive flange fork under dynamic loading conditions. Determining fatigue endurance and failure criteria will further support the development of sustainable replacement strategies.
5 Limitations and Future Scope
While this study examines a flange fork as a representative drivetrain component, the digital-twin framework consisting of topology optimization (TO) for mass and stress optimization, finite element analysis (FEA) for structural verification, and Simufact Additive for manufacturability prediction can be applied to other automotive components, including brackets, couplings, gear housings, and suspension connectors.
Such an initiative would help reduce the carbon footprint by adopting more sustainable manufacturing. Although the present study focused on static loading, fatigue performance remains essential for drivetrain components. A comprehensive FEA of the component, considering the fatigue loading conditions, was not performed. This is because an accurate prediction of L-PBF IN718 requires process-specific S-N data, consideration of surface effects, and build orientation, all of which are outside the current scope. Furthermore, this study lacks a holistic LCA (life cycle assessment) for the AM flange fork component and comparison with traditional manufacturing.
Future work will focus on conducting a fatigue simulation to determine the endurance limit of Design 1 at 106 cycles. Based on the endurance limit, dynamic analysis will be performed at amplitudes corresponding to 60%–80% of the endurance limit. Integrating experimentally calibrated fatigue models into the digital-twin workflow will be a key component of future work. In addition to the dynamic analysis, future work will include cradle-to-gate and cradle-to-grave LCA to quantitatively compare the environmental impacts of the L-PBF-fabricated flange fork with traditional manufacturing routes such as hot forging and machining. This assessment will evaluate energy consumption, material utilization, post-processing, and end-of-life scenarios to rigorously assess the sustainability benefits of the proposed digital-twin-driven AM approach.
Apart from the dynamic analysis, another significant scope of future study would be to include lattice structures that may further reduce the weight without compromising the intended applications [42]. Multi-objective optimization could also be used to further reduce the component’s overall weight and enhance performance.
Acknowledgement: Not applicable.
Funding Statement: This research was funded by the National Science and Technology Council (NSTC) of Taiwan, grant numbers 113-2221-E-027-035-MY2 and 114-2923-E-027-004-MY3, 114-2222-E-027-009-MY2, and National Taipei University of Technology-Gdańsk University of Technology Joint Research Program, grant number NTUT-Gdańsk Tech-114-02. This work is also supported by the “High-value Biomaterials Research and Commercialization Center” of the Featured Area Research Center Program within the framework of the Higher Education Sprout Project by the Taiwan Ministry of Education (MOE).
Author Contributions: Study conception and design: Yulius Shan Romario, Cho-Pei Jiang, Wojciech Macek; Data collection: Yulius Shan Romario, Cho-Pei Jiang; Analysis and interpretation of results: Chinmai Bhat, Mayur Jiyalal Prajapati, Yulius Shan Romario; Draft manuscript preparation: Chinmai Bhat, Mayur Jiyalal Prajapati, Yulius Shan Romario, Wojciech Macek, Mazier Ramezani. All authors reviewed and approved the final version of the manuscript.
Availability of Data and Materials: Bhat, Chinmai (2025), “Topology optimization, fabrication, and precision evaluation of automotive flange fork fabricated through laser powder-bed fusion additive manufacturing process”, Mendeley Data, V1, doi: 10.17632/8rzphr75c2.1. Further details regarding the study will be made available upon request. All the requests should be made to the corresponding author: jcp@mail.ntut.edu.tw.
Ethics Approval: Not applicable.
Conflicts of Interest: The authors declare no competing interests.
References
1. Dalpadulo E, Petruccioli A, Gherardini F, Leali F. A review of automotive spare-part reconstruction based on additive manufacturing. J Manuf Mater Process. 2022;6(6):133. doi:10.3390/jmmp6060133. [Google Scholar] [CrossRef]
2. Alami AH, Ghani Olabi A, Alashkar A, Alasad S, Aljaghoub H, Rezk H, et al. Additive manufacturing in the aerospace and automotive industries: recent trends and role in achieving sustainable development goals. Ain Shams Eng J. 2023;14(11):102516. doi:10.1016/j.asej.2023.102516. [Google Scholar] [CrossRef]
3. Lenort R, Wicher P, Zapletal F. On influencing factors for sustainable development goal prioritisation in the automotive industry. J Clean Prod. 2023;387:135718. doi:10.1016/j.jclepro.2022.135718. [Google Scholar] [CrossRef]
4. Muth J, Klunker A, Völlmecke C. Putting 3D printing to good use—additive manufacturing and the sustainable development goals. Front Sustain. 2023;4:1196228. doi:10.3389/frsus.2023.1196228. [Google Scholar] [CrossRef]
5. Yang J, Li B, Liu J, Tu Z, Wu X. Application of additive manufacturing in the automobile industry: a mini review. Processes. 2024;12(6):1101. doi:10.3390/pr12061101. [Google Scholar] [CrossRef]
6. Sehmi M, Christensen J, Bastien C, Kanarachos S. Review of topology optimisation refinement processes for sheet metal manufacturing in the automotive industry. Struct Multidiscip Optim. 2018;58(1):305–30. doi:10.1007/s00158-017-1876-0. [Google Scholar] [CrossRef]
7. Vyawhare R, Gagpalliwar P, Dhatrak P. Trends of topology optimization and additive manufacturing in automobile industry. AIP Conf Proc. 2023;2548:020011. doi:10.1063/5.0118566. [Google Scholar] [CrossRef]
8. Nandanwar T, Waghela K, Gupta E, Babu TN, editors. Topology optimization of the bell crank & brake pedal. In: IOP Conference Series: Materials Science and Engineering. Bristol, UK: IOP Publishing; 2021. [Google Scholar]
9. Dongre G, Raut R, Atre N, Nilgund K, Ohol S, Otari A, et al. Topology optimization of brake pad. Mater Today Proc. 2023;86:765. doi:10.1016/j.matpr.2023.03.414. [Google Scholar] [CrossRef]
10. Gao B, Meng D, Shi W, Cai W, Dong S, Zhang Y, et al. Topology optimization and the evolution trends of two-speed transmission of EVs. Renew Sustain Energy Rev. 2022;161:112390. doi:10.1016/j.rser.2022.112390. [Google Scholar] [CrossRef]
11. Bhat C, Kumar A, Lin SC, Jeng JY. Design of tessellation based load transfer mechanisms in additively manufactured lattice structures to obtain hybrid responses. Addit Manuf. 2023;76:103774. doi:10.1016/j.addma.2023.103774. [Google Scholar] [CrossRef]
12. Rosen DW. Computer-aided design for additive manufacturing of cellular structures. Comput Aided Des Appl. 2007;4(5):585–94. doi:10.1080/16864360.2007.10738493. [Google Scholar] [CrossRef]
13. Bhat C, Kumar A, Lin SC, Jeng JY. Adaptive mechanical properties and stretchability of novel chainmail fabrics based on overlapping tessellation strategies. Addit Manuf. 2023;76:103777. doi:10.1016/j.addma.2023.103777. [Google Scholar] [CrossRef]
14. Tong Y. A design in the optimal precision forging process about transmission shaft flange yoke. Appl Mech Mater. 2010;44–47:2832–6. doi:10.4028/www.scientific.net/amm.44-47.2832. [Google Scholar] [CrossRef]
15. Lange K, Cser L, Geiger M, Kals JAG. Tool life and tool quality in bulk metal forming. CIRP Ann. 1992;41(2):667–75. doi:10.1016/S0007-8506(07)63253-3. [Google Scholar] [CrossRef]
16. Zheng X, Zhang Y, Chen Z, Sun L, Dong W, Cao F, et al. Die wear analysis and pre-forging process optimization of hot forging for automobile flange fork. Int J Adv Manuf Technol. 2023;126(3):1701–16. doi:10.1007/s00170-023-11235-1. [Google Scholar] [CrossRef]
17. Luo S, Zhu D, Hua L, Qian D, Yan S. Numerical analysis of die wear characteristics in hot forging of titanium alloy turbine blade. Int J Mech Sci. 2017;123:260–70. doi:10.1016/j.ijmecsci.2017.02.013. [Google Scholar] [CrossRef]
18. Lee GA, Im YT. Finite-element investigation of the wear and elastic deformation of dies in metal forming. J Mater Process Technol. 1999;89:123–7. doi:10.1016/S0924-0136(99)00148-X. [Google Scholar] [CrossRef]
19. Liu Y, Feng J, Lu J, Zhou S. A review of digital twin capabilities, technologies, and applications based on the maturity model. Adv Eng Inform. 2024;62:102592. doi:10.1016/j.aei.2024.102592. [Google Scholar] [CrossRef]
20. Metris S. What is Torque in Cars? [cited 2026 Jan 1]. Available from: https://www.mercedesbenzofchantilly.com/service/service-tips-and-tricks/what-is-torque-in-cars/. [Google Scholar]
21. Bendsøe MP, Sigmund O. Topology optimization: theory, methods, and applications. Berlin, Germany: Springer; 2004. [Google Scholar]
22. Villalba D, París J, Couceiro I, Colominas I, Navarrina F. Topology optimization of structures considering minimum weight and stress constraints by using the overweight approach. Eng Struct. 2022;273:115071. doi:10.1016/j.engstruct.2022.115071. [Google Scholar] [CrossRef]
23. Nudehi S, Steffen J. Analysis of machine elements using SolidWorks simulation 2018. Mission, KS, USA: SDC Publications; 2018. [Google Scholar]
24. Bean GE, McLouth TD, Witkin DB, Sitzman SD, Adams PM, Zaldivar RJ. Build orientation effects on texture and mechanical properties of selective laser melting inconel 718. J Mater Eng Perform. 2019;28(4):1942–9. doi:10.1007/s11665-019-03980-w. [Google Scholar] [CrossRef]
25. Boresi AP, Schmidt RJ. Advanced mechanics of materials. Hoboken, NJ, USA: John Wiley & Sons, Inc.; 2002. [Google Scholar]
26. Beer F, Johnston E, Mazurek D, Cornwell P, Self B. Vector mechanics for engineers: statics and dynamics. New York, NY, USA: McGraw Hill; 2025. [Google Scholar]
27. Corcoran J, Wolford C. Couplings-balancing tutorial & “new developments in gas turbine couplings”. In: Asia Turbomachinery & Pump Symposium 2016 Proceedings. College Station, TX, USA: Turbomachinery Laboratories, Texas A&M Engineering Experiment Station; 2016. [Google Scholar]
28. Jiang CP, Maidhah AA, Wang SH, Wang YR, Pasang T, Ramezani M. Laser powder bed fusion of inconel 718 tools for cold deep drawing applications: optimization of printing and post-processing parameters. Materials. 2023;16(13):4707. doi:10.3390/ma16134707. [Google Scholar] [PubMed] [CrossRef]
29. Jiang CP, Maidhah AA, Wibisono AT, Toyserkani E, Macek W, Ramezani M. Effect of zirconia addition on laser powder bed fusion of Inconel 718-zirconia composite. Prog Addit Manuf. 2025;10(10):7425–36. doi:10.1007/s40964-025-01044-1. [Google Scholar] [CrossRef]
30. Nyamekye P, Lakshmanan R, Tepponen V, Westman S. Sustainability aspects of additive manufacturing: leveraging resource efficiency via product design optimization and laser powder bed fusion. Heliyon. 2023;10(1):e23152. doi:10.1016/j.heliyon.2023.e23152. [Google Scholar] [PubMed] [CrossRef]
31. ISO-2768-1-1989. General tolerances—tolerances for linear and angular dimensions without individual tolerance indications. Geneva, Switzerland: International Organization for Standardization; 1989. 3 p. [Google Scholar]
32. Magana-Carranza R, Sutcliffe CJ, Patterson EA. The effect of processing parameters and material properties on residual forces induced in Laser Powder Bed Fusion (L-PBF). Addit Manuf. 2021;46:102192. doi:10.1016/j.addma.2021.102192. [Google Scholar] [CrossRef]
33. Yang YP, Jamshidinia M, Boulware P, Kelly SM. Prediction of microstructure, residual stress, and deformation in laser powder bed fusion process. Comput Mech. 2018;61(5):599–615. doi:10.1007/s00466-017-1528-7. [Google Scholar] [CrossRef]
34. Uriati F, Nicoletto G. A comparison of inconel 718 obtained with three L-PBF production systems in terms of process parameters, as-built surface quality, and fatigue performance. Int J Fatigue. 2022;162:107004. doi:10.1016/j.ijfatigue.2022.107004. [Google Scholar] [CrossRef]
35. Haribaskar R, Kumar TS. Defects in metal additive manufacturing: formation, process parameters, postprocessing, challenges, economic aspects, and future research directions. 3D Print Addit Manuf. 2024;11(4):e1629–55. doi:10.1089/3dp.2022.0344. [Google Scholar] [PubMed] [CrossRef]
36. Cao L, Li J, Hu J, Liu H, Wu Y, Zhou Q. Optimization of surface roughness and dimensional accuracy in LPBF additive manufacturing. Opt Laser Technol. 2021;142:107246. doi:10.1016/j.optlastec.2021.107246. [Google Scholar] [CrossRef]
37. Gruber S, Grunert C, Riede M, López E, Marquardt A, Brueckner F, et al. Comparison of dimensional accuracy and tolerances of powder bed based and nozzle based additive manufacturing processes. J Laser Appl. 2020;32(3):032016. doi:10.2351/7.0000115. [Google Scholar] [CrossRef]
38. Louw DF, Pistorius PGH. The effect of scan speed and hatch distance on prior-beta grain size in laser powder bed fused Ti-6Al-4V. Int J Adv Manuf Technol. 2019;103(5):2277–86. doi:10.1007/s00170-019-03719-w. [Google Scholar] [CrossRef]
39. Zhang Z, Wang S, Liu H, Wang L, Xiao X. Effects of hatch distance on the microstructure and mechanical anisotropy of 316 L stainless steel fabricated by laser powder bed fusion. J Mater Eng Perform. 2023;32(10):4757–67. doi:10.1007/s11665-022-07416-w. [Google Scholar] [CrossRef]
40. Dong Z, Liu Y, Wen W, Ge J, Liang J. Effect of hatch spacing on melt pool and As-built quality during selective laser melting of stainless steel: modeling and experimental approaches. Materials. 2018;12(1):50. doi:10.3390/ma12010050. [Google Scholar] [PubMed] [CrossRef]
41. Mansouri M, Fallah MM, Kazerooni A. The influence of hatch distance on the surface roughness, microhardness, residual stress, and density of inconel 625 specimens in the laser powder bed fusion process. Adv Mater Process Technol. 2025;11(2):641–55. doi:10.1080/2374068X.2024.2313280. [Google Scholar] [CrossRef]
42. Ali S, Prajapati MJ, Bhat C, Jiang CP, Jeng JY. Additive manufactured enabled digital metallurgy processes, challenges and future prospects. Appl Mater Today. 2025;42:102580. doi:10.1016/j.apmt.2024.102580. [Google Scholar] [CrossRef]
Cite This Article
 Copyright © 2026 The Author(s). Published by Tech Science Press.
This work is licensed under a Creative Commons Attribution 4.0 International License , which permits unrestricted use, distribution, and reproduction in any medium, provided the original work is properly cited.
 Downloads
 Citation Tools