
 Submit a Paper
 Propose a Special lssue
 Open Access
ARTICLE

MCCGAA: Multimodal Channel Compression Graph Attention Alignment Network for ECG Zero-Shot Classification
State Key Laboratory of Public Big Data, Guizhou University, Guiyang, China
* Corresponding Author: Xianghong Tang. Email:
Computers, Materials & Continua 2026, 87(3), 67 https://doi.org/10.32604/cmc.2026.076251
Received 17 November 2025; Accepted 13 January 2026; Issue published 09 April 2026
 View Full Text
 Download PDF
Abstract
Electrocardiogram (ECG) is a widely used non-invasive tool for diagnosing cardiovascular diseases. ECG zero-shot classification involves pre-training a model on a large dataset to classify unknown disease categories. However, existing ECG feature extraction networks often neglect key lead signals and spatial topology dependencies during cross-modal alignment. To address these issues, we propose a multimodal channel compression graph attention alignment network (MCCGAA). MCCGAA incorporates a channel attention module (CAM) to effectively integrate key lead features and a graph attention-based alignment network to capture spatial dependencies, enhancing cross-modal alignment. Additionally, MCCGAA employs a log-sum-exp loss function, improving classification performance and convergence over the original clip-style method. Experimental results show that MCCGAA outperforms current methods, achieving the highest classification accuracy across six publicly available datasets. MCCGAA holds promise for advancing ECG zero-shot classification and offering better decision support for researchers.Keywords
Electrocardiogram (ECG) [1] is a non-invasive graphical record of cardiac electrical signals, serving as a cornerstone for diagnosing cardiovascular diseases. ECG diagnostic classification [2] aims to categorize ECG signals into specific cardiac states or disease types. Traditional signal processing [3] and feature extraction methods rely heavily on professional domain knowledge, requiring manual design of key features such as QRS complex morphology and RR intervals. Moreover, these approaches lack robust multimodal data integration support, resulting in suboptimal efficiency and accuracy in practical applications.
Deep learning has brought transformative potential to ECG classification. Early 1D convolutional neural networks (1D-CNN) [4] excel at capturing local signal patterns, performing well in detecting ventricular and supraventricular ectopic beats. However, their inherent local receptive field limits modeling of long-term temporal dependencies and adaptation to sequence feature variations. To address this, studies combined LSTM autoencoders with SVM [5] for automatic feature learning without prior knowledge, yet these hybrid models show poor cross-distribution adaptability and fail to learn transferable features. Recently, ECG self-supervised learning (eSSL) [6,7] has gained attention for learning features from unlabeled signals. Contrastive eSSL (ceSSL) [8,9] leverages augmented sample pairs to train discriminative features, while generative eSSL (geSSL) [10] focuses on signal reconstruction for better downstream performance. Nevertheless, eSSL methods fragment long-term ECG dependencies, losing global cardiac activity features, and lack explicit domain knowledge guidance [11], restricting zero-shot classification effectiveness.
Multimodal fusion techniques integrating ECG with clinical reports [12,13] show promise in auxiliary diagnosis [14]. Knowledge-base-enhanced approaches [15] generate expert disease descriptions to guide ECG-text joint embedding learning. However, these methods ignore spatial topological dependencies across ECG leads and patient data [16], and lack mechanisms to prioritize critical lead signals. Graph neural networks (GNNs) [17,18] excel at modeling complex multimodal relationships, yet their application in ECG-report alignment remains underexplored.
To tackle these challenges, we propose a multimodal channel compression graph attention alignment network (MCCGAA) for ECG zero-shot classification. A lightweight 1D-ResNet integrated with a channel attention module (CAM) extracts ECG features, prioritizing key leads and suppressing noise. A graph attention feature alignment network (GAFA) captures spatial topological dependencies between ECG and text embeddings for enhanced cross-modal alignment. Furthermore, we adopt a log-sum-exp contrastive loss to improve numerical stability over traditional clip-style designs. Our main contributions are summarized as follows:
1. We designed an end-to-end graph attention feature alignment network based on ECG-report dual embeddings to complement the spatial topological dependencies between modalities in the cross-modal alignment process. To our knowledge, this is the first attempt to incorporate topological dependency learning into the pre-trained ECG zero-shot classification task.
2. We designed a channel attention mechanism combined with 1D-ResNet as the ECG backbone network. Compared to the pure 1D-ResNet design, the former demonstrated superior feature extraction capabilities and provided spatial topological support for the cross-modal alignment network.
3. To enhance the stability of model training, we replaced the previously used clip-style contrastive loss function with log-sum-exp. Experimental results show that the log-sum-exp-based approach achieved better convergence and evaluation metrics.
4. We conducted evaluations on six public datasets. Experimental results show that, compared to many benchmark methods, our approach achieved promising results in most evaluation tasks, which is expected to provide better decision support for professionals in the field of ECG zero-shot classification.
The remainder of this paper is organized as follows: Section 2 briefly reviews related work in ECG zero-shot classification. Section 3 details the relevant design of MCCGAA, starting from the problem formulation. Section 4 compares MCCGAA with the latest baseline methods on six publicly available datasets to demonstrate its effectiveness. Section 5 concludes with a summary and discusses potential future research directions.
This section reviews relevant works on ECG contrastive learning and multimodal joint learning in ECG medical diagnosis, followed by the zero-shot classification task, which is the primary focus of this study.
ECG medical diagnosis analyzes ECG to assess heart health. As a convenient, inexpensive, and non-invasive tool, ECG plays a key role in early detection [19], treatment decisions, and efficacy evaluation. Multi-lead ECG provides multi-dimensional time-series signals capturing pathological features. For example, irregular R-R intervals and absent P-waves indicate atrial fibrillation; T-wave inversion or ST-segment depression may suggest myocardial ischemia. Joint assessment of leads is complex, requires expert knowledge [19], and diagnostic accuracy is closely tied to professional expertise. Developing robust evaluation systems remains challenging.
2.2 Multi-Lead ECG Contrastive Learning
ECG signal representation faces noise, complex global spatiotemporal dependencies, and high dimensionality [20]. Temporal contrastive learning (TCL) [21] optimizes representations across time segments. CLOCS [9] encourages similarity across space, time, and patients, while TS-TCC [6] uses weak and strong augmentations in cross-view prediction tasks. ASTCL [22] removes noise via adversarial training to align feature distributions, further improving the robustness of contrastive learning for ECG signals. GNN-based approaches, like CoLA [23], capture embeddings from high-dimensional attributes and local structures, and ECG-KG [24] vectorizes abnormal triples for improved classification. However, these methods lack clinical knowledge guidance, limiting the understanding of higher-order physiological or pathological relationships between leads and disease labels.
2.3 ECG Multimodal Joint Learning
Inspired by the significant success of multimodal joint learning in natural language processing and computer vision, several ECG diagnostic studies have begun to explore multimodal fusion for representation learning. For instance, IFM [25] generates three types of ECG images—Gramian Angular Field (GAF), Recurrence Plot (RP), and Markov Transition Field (MTF)—to fuse them for heartbeat classification. Similarly, multimodal fusion of ECG and photoplethysmogram (PPG) signals based on wavelet transform has been designed to improve heartbeat detection. However, these methods primarily focus on modality data derived from collection techniques, while professional artificial knowledge, such as clinical reports, remains underutilized. Unlike the remarkable progress in joint learning between medical images and clinical reports [26], the integration of expert knowledge to guide ECG model learning requires further exploration.
2.4 ECG Zero-Shot Classification
Zero-shot classification classifies unseen categories via cross-modal alignment to mitigate data scarcity. However, ECG zero-shot classification demands further research due to discrepancies between ECG signals and radiology reports. MERL [15] proposed a benchmark with clinical knowledge-enhanced prompt engineering (CKEPE) for ECG disease labels, leveraging large-scale pretraining for zero-shot tasks. FG-CLEP [27] enhances ECG-text alignment through fine-grained waveform recovery and two-stage contrastive pretraining, boosting zero-shot classification and linear probing. Notably, these methods overlook cross-modal topological dependencies between ECG and text embeddings and while GNNs [28] excel at capturing such structural information, their application to ECG zero-shot classification remains underexplored. Additionally, ECG data exhibits severe class imbalance (ultra-minority rare arrhythmias account for <1% in most datasets), yet existing methods lack systematic analysis of rare-class performance and the correlation between class frequency and accuracy, hindering clinical utility.
In this section, we first present the relevant symbols involved in the ECG zero-shot classification task. Then, starting from the design of the MCCGAA encoding layer, we provide a detailed explanation of the associated designs, including the GAFA layer and the loss function, as shown in Fig. 1.
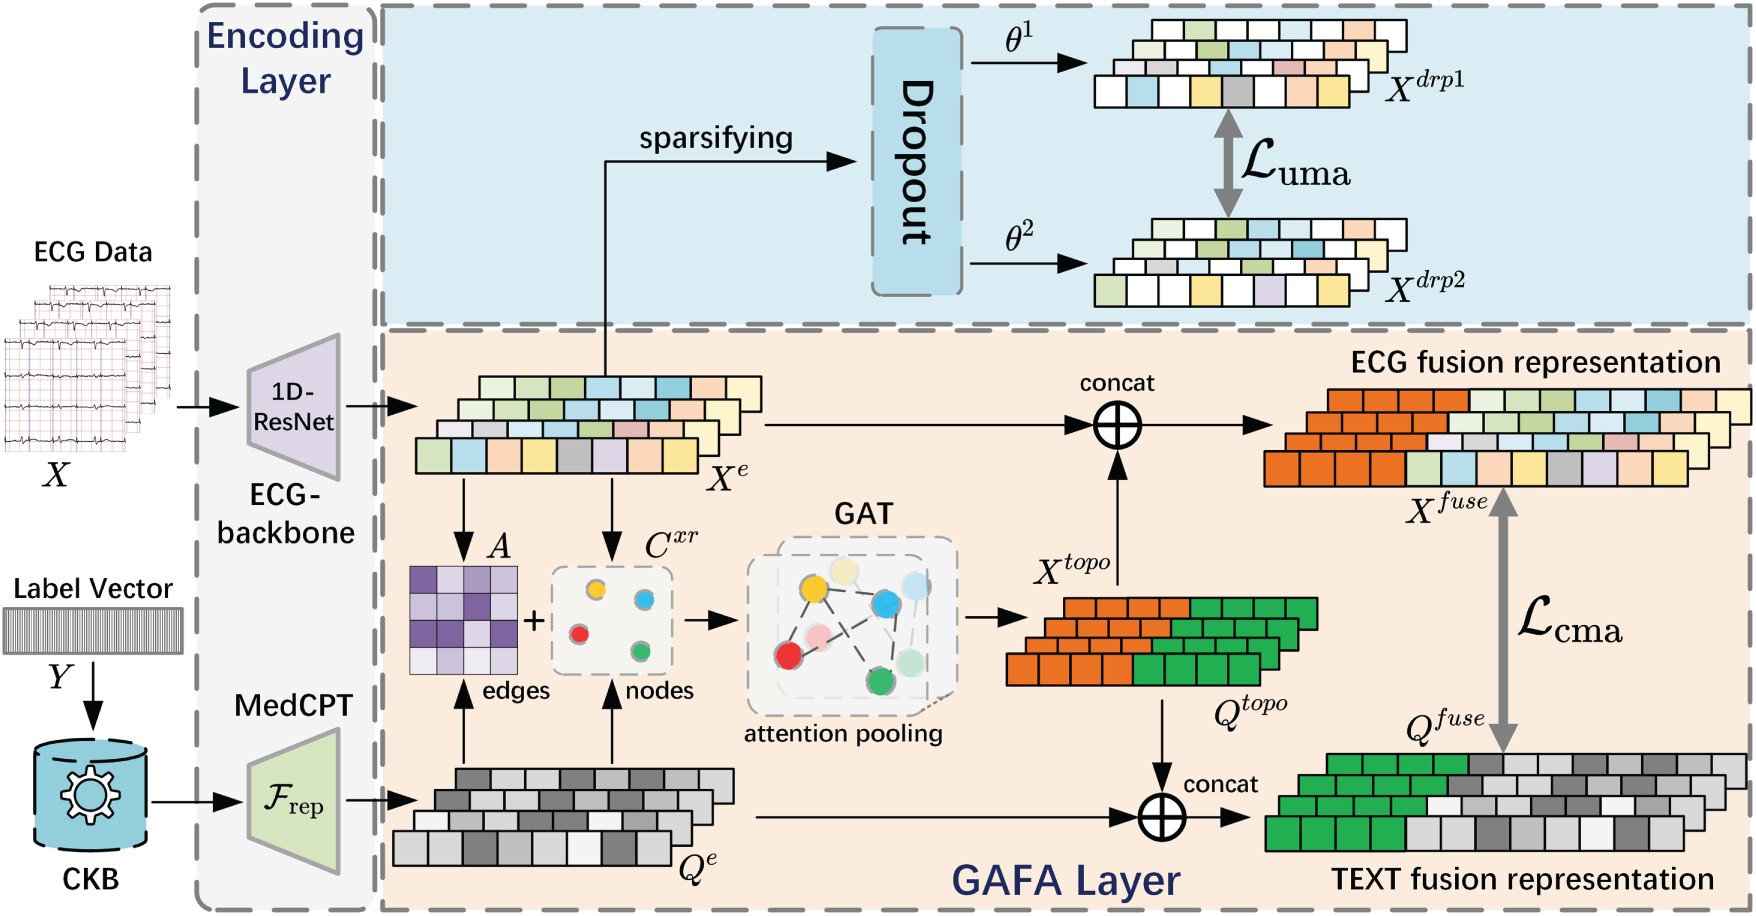
Figure 1: Structure diagram of MCCGAA. CKB refers to the Clinical Knowledge Base. For the embedding representations of ECG and clinical reports, on the one hand, both are used to construct a similarity adjacency matrix A and a dual-embedding graph node set
The ECG data for D-lead signals is represented as
where
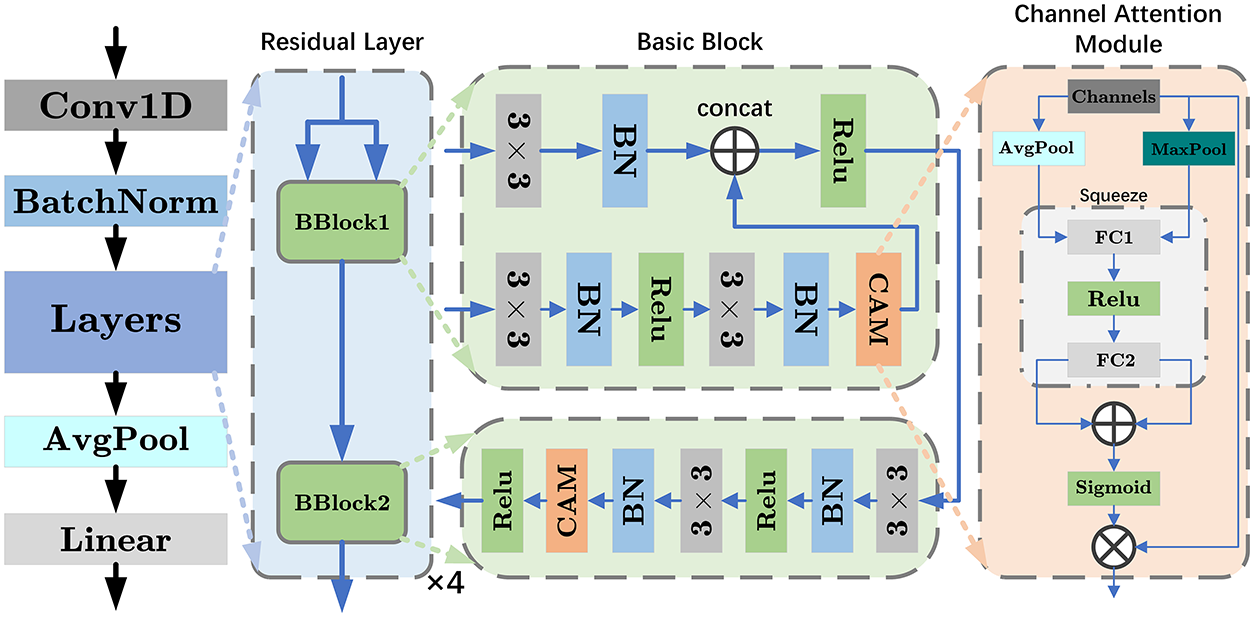
Figure 2: Structure diagram of ECG-backbone. The diagram illustrates the design 1D-ResNet18, which consists of four residual layers, each containing two basic blocks. BN represents batch normalization, and 3
where
where
if
In the CAM module, both average pooling and max pooling operations are used to capture the global average and maximum information of each channel, thereby learning different contexts of ECG:
Next, two fully connected layers are used to generate the attention weights corresponding to each channel:
where the number of output channels for
where
The weighted design of the CAM allows the network to adaptively emphasize or suppress features from different channels, thereby improving model performance and capturing the differences in lead signals across various ECG data for different tasks. Furthermore, the output of the 1D-ResNet18 with the integrated CAM module is mapped to the preset embedding vector length by a linear layer:
where
In ECG diagnostic report embedding representation learning, we used a pre-trained text encoder
Prior to similarity calculation, the ECG embedding
To capture cross-modal topological dependencies between ECGs and diagnostic reports, we propose GAFA, a method based on joint embedding learning of ECG and text representations.
The cross-modal topology in GAFA is modeled as a bipartite graph, where ECG embeddings and diagnostic text embeddings serve as two heterogeneous node types, and edges are constructed based on their pairwise semantic similarity. This formulation enables explicit modeling of ECG–text relational structure, which is subsequently learned via a graph attention network.
With
where
where
where
After the preparation, we use a two-layer multi-head graph attention network (GAT) to capture the spatial topology dependencies between ECG and diagnostic text. The computation for a single-head graph attention layer is as follows:
where
where
Finally, we concatenate the outputs of the multiple attention heads to obtain the output of a single-layer GAT:
where
where
3.4 Modal Alignment Loss Function
A good modal alignment loss function can map the embedding representations of ECG and diagnostic text into a shared space, ensuring that similar or related inputs are closer to each other in this space. Compared to the current clip-style loss function design, the log-sum-exp design offers stronger numerical stability when handling large-scale datasets. To improve the loss function, we propose the following log-sum-exp-based ECG zero-shot classification loss function design:
where
where
where
Notably, the proposed cross-modal alignment is symmetric. Both ECG-to-text and text-to-ECG alignments are optimized using the same similarity matrix, and the final objective is defined as the unweighted sum of the two directional losses. This symmetric design encourages bidirectional embedding alignment in a shared latent space and improves the generalization ability of zero-shot ECG classification.
Finally, considering issues such as errors introduced during the preprocessing of ECG time series, some unimodal embedding regularization methods are used to constrain the model learning. Combined with cross-modal alignment, as shown follows:
where
In this section, extensive experiments are conducted to comprehensively evaluate the performance of MCCGAA. First, seven benchmark datasets, including the pretraining dataset MIMIC-ECG [29], are introduced. Next, the state-of-the-art benchmark methods used for comparison are listed. Several experiments, including linear probing, zero-shot classification, and ablation studies, are then designed to thoroughly examine the interdependencies among different components of MCCGAA. Finally, intuitive feature visualization methods are employed to further analyze the internal mechanisms of MCCGAA, followed by a brief summary. For clarity, the highest value for each dataset is highlighted in bold, and the second-highest value is underlined (“_”) in the subsequent experimental results tables.
To evaluate the performance of MCCGAA, four real-world datasets (PTBXL includes four sub-datasets) were selected. Large-scale pretraining was conducted on MIMIC-ECG, with downstream tasks on CPSC2018 [30], PTBXL [31], and Chapman [32]. Key dataset information is summarized in Table 1.
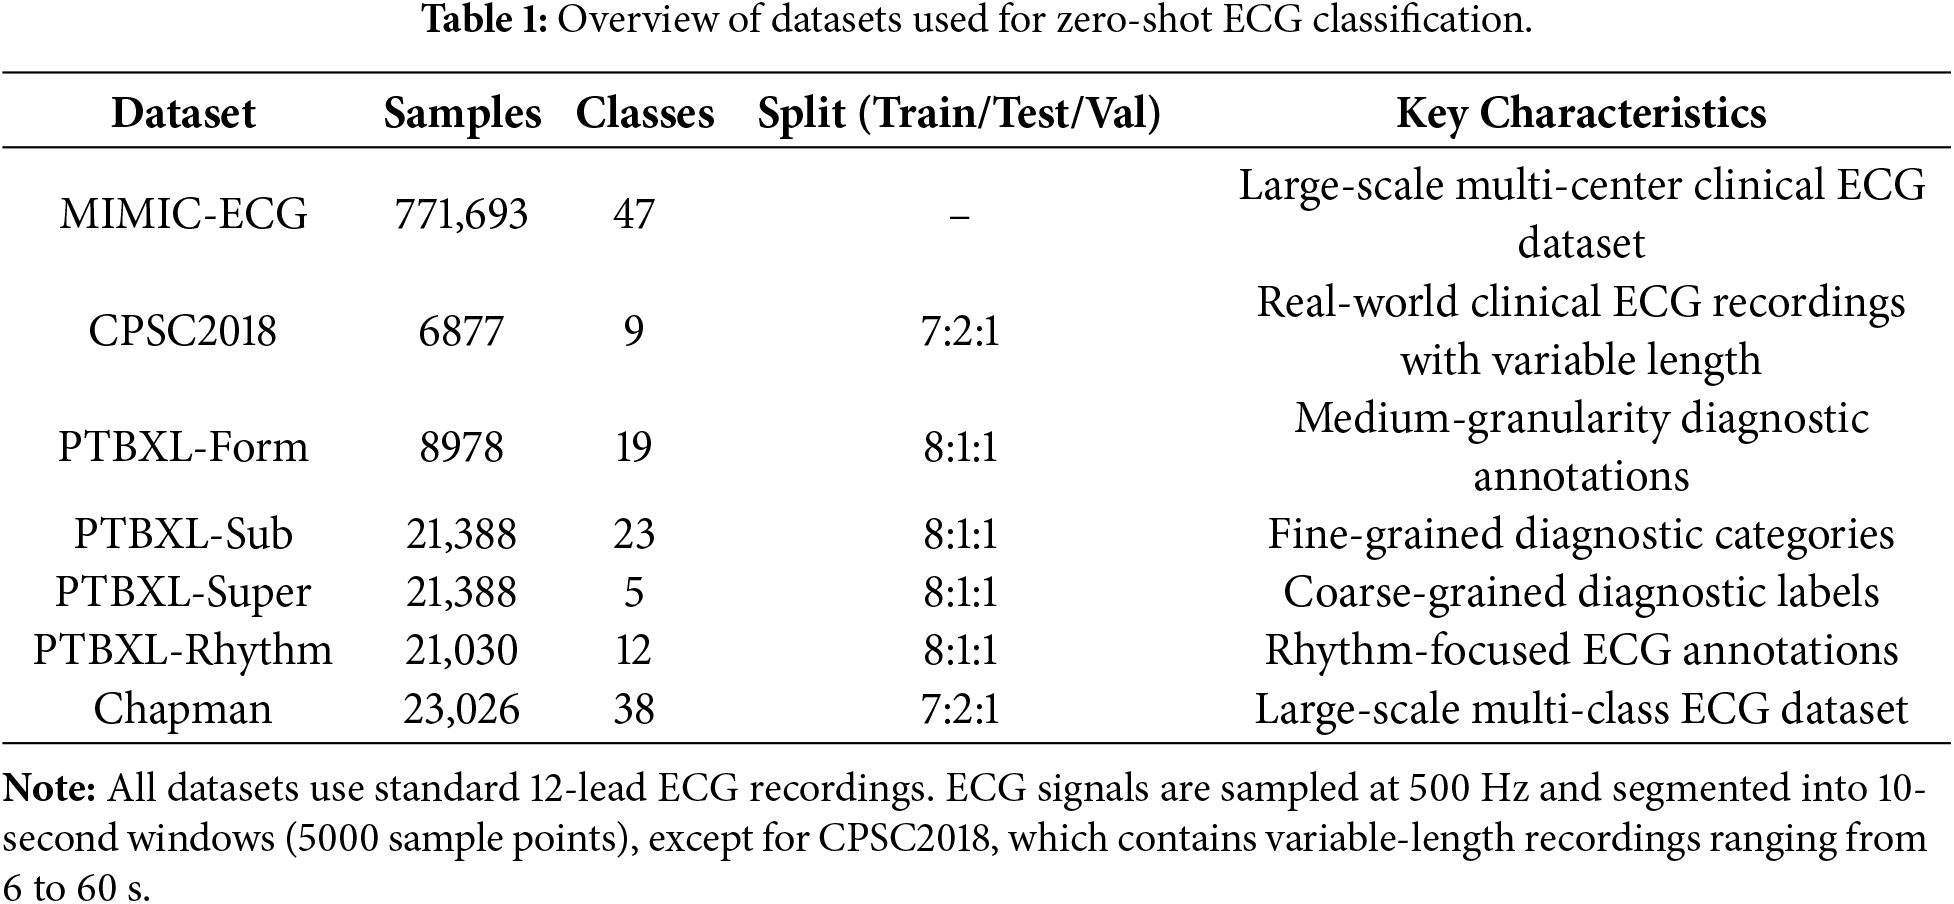
Notably, all datasets exhibit significant class imbalance, consistent with clinical ECG data’s real distribution. Specifically, MIMIC-ECG includes 12 ultra-minority classes (<1%) with dominant classes over 30%; CPSC2018 has 2 ultra-minority classes (e.g., “Other Arrhythmia”) at 0.8%; in the PTBXL series, ultra-minority classes like “Atrial Flutter” (PTBXL-Rhythm) and “Rare Conduction Disorders” (PTBXL-Form) are <0.6%, with only PTBXL-Super (5 classes) showing relative balance; Chapman has a severe long-tailed distribution, with 18 ultra-minority classes (<1%) and top 5 dominant classes making up over 60%. This imbalance poses key challenges for zero-shot classification: models tend to favor dominant classes, fail to learn rare classes’ discriminative features, and traditional contrastive loss is prone to gradient vanishing, worsening unseen rare class classification.
Datasets without official partitions adopt a 7:2:1 train-test-validation split. All models were trained for 20 epochs using the AdamW optimizer with an initial learning rate of
In this experiment, we selected several representative contrastive learning methods as baselines for comparison. To ensure fairness, we implemented all methods using the optimal designs from their original papers. A brief description of each method is provided below:
1. SimCLR [8]: A simple and effective contrastive learning framework that learns visual representations through data augmentation and contrastive loss.
2. BYOL [33]: A self-supervised method that eliminates negative samples by using a target network to guide representation learning.
3. BarlowTwins [34]: A redundancy-reduction learning approach that avoids negative samples while achieving strong performance across vision tasks.
4. MoCo-v3 [35]: The first self-supervised framework enabling effective Vision Transformer training with stronger augmentations and longer training schedules.
5. SimSiam [7]: A simplified architecture that achieves competitive performance in self-supervised learning without relying on negative pairs.
6. TS-TCC [6]: A time-series contrastive learning method that enhances temporal and contextual representation quality without labeled data.
7. CLOCS [9]: A contrastive framework across time, space, and patients, enabling robust ECG representations resilient to inter-patient variability.
8. ASTCL [22]: An adversarial spatiotemporal contrastive learning method that improves ECG classification and anomaly detection.
9. CRT [7]: A self-supervised framework integrating cross-reconstruction and Transformer models to learn high-quality time-series representations.
10. ST-MEM [10]: A masked representation learning framework for ECG signals that captures spatiotemporal dependencies via masked prediction.
11. MERL [15]: A recent ECG contrastive learning baseline leveraging clinical knowledge prompts to achieve state-of-the-art zero-shot performance.
The receiver operating characteristic (ROC) curve was used to evaluate the effectiveness of the proposed method, as defined by the following formula:
where
In this subsection, we evaluate MCCGAA under a cross-dataset zero-shot generalization scenario to validate the transferability of the knowledge learned on the pre-training MIMIC-ECG dataset to completely unseen external clinical environments. The detailed characteristics of the benchmark datasets and the specific extent of class imbalance are summarized in Table 1. First, we present the pre-training results of MCCGAA under two different loss function designs, as shown in Fig. 3.
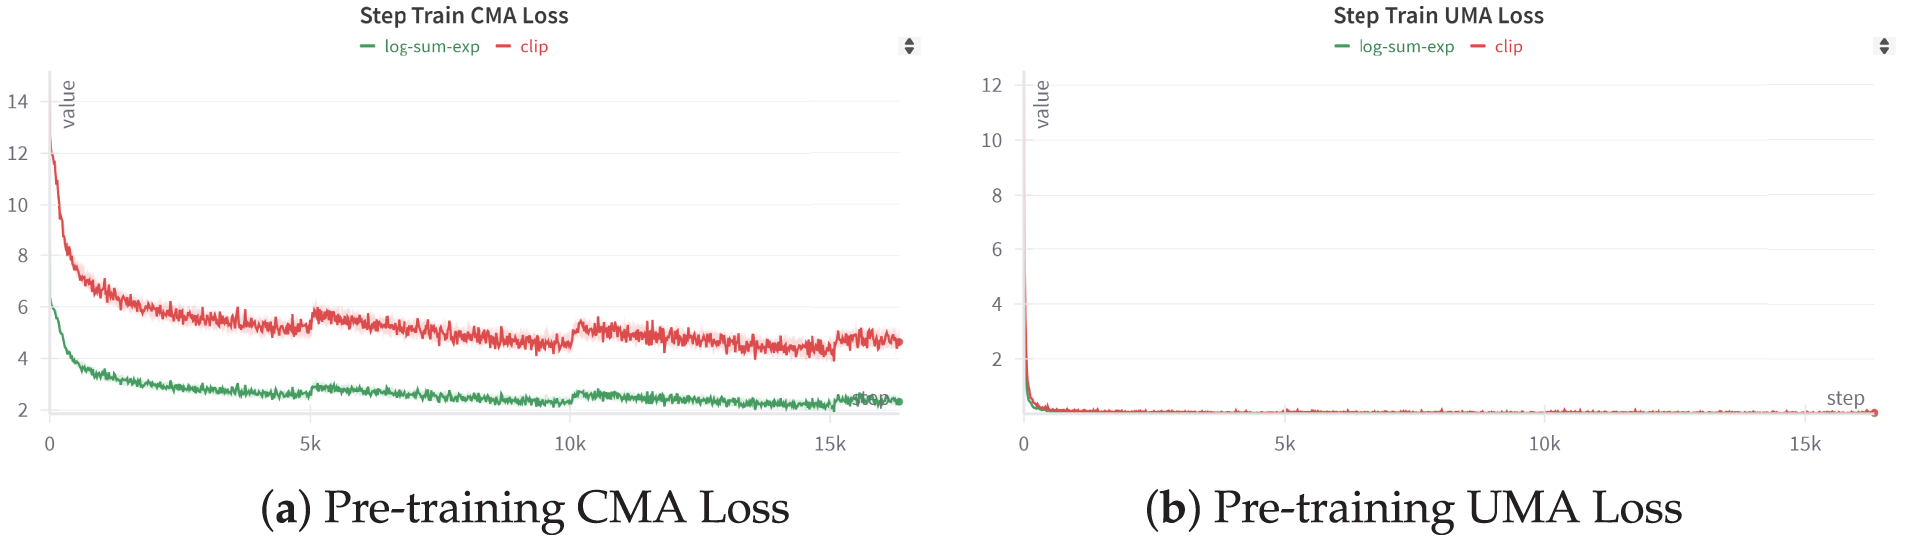
Figure 3: MCCGAA’s pretraining step loss function. Apart from the difference in the loss function, the training process and other designs of MCCGAA remain consistent.
Figure (a) illustrates the iteration of the MCCGAA pretraining cross-modal loss. The log-sum-exp design results in a lower loss than the clip method, demonstrating better convergence. Figure (b) shows the iteration of the MCCGAA ECG regularization layer’s unimodal loss. In contrast to Figure (a), the unimodal loss exhibits better convergence, with the loss nearing equilibrium around the 0-step mark. Similarly, the log-sum-exp design continues to show superior performance.
We evaluate zero-shot ECG classification performance using AUROC, which is threshold-independent and robust to severe class imbalance. The results are summarized in Table 2.
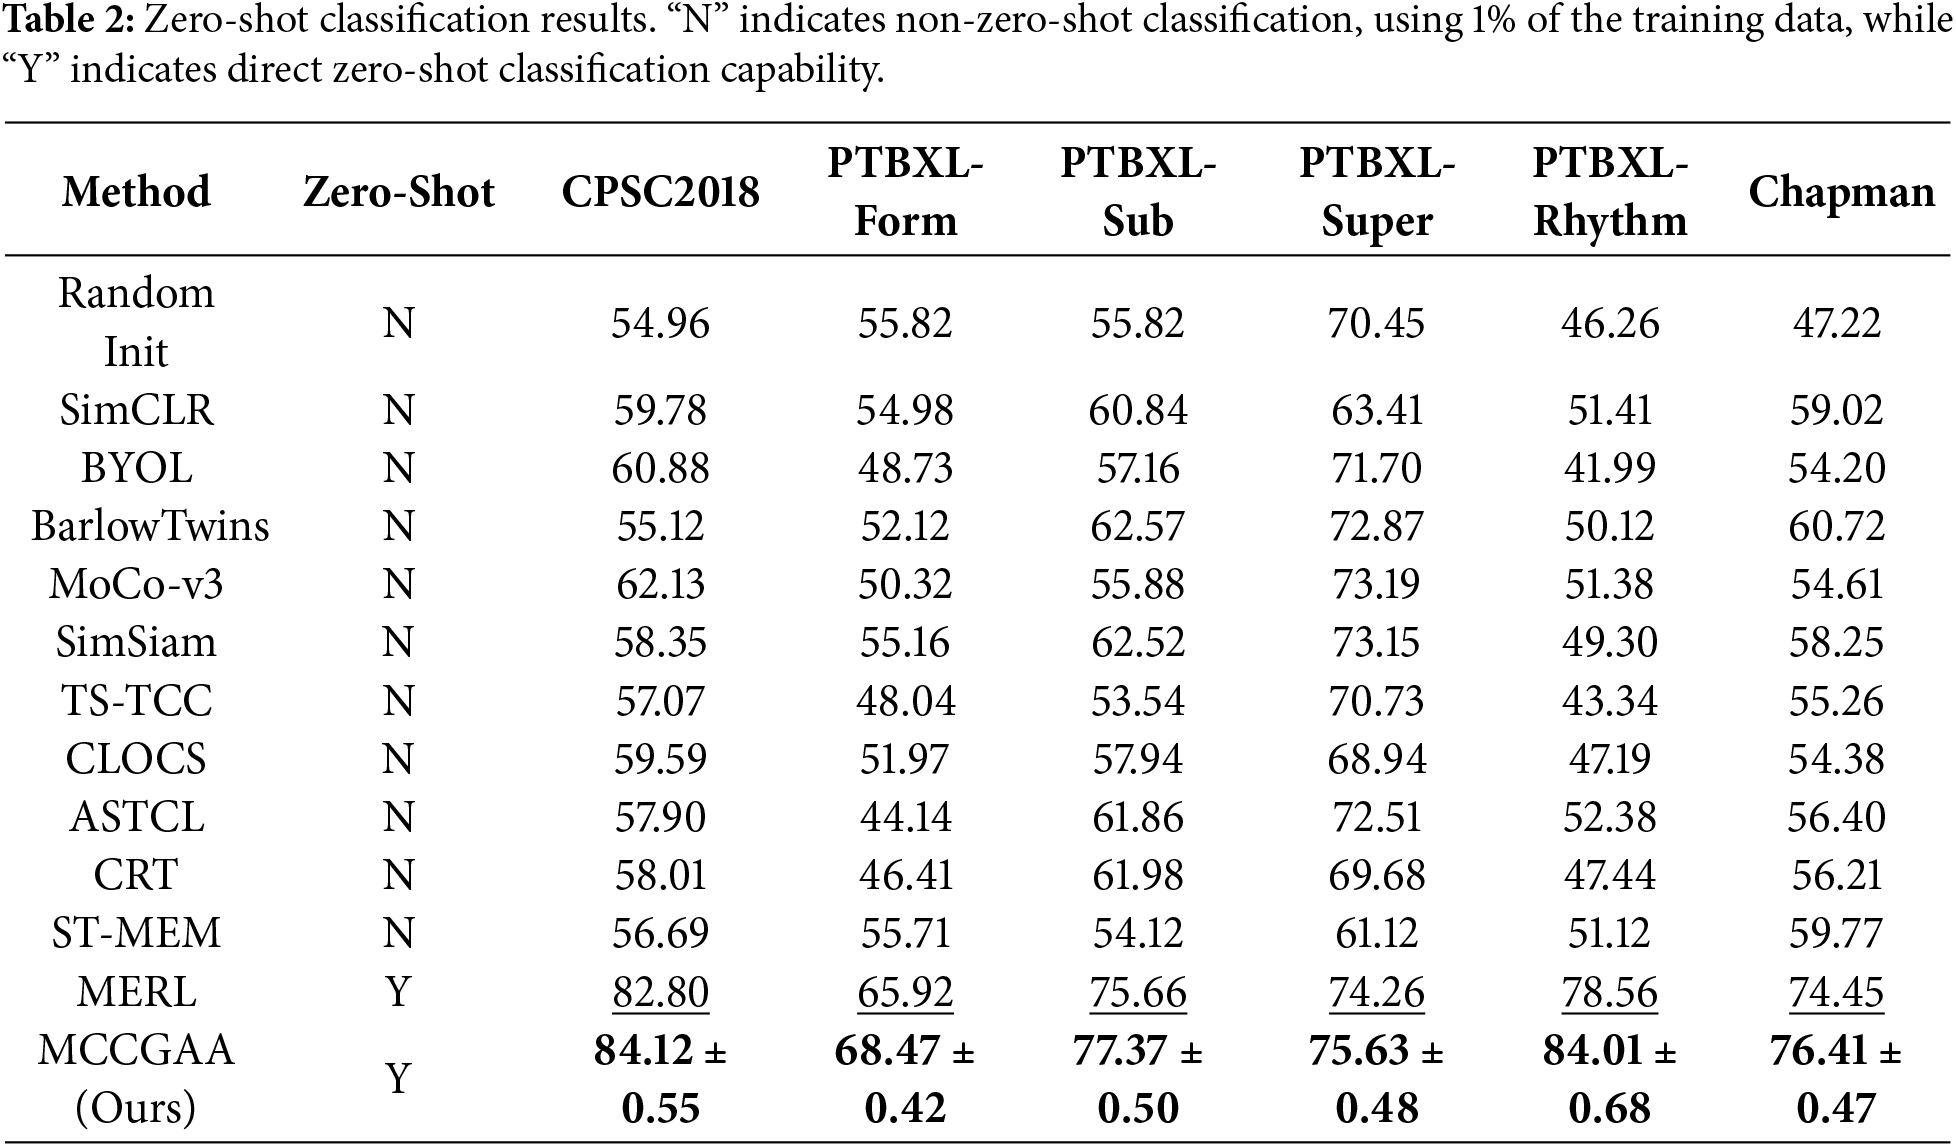
In the zero-shot classification stage, this study strictly follows a cross-dataset zero-shot generalization protocol. Non-zero-shot baselines were evaluated using 1% of the training data, whereas MCCGAA was pre-trained exclusively on MIMIC-ECG and directly evaluated on six external public datasets without any downstream fine-tuning. This setup rigorously tests the model’s ability to generalize to unseen data distributions and different clinical institutions. MCCGAA achieves competitive performance across most downstream tasks. The relatively lower AUC on PTBXL-Super can be attributed to the limited number of samples in this dataset, which constrains the ability of zero-shot models to generalize effectively to unseen classes.
A detailed comparison with MERL, as summarized in Table 2, shows that MCCGAA consistently outperforms MERL across all datasets, yielding an average AUC improvement of 2.37%. The largest gain is observed on PTBXL-Rhythm, with the AUC increasing from 78.56% to 84.59%.
The PTBXL-Rhythm dataset exhibits a highly imbalanced distribution, where a few common rhythm classes dominate most samples while several rare classes constitute less than 1%, posing challenges for robust feature learning. It focuses on rhythm abnormality classification, placing high demands on cross-modal semantic alignment between ECG representations and textual disease descriptions. Ultra-minority classes such as Atrial Flutter account for only 0.5% of samples, making discriminative feature learning difficult without strong semantic guidance.
MERL primarily relies on convolutional ECG encoders and CLIP-style contrastive alignment, which lack an explicit cross-modal topological structure to enforce structured correspondence between ECG embeddings and textual concepts. Under extreme data scarcity, this may lead to fragmented or weak alignment for rare rhythm classes.
In contrast, MCCGAA introduces the GAFA layer to explicitly construct a cross-modal topology between ECG and text embeddings, enabling structured semantic interaction and robust alignment even for ultra-minority categories. Meanwhile, CAM adaptively highlights diagnostically relevant ECG leads, complementing the cross-modal alignment by enhancing signal quality at the representation level. Together, these mechanisms mitigate the impact of sample scarcity and lead to a 6.03% AUC improvement on PTBXL-Rhythm.
4.4 Linear Probing Fine-Tuning
In this subsection, we use the linear probing technique to validate the transfer learning capability of MCCGAA in order to demonstrate the necessity of MCCGAA’s pre-training. Specifically, we freeze most of the layers in MCCGAA and retain only a simple linear layer as the classifier for learning. This operation allows us to preserve as many of the ECG features learned by MCCGAA during the pre-training phase as possible, which are then used for downstream dataset classification. To further emphasize the importance of knowledge transfer learning, we set three levels of downstream task training dataset proportions: 1%, 10%, and 100%. It allows the model to exhibit different learning abilities with varying data distributions at different training data proportions. The experimental results are shown in Table 3.
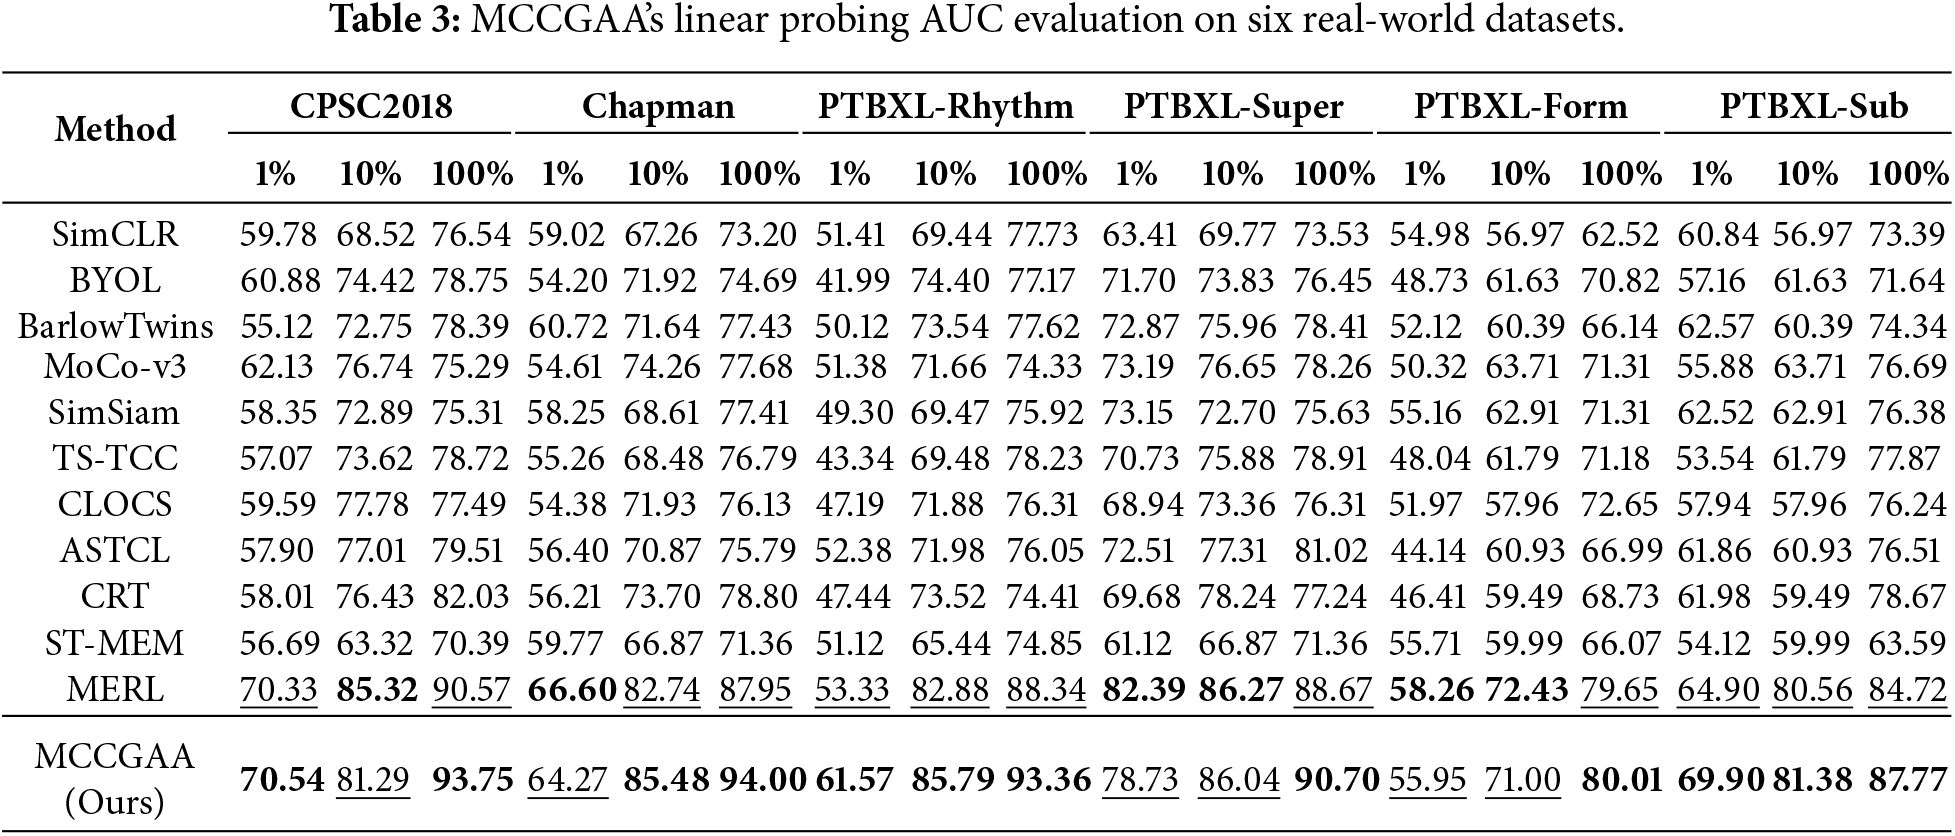
The experiment shows that MCCGAA achieves good evaluation results on most datasets. With a 100% training sample ratio, some datasets experience a significant performance improvement, such as Chapman and PTBXL-Rhythm. Also, relatively good evaluation results are obtained even with a 10% training sample ratio. It is worth noting that the accuracy is lower on the PTBXL-Super and PTBXL-Form datasets, likely due to the fewer categories, making it more difficult for the model to learn this coarse-grained data distribution from the knowledge pre-trained on large datasets, reflecting a domain-specific preference in transfer learning.
Combined with the analysis of dataset scales, the performance patterns of the MCCGAA are clearly observable:
• 1% training data: For small-sample datasets (e.g., CPSC2018 [6877 samples], PTBXL-Form [8978 samples]), performance is notably constrained at 1% data ratio. Larger datasets are less impacted by scarcity. Via pre-trained ECG features, MCCGAA mitigates small-sample shortcomings while outperforming most baselines on larger datasets, highlighting pre-trained features’ universal compensatory value across scales.
• 10% training data: With moderate training data, small-sample datasets’ (CPSC2018, PTBXL-Form) limitations are greatly reduced, performance converging to other datasets. All collectively reach stable performance, with medium/large datasets showing more robust improvements due to foundational data advantages. This confirms combining pre-trained features with moderate data amplifies transfer learning effectiveness.
• 100% training data: With full training data, MCCGAA performs excellently across all datasets. Even CPSC2018/PTBXL-Form (small-sample) overcome bottlenecks via pre-trained features integrated with full task-specific data. Large datasets (e.g., Chapman) show more pronounced advantages via deep feature-sample adaptation, validating pre-training maximizes transfer learning for diverse scales.
In summary, the performance of MCCGAA is jointly affected by training sample proportion and dataset scale: it is sensitive to category complexity in small-sample scenarios, and its performance improves significantly with increasing data volume. This confirms its strong pre-trained feature representation and transfer learning capabilities.
In this subsection, we focus on the interactions and self-stability between different layers of MCCGAA. Specifically, we demonstrate the dependencies among various modules of MCCGAA by replacing or removing the corresponding designs. The experimental design details are as follows:
• MCCGAA w/o GAT attention aggregation: We remove the GAT layer design, directly align ECG and report embeddings across modalities, and then evaluate the zero-shot classification performance under this condition.
• MCCGAA w/o log-sum-exp: We replace MCCGAA’s log-sum-exp design with the CLIP-style loss function and evaluate the zero-shot classification performance under this condition.
• MCCGAA w/o CAM: We remove the CAM channel compression attention design and replace it with the original 1D-ResNet18 design, then evaluate the zero-shot classification performance under this condition.
The ablation results are summarized in Table 4. Removing different components leads to varying degrees of performance degradation across datasets, indicating that each module contributes to MCCGAA through distinct mechanisms.
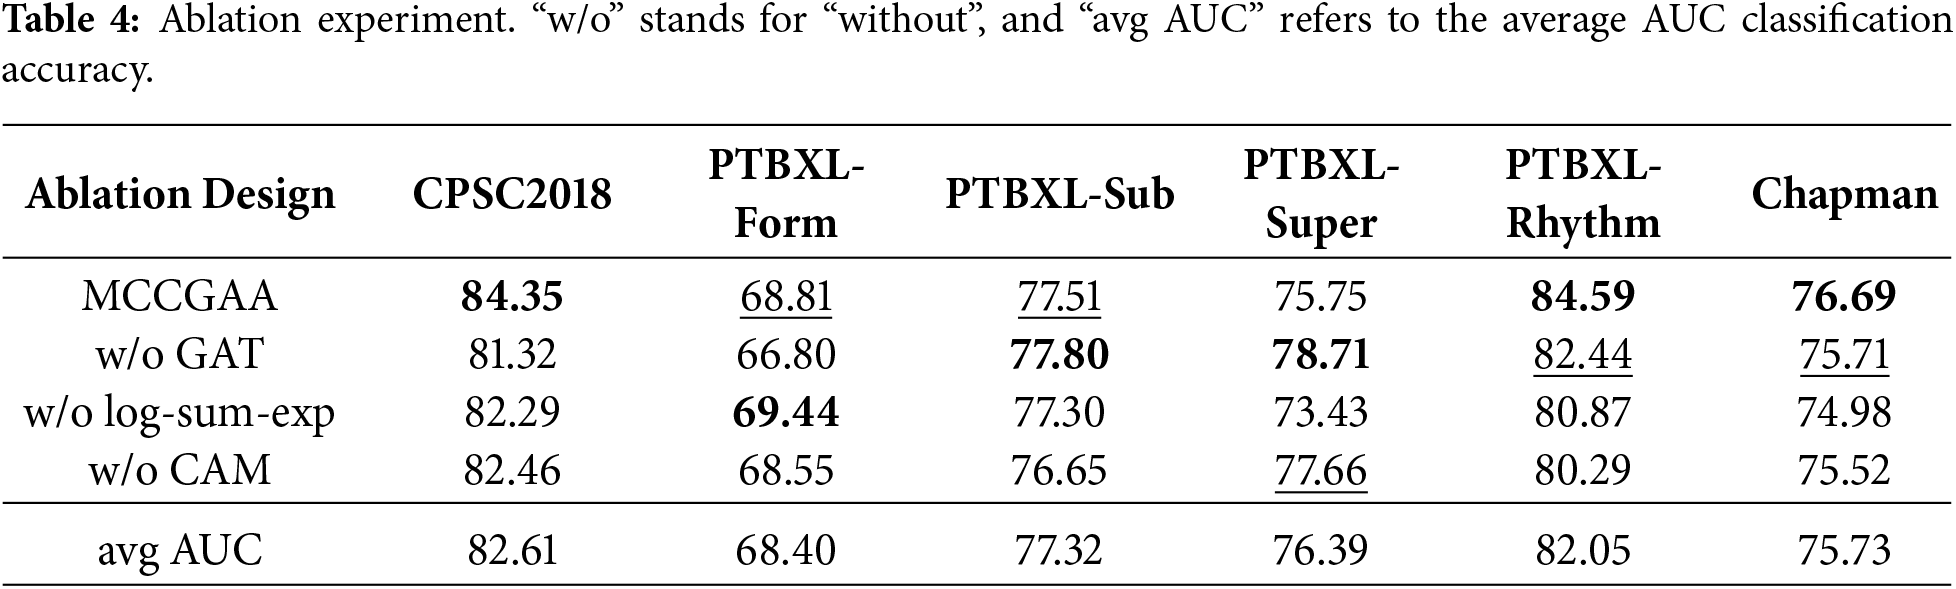
The GAT attention aggregation module models cross-modal topological relationships between ECG and text embeddings. Its removal causes moderate performance drops on datasets with few samples or rare classes, such as CPSC2018, where the AUC decreases by 3.03 points. On most rhythm or multi-class datasets, the decrease is smaller than that observed when removing CAM or replacing the log-sum-exp loss. This suggests that GAT primarily refines cross-modal alignment rather than directly improving feature quality. It can be reasonably inferred that cross-modal topological modeling helps mitigate alignment difficulties for rare-class samples when data is scarce.
The log-sum-exp loss stabilizes gradients and governs the geometry of the embedding space. Replacing it with a CLIP-style loss leads to pronounced AUC drops on imbalanced datasets, e.g., PTBXL-Rhythm, where AUC decreases from 84.59 to 80.87, and Chapman, where AUC decreases from 76.69 to 74.98; the effect is smaller on PTBXL-Super, decreasing from 75.75 to 73.43. This indicates that log-sum-exp provides smoother gradients for scarce rare-class samples, maintaining stable contrastive learning. It can be reasonably inferred that this loss alleviates the masking of rare-class features by dominant-class gradients, thereby enhancing zero-shot classification performance.
The CAM module enhances ECG embeddings via adaptive channel compression and lead-wise attention. Its removal results in the largest performance drop on PTBXL-Rhythm, where AUC decreases from 84.59 to 80.29, and notable decreases on CPSC2018 (from 84.35 to 82.46) and Chapman (from 76.69 to 75.52). This highlights CAM’s role in improving signal quality before cross-modal alignment, particularly in emphasizing critical leads for rare classes and suppressing noise. It can be reasonably inferred that CAM facilitates the extraction of discriminative features for rare classes, which explains the significant performance decline when removed.
For PTBXL-Super, which contains a small number of relatively balanced classes, certain ablations (e.g., w/o GAT) do not substantially reduce performance and may even slightly improve it (78.71 vs. 75.75). This suggests that under balanced conditions, the marginal contribution of higher-level modules is limited, and removing some modules may reduce over-parameterization, allowing the model to focus on robust, coarse-grained discriminative features.
In summary, the components of MCCGAA contribute at different stages of representation learning: CAM and the log-sum-exp loss primarily enhance feature quality and embedding stability, whereas GAT provides complementary gains through cross-modal topology. Combined with large-scale pretraining on MIMIC-ECG, these modules enable MCCGAA to achieve robust zero-shot classification performance across diverse downstream datasets. It can be reasonably inferred that these modules play a key role in mitigating rare-class scarcity and class imbalance.
To further assess the impact of different designs, in keeping other designs unchanged, we evaluated the effect of four basic architectures, ResNet18, ResNet34, ResNet50, and ResNet101, on the ECG feature extraction backbone network. Specifically, we integrated the different architectures using the CAM module, then pre-trained the MCCGAA based on this, and finally evaluated the benchmark dataset in a zero-shot classification task. The results are shown in Table 5:
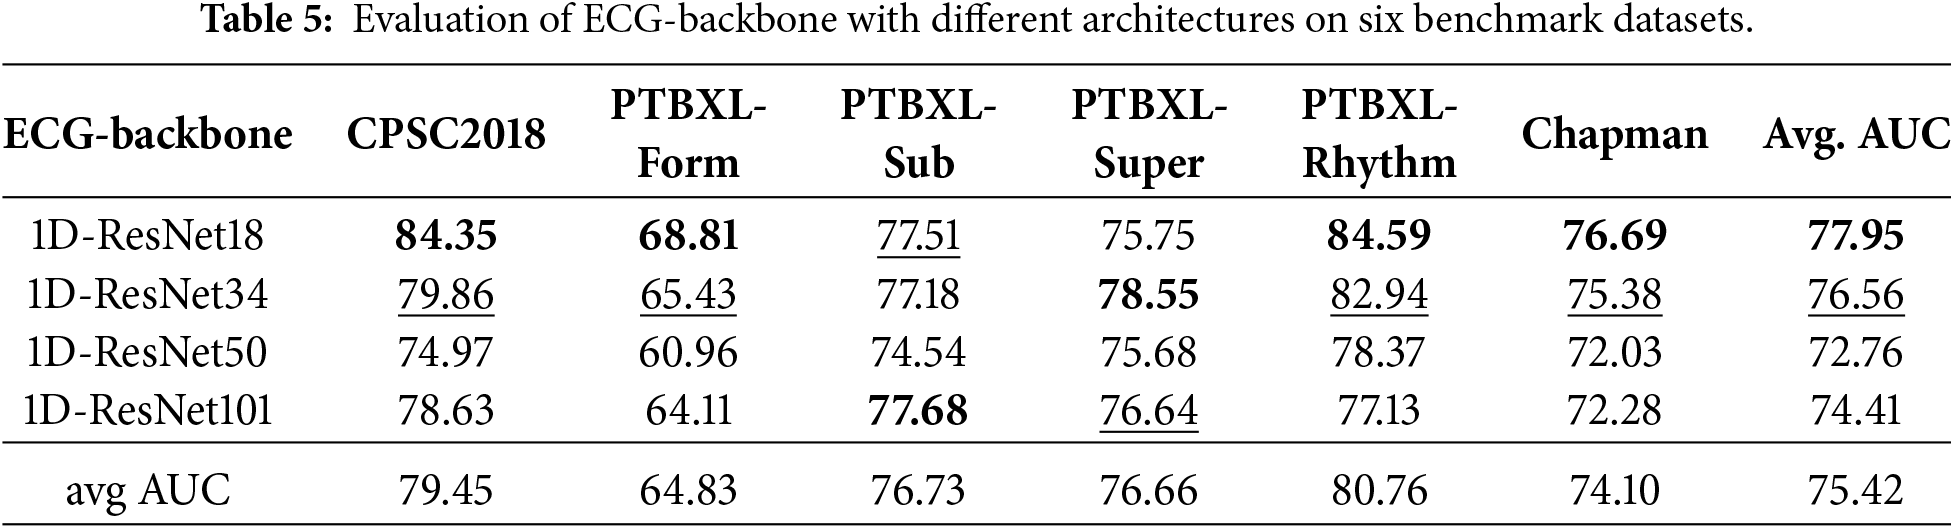
Overall, the 1D-ResNet18 exhibited the highest average AUC, reaching 77.95. On the one hand, as the complexity of the ECG architecture increased, the accuracy across six datasets showed varying degrees of decline. On the other hand, it is worth noting that increasing network complexity led to an accuracy improvement in some datasets, such as PTBXL-Form and PTBXL-Super. The above experimental results suggest that while increasing the complexity of the ECG backbone network may lead to a decline in evaluation accuracy, this overfitting issue seems to be offset by capturing more features, resulting in a certain accuracy improvement. However, more parameters are needed to capture more complex patterns.
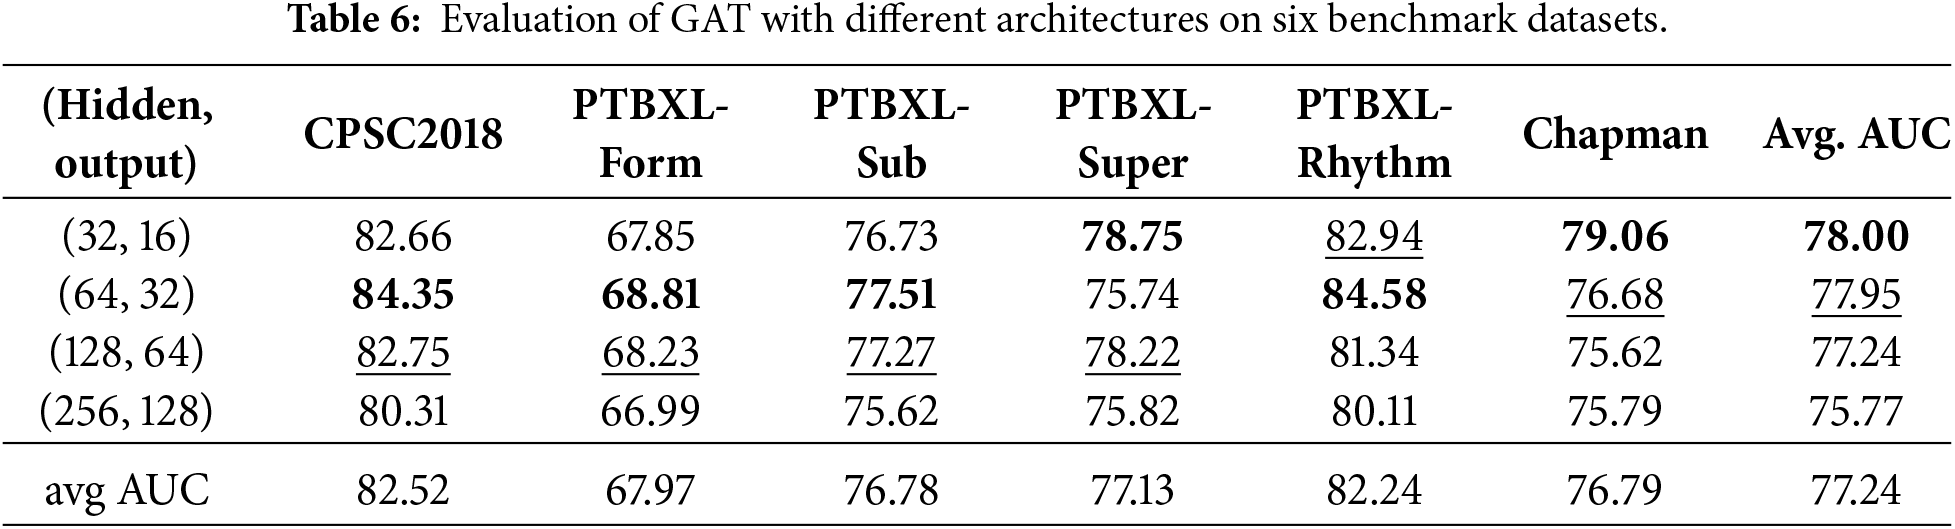
In addition to the above discussion, we also designed experiments to evaluate the stability of the embedding vector representation for GAT, as shown in Table 6. The dimensions of the hidden layers were set to 1/4, 1/2, and 2 times the original embedding vector length, with the output layer length being half of the corresponding hidden layer. Similar to the ECG feature extraction backbone, the results showed that as the hidden layer dimensions increased, some datasets exhibited an AUC that initially increased and then decreased. Furthermore, as the degree of overfitting increased, the datasets generally showed a decline in accuracy, suggesting that high-dimensional hidden layers overly complicate the capture of topological dependencies. However, the design with hidden layer dimensions set to 1/2 achieved relatively good evaluation results.
In this subsection, we analyze the internal working mechanism of MCCGAA from the perspective of feature representation and data flow, aiming to provide an intuitive explanation of how different components contribute to zero-shot classification. We employ t-SNE to visualize the distribution of learned embeddings, which is widely used to qualitatively assess the clustering structure of high-dimensional representations. The t-SNE visualizations of six public datasets are shown in Fig. 4.
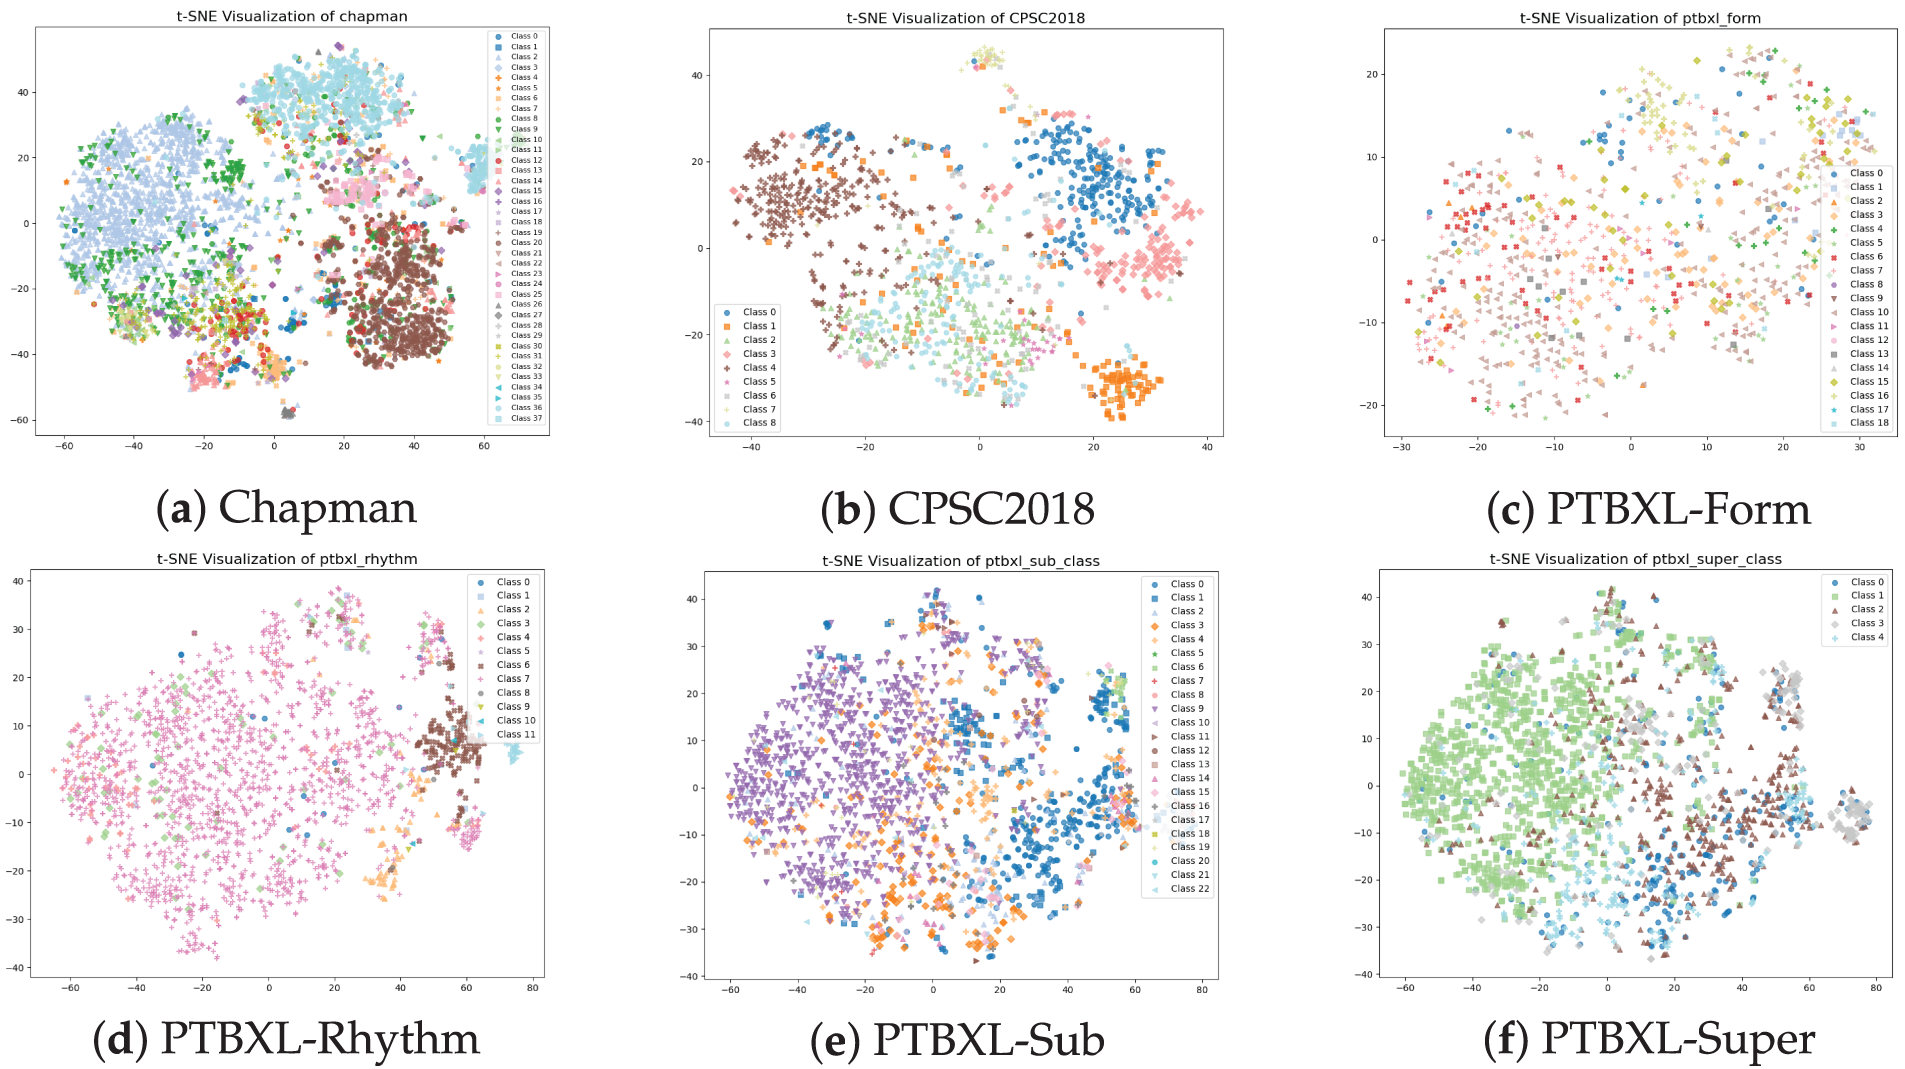
Figure 4: t-SNE visualization of the dataset. The zero-shot classification visualization of MCCGAA on six public datasets shows that the closer the samples of the same class are, the better the classification performance.
As shown in Fig. 4, MCCGAA projects high-dimensional ECG representations into a low-dimensional space where samples from the same category tend to form compact local clusters, while different categories remain relatively separable. This clustering behavior is more evident for classes with relatively sufficient samples, indicating that MCCGAA effectively captures discriminative semantic structures during pretraining and cross-modal alignment.
In contrast, categories with fewer samples generally exhibit weaker clustering behavior. Under pronounced data imbalance, minority classes tend to be scattered or partially overlapped with other categories in the embedding space. This suggests that limited sample availability constrains the model’s ability to learn representative semantic patterns for these classes during pretraining, leading to increased ambiguity in the learned feature space. While MCCGAA achieves robust zero-shot discrimination on most datasets, its performance on small-sample categories (e.g., PTBXL-Form) indicates potential room for improvement in mitigating class imbalance during representation learning.
To further analyze the working principles of MCCGAA, we investigate the dependency between ECG signals and clinical reports at the embedding level. An example from the PTBXL-Rhythm dataset is used to visualize the learned ECG embedding, as shown in Fig. 5.
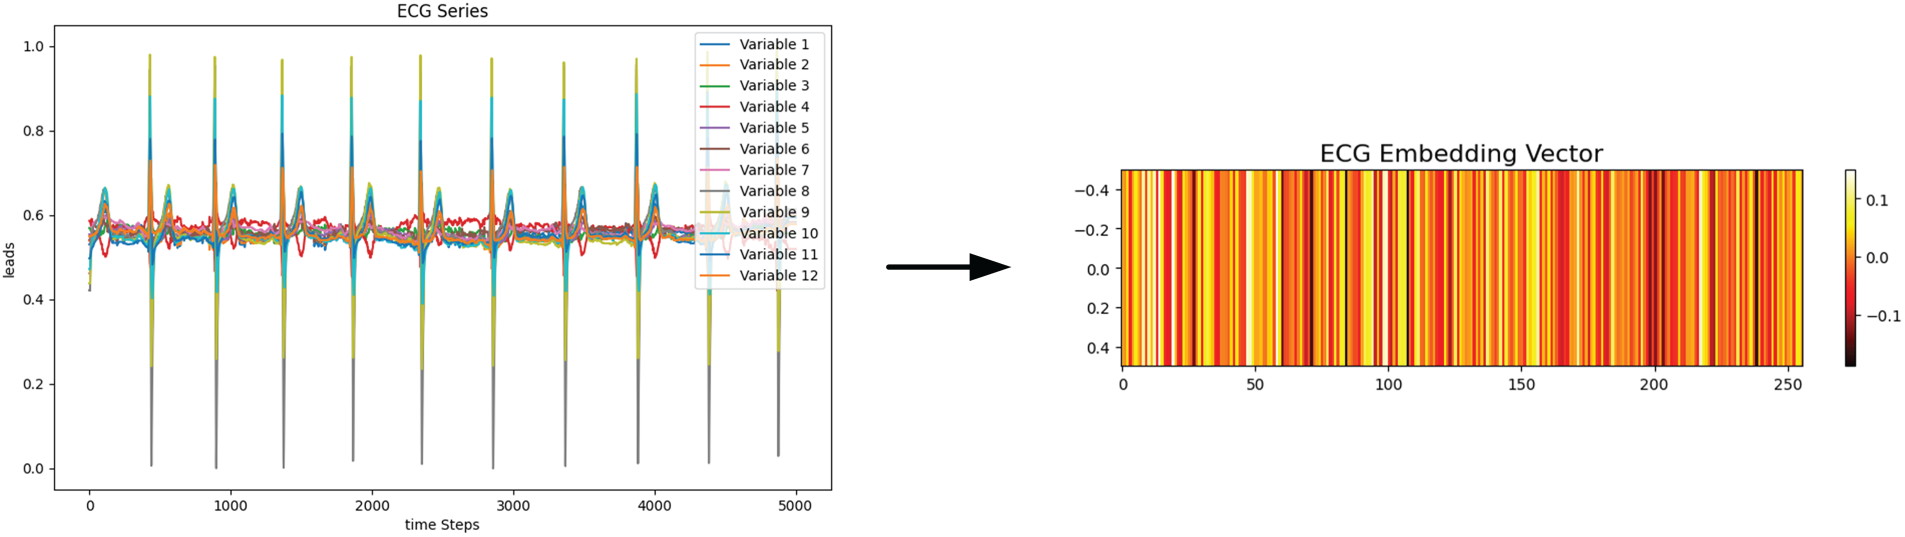
Figure 5: A single ECG sample and its corresponding embedding vector. The ECG sequence with 12 variables is encoded into a 256-dimensional vector, where different color bands in the embedding vector represent distinct feature representations.
The ECG signal is encoded into a 256-dimensional embedding vector exhibiting structured and non-random patterns across dimensions, suggesting that the encoder captures meaningful temporal and morphological characteristics of ECG signals.
Subsequently, we examine the relationship between ECG embeddings and clinical report embeddings by computing their similarity through tensor multiplication, as shown in Fig. 6. Both ECG and clinical report embeddings exhibit consistent structural patterns, and the resulting correlation heatmap shows that ECG embeddings achieve higher similarity with their corresponding clinical categories than with unrelated reports. These results demonstrate that MCCGAA aligns ECG signals and clinical reports in a shared semantic space, enabling zero-shot classification based on embedding similarity rather than explicit label supervision.
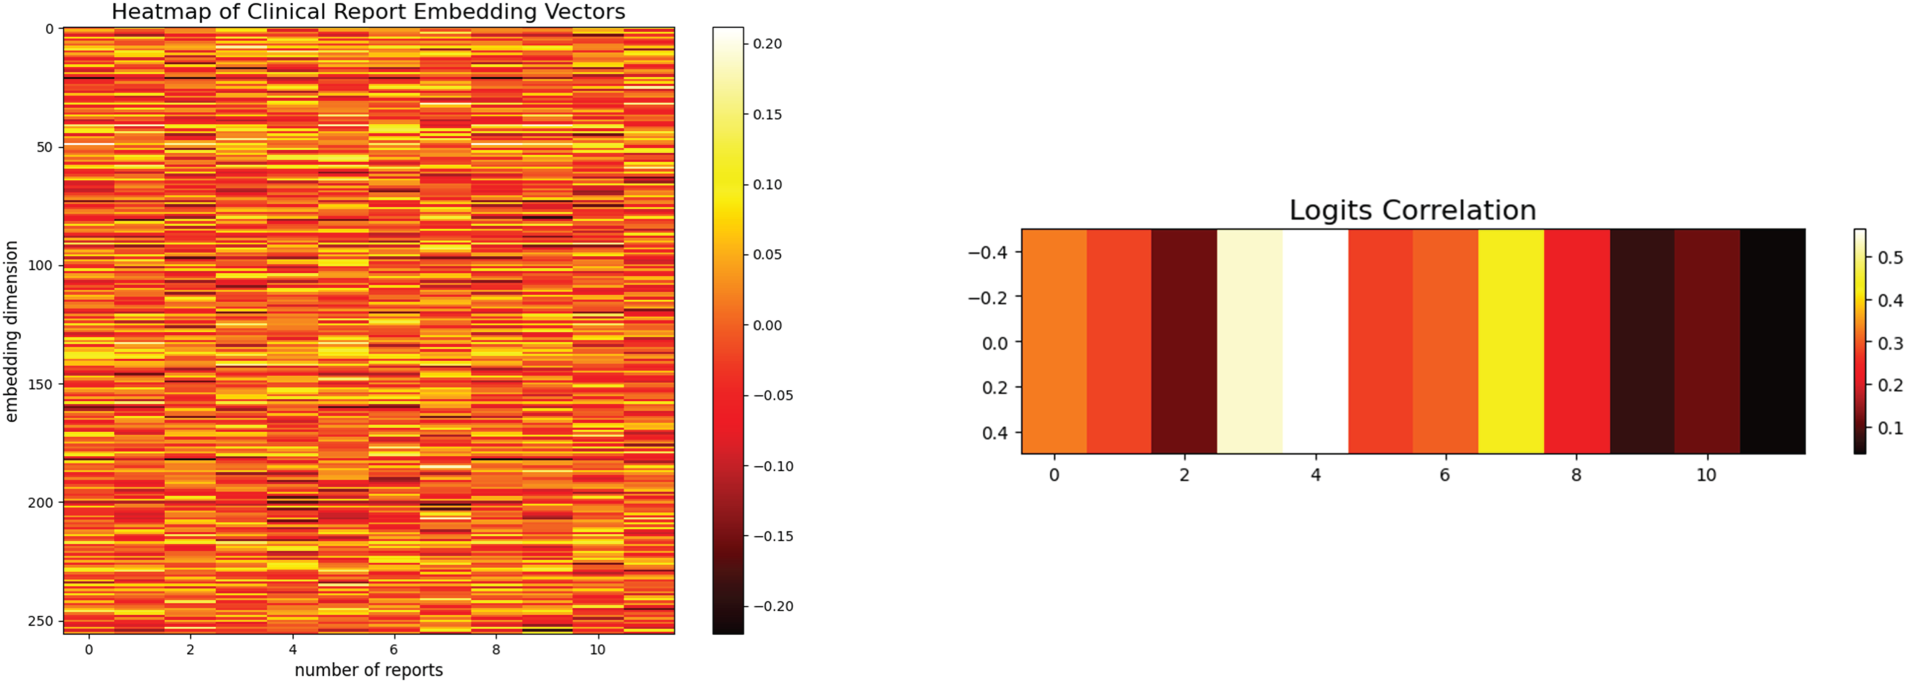
Figure 6: The heatmap of the 256-dimensional embedding representations for 12 clinical reports and their corresponding logits correlation vectors. A stronger logit correlation results in a more vivid color band for the clinical report, while a weaker correlation leads to a less vibrant color.
To further account for the topological correlation between ECG samples and textual reports, Fig. 7 illustrates their dynamic association, which quantifies the similarity between ECG signals and diagnostic texts. The numerical values within the red squares denote the GAT attention weights. The evolution of GAT attention heatmaps in this figure reveals a dynamic alignment process, shifting from diffuse exploration to precise focusing. At the initial stage (Epoch 4), the attention weights remain low (
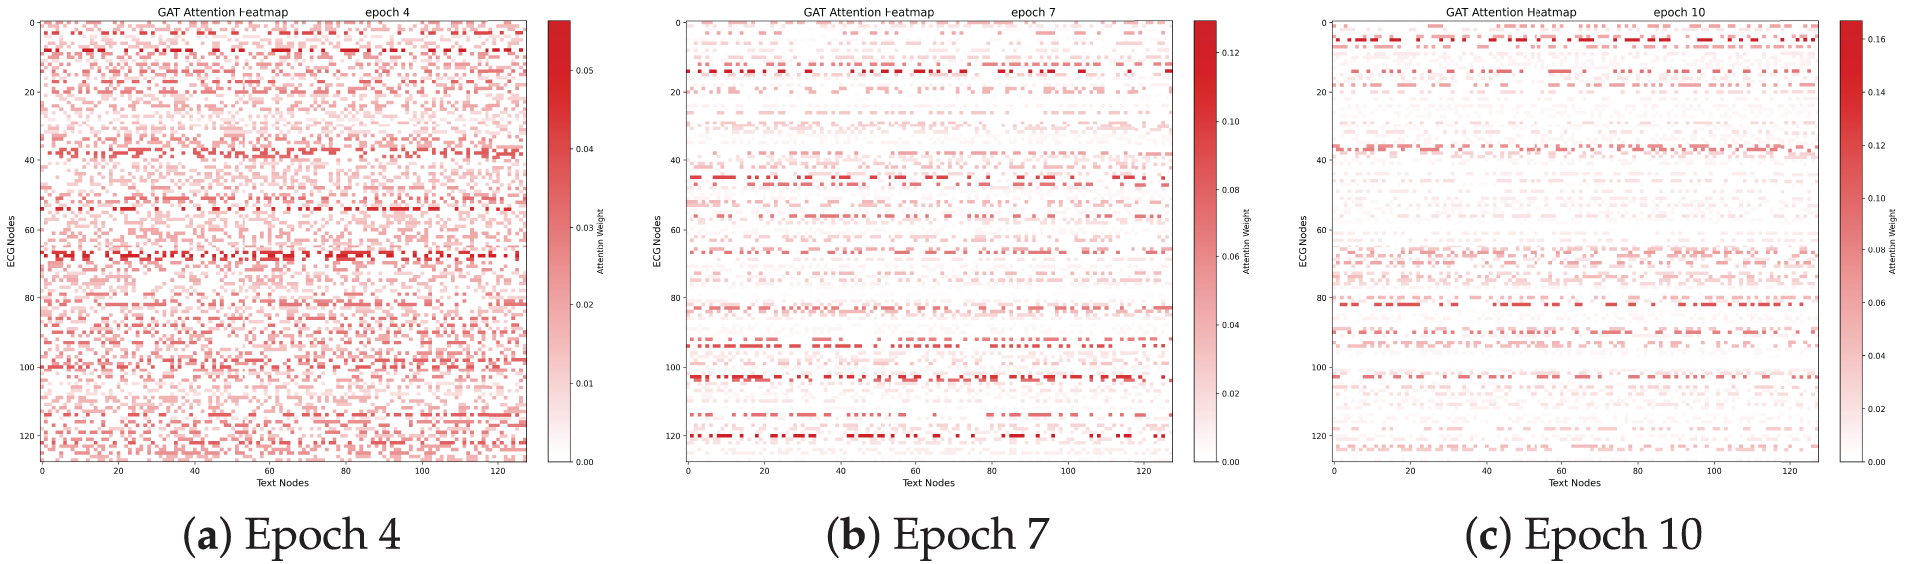
Figure 7: Evolution of GAT attention heatmaps across different training stages. As training progresses from (a) to (c), the attention patterns become increasingly sparse and focused, which visualizes the strengthened spatial topological correlation between ECG signals and textual reports and indicates that the GAFA layer effectively learns to prioritize pivotal diagnostic segments while suppressing modal noise.
The resulting structural sparsity and prominent horizontal “resonance” bands signify the formation of diagnostic anchors. Specifically, specific ECG morphological nodes consistently govern multiple semantic tokens, mimicking the clinical reasoning paradigm where a single waveform abnormality (e.g., an abnormal QRS complex) underpins multiple diagnostic conclusions. This progressive refinement of the internal graph topology confirms that the GAT mechanism captures the intrinsic logical mappings between ECG features and diagnostic semantics, thereby laying a robust and interpretable foundation for zero-shot classification.
To evaluate the zero-shot prediction behavior of MCCGAA at the label level, Fig. 8 illustrates the confusion matrices for three representative categories: ST, RBBB, and AF. For ST, the model exhibits balanced recognition performance with moderate false positives and negatives. Notably, RBBB represents a typical imbalanced category with a significantly low prevalence in the dataset; however, MCCGAA demonstrates remarkable robustness, achieving the highest specificity and the smallest overall classification error despite the scarcity of positive samples. In contrast, AF shows a higher false-positive rate, which may be attributed to overlapping ECG morphological characteristics and the inherent label ambiguity often encountered in multi-label clinical datasets.
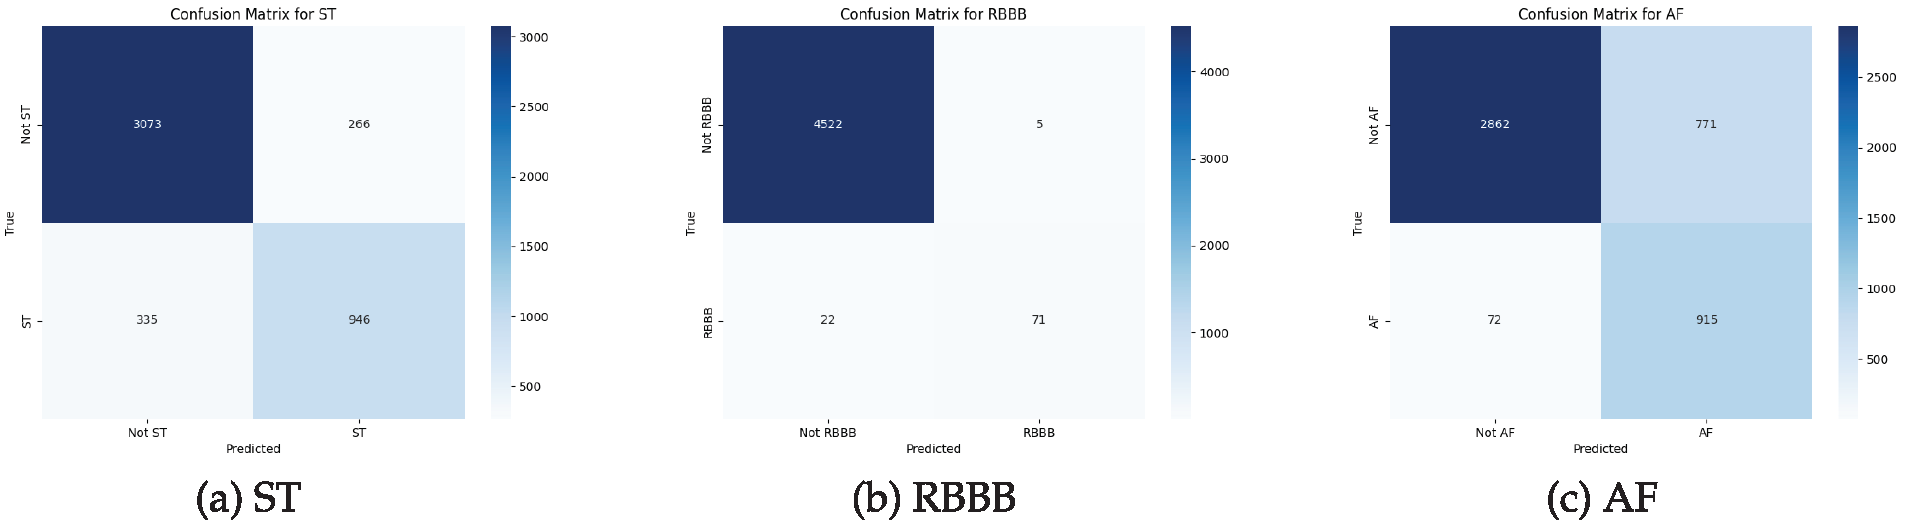
Figure 8: Confusion matrices of MCCGAA for three representative categories in the Chapman dataset. From left to right: (a) ST-segment abnormality, (b) Right bundle branch block, and (c) Atrial fibrillation. Rows represent true labels and columns represent predicted labels.
In this paper, we propose a method named MCCGAA for ECG zero-shot classification. MCCGAA employs a CAM to focus on key lead signals in the design of the ECG feature extraction backbone network, thereby enhancing the learning of ECG embedding representations. For cross-modal alignment, MCCGAA introduces a graph attention feature alignment network to capture the spatial topological dependencies between ECG signals and clinical reports, addressing the insufficient representational power in the alignment process. In the design of the loss function, the log-sum-exp function achieves better evaluation accuracy and convergence than the clip-style approach, thus accelerating the pretraining process of MCCGAA. Experimental results demonstrate that MCCGAA outperforms the latest methods across six public datasets, showing promising potential for improving decision support for ECG zero-shot classification. Furthermore, the robustness and imbalance analyses conducted in this study underscore the model’s practical utility in clinical settings. By maintaining stability under complex noise and reliability in identifying ultra-minority arrhythmias (<1%), MCCGAA ensures consistent and trustworthy decision support in real-world scenarios characterized by long-tailed data distributions.
However, there are some limitations. On the one hand, MCCGAA concatenates the spatial topological dependencies across modalities, which may lead to sparse vectors and an increased risk of overfitting. On the other hand, existing methods for ECG unimodal alignment use dropout layers to generate alignment vectors, but this random dropout of neurons may reduce the model’s interpretability. Future work could focus on improving the spatial topological dependency learning between ECG and clinical report embedding vectors and the design of the alignment loss function between them. One potential research direction is to develop more sophisticated and efficient graph neural networks and loss functions.
Acknowledgement: Not applicable.
Funding Statement: The authors thank the Guizhou Provincial Basic Research Program (Natural Science) for funding this work through Research Group No. QKHJC-ZK(2024)YB062.
Author Contributions: The authors confirm contribution to the paper as follows: study conception and design: Qiuxiao Mou; data collection: Qiuxiao Mou, Haoyu Gui; analysis and interpretation of results: Qiuxiao Mou, Haoyu Gui, Xianghong Tang, Jianguang Lu; draft manuscript preparation: Qiuxiao Mou, Haoyu Gui. All authors reviewed and approved the final version of the manuscript.
Availability of Data and Materials: The code used in this study is available at https://github.com/QXMou1/MCCGAA.
Ethics Approval: Not applicable.
Conflicts of Interest: The authors declare no conflicts of interest.
References
1. Geselowitz DB. On the theory of the electrocardiogram. Proc IEEE. 1989;77(6):857–76. doi:10.1109/5.29327. [Google Scholar] [CrossRef]
2. Baloglu UB, Talo M, Yildirim O, San Tan R, Acharya UR. Classification of myocardial infarction with multi-lead ECG signals and deep CNN. Pattern Recogn Lett. 2019;122:23–30. doi:10.1016/j.patrec.2019.02.016. [Google Scholar] [CrossRef]
3. Lu H, Ong K, Chia P. An automated ECG classification system based on a neuro-fuzzy system. In: Computers in cardiology 2000. Vol. 27. Piscataway, NJ, USA: IEEE; 2000. p. 387–90 doi: 10.1109/cic.2000.898538. [Google Scholar] [CrossRef]
4. Kiranyaz S, Ince T, Hamila R, Gabbouj M. Convolutional neural networks for patient-specific ECG classification. In: 2015 37th Annual International Conference of the IEEE Engineering in Medicine and Biology Society (EMBC). Piscataway, NJ, USA: IEEE; 2015. p. 2608–11. [Google Scholar]
5. Hou B, Yang J, Wang P, Yan R. LSTM-based auto-encoder model for ECG arrhythmias classification. IEEE Trans Instrument Measur. 2019;69(4):1232–40. doi:10.1109/tim.2019.2910342. [Google Scholar] [CrossRef]
6. Eldele E, Ragab M, Chen Z, Wu M, Kwoh CK, Li X, et al. Time-series representation learning via temporal and contextual contrasting. arXiv:2106.14112. 2021. [Google Scholar]
7. Zhang W, Yang L, Geng S, Hong S. Self-supervised time series representation learning via cross reconstruction transformer. IEEE Trans Neural Netw Learn Syst. 2024;35(11):16129–38. doi:10.1109/tnnls.2023.3292066. [Google Scholar] [PubMed] [CrossRef]
8. Chen T, Kornblith S, Norouzi M, Hinton G. A simple framework for contrastive learning of visual representations. In: International Conference on Machine Learning. London, UK: PMLR; 2020. p. 1597–607. [Google Scholar]
9. Kiyasseh D, Zhu T, Clifton DA. Clocs: contrastive learning of cardiac signals across space, time, and patients. In: International Conference on Machine Learning. London, UK: PMLR; 2021. p. 5606–15. [Google Scholar]
10. Na Y, Park M, Tae Y, Joo S. Guiding masked representation learning to capture spatio-temporal relationship of electrocardiogram. arXiv:2402.09450. 2024. [Google Scholar]
11. Xie X, Liu H, Shu M, Zhu Q, Huang A, Kong X, et al. A multi-stage denoising framework for ambulatory ECG signal based on domain knowledge and motion artifact detection. Future Generat Comput Systs. 2021;116:103–16. doi:10.1016/j.future.2020.10.024. [Google Scholar] [CrossRef]
12. Liu C, Wan Z, Cheng S, Zhang M, Arcucci R. ETP: learning transferable ECG representations via ECG-text pre-training. In: ICASSP 2024-2024 IEEE International Conference on Acoustics, Speech and Signal Processing (ICASSP). Piscataway, NJ, USA: IEEE; 2024. p. 8230–4. [Google Scholar]
13. Lalam SK, Kunderu HK, Ghosh S, Kumar H, Awasthi S, Prasad A, et al. ECG representation learning with multi-modal EHR data. Trans Mach Learn Res. 2023. [Google Scholar]
14. Huang SC, Pareek A, Jensen M, Lungren MP, Yeung S, Chaudhari AS. Self-supervised learning for medical image classification: a systematic review and implementation guidelines. npj Digit Med. 2023;6(1):74. doi:10.1038/s41746-023-00811-0. [Google Scholar] [PubMed] [CrossRef]
15. Liu C, Wan Z, Ouyang C, Shah A, Bai W, Arcucci R. Zero-shot ECG classification with multimodal learning and test-time clinical knowledge enhancement. arXiv:2403.06659. 2024. [Google Scholar]
16. Safarbali B, Golpayegani SMRH. Nonlinear dynamic approaches to identify atrial fibrillation progression based on topological methods. Biomed Signal Process Control. 2019;53:101563. doi:10.1016/j.bspc.2019.101563. [Google Scholar] [CrossRef]
17. Scarselli F, Gori M, Tsoi AC, Hagenbuchner M, Monfardini G. The graph neural network model. IEEE Trans Neural Netw. 2008;20(1):61–80. doi:10.1109/tnn.2008.2005605. [Google Scholar] [PubMed] [CrossRef]
18. Chen T, Hong R, Guo Y, Hao S, Hu B. MS2-GNN: exploring GNN-based multimodal fusion network for depression detection. IEEE Trans Cybern. 2022;53(12):7749–59. doi:10.1109/tcyb.2022.3197127. [Google Scholar] [PubMed] [CrossRef]
19. Siontis KC, Noseworthy PA, Attia ZI, Friedman PA. Artificial intelligence-enhanced electrocardiography in cardiovascular disease management. Nature Rev Cardiol. 2021;18(7):465–78. doi:10.1038/s41569-020-00503-2. [Google Scholar] [PubMed] [CrossRef]
20. Din S, Qaraqe M, Mourad O, Qaraqe K, Serpedin E. ECG-based cardiac arrhythmias detection through ensemble learning and fusion of deep spatial-temporal and long-range dependency features. Artif Intell Med. 2024;150:102818. doi:10.1016/j.artmed.2024.102818. [Google Scholar] [PubMed] [CrossRef]
21. Hyvarinen A, Morioka H. Unsupervised feature extraction by time-contrastive learning and nonlinear ICA. In: 30th Conference on Neural Information Processing Systems (NIPS 2016); 2016 Dec 5–10; Barcelona, Spain. p. 1–9. [Google Scholar]
22. Wang N, Feng P, Ge Z, Zhou Y, Zhou B, Wang Z. Adversarial spatiotemporal contrastive learning for electrocardiogram signals. IEEE Trans Neural Netw Learn Syst. 2024;35(10):13845–59. doi:10.1109/tnnls.2023.3272153. [Google Scholar] [PubMed] [CrossRef]
23. Liu Y, Li Z, Pan S, Gong C, Zhou C, Karypis G. Anomaly detection on attributed networks via contrastive self-supervised learning. IEEE Trans Neural Netw Learn Syst. 2021;33(6):2378–92. doi:10.1109/tnnls.2021.3068344. [Google Scholar] [PubMed] [CrossRef]
24. Ge Z, Cheng H, Tong Z, He Z, Alhudhaif A, Polat K, et al. A knowledge-driven graph convolutional network for abnormal electrocardiogram diagnosis. Knowl Based Syst. 2024;296(1):111906. doi:10.1016/j.knosys.2024.111906. [Google Scholar] [CrossRef]
25. Ahmad Z, Tabassum A, Guan L, Khan N. ECG heart-beat classification using multimodal image fusion. In: ICASSP 2021-2021 IEEE International Conference on Acoustics, Speech and Signal Processing (ICASSP). Piscataway, NJ, USA: IEEE; 2021. p. 1330–4. [Google Scholar]
26. Radford A, Kim JW, Hallacy C, Ramesh A, Goh G, Agarwal S, et al. Learning transferable visual models from natural language supervision. In: International Conference on Machine Learning. London, UK: PMLR; 2021. p. 8748–63. [Google Scholar]
27. Liu C, Ding Z, Liu Z, Huang Z. Two-stage contrastive language electrocardiogram pre-training for fine-grained waveform features. In: 1st ICML Workshop on Foundation Models for Structured Data. London, UK: PMLR; 2025. p. 1–10. [Google Scholar]
28. Dehmamy N, Barabási AL, Yu R. Understanding the representation power of graph neural networks in learning graph topology. In: Advances in neural information processing systems. London, UK: PMLR; 2019. [Google Scholar]
29. Gow B, Pollard T, Nathanson LA, Johnson A, Moody B, Fernandes C, et al. Mimic-iv-ECG-diagnostic electrocardiogram matched subset (version 1.0). PhysioNet. 2023;RRID:SCR_007345. [Google Scholar]
30. Liu F, Liu C, Zhao L, Zhang X, Wu X, Xu X, et al. An open access database for evaluating the algorithms of electrocardiogram rhythm and morphology abnormality detection. J Med Imag Health Inform. 2018;8(7):1368–73. doi:10.1166/jmihi.2018.2442. [Google Scholar] [CrossRef]
31. Wagner P, Strodthoff N, Bousseljot RD, Kreiseler D, Lunze FI, Samek W, et al. PTB-XL, a large publicly available electrocardiography dataset. Scientific Data. 2020;7(1):1–15. doi:10.1038/s41597-020-0495-6. [Google Scholar] [PubMed] [CrossRef]
32. Zheng J, Guo H, Chu H. A large scale 12-lead electrocardiogram database for arrhythmia study (version 1.0.0). PhysioNet. 2022;RRID:SCR_007345. doi:10.1038/s41597-020-0386-x. [Google Scholar] [CrossRef]
33. Grill JB, Strub F, Altché F, Tallec C, Richemond P, Buchatskaya E, et al. koray kavukcuoglu, Remi Munos, and Michal Valko. Bootstrap your own latent-a new approach to self-supervised learning. Adv Neural Inform Process Syst. 2020;33:21271–84. [Google Scholar]
34. Zbontar J, Jing L, Misra I, LeCun Y, Deny S. Barlow twins: self-supervised learning via redundancy reduction. In: International Conference on Machine Learning. London, UK: PMLR; 2021. p. 12310–20. [Google Scholar]
35. Chen X, Xie S, He K. An empirical study of training self-supervised vision transformers. In: Proceedings of the IEEE/CVF International Conference on Computer Vision. Piscataway, NJ, USA: IEEE; 2021. p. 9640–9. [Google Scholar]
Cite This Article
 Copyright © 2026 The Author(s). Published by Tech Science Press.
This work is licensed under a Creative Commons Attribution 4.0 International License , which permits unrestricted use, distribution, and reproduction in any medium, provided the original work is properly cited.
 Downloads
 Citation Tools