
 Submit a Paper
 Propose a Special lssue
 Open Access
ARTICLE

Location and Object Aware Model for Parallel Activity Recognition in Multi-Resident Smart Homes
1 Department of Computer Science, National University of Computer and Emerging Sciences, Islamabad, Pakistan
2 Department of Artificial Intelligence and Data Science, National University of Computer and Emerging Sciences, Islamabad, Pakistan
3 School of Computer Science SCS, Taylor’s University SDN BHD, Subang Jaya, Selangor, Malaysia
4 Office of Research and Development, Asia University, Taichung, Taiwan
5 School of Computing, Engineering and the Build Environment, Sir David Bell Building, University of Roehampton, London, UK
* Corresponding Author: Mamoona Humayun. Email:
Computers, Materials & Continua 2026, 87(3), 83 https://doi.org/10.32604/cmc.2026.076379
Received 19 November 2025; Accepted 27 February 2026; Issue published 09 April 2026
 View Full Text
 Download PDF
Abstract
Smart homes enable elderly individuals and people with impairments to live independently through remote monitoring of their activities. Sequences of sensor activations are mapped with their associated labels to recognize different activities. Activity recognition in a multi-resident environment is challenging due to multiple activities performed by different residents in parallel. A novel multi-resident activity recognition approach is proposed to separate the sensor events based on their location. A spatial matrix is generated to capture the spatial and temporal patterns of the activities, and activations of sensors are recorded as binary values. The spatial matrix is converted into images to represent parallel activities as multiple objects within each image. Activities are annotated within each image based on their location and sequence patterns. The YOLO (You Only Look Once) model is deployed to recognize parallel activities from the activity images. Experimental evaluation on the CASAS dataset shows a performance improvement of 7 percent compared with existing state-of-the-art approaches.Keywords
The world’s aging population poses different challenges to the healthcare system. Providing dedicated medical facilities to every elderly individual is not feasible. Therefore, the focus has shifted to enabling elderly people to live independently in their homes through remote monitoring [1,2]. One of the most promising technologies for remote monitoring is the smart home, which is equipped with binary switch sensors to monitor the daily activities of its residents. Sensors such as motion, temperature, pressure, door, and light sensors are installed throughout the house within different locations such as the kitchen, living room, bedroom, and washroom. Resident movement across different locations and interaction with different items are recorded through these sensors [3–5]. Sequences of sensor activations form distinct patterns during different activities. Activities are recognized by mapping these patterns to their corresponding activity labels [6].
Activity recognition can either be single-resident or multi-resident, depending on the number of residents residing in the smart home [7–9]. In single-resident environments, activity recognition is relatively simple because each sequence of sensor activations corresponds to a single resident. However, real-world smart homes often contain multiple residents who perform different activities simultaneously [10–12]. In multi-resident smart home datasets, two types of activity labels are commonly used: resident-specific labels and common labels. Resident-specific labels explicitly include both the resident identity and the activity (e.g., R1 sleep, R1 bed-to-toilet), allowing activities to be attributed to a particular resident. In contrast, common labels describe the activity only (e.g., cooking, watching TV, studying), without specifying which resident information. In the current research, we utilize the original labeling scheme provided in the dataset. This means that activities with resident-specific labels enable resident identification, whereas activities with common labels do not reveal the resident’s identity. When two or more residents perform different activities in parallel, the generated sensor data is combined for all the residents. An example of parallel activities with combined sensor events is illustrated in Fig. 1, and a sample dataset is shown in Fig. 2. Two different activities, meal preparation and watching TV, are performed by two residents at two different locations at the same time. Meal preparation activity is performed in the kitchen, and watching TV in the living room. The sensor activation sequences for both activities are common, containing sensors from both locations. Sensors corresponding to each activity location are shown with different colors. For instance, in the meal preparation activity, sensors M016, M017, M018, and M019 are located in the kitchen, whereas in the watching TV activity, sensors M07 and M09 are located in the living room. A common sequence of sensor events is used for recognizing both activities. Therefore, in multi-resident activity recognition, associating each sensor event with the correct activity from the combined sensor activations of parallel activities remains a challenging task.
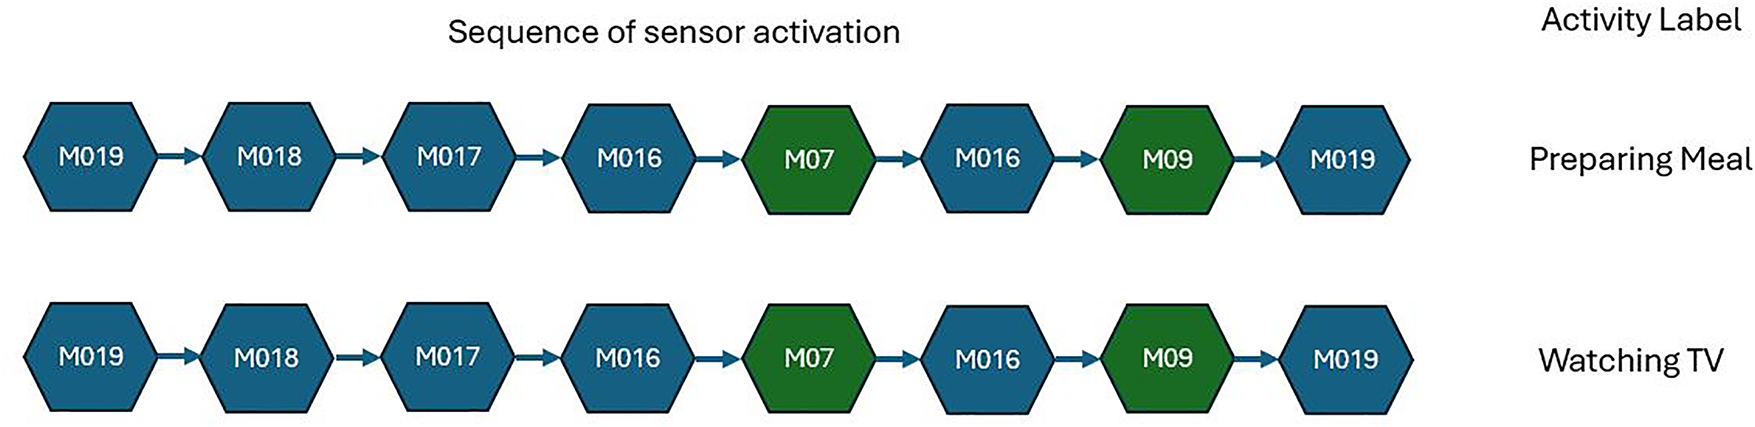
Figure 1: Sequence of sensor activation for two parallel activities, preparing a meal and watching TV. Green sensors are in the living room and related to watching TV activity, and blue sensors are located in the kitchen and related to preparing a meal activity.
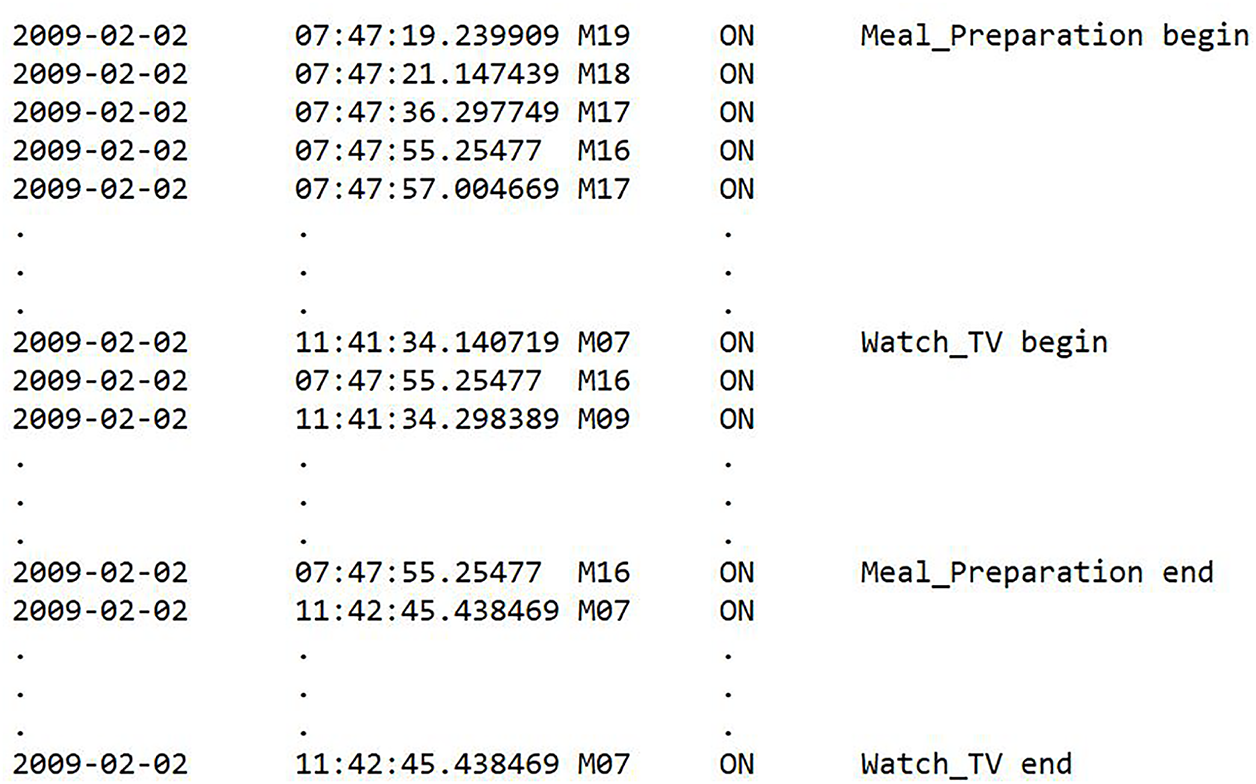
Figure 2: Sample of sensor activation of two parallel activities.
Various approaches have been studied in the literature to address the challenges of multi-resident HAR in smart homes. These methods include probabilistic models [13], deep learning models [14], and ensemble models [15]. Probabilistic models such as Hidden Markov Models (HMM) and Conditional Random Fields (CRF) have been used to model the movement of residents between different sensors as sensor transition probabilities and to predict activity sequences. Resident movement to the next sensor is predicted based on their current sensor. Patterns for different activities are mapped by learning the sequence of transitions between different sensors. However, these models are unable to learn activities spanning longer durations, as they learn only the next probable sensor state based on the current state. Convolutional Neural Networks (CNN) map the location of different sensors; however, sequences of sensor activations are not learned. Recurrent Neural Networks (RNNs) map the sequence of sensor activations for activities with longer durations, utilizing memory gate capabilities. Long Short-Term Memory (LSTM) and Gated Recurrent Unit (GRU) models learn activities with fixed performance patterns. However, performance sequences for each resident performing the same activity vary. Bidirectional variants of LSTM and GRU are useful for learning multiple patterns of the same activity.
Furthermore, ensembles of different variants of RNNs, such as stacking and cascading, are also studied to utilize the capabilities of all the models. RNN models and their ensembles recognize activities with longer durations and varying performance patterns. However, RNN models are unable to learn and separate specific sensor events for each activity from parallel activities performed by different residents simultaneously. From existing approaches, it can be observed that these approaches focus on learning the sequence of sensor activations. However, learning individual sequences for each resident’s activity from combined sensor events has not been addressed. The proposed approach recognizes parallel activities, considering the location of each activity. The contributions of the proposed approach are as follows:
1. A spatial matrix is generated to group the sensors according to their locations.
2. Sensor events for each activity are separated from the combined events of parallel activities through the spatial matrix.
3. Activity patterns of parallel activities are represented as binary images.
4. Parallel activities are recognized using YOLO.
The paper is organized as follows: Section 2 discusses the related work, Section 3 details the proposed methodology, Section 4 delineates the results and discussion, and Section 5 provides the conclusion.
Different Machine Learning (ML) and Deep Learning (DL) techniques have been studied for recognizing human activities. For instance, Tran et al. [16] utilized different variants of HMM to model the dependencies between different sensors. Different variants of HMM are deployed to capture each type of dependency, and all dependencies are captured with ensembles of HMM named the mixed dependency model (MDM). In another approach [17], resident movement in smart homes is modeled using HMMs combined with probabilistic model checking. Movement is analyzed within specific locations as state transitions between sensors, and across different locations as location transfers. Different combinations of sensor activations are learned through HMM models; however, they are not effective in learning long-range sequences. Natani et al. [18] deployed different neural network architectures for automated feature selection and activity classification. MLP (Multi-layer Perceptron) mapped sensor activation patterns, CNN captured spatial features, and LSTM learned sequential patterns. Better performance is achieved through the combination of CNN and LSTM. In another approach [19], LSTM-based architectures were evaluated by deploying their different variants and combinations. The performance of each variant is evaluated for learning different activities and determining which combination is more effective.
Chen et al. [20] proposed a hybrid model combining Transformer with Bidirectional Gated Recurrent Unit (BiGRU). Combining both models exploits the strengths of both the Transformer and BiGRU models to capture activities with longer durations as well as multiple sequences of sensor activation patterns. RNN models struggle to learn resident-specific features from combined features of parallel activities. In [21], self-supervised learning (SSL) techniques have been proposed to address the challenge of small amounts of labeled data. Multiple copies of the same data are generated, and the model is trained to generate feature representations for various copies. Self-attention mechanisms have been utilized to enable the model to concentrate on salient regions of sensor sequences and LSTM networks to learn sequential patterns from the data. Ramanujam and Perumal [22] proposed a feature engineering methodology to address various issues of multi-resident HAR. Different features, such as Activity Sequence Feature (AS1), Sensor Overlapping Feature (AB1), and Activity Change Counter (AC1), are added with raw sensor events. The updated feature set with engineered features is passed to a hybrid CNN-LSTM model exploiting activity feature representation.
In [23], a hybrid deep model has been proposed through the integration of temporal and spatial features. Temporal representation is captured by a Gated Recurrent Unit (GRU) combined with an attention mechanism to capture long-term dependencies and concentrate on the most significant activity patterns. A graph-based approach is proposed in [24] by directly encoding sensor dependencies as a graph with nodes as sensors and edges. The approach includes attention-based graph structure learning that extracts and retains only significant correlations among sensors and prunes weak edges, thus emphasizing more meaningful contextual information. A hybrid model is proposed in [25] which combines the Residual Transformer Network and CNN. The multi-head attention mechanism allows the model to selectively attend to the most informative areas, and an adaptive fusion scheme balances contributions from CNN-extracted spatial features.
Similarly, in [26], Graph Attention Networks (GATs) are combined with Linear Discriminant Analysis (LDA) and residual learning. The graph structure is built using minimum spanning trees (MSTs) so that it is able to effectively extract inter-dependencies between nodes. However, prior knowledge of sensor association is required for generating the graph. An unsupervised domain adaptation approach is proposed in [27] which explicitly incorporates frequency domain features alongside temporal patterns to generate more discriminative representations. In another approach [28], a model is introduced that combines multilevel residual convolution neural networks (ResCNNs) and a trainable 1-D discrete wavelet transform (DWT). The ResCNN component generalizes the conventional CNN by adding residual connections to solve the vanishing gradients problem. The wavelet transformation module serves as a trainable layer that transforms sensor signals into time and frequency domains.
In [29], an event-based daily activity recognition (DAR) approach is proposed that exploits an emergent paradigm with a marker-based stigmergy and pre-directed weighted network (DwN). Stigmergy is utilized to collect low-level context data from environmental sensors as Activity Pheromone Trails (APT). Paths are subsequently formulated as an explicit representation of a DwN, which provides identification between various pheromone sources and includes direction and sequence information. The model relies only on pheromones, and the association between different sensors is not considered. In [30], Natural Language Processing (NLP)-derived embeddings are proposed by including semantics and context of sensor activations. A combination of Word2Vec, a static semantic embedding, and ELMO (Embeddings from Language Models), a contextualized embedding, is suggested for LSTM models for activity-sequence classification. In another approach [31], sensor state sequences are improved through TF-IDF (Term Frequency – Inverse Document Frequency) and sensor spatial distance methods. Updated state sequences are passed to a Wide Convolutional Neural Network (Wide CNN) for classification.
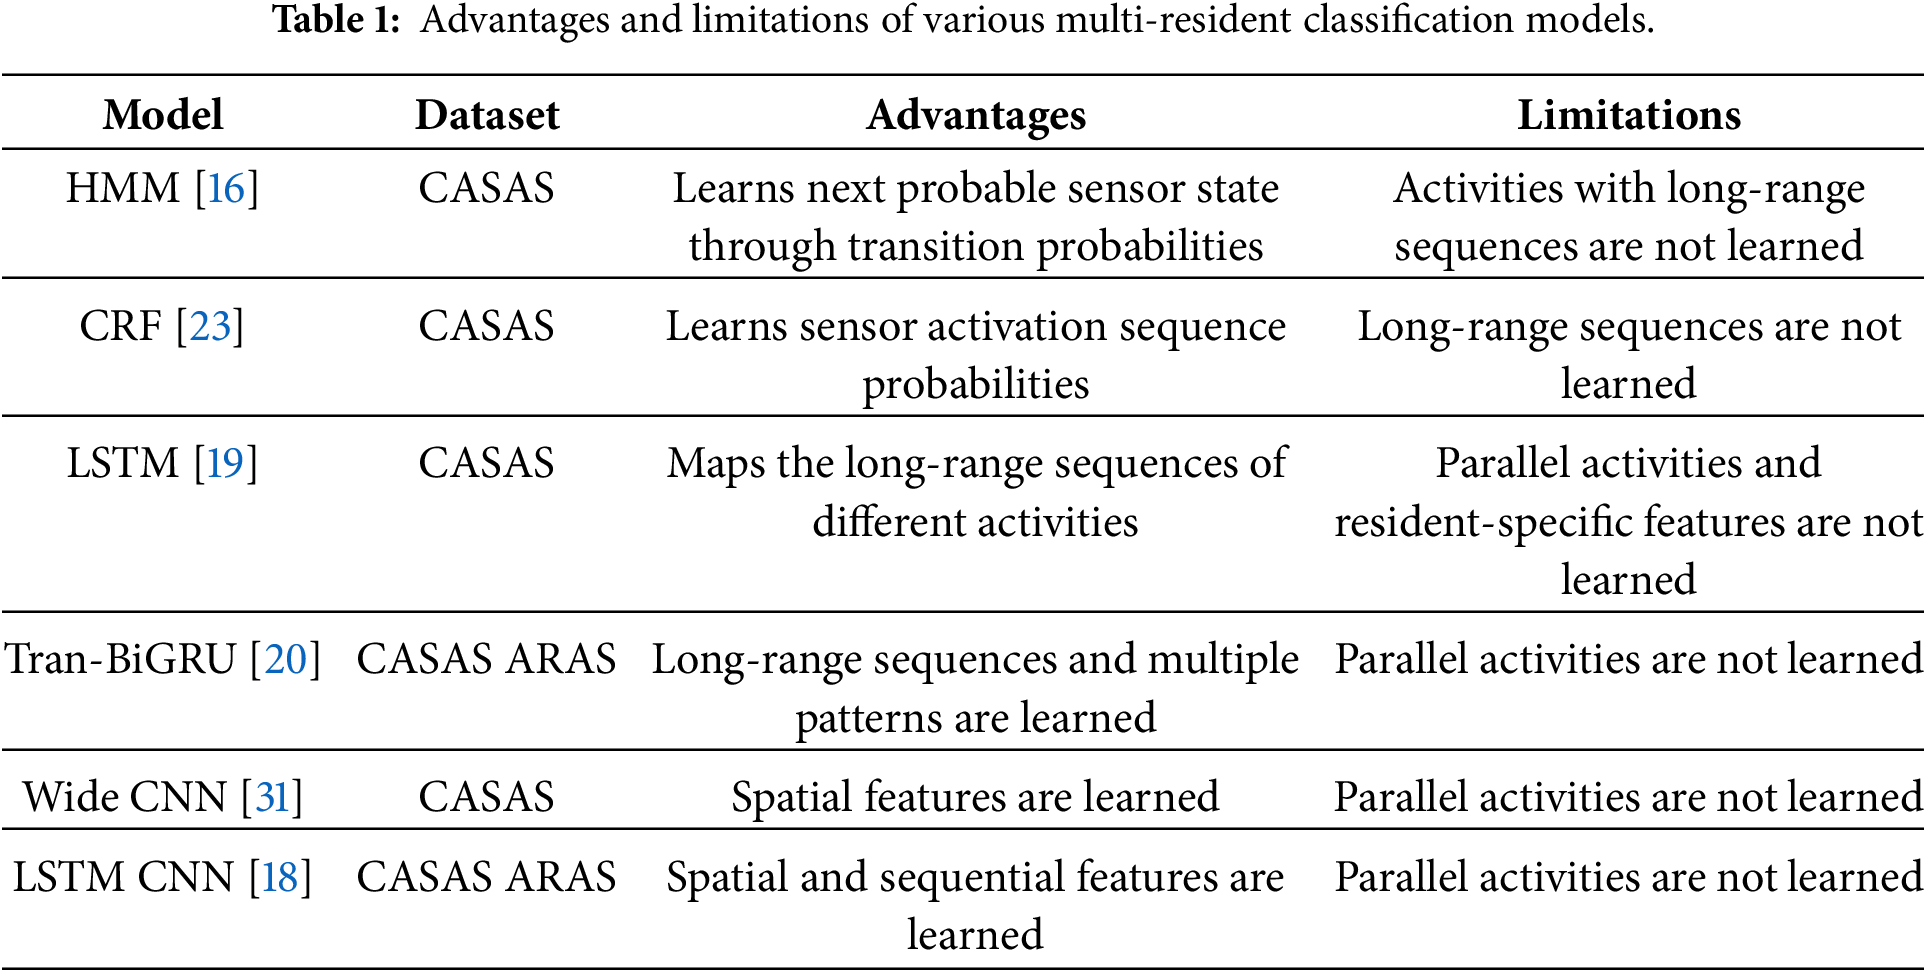
In [32], an incremental Support Vector Machine (SVM) method proposes incorporating the improved dependency sensor feature technique and the last-state sensor event approach. The improved dependency technique preserves the inter-dependencies among different sensors that activate together. Two incremental learning techniques are deployed: a clustering-based method that prunes redundant data based on pure and hybrid cluster notions, and a similarity-based method that uses Euclidean distance to minimize training redundancy. As described in Table 1, existing Machine Learning (ML) and Deep Learning (DL) approaches are useful in recognizing activities in smart homes by mapping different sequences. However, recognizing multiple parallel activities from combined feature sets has not been addressed. The proposed approach is designed to effectively recognize multiple parallel activities by separating the feature set of each activity. The following section provides a detailed description of our proposed methodology.
The proposed methodology consists of two phases: activity representation and activity classification. In the activity representation phase, spatial matrices are generated to represent sensor data as binary events. These spatial matrices are further converted into images, where each image contains one or more activity patterns. Each image is annotated based on the size and location of the activity. The activity images, along with their annotation files, are passed to YOLO for multiple parallel activity classification using its object detection mechanism.
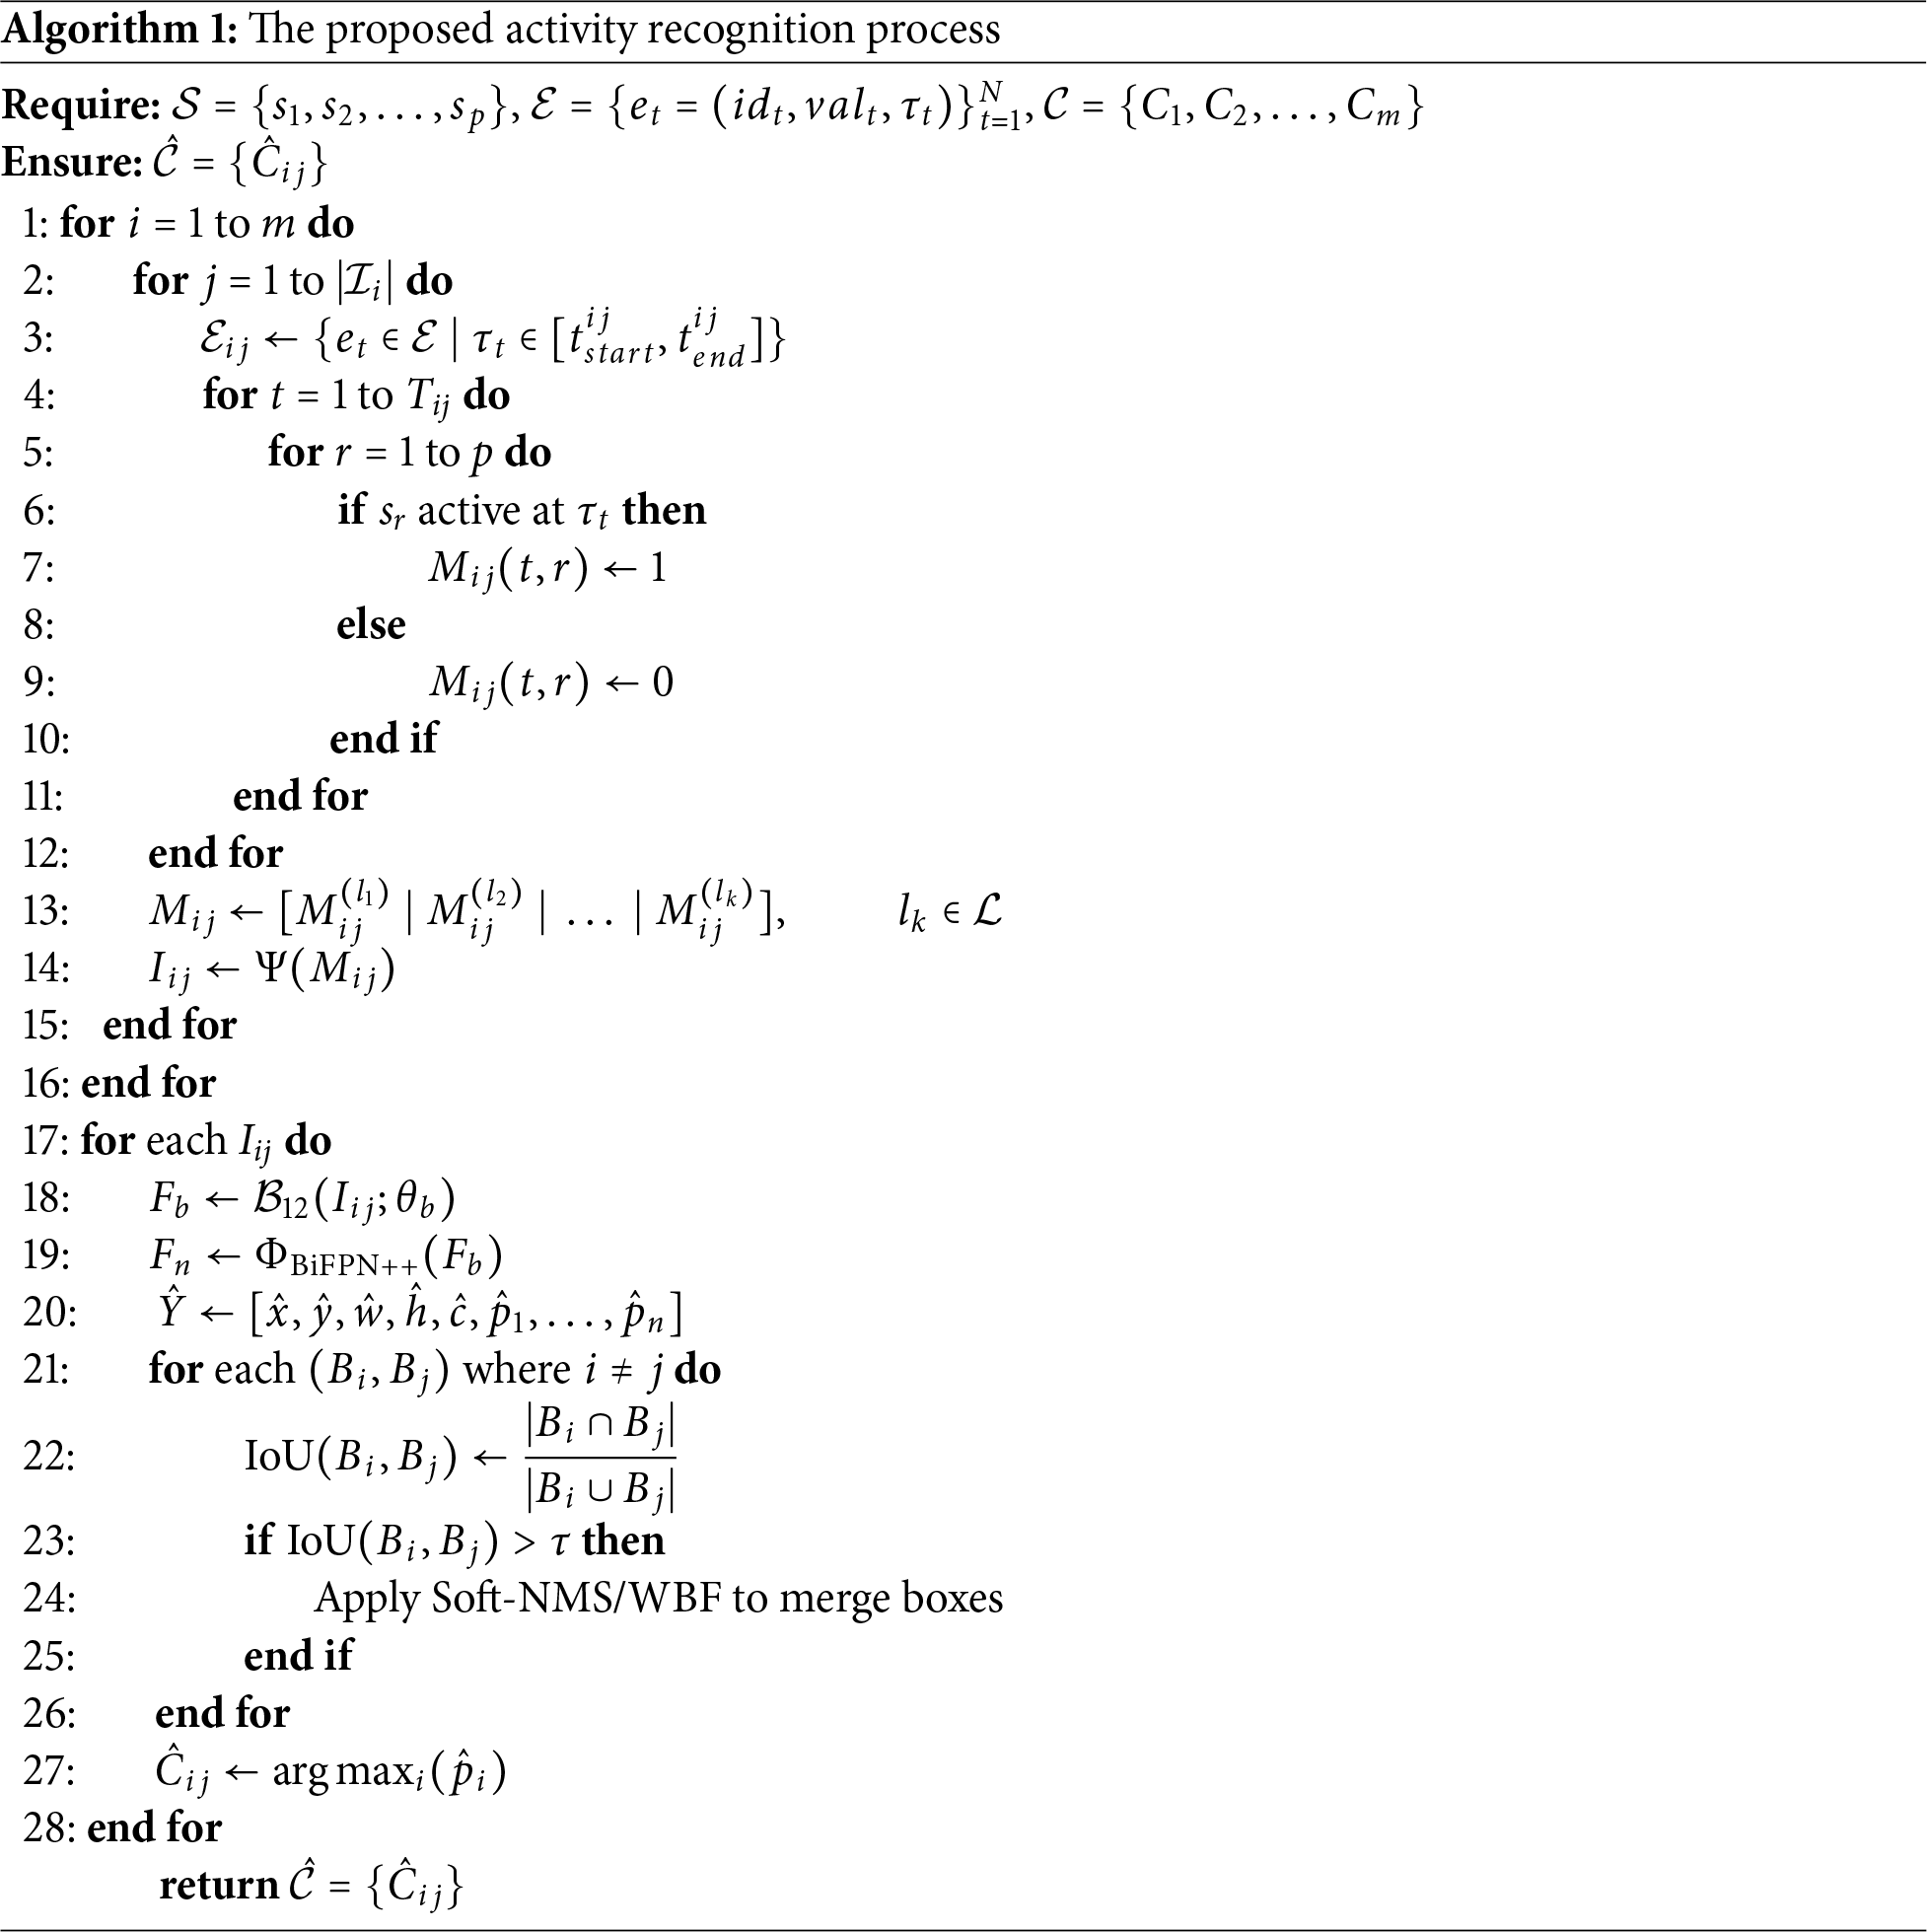
Algorithm 1 and Fig. 3 illustrate the complete pipeline of the activity recognition process. The framework includes spatial matrix generation, binary image conversion, and multiple activity detection using YOLOv12. Each step is presented to highlight the flow from sensor activation to activity label prediction. The details of each step are described in the following sections.
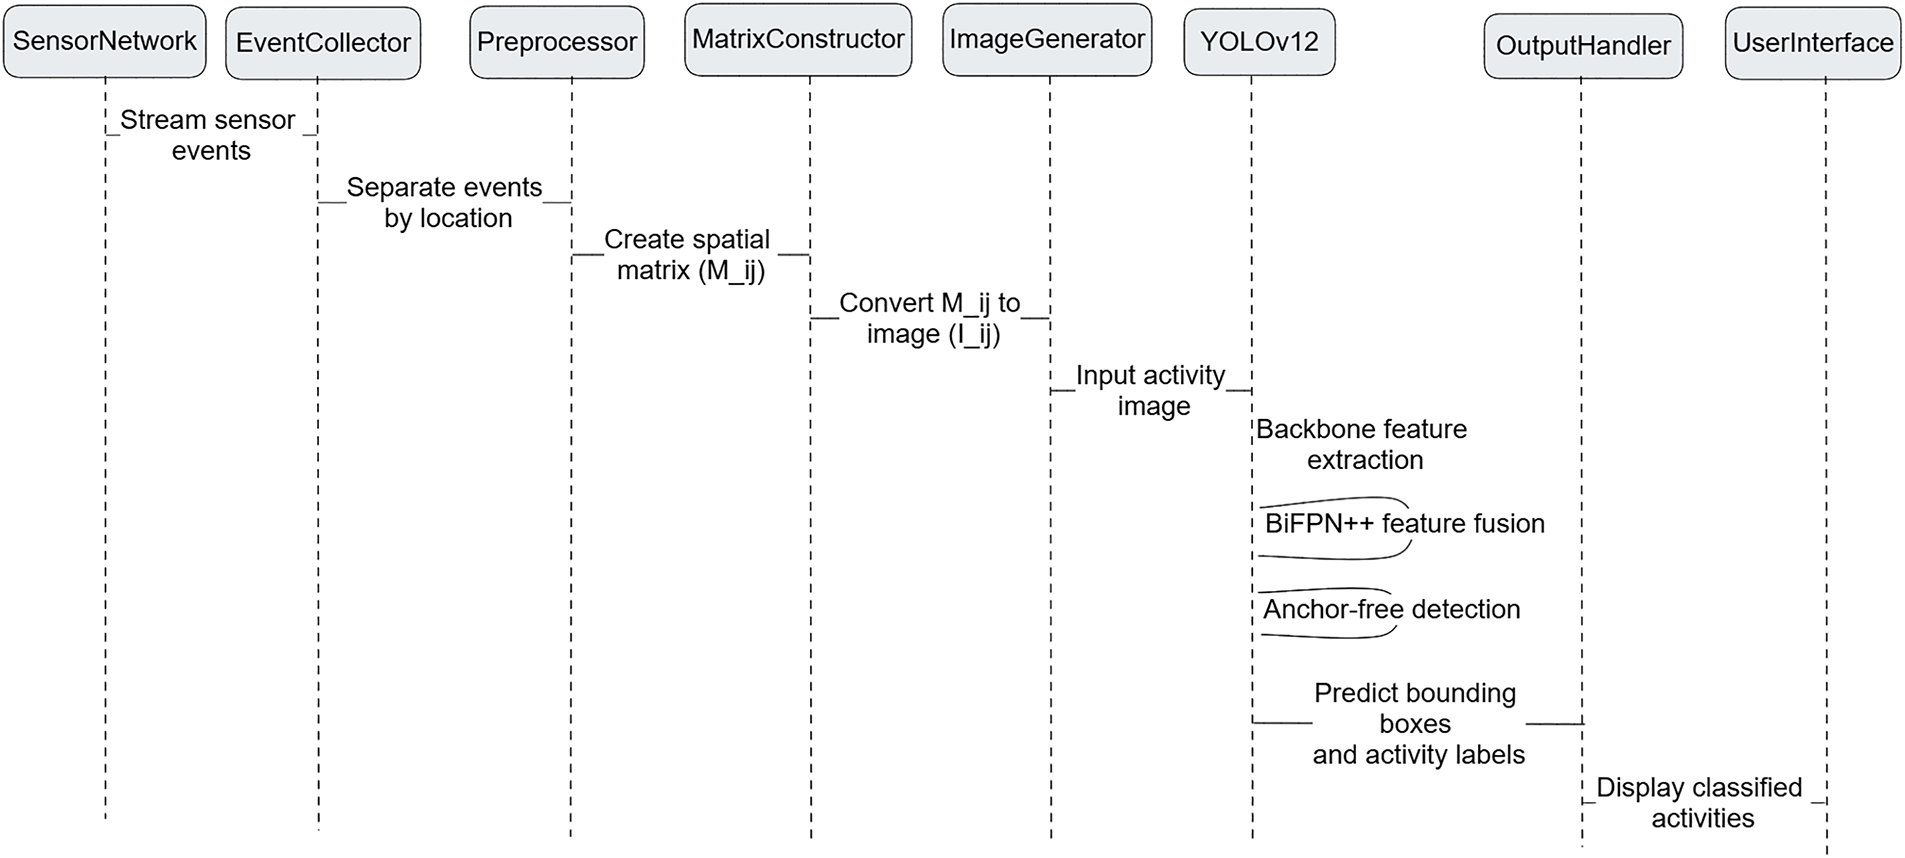
Figure 3: Sequence diagram of the proposed smart home activity recognition pipeline.
Activities are represented as images that capture the location and sequence of sensor activations within each location. This process includes spatial matrix generation, binary image generation, and image annotation.
3.1.1 Spatial Matrix Generation
The process begins with the construction of a spatial matrix based on the physical layout map of the smart home. Let
As shown in Fig. 4, each column of the spatial matrix represents a sensor and is grouped by locations. Red dotted lines indicate the segregation of sensors across different rooms. Location-wise segregation enables the separation of the activities performed at different locations. Spatial-based grouping plays a key role in separating concurrent activities performed by different residents in different locations. For example, if one resident is performing the meal preparation activity in the kitchen and another is watching TV in the living room, the proposed spatial matrix enables the production of the independent patterns of each activity within their respective location groups. Sensor events are defined as
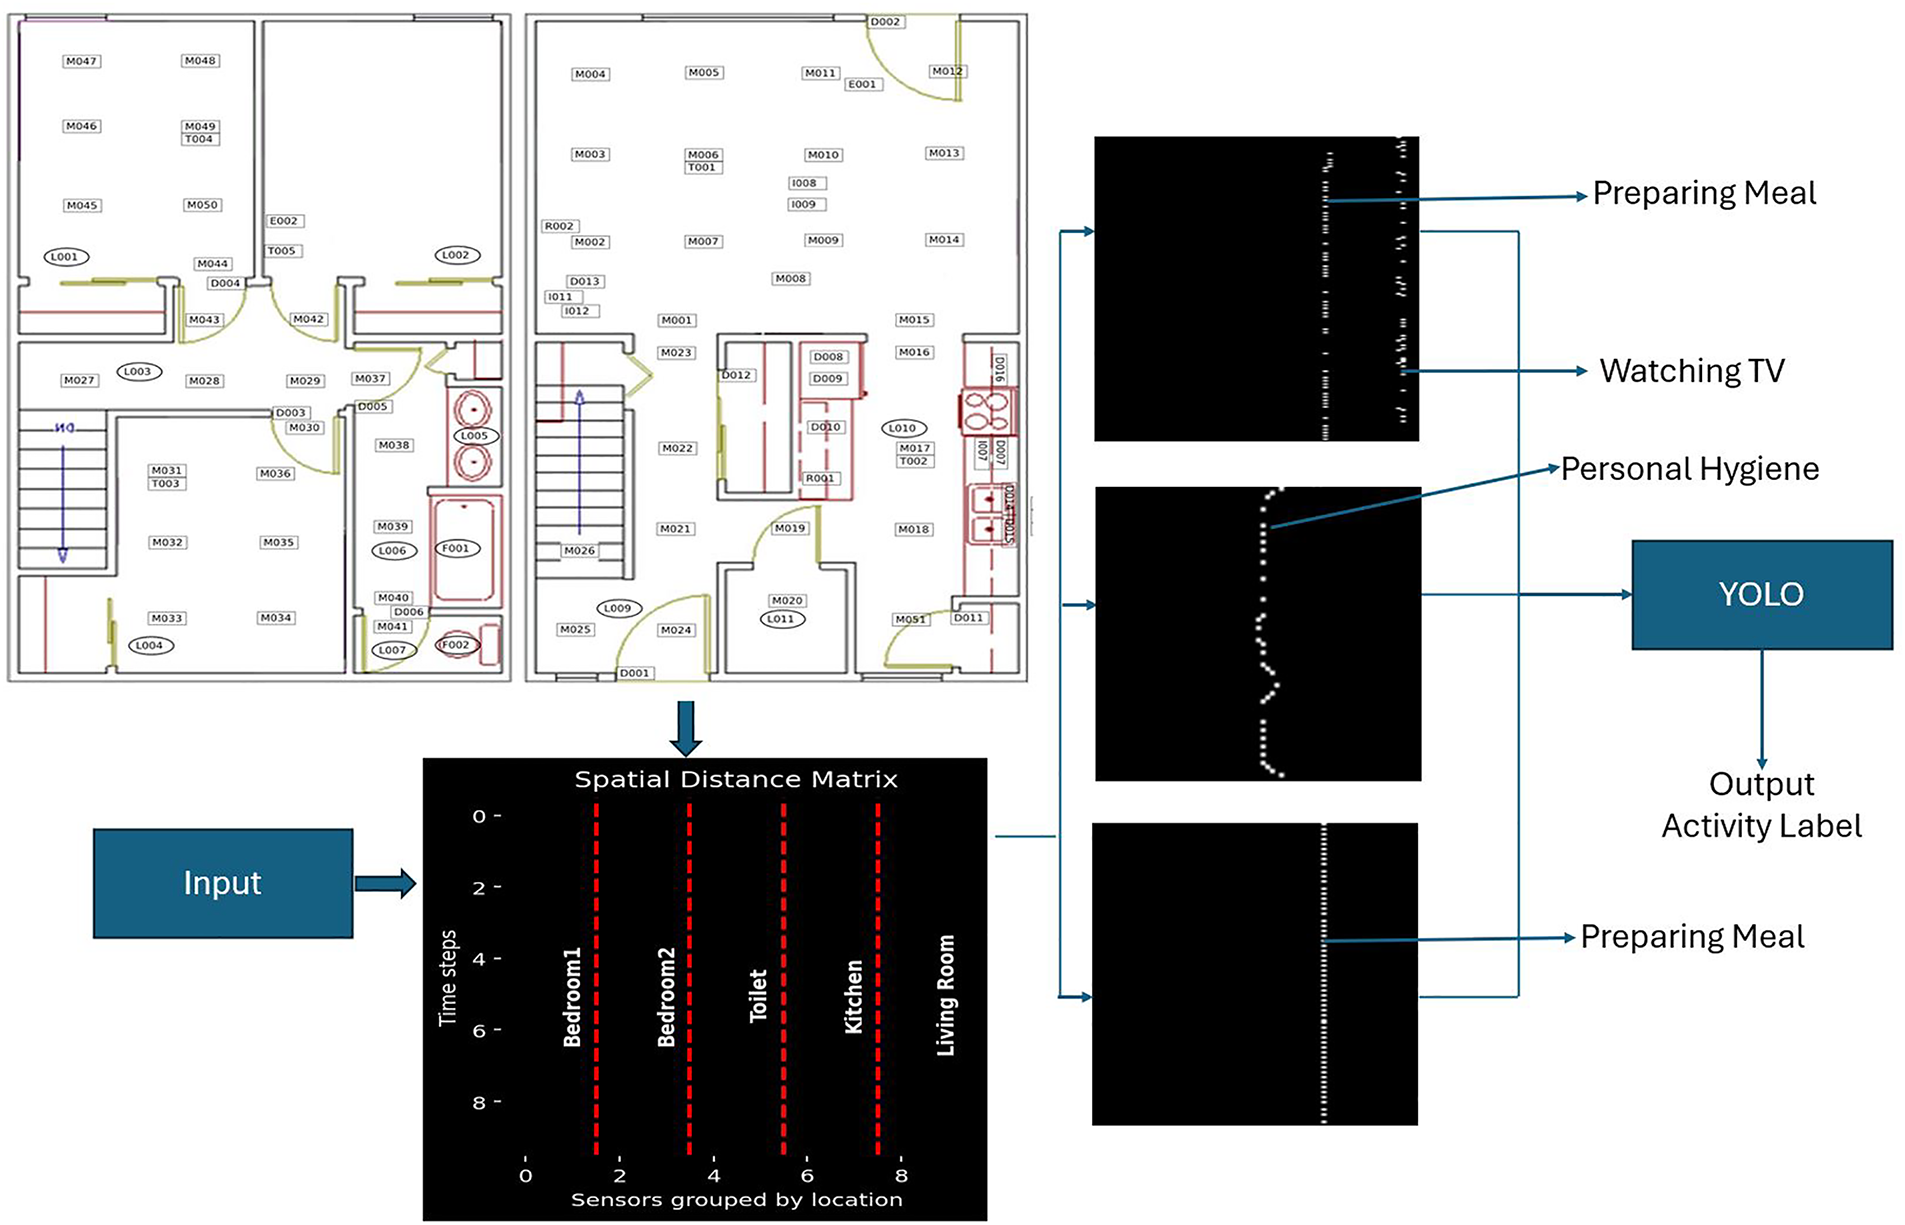
Figure 4: Block diagram of the proposed methodology: A spatial matrix is generated from the layout map of the smart home. Sensors are grouped based on their locations and are shown through red dotted lines. Sensor activations through different timestamps are shown in rows. Binary events in the spatial matrix are converted into images and annotated with bounding boxes. Images with bounding boxes are passed to YOLO for activity classification.
The spatial matrix represents the sensor activation sequence for each activity according to its location. For all activated sensor values of 1 recorded in their corresponding column, and inactive sensors shows value of 0. Pre-segmented activity is selected using the begin and end keywords. For conversion to a binary image, each cell of the spatial matrix is treated as a pixel and converted to a grayscale value according to:
where
3.1.3 Activity Image Annotation
Binary images are annotated by drawing bounding boxes for activities within each image. Manual annotation is performed using labeling tools. Manual annotation is selected for two main reasons: different activities performed at the same location share common sensors. Performance patterns of the same activity may vary depending on the resident’s performance sequence of the activity. For example, for a cooking activity, one resident may follow a different sequence from another resident result in a different pattern of the same activity.
Annotation involves drawing bounding boxes around the activity patterns, generating the
3.2 Activity Classification (YOLOv12)
CNN architectures are designed for image classification, whereas YOLO is an object detection framework which simultaneously classifies multiple objects within an image [33]. In a multi-resident activity recognition environment, multiple activities are performed concurrently in different locations of the smart home. CNN classifies the entire image as a single activity, considering sensor activations at different locations, and is unable to distinguish parallel activities. YOLO allows the model to detect multiple activity patterns within the same image, enabling the recognition of parallel activities while preserving their spatial context. This makes YOLO suitable for a multi-resident activity recognition scenario, where multiple residents perform different activities in parallel.
The activity representation phase captures the sequence pattern of each activity within its location and separates it from the combined feature set of parallel activities. One or more activity instances exist within each image. The objective of activity classification is to take each image as input and recognize the multiple activities performed in parallel based on their coordinates and sensor activation patterns.
As shown in Fig. 5, the process begins with the backbone, which extracts feature representations from the input binary images. In this context, the binary images encode spatial layouts of the smart home, where each activated sensor appears as a white pixel. The backbone in YOLOv12 adopts depthwise-separable convolutions combined with CSPNext blocks to improve efficiency, reduce redundancy, and preserve spatial–temporal details. These enhancements enable the backbone to identify spatial zones (e.g., kitchen, bedroom, living room) with active sensors and capture transitions across zones (e.g., movement from the bed to the toilet). The hierarchical feature maps
where
while the CSPNext module splits the feature maps, processes part of them, and merges the outputs as shown in Eq. (4):
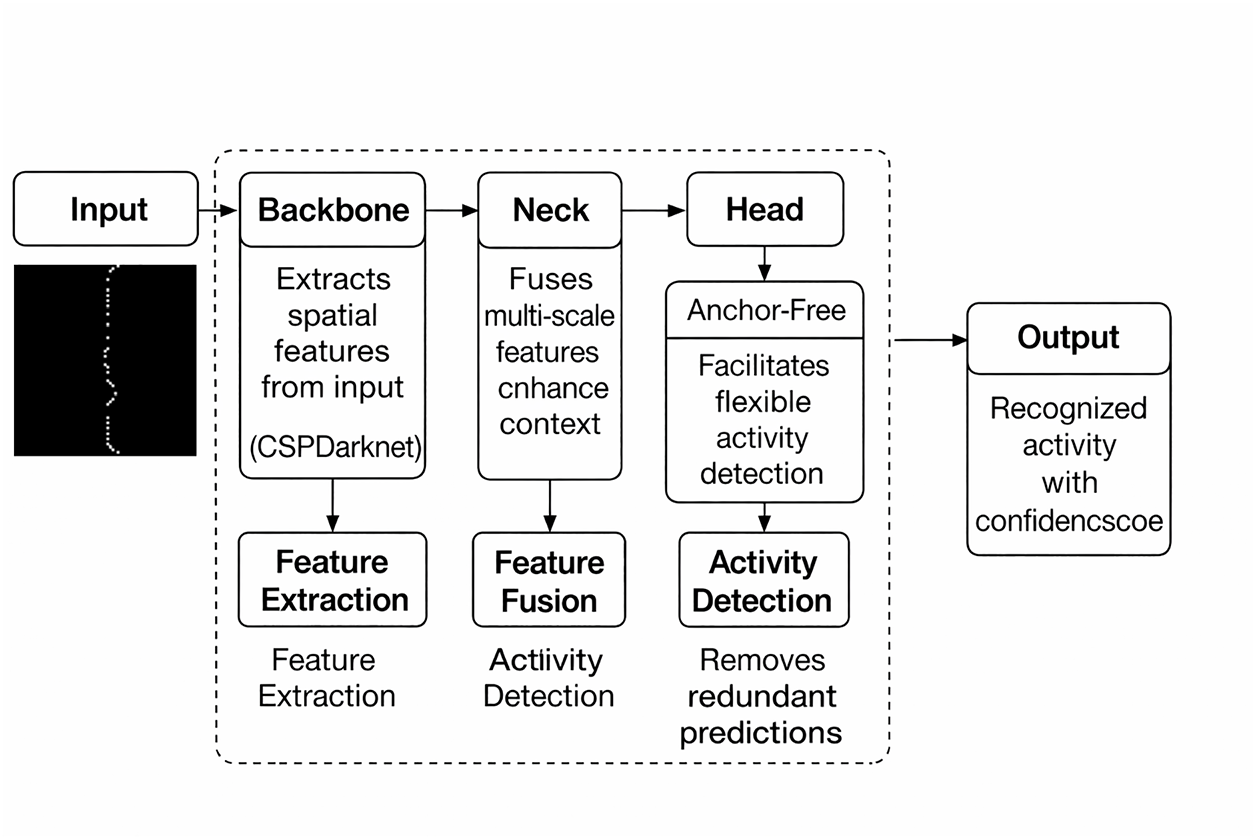
Figure 5: YOLOv12 architecture used for activity recognition from sensor activation layouts. The backbone extracts spatial features from the input, the neck combines multi-scale features to enhance context understanding, and the detection head predicts bounding boxes and activity classes.
Extracted features are passed to the neck module, which employs Bi-directional Feature Pyramid Network (BiFPN++). Multi-scale spatial features are combined more effectively than the FPN+PAN architecture of YOLOv8. BiFPN++ improves both top–down and bottom–up information propagation, which is useful for recognizing activities with varying patterns. Feature fusion is represented in Eq. (5):
where
where
When activities overlap, YOLO produces different bounding boxes per image. To refine the predictions, YOLOv12 applies Non-Maximum Suppression (NMS) such as Soft-NMS and Weighted Boxes Fusion (WBF), using the Intersection over Union (IoU) defined in Eq. (7):
Instead of removing overlapping boxes
4.1 Dataset and Evaluation Measures
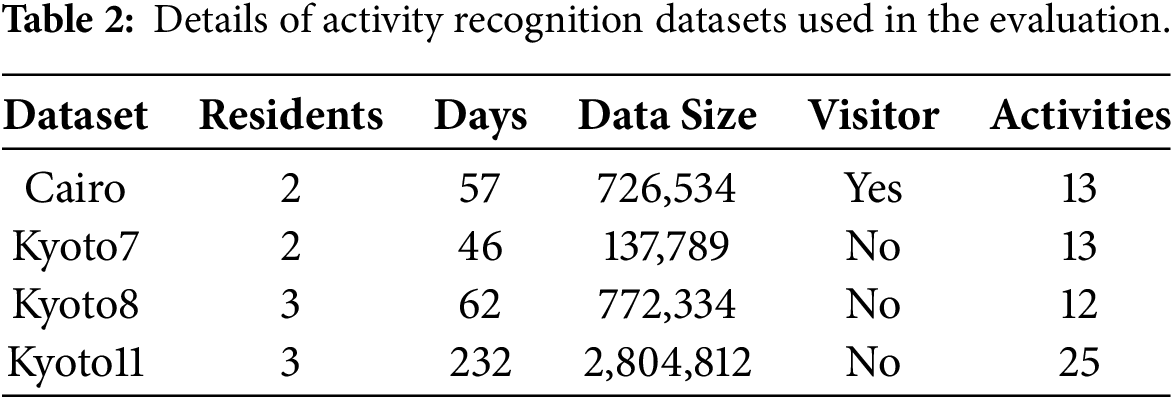
Table 2 shows the description of the CASAS smart home datasets. Four publicly available smart home datasets from the CASAS project [34], namely Cairo, Kyoto7, Kyoto8, and Kyoto11, are used for evaluation. A sample of the feature set for two parallel activities is shown in Fig. 2. The smart home apartment consists of three bedrooms, one bathroom, one kitchen, and a living/dining room. The smart home apartments are equipped with different types of sensors, such as motion, temperature, item, and door sensors. Among all CASAS datasets, four datasets—Kyoto8, Kyoto7, Kyoto11, and Cairo—are selected for experimentation. All four datasets contain the same sensor data representation, such as date, time, sensor ID, state, and activity label.
Four evaluation measures—Precision, Recall, F1 Score, and Accuracy—are used to assess the performance of multi-activity recognition models based on true positives (TP), false positives (FP), and false negatives (FN). Precision represents the proportion of correctly predicted activity instances from the total predicted instances of that activity.
Recall shows how many actual occurrences of an activity are successfully detected:
F1 Score provides a balanced measure of a model’s performance by considering both precision and recall, ensuring that both false positives and false negatives are considered for activity classification as:
Accuracy indicates the overall performance of the model by measuring the proportion of correctly classified activity instances out of the total number of instances for all activity classes:
The experiments were carried out on PC 12th generation Intel Core i7-1255U, having a clock speed of 1.7 GHz, and 16 GB RAM. Intellectual Iris Xe graphics processing with 8GB of shared memory is built in. Storage 500 GB Samsung NVMe (SSD) disk on which the datasets, activity images, and experimental results will be stored. The OS used is Windows 11 (64-Bit). The proposed framework was written in Python and was run in the TensorFlow deep learning system. In this study, YOLOv12 was adapted to classify activity images generated from smart home sensor matrices. As shown in Table 3, the implementation was carried out using Python 3.10, along with the Ultralytics YOLO (version 12.0) library. YOLOv12 relies on YAML (YAML Ain’t Markup Language) configuration files to define the training environment and dataset structure. The data.yaml file specifies the dataset paths and class information, the model.yaml file defines the YOLOv12 architecture including layers and anchors, and the hyp.yaml file contains hyperparameters controlling learning rate, momentum, and augmentation. These YAML files allow flexible configuration of datasets, model parameters, and optimization strategies without modifying the source code. The YOLOv12 model was trained using the Ultralytics YOLO command-line interface and Python API, an image size of 640
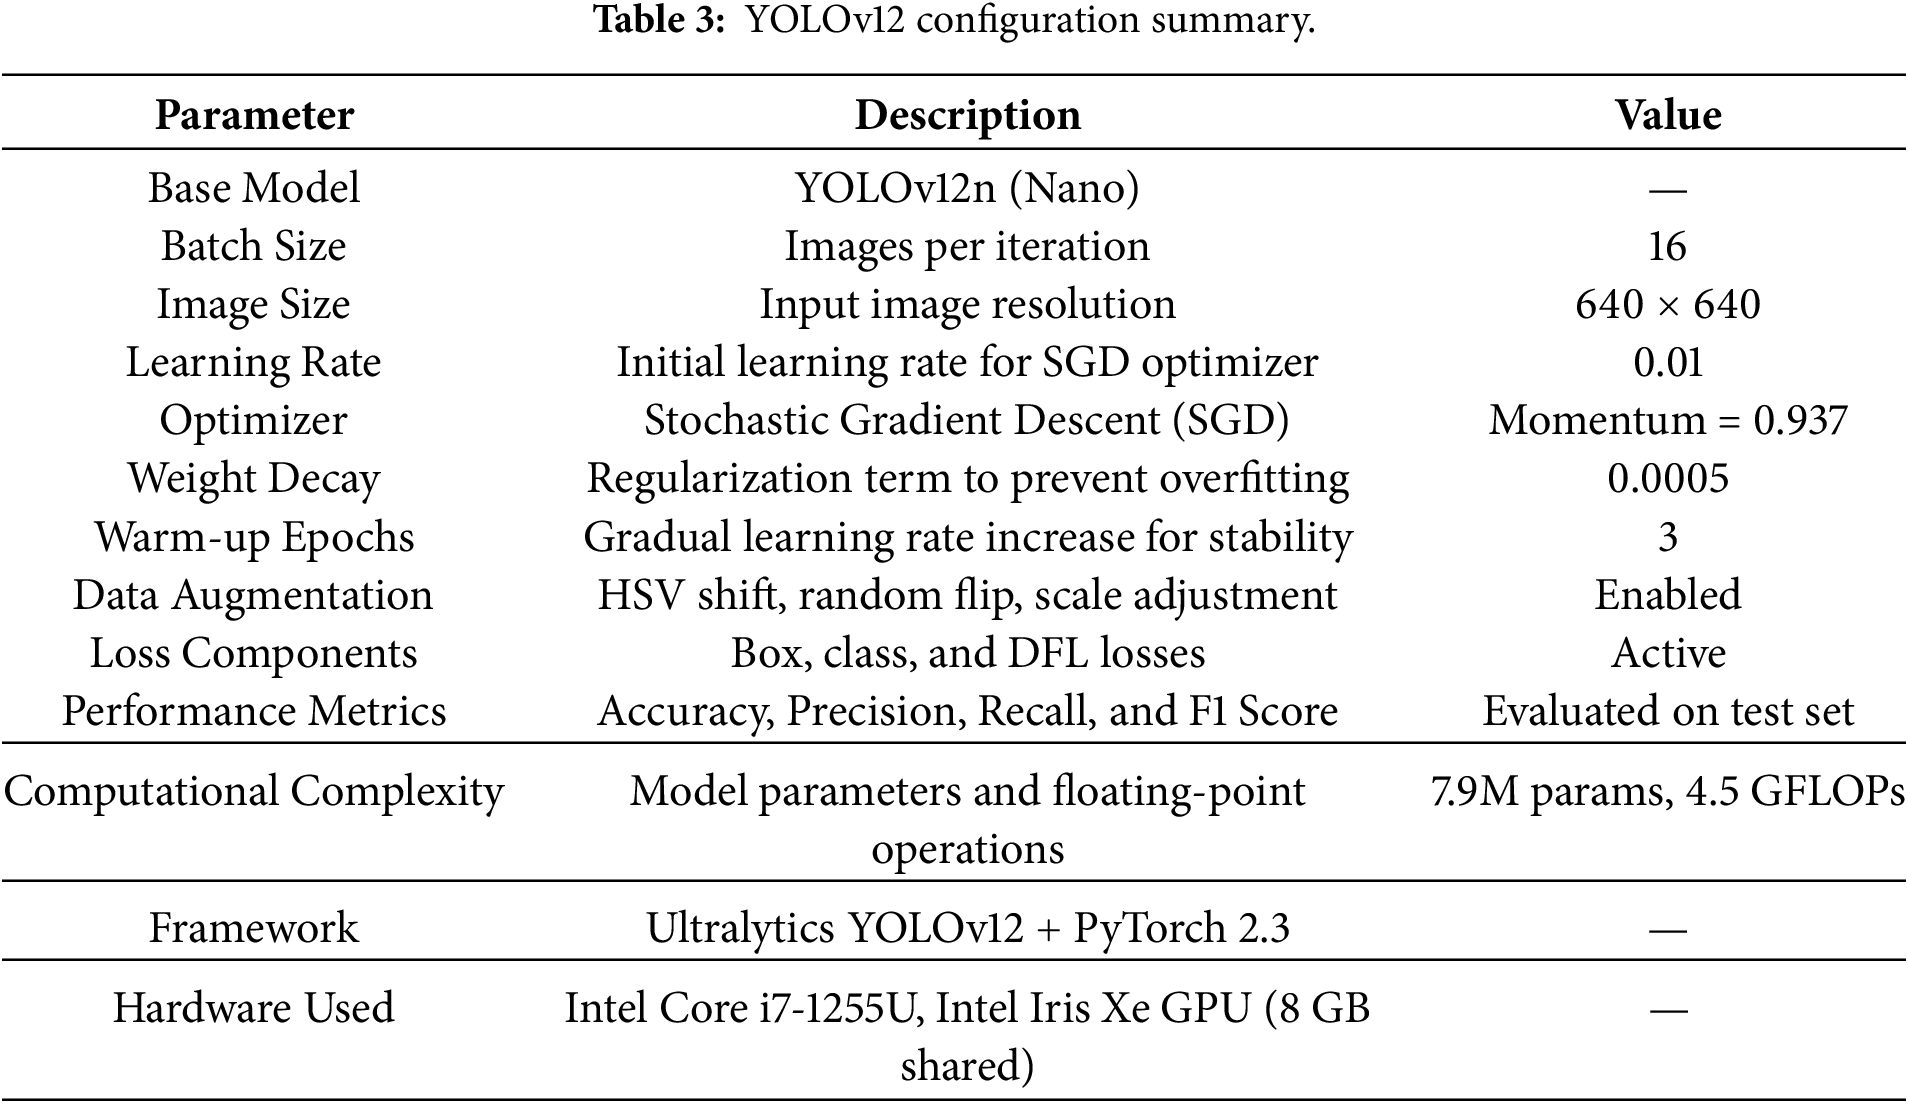
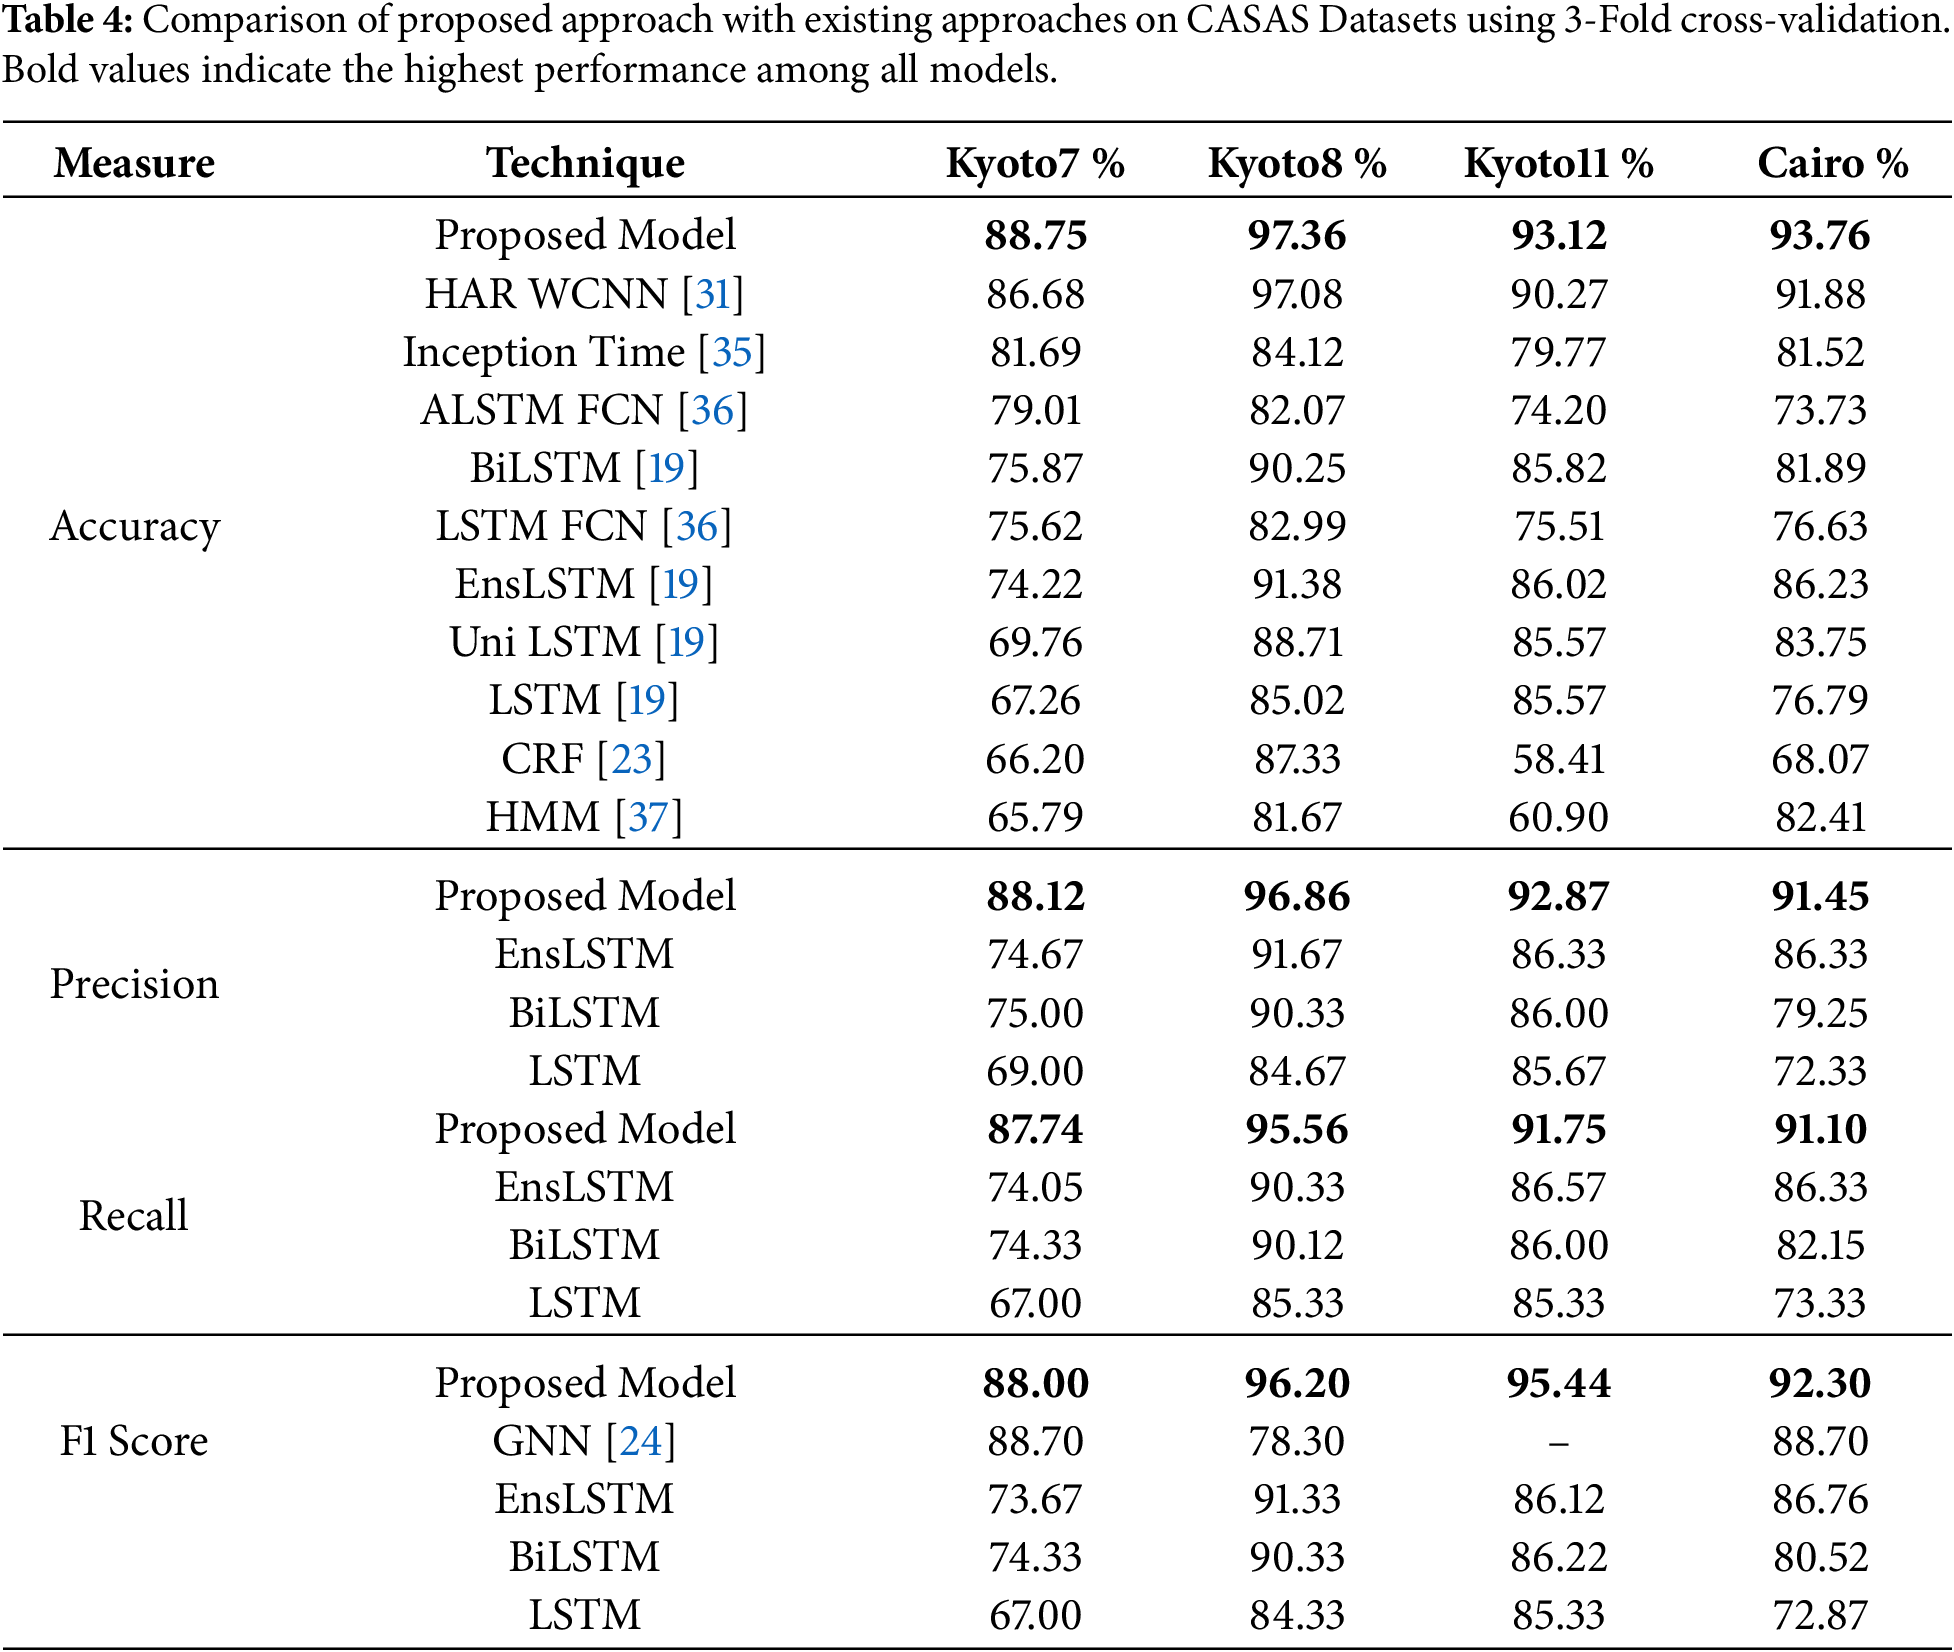
Fig. 6 and Table 4 show the comparison of the proposed model with existing approaches across four CASAS datasets using 3-fold cross-validation. The proposed approach achieves accuracies of 88.75%, 97.36%, 93.12%, and 93.76% on Kyoto7, Kyoto8, Kyoto11, and Cairo, respectively, outperforming all existing models. Existing models such as LSTM achieve accuracies of 67.26%, 85.02%, 85.57%, and 76.79% across the four datasets. Compared to the proposed model, improvements of 21.49%, 12.34%, 7.55%, and 16.97% are achieved, respectively. The UniLSTM variant improves slightly compared to LSTM, with accuracies of 69.76%, 88.71%, 85.57%, and 83.75%, whereas the proposed model still surpasses it by 19.00%, 8.65%, 7.55%, and 10.01%. The BiLSTM (Bidirectional Long Short-Term Memory) model, which processes sequences bidirectionally, shows better results (75.87%, 90.25%, 85.82%, and 81.89%), as multiple patterns of the activities exist and are captured through its bidirectional mechanism. The proposed approach provides an accuracy gain of 12.88%, 7.11%, 7.30%, and 11.87%, respectively, over BiLSTM. The EnsLSTM model combines multiple LSTM networks and achieves 74.22%, 91.38%, 86.02%, and 86.23%, respectively.
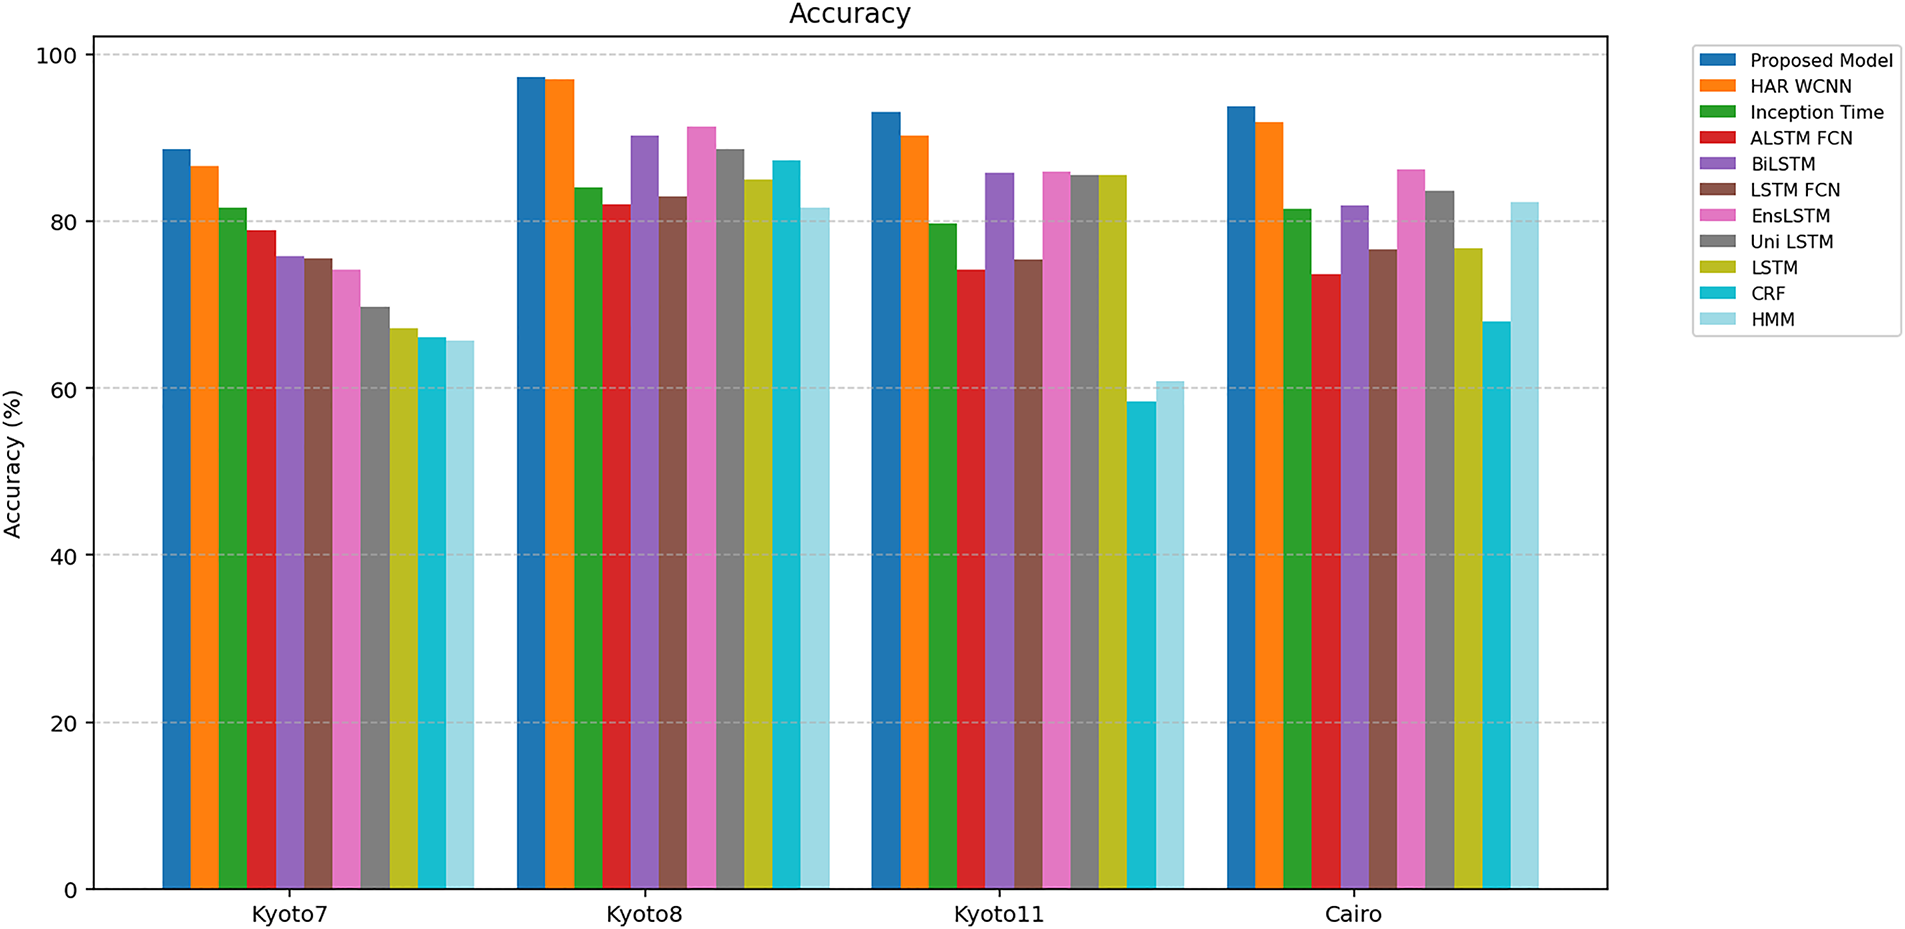
Figure 6: Comparison of accuracy with existing approaches.
The proposed model shows accuracy improvements of 14.53%, 5.98%, 7.10%, and 7.53% compared to EnsLSTM. Similarly, LSTM-FCN and ALSTM-FCN models reach accuracies between 73.73% and 82.99%, with an average improvement of 12%–18% by the proposed approach. LSTM models are useful in learning sequential patterns with multiple variations; however, in a multi-resident environment, parallel activities contain combined feature sets of multiple activities. LSTM models are unable to discriminate the activity-relevant features from the combined set, which lowers performance in multi-resident environments. The HAR WCNN model achieves 86.68%, 97.08%, 90.27%, and 91.88%, performing better than most existing approaches. A distance matrix is calculated based on the number of sensors involved in transitions to the next sensor. Updated state sequences are generated through the distance method by retaining only adjacent sensors. Parallel activities performed at locations with higher distances are separated; however, activities in adjacent locations are not addressed. The proposed method still achieves higher accuracies, improving by 2.07%, 0.28%, 2.85%, and 1.88%, respectively.
The InceptionTime model attains 81.69%, 84.12%, 79.77%, and 81.52%, which are lower than the proposed approach, showing improvements of 7.06%, 13.24%, 13.35%, and 12.24%, respectively. Although its multi-scale convolutions help capture diverse temporal resolutions, it lacks mechanisms to distinguish simultaneous spatial activations. Probabilistic models such as CRF and HMM show the lowest performance, with accuracies of 66.20%–87.33% for CRF and 65.79%–82.41% for HMM. The proposed model outperforms CRF by 22.55%, 10.03%, 34.71%, and 25.69%, and HMM by 22.96%, 15.69%, 32.22%, and 11.35% across Kyoto7, Kyoto8, Kyoto11, and Cairo, respectively. Probabilistic models are useful in learning the next transition based on the current state. However, the whole context, such as previous states and all possible next states, is not considered due to the longer sequences of activities not being captured, which lowers their recognition performance.
The proposed spatial-matrix-based approach models the physical relationships between sensors to form a structured spatial representation, enabling the network to learn activity-specific regions. Location-wise separate patterns for parallel activities are generated at their respective locations from the combined feature set. Activities are separated based on their locations. Furthermore, activities performed at the same location are also separated based on their sensors. For example, sleeping and working are both performed in the bedroom. Activated sensors, such as the bed for sleeping and the desk for work, are separated by generating bounding boxes of their x and y coordinates. The YOLO-based multi-object detection mechanism recognizes more than one activity from a single image. Capturing spatial and temporal sequences, improvement in performance is shown in overall accuracy. Average improvement is achieved from 8% to 20% over existing deep learning models and 25% improvement as compared to probabilistic approaches. Existing models recognize a single activity from combined features; however, the proposed model recognizes multiple parallel activities performed simultaneously through YOLO. Overall, the proposed model demonstrates performance improvement by effectively capturing spatial and temporal sequences in smart home environments.
Fig. 7 shows the comparison of the proposed model with existing deep learning approaches in precision measures on four CASAS datasets. Precision measures the ability of the model to correctly identify relevant activities while minimizing false positives. The proposed model achieves precision values of 88.12%, 96.86%, 92.87%, and 91.45% for the Kyoto7, Kyoto8, Kyoto11, and Cairo datasets, respectively, outperforming all existing approaches. Improvements show the effectiveness of the proposed YOLO-based multi-object detection approaches by recognizing concurrent activities.
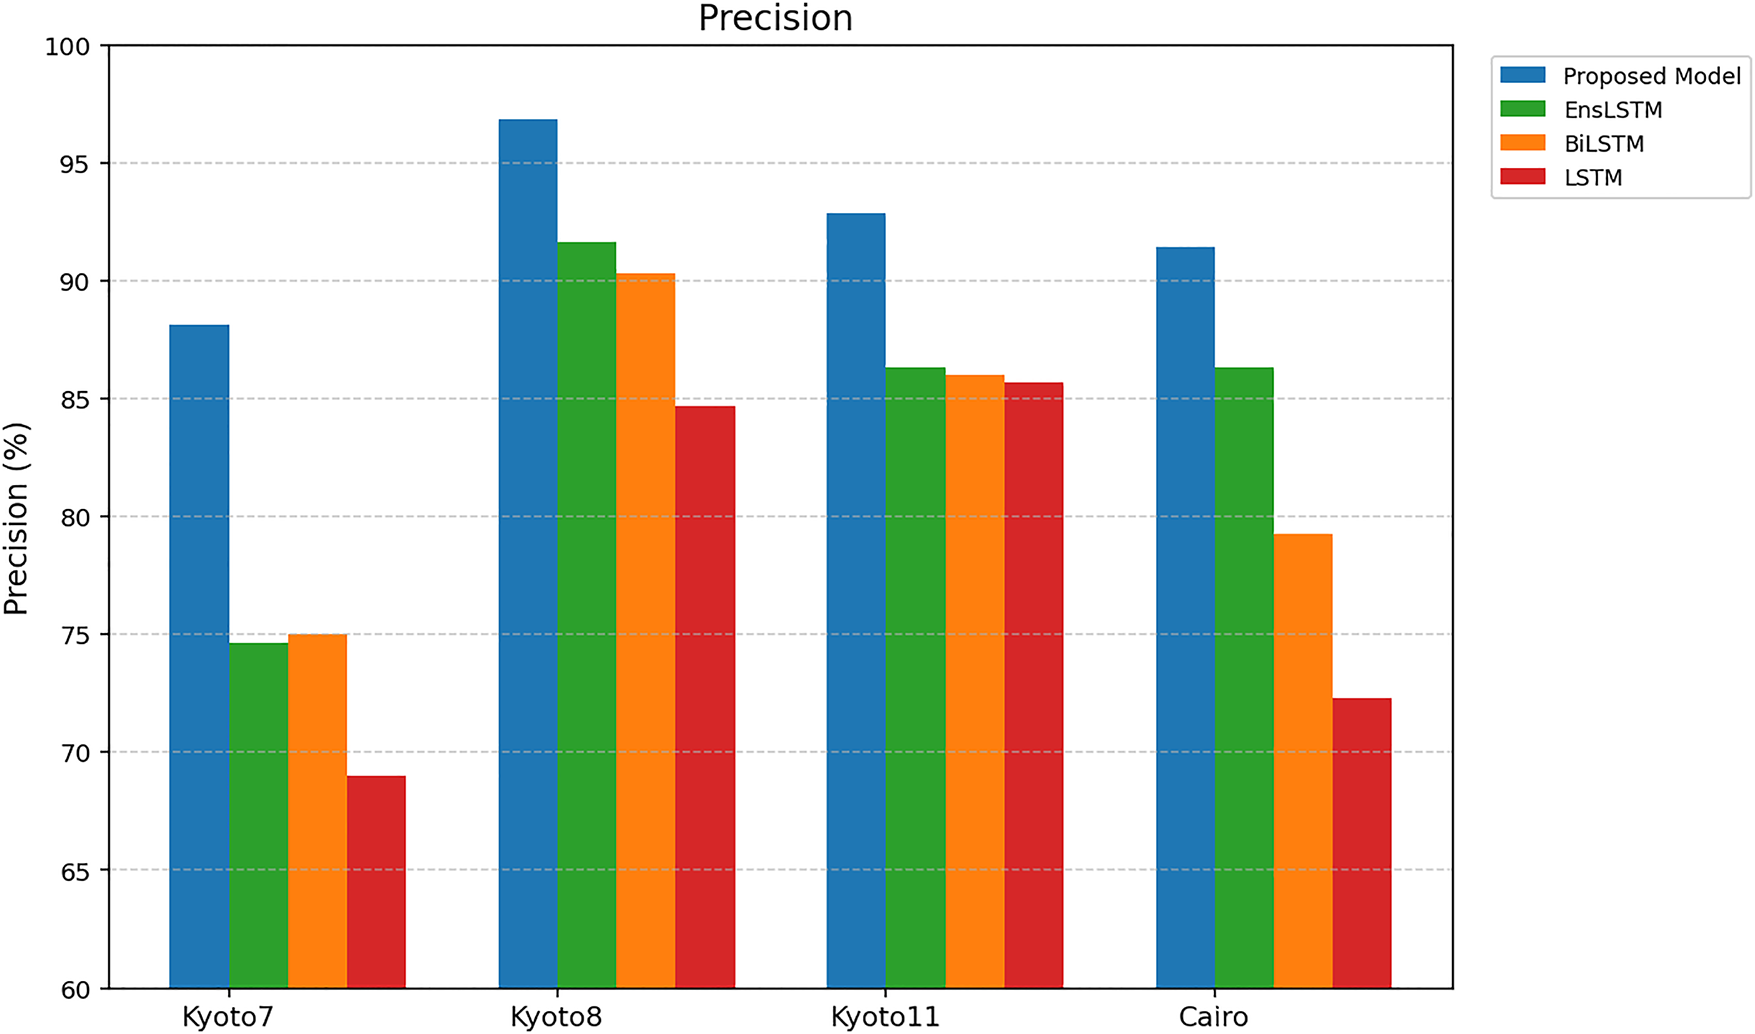
Figure 7: Precision.
Identifying spatial locations of sensors, the model reduces the number of false positives that occur when multiple activities share similar temporal patterns. The LSTM model shows precision scores of 69.00%, 84.67%, 85.67%, and 72.33%, which are lower than those of the proposed model. The improvements of 19.12%, 12.19%, 7.20%, and 19.12% across the four datasets indicate that LSTM captures temporal relationships; it is unable to recognize overlapping activities, resulting in misclassification. BiLSTM model achieves 75.00%, 90.33%, 86.00%, and 79.25% precision, with improvements of 13.12%, 6.53%, 6.87%, and 12.20% when compared to the proposed approach. BiLSTM incorporates bidirectional temporal learning; however, it is unable to differentiate activities performed in parallel at multiple locations. The EnsLSTM model shows slightly higher performance compared to LSTM, achieving 74.67%, 91.67%, 86.33%, and 86.33%, yet the proposed method still shows improvements of 13.45%, 5.19%, 6.54%, and 5.12%, respectively.
The recall of the proposed model and existing ones is compared in Fig. 8. The proposed method has a recall of 87.74%, 95.%, 91.75%, and 91.10% on the Kyoto7 dataset, Kyoto8 dataset, Kyoto11 dataset, and Cairo dataset, respectively. Current methods like EnsLSTM, BiLSTM, and LSTM have low recall rates with averages of 84.32, 83.65, and 77.25 percent. The level of improvement between the proposed model and the next best (EnsLSTM) is between 5–8 percent. The fact that the proposed model is the highest in recall implies that it minimizes false negatives. This enhancement is by the features of space and time that increase its power to identify small differences in patterns of sensor activation that are related to each activity.
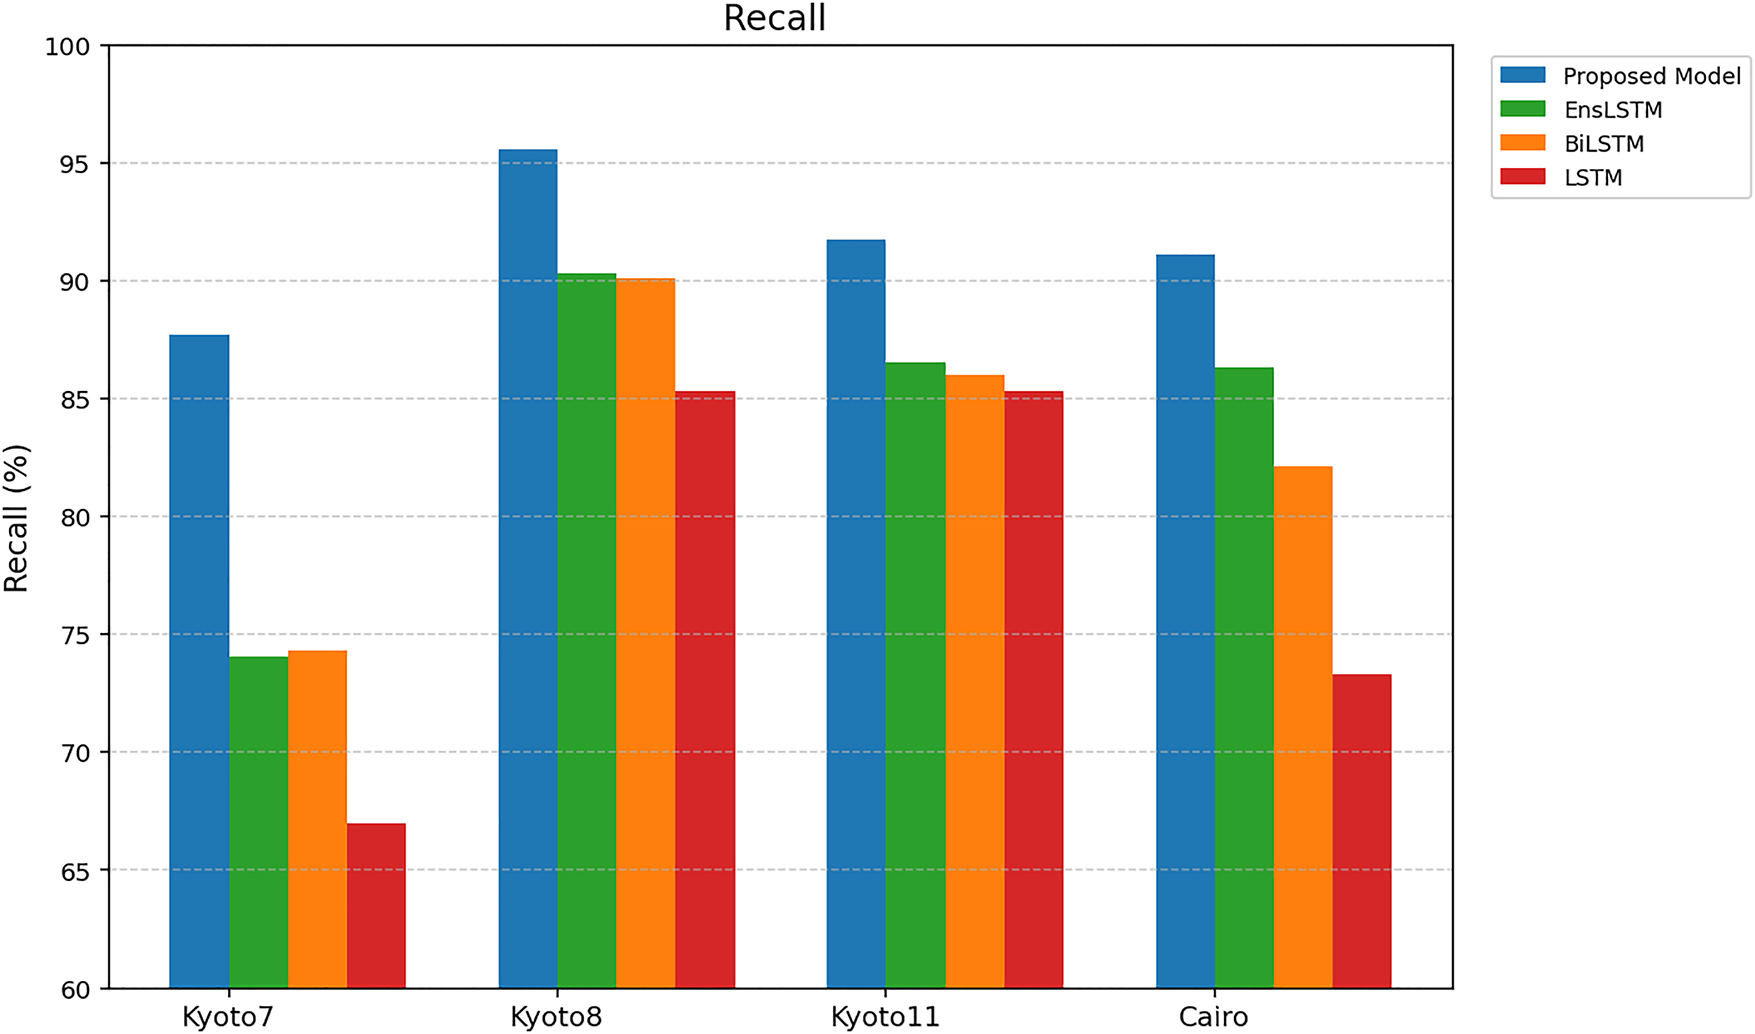
Figure 8: Recall.
In a comparison of the F1 Scores percentages in Fig. 9, the proposed model performs better on all the datasets with a balance in precision and recall. The proposed model achieves F1 Scores of 88.00%, 96.20%, 95.44% and 92.30% on Kyoto7, Kyoto8, Kyoto11, and Cairo, respectively. Such findings show that there is a steady increase in performance compared to current methods, showing the validity of the presented framework. The F1 Scores of GNN, EnsLSTM, BiLSTM, and LSTM are comparatively low (i.e., 84.68%, 84.97%, 82.85%, and 77.38%) as compared to current methods. The proposed model demonstrates the enhancement of 5%–15%. It means that the model can well represent spatial and temporal correlations between sensor activations, which increases its capacity to accurately detect and classify activities when sensor events are either distorted or overlapping. The harmonic mean of precision and recall, that is, F1 Score, is of special importance in activity recognition tasks as it reflects the trade-off between false positives (precision) and correctly identifying an activity (recall). Thus, the fact that the proposed model performs better in F1 Scores indicates that it can also be used to ensure high sensitivity and high specificity and, therefore, more reliable and accurate reports of human activities associated with smart home settings.
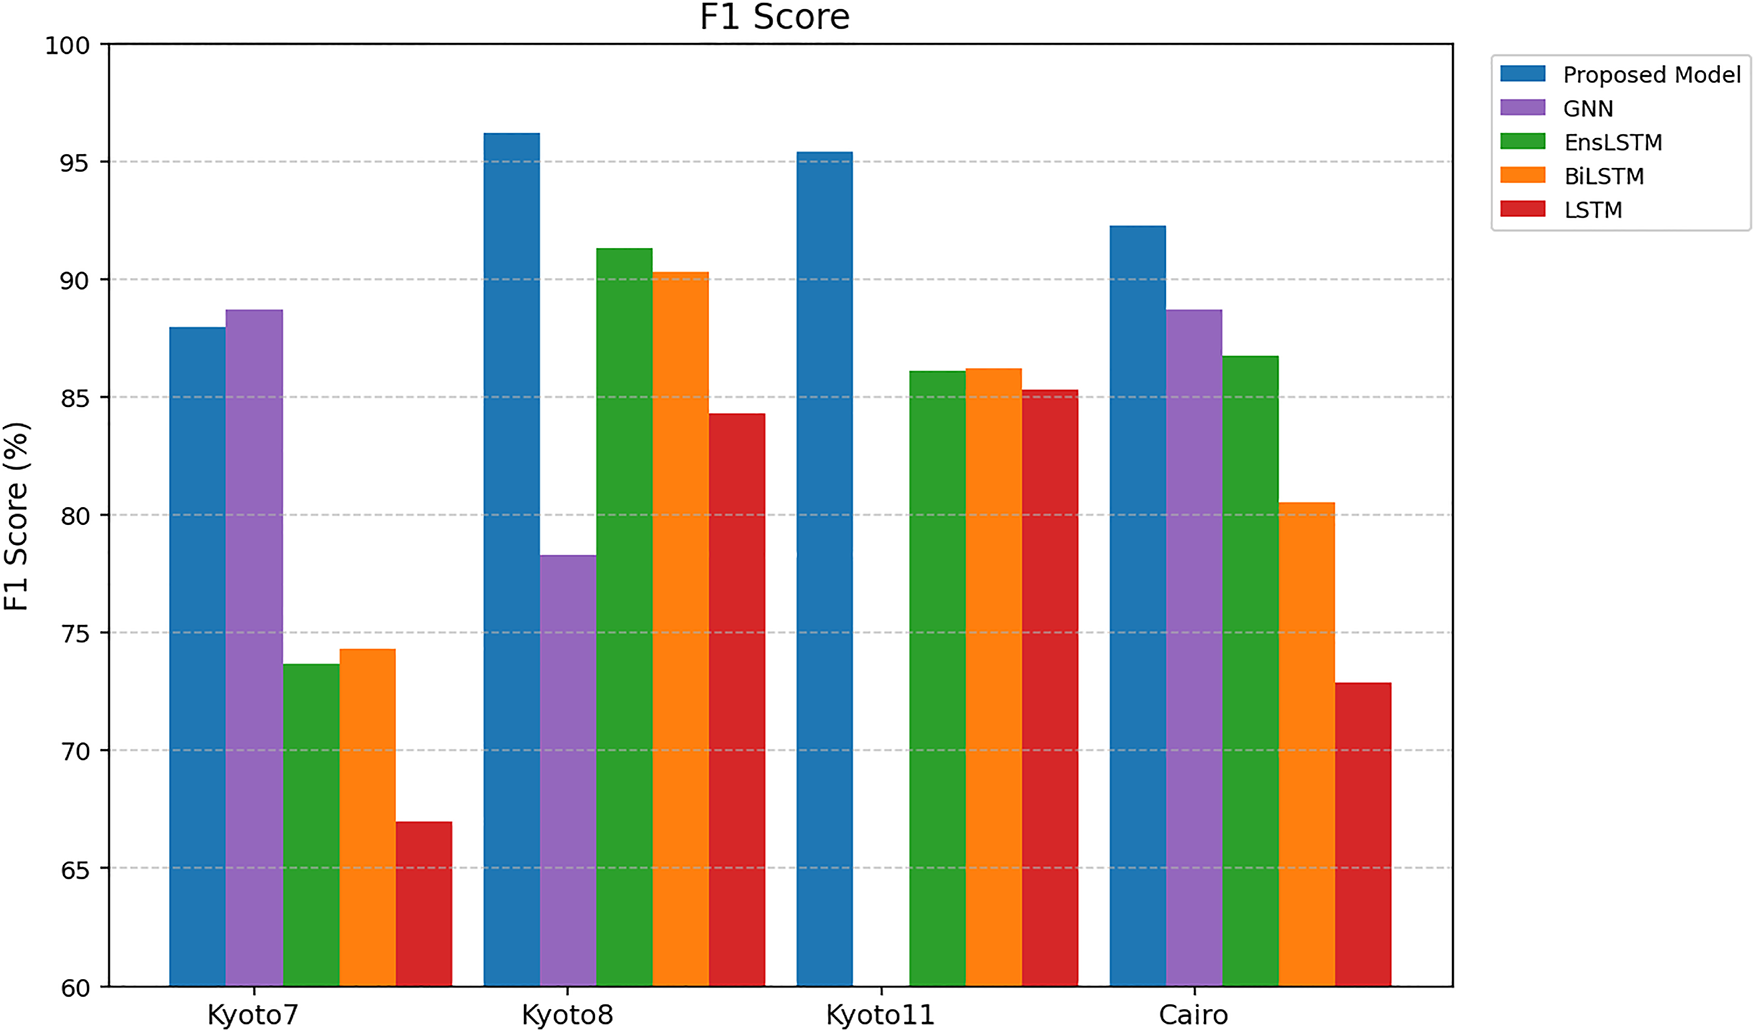
Figure 9: F1 Score.
4.4 Activity-Level Performance
The confusion matrix of the Kyoto7 data set is presented in Fig. 10. The proposed method is highly effective in the activities of the type of “Meal Preparation”, “R2 Bed to Toilet”, and “R2 Work”, whose classification accuracies are 97.06%, 84.62%, and 92.86%, respectively. The recognition accuracy is enhanced by the capability of the proposed approach to learn parallel activities. There are certain activities that are not easy because of the similarity in spatial locations. An example is that “R1 Bed to Toilet” misclassifies 9.09% of the cases as representing R2 Bed to Toilet, and that “R1 Personal Hygiene” misclassifies 26.67% of the cases as “R1 Bed to Toilet”. “Watch TV and Study” exhibits a relatively low performance with 80.00% and 33.33% of the accuracy of the classification and misclassification into the Other category, respectively. The “Study” activity has often been confused with “Watching TV” and has a rate of confusion of 18% in this type of activity. Both are put in the same physical location and include overlapping sensor activations. The first difference between the two activities is that sensor usage: “Watching TV” is the activity where both the TV sensor and the couch pressure sensor are used, but Study is the activity where, almost all the time, the couch pressure sensor is used. Since the TV sensor is not active when the TV is neither watched nor it is widely triggered, the spatial-temporal patterns are similar, resulting in misclassifications.
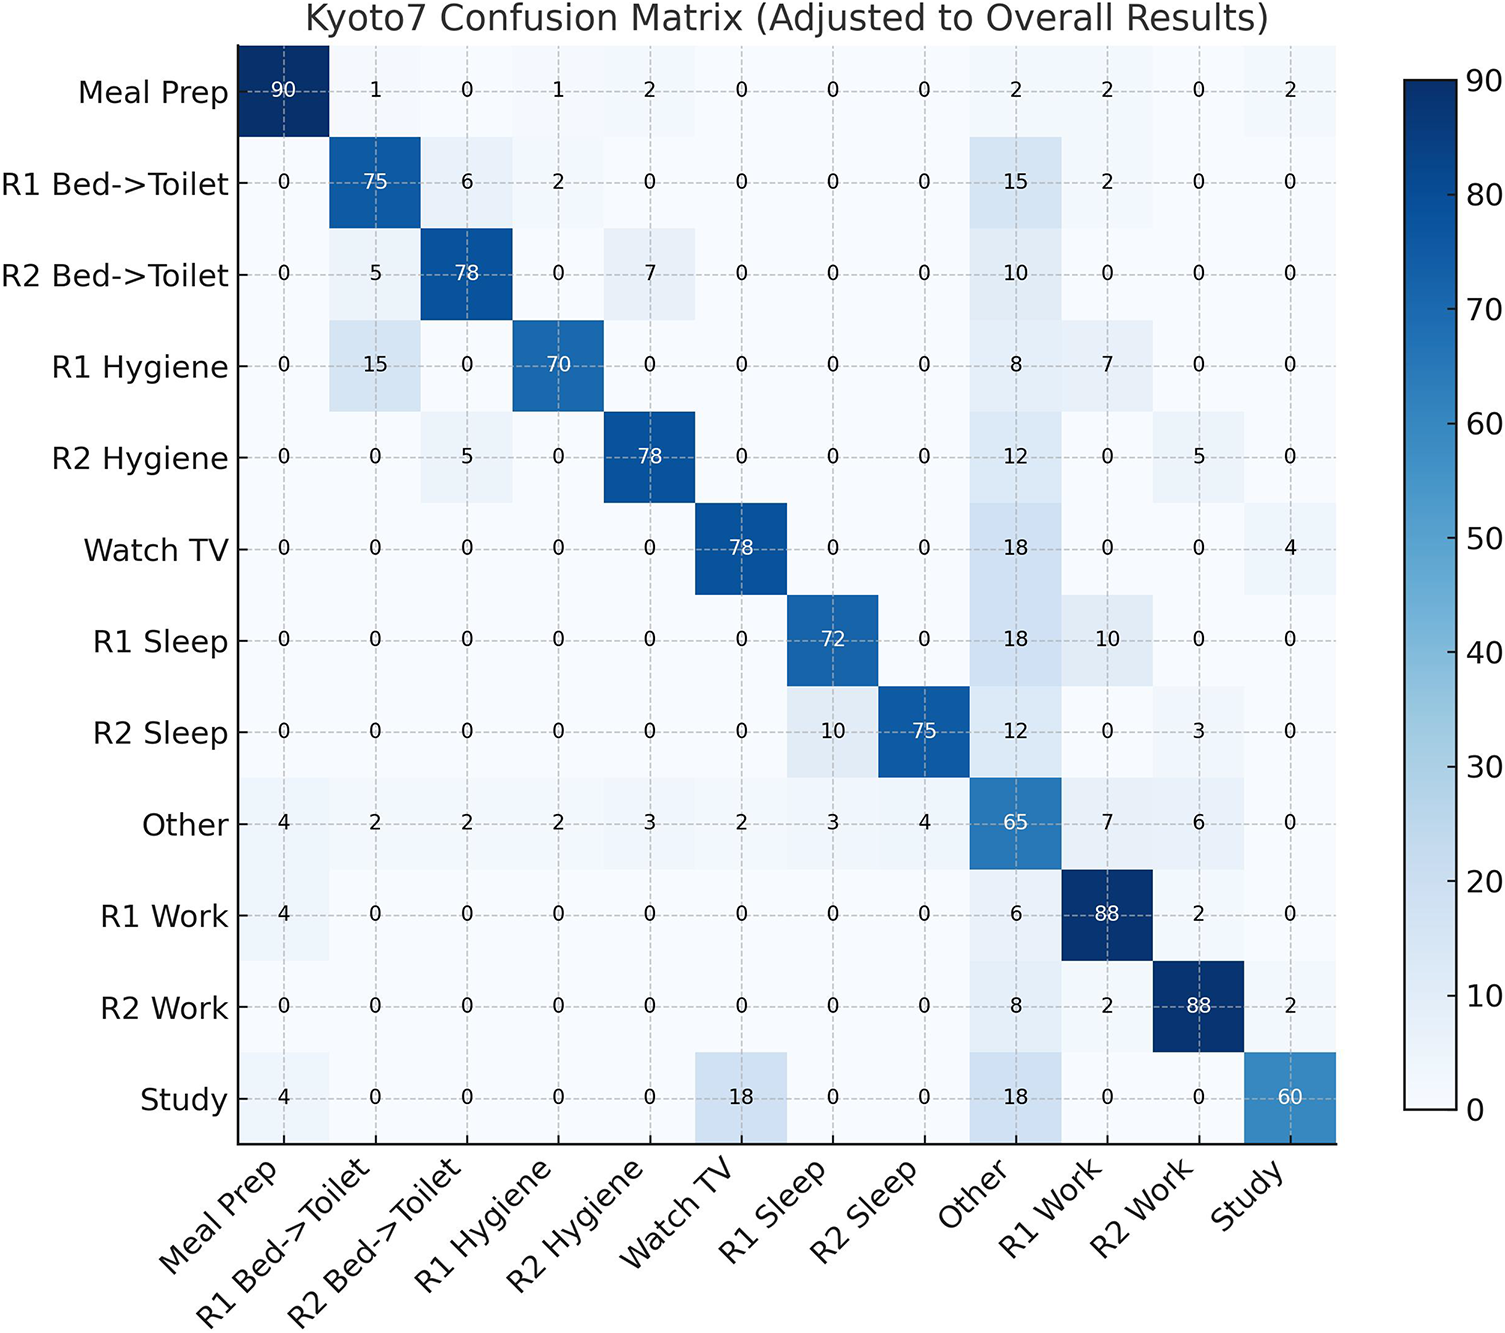
Figure 10: Confusion matrix for Kyoto7 activities.
The confusion matrix of the Kyoto8 dataset is presented in Fig. 11. Most of the activities have high accuracy in the proposed approach. Other activities, like “R2 Sleep”, “R2 Work”, and “R1 Work”, have almost perfect results, with the percentages of 97.97, 100.00, and 96.97, respectively. There are moderate misclassifications, though, on some of the activities. To take an example, the classification accuracy of the category “R1 Shower” and “R2 Shower” is 78.57% and 77.78%, respectively, and they are primarily confused with one another or with the category “R1 Sleep”. Likewise, the accuracy of “Grooming” and “R1 Wakeup” is 87.50% with some being false to other categories. Other activities like “Cleaning” and “R1 Bed to Toilet” display better results than previous scores, where their classification accuracy is 75.00% and 80.00%, respectively, meaning that the misclassification is lesser in full. These findings indicate that the suggested method is capable of effectively yielding a spatial and temporal sequence of binary sensor images, even in cases where there is overlap of activities at the same location. Approximately one out of every four times, the Cleaning activity is mistaken with the “Cooking” activity. The major cause of this confusion is that cleaning activities are commonly carried out in the kitchen and generate sensor activation patterns that are significantly similar to those associated with cooking. Also, the “Cleaning” activity has comparatively fewer training instances than the “Cooking”, which adversely impacts the model in learning a discriminative feature on this class and leads to an increase in misclassification rates.
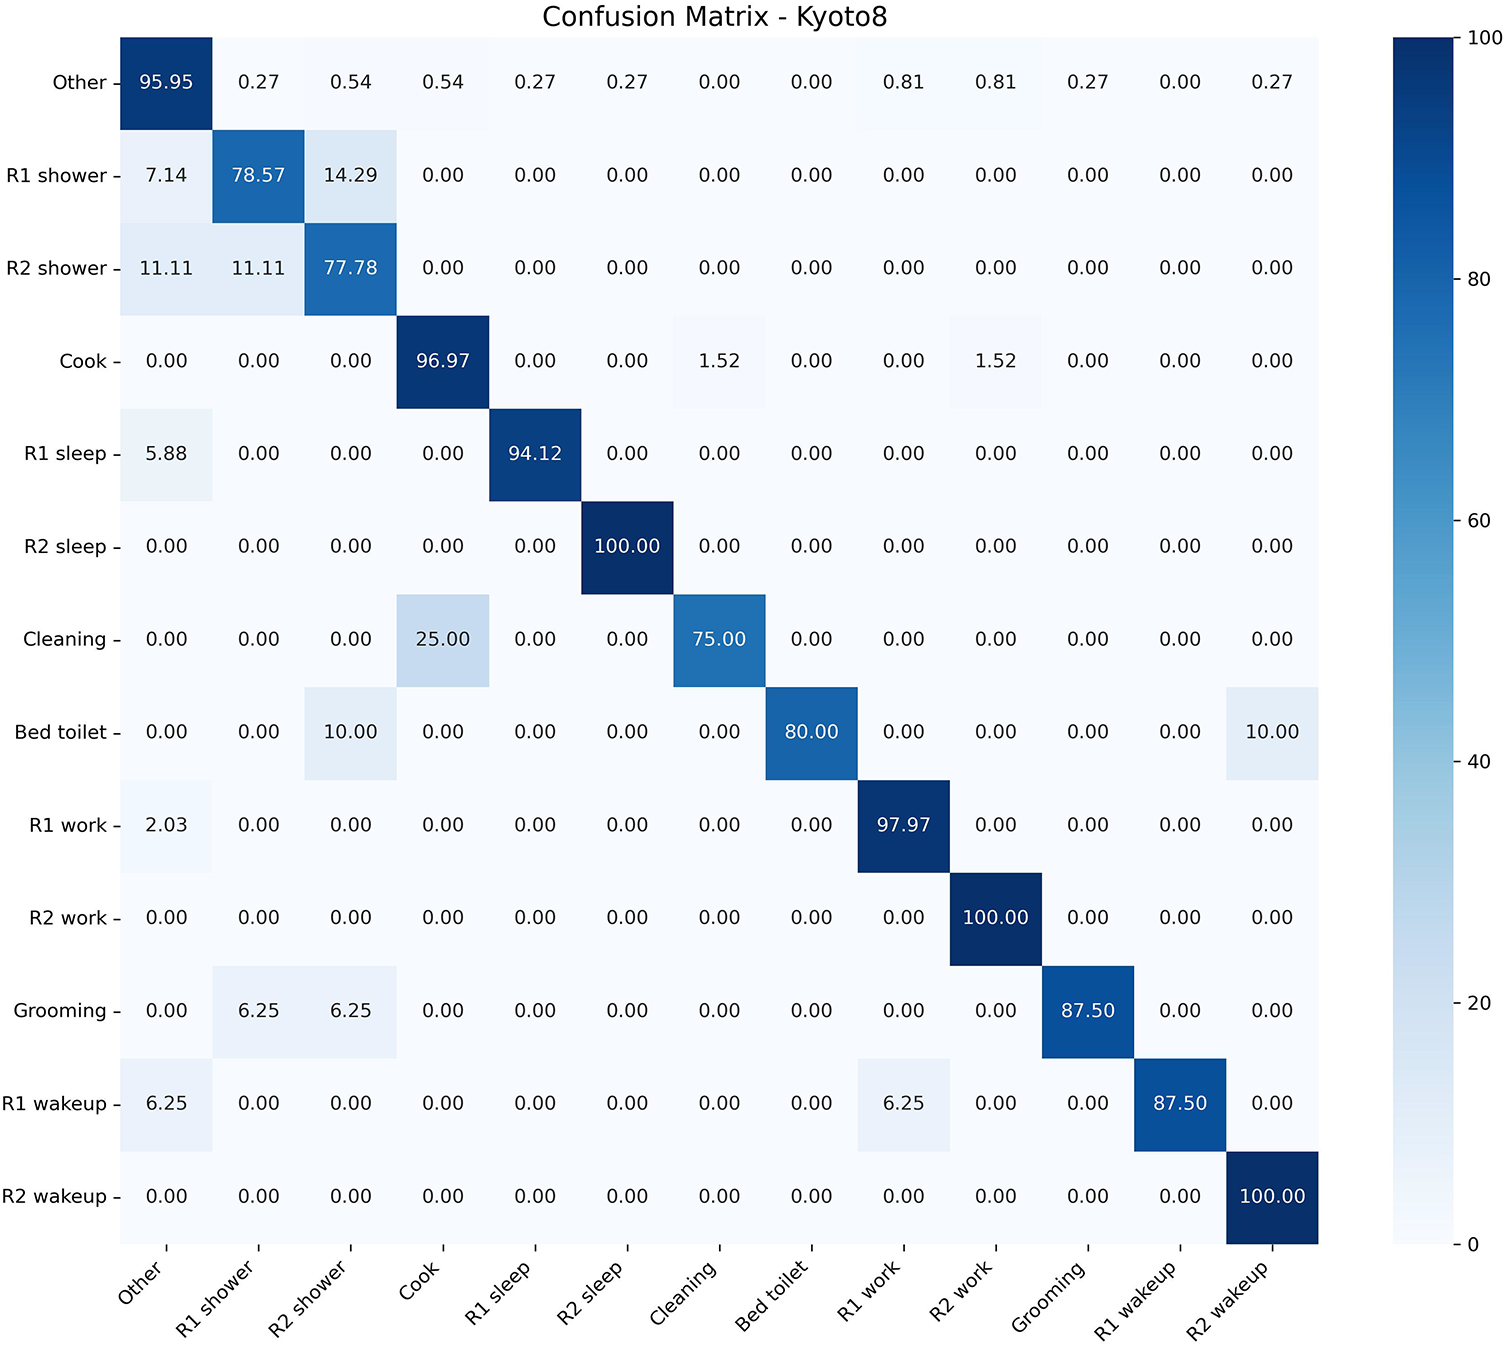
Figure 11: Confusion matrix for Kyoto8 activities.
The confusion matrix of the Cairo dataset is presented in Fig. 12. The suggested method has a higher classification accuracy in various activities. Tasks like “R1 Wake”, “Laundry”, and “R2 Take Medicine” are classified with 100.00%. Other activities like “R1 Work” and “Night Wandering” are also well performing with some slight misclassifications to Other. But meal-related events like “Breakfast” and “Dinner” have an increased rate of misclassification, as there is a difficulty in identifying those activities wherein the spatial context is the same. It means that the performance of the proposed approach is high in general, but activities in close geographic positions cannot be entirely separated. However, “Breakfast” and “Dinner” activities are seen to be confused. Precisely, 44% of the “Breakfast” instances are incorrectly recognized as the “Dinner” and 14% of the Dinner instances are incorrectly recognized as the “Breakfast”. The sequences of actions used in each of the two activities are similar, and they are done in the same places and almost the same sets of sensors, leading to very high overlaps in spatial-temporal patterns. In contrast to the Kyoto datasets, where the activities are clustered on a higher level, like “Preparing Meal” or “Cooking”, the Cairo dataset classifies “Breakfast” and “Dinner” as two different classes. This more detailed classification raises the classification problem and contributes to more confusion between these highly similar activities.
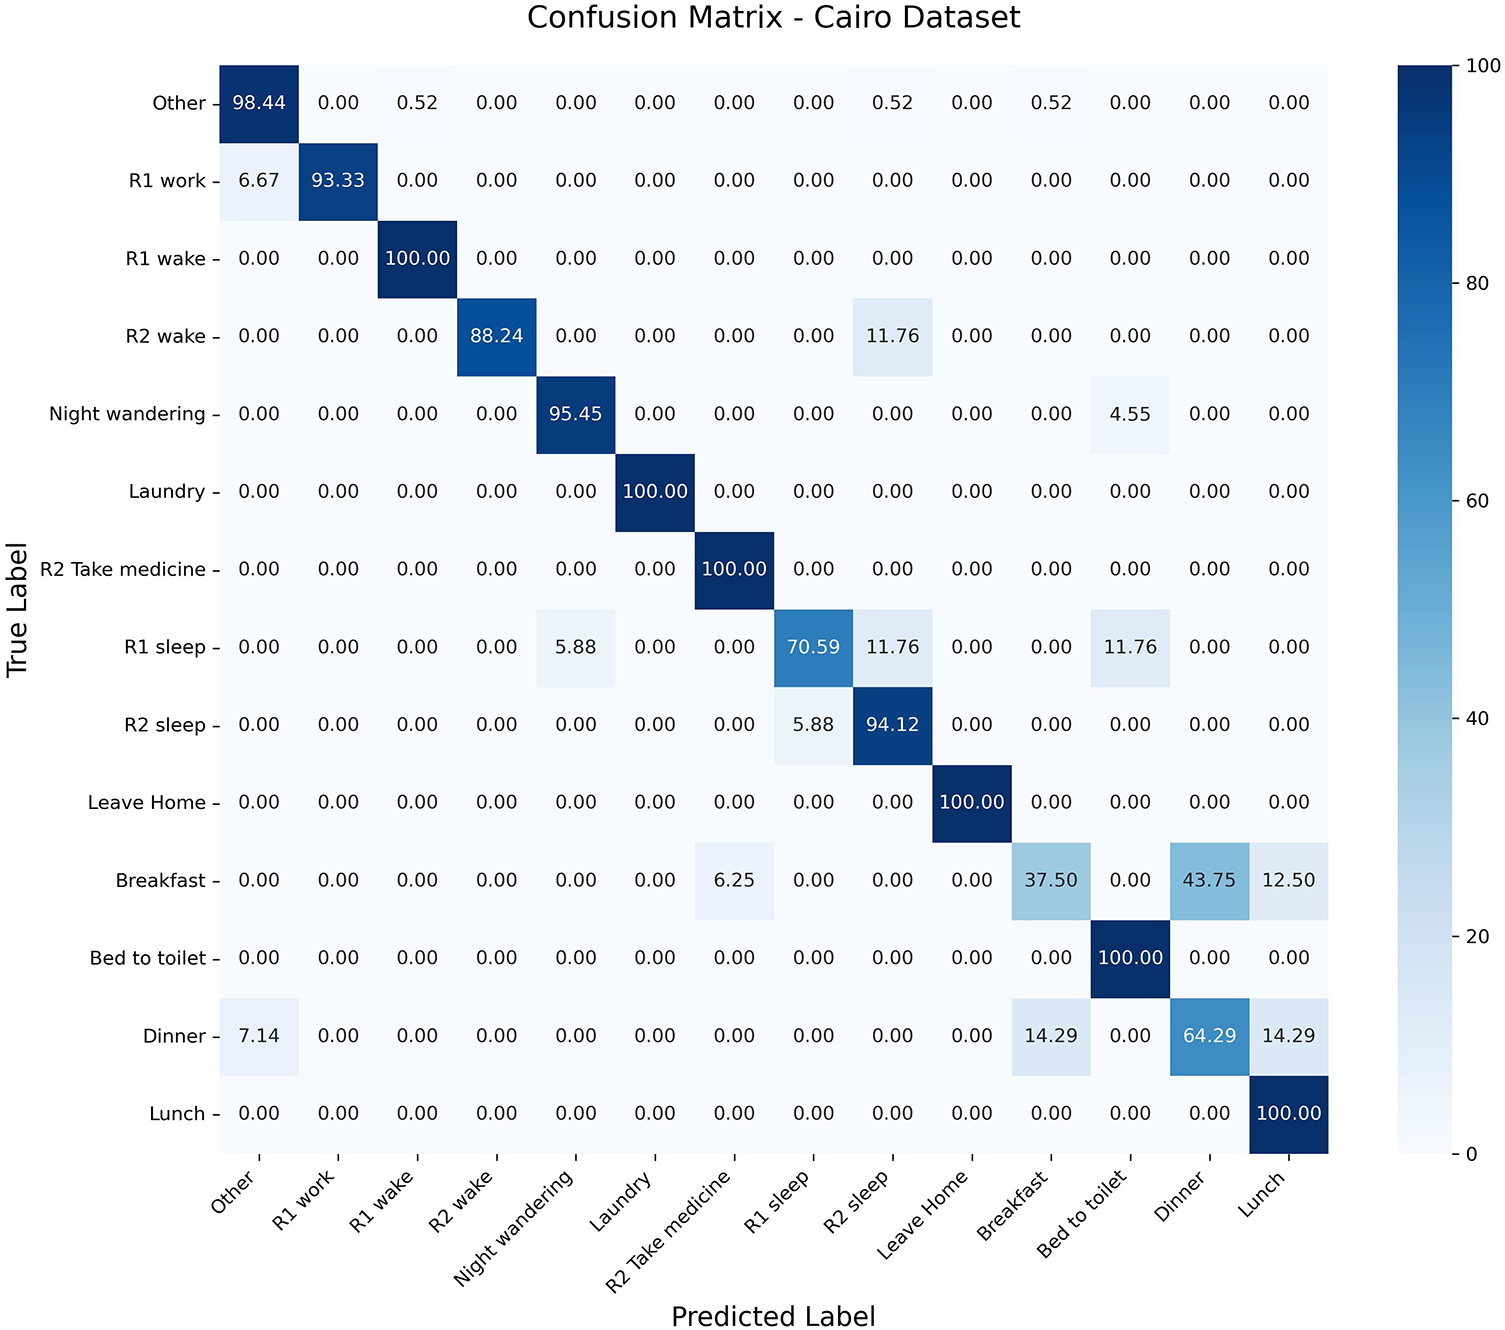
Figure 12: Confusion matrix for Cairo activities.
The proposed multi-resident human activity recognition approach introduces a new system to transform sensor-based activity data into binary images that are useful in effectively capturing space and time characteristics. The proposed technique will allow a YOLO-based object detection system to classify each activity as an object among overlapping activities that are simultaneously performed by converting sensor activations into representations of the image. Empirical findings indicate that the proposed model is superior to the current methods in terms of all performance indicators on various smart home data. Such performance enhancement signifies that the spatial-temporal feature representation is effective in enhancing the recognition accuracy and generalization in different environments. Additionally, the fact that activities can be represented as image-based patterns also renders the model scalable and can be adapted to various multi-resident smart home environments. Future studies will be based on the segmentation of activities according to their positions for enhanced recognition.
Acknowledgement: Not applicable.
Funding Statement: The authors received no specific funding for this study.
Author Contributions: Hafiz Safdar Sultan and Labiba Gillani Fahad contributed to the conceptualization of the study. Hafiz Safdar Sultan developed the methodology, software, performed the investigation, data curation, formal analysis, visualization, and wrote the original draft. Labiba Gillani Fahad and Noshina Tariq supervised the research. Validation was carried out by Hafiz Safdar Sultan, Labiba Gillani Fahad, and Noshina Tariq. Resources were provided by Noor Zaman Jahnjhi. Writing—review and editing were conducted by Noshina Tariq, and Mamoona Humayun. Funding acquisition was supported by Noor Zaman Jahnjhi. All authors reviewed and approved the final version of the manuscript.
Availability of Data and Materials: Data used in current research is publicly available at https://casas.wsu.edu/.
Ethics Approval: Not applicable.
Conflicts of Interest: The authors declare no conflicts of interest.
References
1. Arrotta L, Civitarese G, Chen X, Cumin J, Bettini C. Multi-subject human activities: a survey of recognition and evaluation methods based on a formal framework. Expert Syst Appl. 2025;267:126178. doi:10.1016/j.eswa.2024.126178. [Google Scholar] [CrossRef]
2. Yadav SK, Tiwari K, Pandey HM, Akbar SA. A review of multimodal human activity recognition with special emphasis on classification, applications, challenges and future directions. Knowl Based Syst. 2021;223:106970. doi:10.1016/j.knosys.2021.106970. [Google Scholar] [CrossRef]
3. Khan MTR, Ever E, Eraslan S, Yesilada Y. Human activity recognition using binary sensors: a systematic review. Inf Fusion. 2025;115(6):102731. doi:10.1016/j.inffus.2024.102731. [Google Scholar] [CrossRef]
4. Karim M, Khalid S, Aleryani A, Khan J, Ullah I, Ali Z. Human action recognition systems: a review of the trends and state-of-the-art. IEEE Access. 2024;12:36372–90. doi:10.1109/ACCESS.2024.3373199. [Google Scholar] [CrossRef]
5. Bouchabou D, Nguyen SM, Lohr C, LeDuc B, Kanellos I. A survey of human activity recognition in smart homes based on IoT sensors algorithms: taxonomies, challenges, and opportunities with deep learning. Sensors. 2021;21(18):6037. doi:10.3390/s21186037. [Google Scholar] [PubMed] [CrossRef]
6. Kim TH, Ojo S, Krichen M, Alamro MA, Mihoub A, Sampedro GA. Automated explainable and interpretable framework for anomaly detection and human activity recognition in smart homes. Neural Comput Appl. 2025;37(16):9295–308. doi:10.1007/s00521-025-10991-3. [Google Scholar] [CrossRef]
7. Cejudo A, Beristain A, Almeida A, Rebescher K, Martín C, Macía I. Smart home-assisted anomaly detection system for older adults: a deep learning approach with a comprehensive set of daily activities. Med Biol Eng Comput. 2025;63(6):1821–35. doi:10.1007/s11517-025-03308-y. [Google Scholar] [PubMed] [CrossRef]
8. Rahman S, Ahmed SF, Shahid O, Arrafi MA, Ahad M. Automated detection approaches to autism spectrum disorder based on human activity analysis: a review. Cogn Comput. 2022;14(5):1773–800. doi:10.1007/s12559-021-09895-w. [Google Scholar] [CrossRef]
9. Zheng W, Yan L, Gou C, Wang FY. Meta-learning meets the internet of things: graph prototypical models for sensor-based human activity recognition. Inf Fusion. 2022;80:1–22. [Google Scholar]
10. Li Q, Gravina R, Li Y, Alsamhi SH, Sun F, Fortino G. Multi-user activity recognition: challenges and opportunities. Inf Fusion. 2020;63:121–35. doi:10.1016/j.inffus.2020.06.004. [Google Scholar] [CrossRef]
11. Li Q, Huangfu W, Farha F, Zhu T, Yang S, Chen L, et al. Multi-resident type recognition based on ambient sensors activity. Future Gener Comput Syst. 2020;112:108–15. doi:10.1016/j.future.2020.04.039. [Google Scholar] [CrossRef]
12. Qiu S, Zhao H, Jiang N, Wang Z, Liu L, An Y, et al. Multi-sensor information fusion based on machine learning for real applications in human activity recognition: state-of-the-art and research challenges. Inf Fusion. 2022;80(2):241–65. doi:10.1016/j.inffus.2021.11.006. [Google Scholar] [CrossRef]
13. Tran SN, Nguyen D, Ngo TS, Vu XS, Hoang L, Zhang Q, et al. On multi-resident activity recognition in ambient smart-homes. Artif Intell Rev. 2020;53:3929–45. doi:10.1007/s10462-019-09783-8. [Google Scholar] [CrossRef]
14. Abdel-Basset M, Hawash H, Chang V, Chakrabortty RK, Ryan M. Deep learning for heterogeneous human activity recognition in complex IoT applications. IEEE Internet Things J. 2020;9(8):5653–65. doi:10.1109/jiot.2020.3038416. [Google Scholar] [CrossRef]
15. Jethanandani M, Sharma A, Perumal T, Chang JR. Multi-label classification based ensemble learning for human activity recognition in smart home. Internet Things. 2020;12(6):100324. doi:10.1016/j.iot.2020.100324. [Google Scholar] [CrossRef]
16. Tran SN, Ngo TS, Zhang Q, Karunanithi M. Mixed-dependency models for multi-resident activity recognition in smart homes. Multim Tools Appl. 2020;79:23445–60. doi:10.1007/s11042-020-09093-0. [Google Scholar] [CrossRef]
17. Wang X, Liu J, Moore SJ, Nugent CD, Xu Y. A behavioural hierarchical analysis framework in a smart home: integrating HMM and probabilistic model checking. Inf Fusion. 2023;95(3):275–92. doi:10.1016/j.inffus.2023.02.025. [Google Scholar] [CrossRef]
18. Natani A, Sharma A, Perumal T. Sequential neural networks for multi-resident activity recognition in ambient sensing smart homes. Appl Intell. 2021;51:6014–28. doi:10.1007/s10489-020-02134-z. [Google Scholar] [CrossRef]
19. Liciotti D, Bernardini M, Romeo L, Frontoni E. A sequential deep learning application for recognising human activities in smart homes. Neurocomputing. 2020;396(6):501–13. doi:10.1016/j.neucom.2018.10.104. [Google Scholar] [CrossRef]
20. Chen D, Yongchareon S, Lai EMK, Yu J, Sheng QZ, Li Y. Transformer with bidirectional GRU for nonintrusive, sensor-based activity recognition in a multiresident environment. IEEE Internet Things J. 2022;9:23716–27. doi:10.1109/jiot.2022.3190307. [Google Scholar] [CrossRef]
21. Chen H, Gouin-Vallerand C, Bouchard K, Gaboury S, Couture M, Bier N, et al. Enhancing human activity recognition in smart homes with self-supervised learning and self-attention. Sensors. 2024;24(3):884. doi:10.3390/s24030884. [Google Scholar] [PubMed] [CrossRef]
22. Ramanujam E, Perumal T. MLMO-HSM: multi-label multi-output hybrid sequential model for multi-resident smart home activity recognition. J Ambient Intell Human Comput. 2023;14:2313–25. doi:10.1007/s12652-022-04487-4. [Google Scholar] [CrossRef]
23. Mim TR, Amatullah M, Afreen S, Yousuf MA, Uddin S, Alyami SA, et al. GRU-Inc: an inception-attention based approach using GRU for human activity recognition. Expert Syst Appl. 2023;216:119419. doi:10.1016/j.eswa.2022.119419. [Google Scholar] [CrossRef]
24. Plötz T. Using graphs to perform effective sensor-based human activity recognition in smart homes. Sensors. 2024;24(12):3944. doi:10.3390/s24123944. [Google Scholar] [PubMed] [CrossRef]
25. Muniasamy A, Asiri F. Advanced human activity recognition on wearables with multi-scale sparse attention. Multimed Tools Appl. 2025:1–30. doi:10.1007/s11042-024-20475-6. [Google Scholar] [CrossRef]
26. Hu L, Zhao K, Ling BWK, Liang S, Wei Y. Improving human activity recognition via graph attention network with linear discriminant analysis and residual learning. Biomed Signal Process Control. 2025;100(4):107053. doi:10.1016/j.bspc.2024.107053. [Google Scholar] [CrossRef]
27. Feng H, Shen Q, Song R, Shi L, Xu H. ATFA: adversarial time-frequency attention network for sensor-based multimodal human activity recognition. Expert Syst Appl. 2024;236:121296. doi:10.1016/j.eswa.2023.121296. [Google Scholar] [CrossRef]
28. Dahou A, Al-Qaness MA, Elaziz MA, Helmi AM. MLCNNwav: multilevel convolutional neural network with wavelet transformations for sensor-based human activity recognition. IEEE Internet Things J. 2023;11:820–8. doi:10.1109/JIOT.2023.3286378. [Google Scholar] [CrossRef]
29. Xu Z, Wang G, Guo X. Event-driven daily activity recognition with enhanced emergent modeling. Pattern Recognit. 2023;135(1):109149. doi:10.1016/j.patcog.2022.109149. [Google Scholar] [CrossRef]
30. Bouchabou D, Nguyen SM, Lohr C, LeDuc B, Kanellos I. Using language model to bootstrap human activity recognition ambient sensors based in smart homes. Electronics. 2021;10:2498. doi:10.3390/electronics10202498. [Google Scholar] [CrossRef]
31. Li Y, Yang G, Su Z, Li S, Wang Y. Human activity recognition based on multi-environment sensor data. Inf Fusion. 2023;91(7):47–63. doi:10.1016/j.inffus.2022.10.015. [Google Scholar] [CrossRef]
32. Nawal Y, Oussalah M, Fergani B, Fleury A. New incremental SVM algorithms for human activity recognition in smart homes. J Ambient Intell Human Comput. 2023;14:13433–50. doi:10.1007/s12652-022-03798-w. [Google Scholar] [CrossRef]
33. Gul MA, Yousaf MH, Nawaz S, Ur Rehman Z, Kim H. Patient monitoring by abnormal human activity recognition based on CNN architecture. Electronics. 2020;9(12):1993. doi:10.3390/electronics9121993. [Google Scholar] [CrossRef]
34. CASAS Smart Home Project, Washington State University. CASAS smart home datasets. Pullman, WA, USA: Washington State University; 2012 [cited 2026 Feb 26]. Available from: http://ailab.wsu.edu/casas/datasets/. [Google Scholar]
35. Ismail Fawaz H, Lucas B, Forestier G, Pelletier C, Schmidt DF, Weber J, et al. Inceptiontime: finding alexnet for time series classification. Data Min Know Disc. 2020;34(6):1936–62. [Google Scholar]
36. Karim F, Majumdar S, Darabi H, Harford S. Multivariate LSTM-FCNs for time series classification. Neural Netw. 2019;116(2):237–45. doi:10.1016/j.neunet.2019.04.014. [Google Scholar] [PubMed] [CrossRef]
37. Guenounou A, Aillerie M, Mahrane A, Bouzaki M, Boulouma S, Charles JP. Human home daily living activities recognition based on a LabVIEW implemented hidden Markov model. Multim Tools Appl. 2021;80(16):24419–35. doi:10.1007/s11042-021-10814-2. [Google Scholar] [CrossRef]
Cite This Article
 Copyright © 2026 The Author(s). Published by Tech Science Press.
This work is licensed under a Creative Commons Attribution 4.0 International License , which permits unrestricted use, distribution, and reproduction in any medium, provided the original work is properly cited.
 Downloads
 Citation Tools