
 Submit a Paper
 Propose a Special lssue
 Open Access
ARTICLE

A Data Science Framework for Predicting the Creep Rupture Life of 1.25Cr- 0.5Mo Steel for Elevated Temperature Applications
Department of Materials Engineering and Convergence Technology, Gyeongsang National University, 501, Jinju-daero, Jinju, Gyeongsangnam-do, Republic of Korea
* Corresponding Authors: Sung-Gyu Kang. Email: ; Nagireddy Gari Subba Reddy. Email:
(This article belongs to the Special Issue: Machine Learning Methods in Materials Science)
Computers, Materials & Continua 2026, 87(3), 34 https://doi.org/10.32604/cmc.2026.077416
Received 09 December 2025; Accepted 20 February 2026; Issue published 09 April 2026
 View Full Text
 Download PDF
Abstract
The long-term reliability of 1.25Cr-0.5Mo steels in high-temperature service critically depends on their creep rupture behavior, which is strongly influenced by alloy composition, microstructural characteristics, and testing conditions. In this study, an advanced Artificial Neural Network (ANN) model was developed to accurately predict the creep-rupture life of 1.25Cr-0.5Mo steels, offering a data-driven framework for alloy design and service-life assessment. The model incorporated eleven compositional variables (C, Si, Mn, P, S, Ni, Cr, Mo, Cu, Al, N), average grain size, non-metallic inclusions (NMI), steel properties including hardness measured on the Rockwell B scale (HRB) yield strength (MPa), ultimate tensile strength (MPa), elongation (%), reduction in area (%), and test conditions including temperature (°C) and stress (MPa) as input features, with rupture time as the output. A total of 276 experimental datasets were compiled, of which 219 were used for training and 57 for testing. To optimize predictive performance, a systematic hyperparameter evaluation was performed. Network architectures with one to three hidden layers and 10–30 neurons per layer were examined. The optimal configuration—three hidden layers with 21 neurons—achieved outstanding predictive accuracy, yielding an RMSE of 0.00007, an adjusted R2 of 0.9930, a Pearson’s r of 0.9965, and a minimum MAE of 0.0504. Further optimization of training parameters showed that a momentum coefficient of 0.6 and a learning rate of 0.7 provided the most stable convergence behavior, while 9000 training iterations produced the lowest RMSE (0.000021). Five-fold cross-validation was employed to further assess the model’s predictive reliability and generalization. The predictive performance of the developed ANN model was further compared with multiple established machine-learning approaches to demonstrate its relative accuracy and generalization capability. The optimized ANN model was deployed in a user-friendly graphical interface (GUI) to facilitate practical implementation. Sensitivity analyses using both single-variable and two-variable approaches revealed the dominant role of key alloying elements, as well as the strong effects of test temperature and rupture stress on rupture life. The developed data science framework provides a powerful and reliable tool for predicting creep-rupture life across a broad compositional and testing window, enabling accelerated design and optimization of 1.25Cr-0.5Mo steels for high-temperature applications.Keywords
Supplementary Material
Supplementary Material FileNomenclature
| NMI | Non-metallic Inclusions |
| GUI | Graphical User Interface |
| MAE | Mean Absolute Error |
Extreme service conditions, especially elevated temperatures in heaters, pressure vessels, boilers, and many components of power generation systems, demand structural materials that can endure sustained mechanical loading [1]. Among the available candidates, steels belonging to the chromium-molybdenum (Cr-Mo) family have long been regarded as reliable materials for such environments because they offer excellent resistance to corrosion, pronounced resistance to high temperature oxidation, and remarkable creep strength [2,3]. The steels containing approximately 1.25 (wt.%) Cr and 0.5 (wt.%) Mo are a widely employed low alloy heat-resistant steel of this family. The oxidation resistance imparted by Cr and the creep strength contributed by Mo arise from the characteristic equiaxed ferrite and lamellar pearlite microstructure of 1.25Cr-0.5Mo steel [4]. Prolonged exposure to high temperatures under sustained loading can induce substantial microstructural evolution in 1.25Cr-0.5Mo steel, leading to consequential changes in mechanical performance [5]. Such conditions often trigger phase transformations and the precipitation of various carbide and intermetallic phases that influence long-term stability and serviceability [6]. Numerous studies have demonstrated that thermal exposure promotes precipitation in Cr-Mo steels [7–10], with time–temperature–precipitation diagrams [6] offering insight into the nature and kinetics of these phases.
Experimental characterization to elucidate the effects of chemical composition and test conditions on the creep rupture life of 1.25Cr-0.5Mo steels is inherently time-consuming and resource-intensive, requiring advanced equipment, technical expertise, and detailed metallurgical knowledge. Moreover, an incomplete understanding of microstructural evolution can lead to inaccurate assessment of life, increasing the risk of unexpected component failure with serious safety and economic consequences. To complement experimental investigations and improve predictive efficiency, data-driven methodologies, particularly machine learning (ML) approaches, have been increasingly adopted to model mechanical [11], thermal [12], fatigue [13], and creep responses [14] of steels with enhanced accuracy and efficiency. Several attempts have been made to predict the creep rupture life of 1.25Cr-0.5Mo steels using methods such as the Omega approach [15], Orr-Sherby-Dorn parametric techniques [16], and Larson Miller parameters [17]. However, these methodologies involve extensive calculations, numerous parameters, and complex statistical treatments, which limit their practicality for industrial applications. ML-based creep life prediction models have also been explored previously, but the reported accuracies remain relatively low. For instance, Sakurai et al. [18] employed support vector regression (SVR), random forest (RF), and gradient boosting models to predict creep rupture life, but the resulting root mean squared error (RMSE) values were comparatively high: 0.14 for SVR, 0.28 for RF, and 0.22 for gradient tree boosting. Moreover, these studies did not provide insights into the combined effects of multiple variables and test conditions or quantify the relative importance of the contributing factors, leaving a significant gap in understanding the underlying composition–microstructure–creep relationships. Chai et al. [19] proposed a machine-learning-based creep life prediction model for 2.25Cr-1Mo steel using optimal feature selection, showing that an SVR model outperformed the traditional Larson–Miller approach. Their study demonstrated that accurate creep life prediction is achievable with a limited number of key input variables and can be implemented as a practical engineering tool. Recently, Chen et al. [20] demonstrated that ML, particularly a multi-layer perceptron model, can reliably predict the long-term creep rupture life of P91 steel with errors below 4%, outperforming other algorithms. Their sensitivity analysis further highlighted the dominant influence of chemical composition and heat-treatment conditions, underscoring the potential of ML frameworks as practical tools for supporting creep-resistant steel design.
Leveraging insights from prior ML-based studies on creep life prediction, this study aims to develop a user-friendly, knowledge-based artificial neural network (ANN) model for predicting the creep rupture life of 1.25Cr-0.5Mo steel by leveraging existing experimental datasets. The predictive capability of the developed ANN framework is evaluated against several established ML models to justify model selection and assess generalization. While the model does not explicitly encode metallurgical mechanisms, it effectively captures the combined influence of alloying elements and service temperature on creep behavior through data-driven learning. The predictions implicitly reflect underlying metallurgical trends and kinetic effects governing creep performance. In addition, the study provides quantitative insights and an intuitive graphical user interface, offering a practical decision-support tool to assist engineers and researchers in assessing creep performance and guiding alloy design within the bounds of available experimental knowledge.
2.1 Data Acquisition and Variable Selection
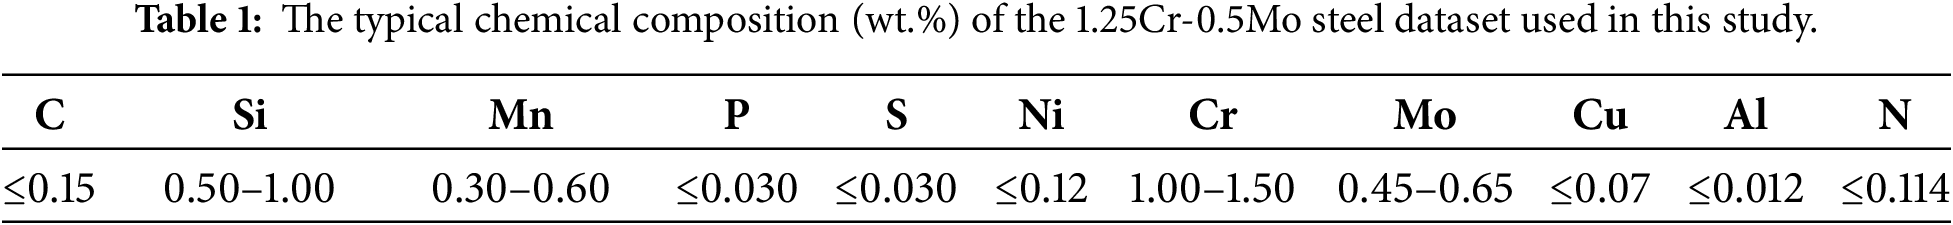
A comprehensive dataset comprising 276 entries was obtained from the National Institute for Materials Science (NIMS), Japan [21]. The dataset includes the chemical composition of 1.25Cr-0.5Mo steel, austenite grain size number (AGSN), Rockwell hardness (HRB), non-metallic inclusion (NMI) content, yield strength (MPa), ultimate tensile strength (MPa), elongation (%), reduction in area (%), test temperature (°C), applied stress (MPa), and creep life (log(tr)). The chemical composition ranges and representative values of the steel are summarized in Table 1.
According to the NIMS dataset documentation, creep testing was conducted using dog-bone-shaped, round tensile specimens machined from a 3000 kg industrial ingot. The material was subjected to a standard heat-treatment schedule consisting of solution treatment at 910 °C for 10 min, followed by aging at 670 °C for 70 min and subsequent air cooling. It is emphasized that all experimental data, including specimen geometry, processing history, mechanical properties, and creep rupture results, were sourced directly from the NIMS database, and no additional experiments were performed in the present study.
A statistical summary of the dataset is presented in Table 2, showing the minimum, maximum, mean, and standard deviation for all input and output variables. The chemical composition, AGSN, hardness, and NMI, mechanical properties at room temperature including yield strength (YS), ultimate tensile strength (UTS), elongation (El), reduction in area (RA) along with test conditions including temperature and stress, were designated as input variables, while the log(tr) was assigned as the output variable of the prediction model.
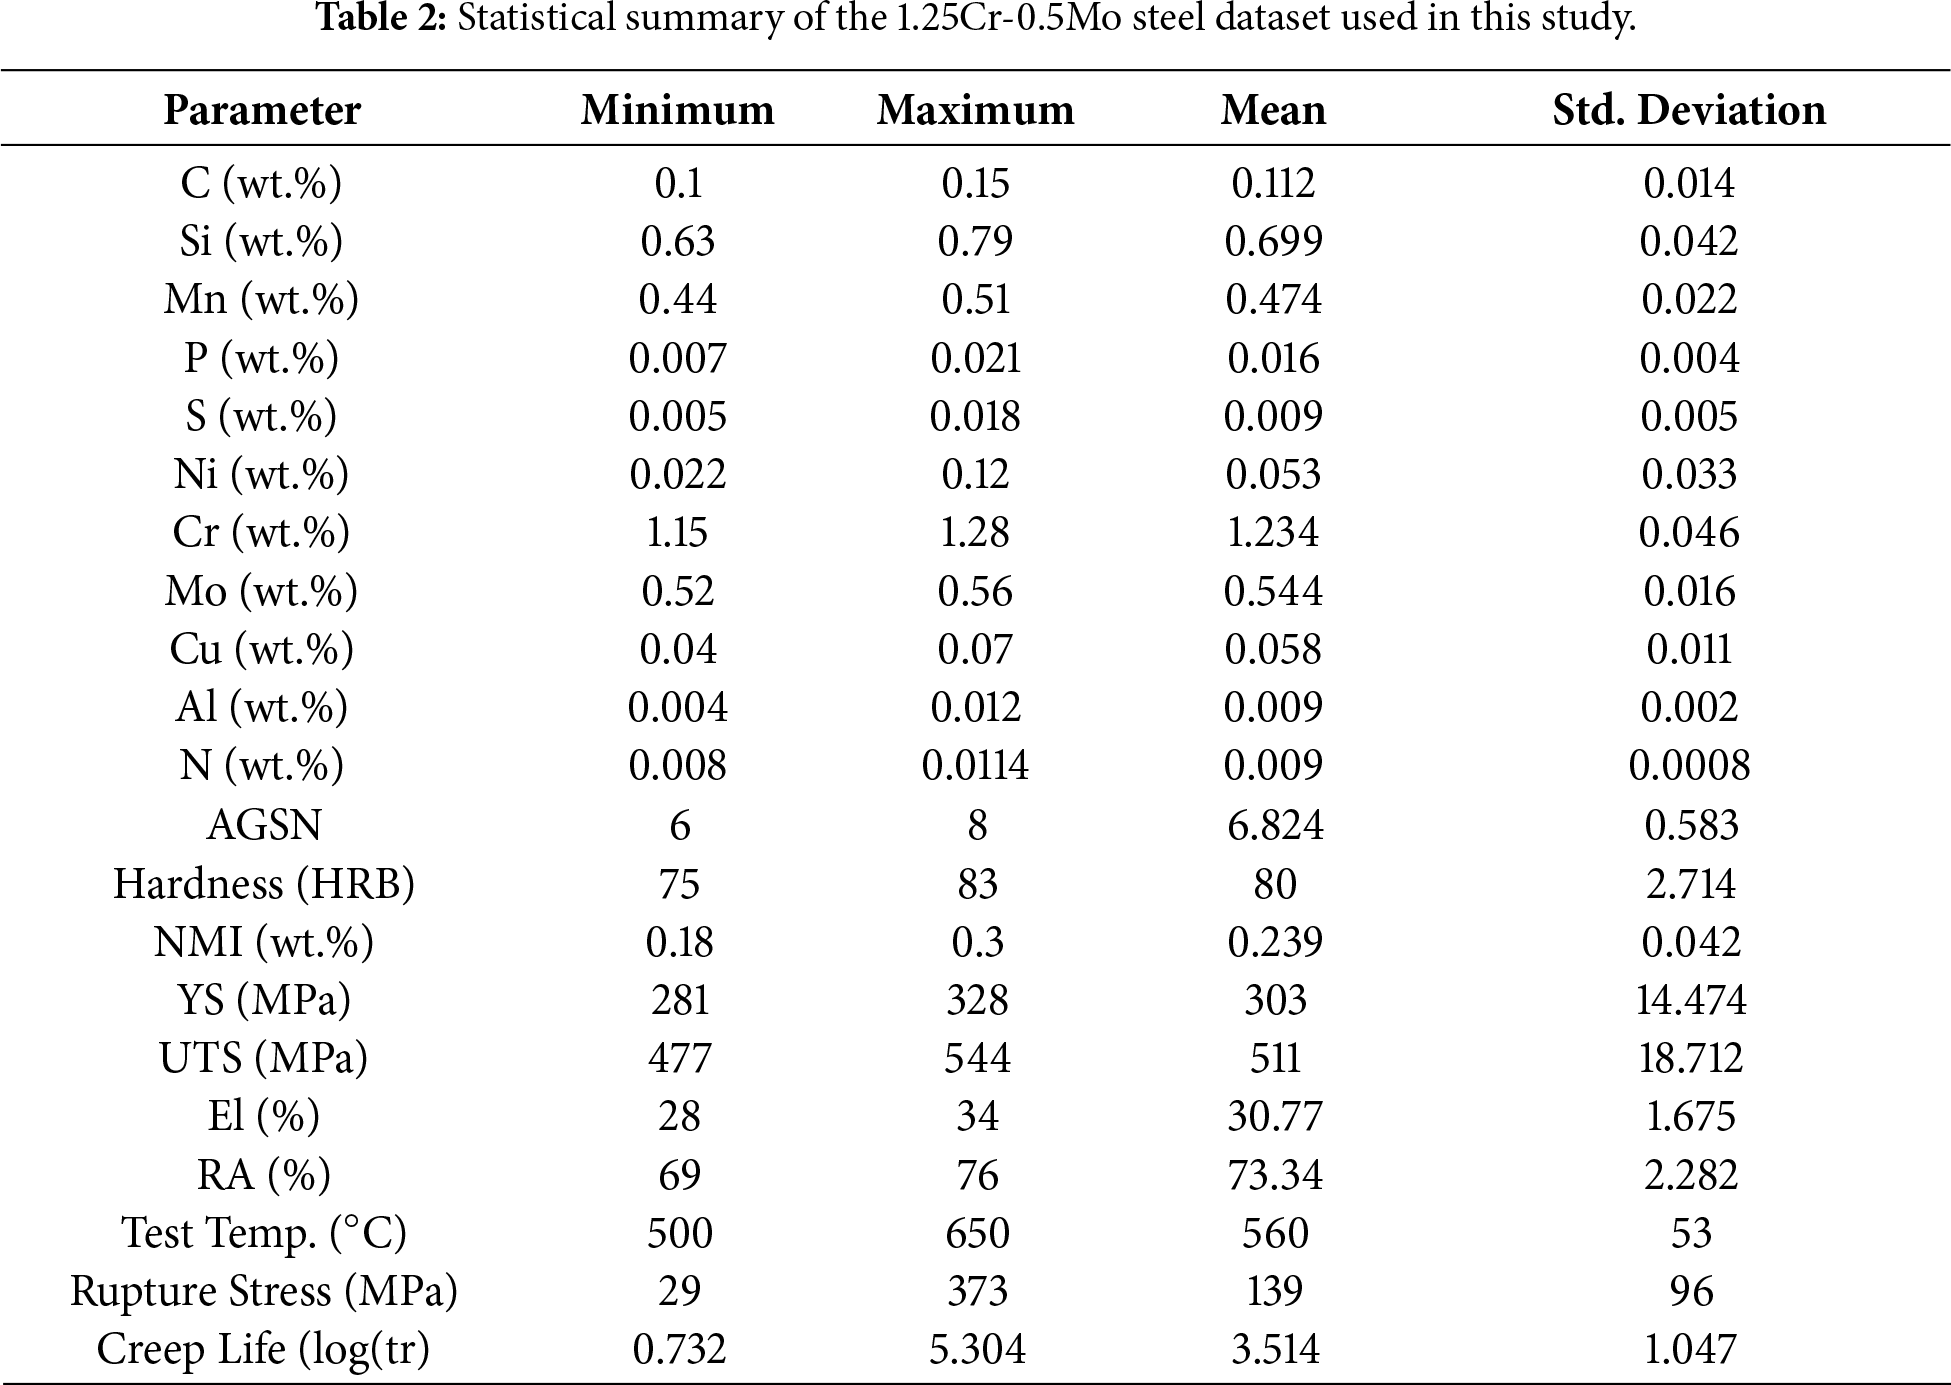
Fig. 1 illustrates the log(tr) distribution of the 1.25Cr-0.5Mo steel dataset used for creep-life prediction, displayed with a probability density curve. The data show a distinctly right-skewed distribution, with the majority of observations concentrated between log(tr) values of approximately 2.5 and 4.5, where bin counts reach their peak (around 40–45 occurrences). Lower log(tr) ranges contain comparatively fewer samples, and only a small number exceed log(tr) ≈ 5, indicating that very long rupture times are less common in the dataset. This distribution highlights the variability inherent in creep-rupture behavior for 1.25Cr-0.5Mo steel and underscores the importance of using statistical or machine-learning models capable of capturing non-uniform, asymmetric data patterns when predicting creep life.
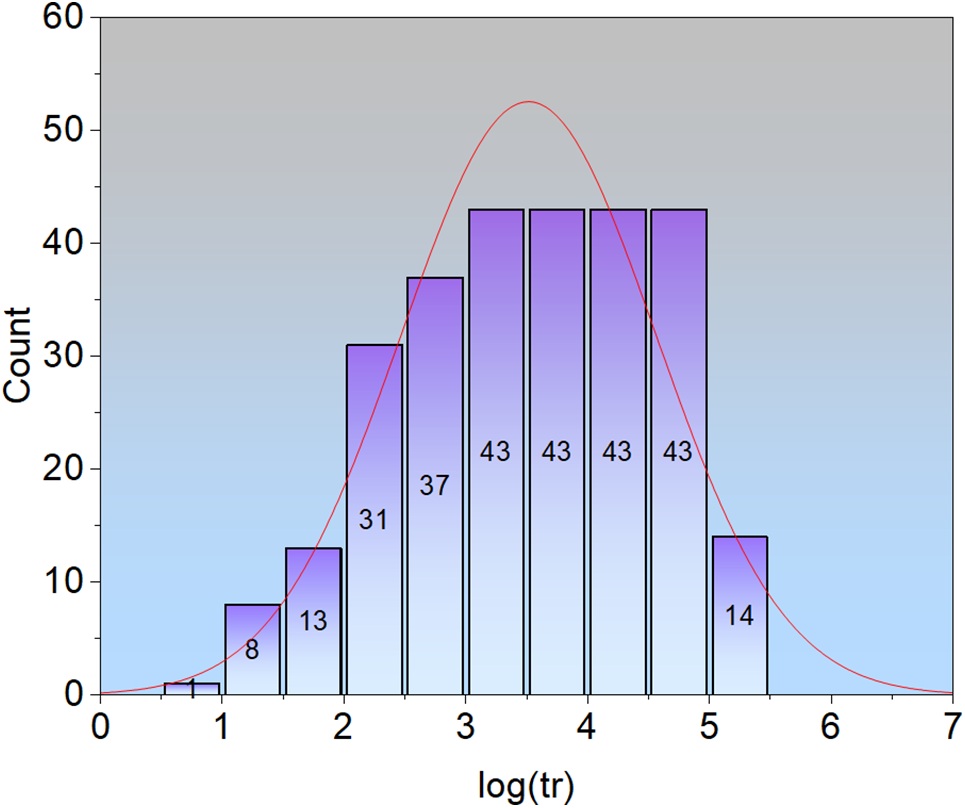
Figure 1: Histogram showing the data distribution of the 1.25Cr-0.5Mo steel dataset used in this study.
2.3 Construction of the Back-Propagation Knowledge-Based ANN Model
The ML model was developed using a Feedforward Neural Network (FFNN) trained with the standard backpropagation algorithm to capture the nonlinear relationships between the input variables and the creep-rupture life of 1.25Cr-0.5Mo steel. The network architecture comprises an input layer containing all predictor variables, one or more hidden layers serving as the computational core, and an output layer providing the predicted creep life. A sigmoid activation function was employed throughout the network to ensure smooth gradient propagation and stable convergence during training. To avoid symmetry in learning and facilitate effective optimization, the network weights were randomly initialized within the range −0.5 to +0.5. Prior to training, all input and output variables were normalized using a min–max scaling scheme, mapping the minimum and maximum values to 0.1 and 0.9, respectively. This normalization improved numerical stability and prevented saturation of the sigmoid activation function. Model training was performed by iteratively updating the network weights through backpropagation to minimize the error between predicted and experimentally observed values.
The complete dataset was randomly divided into a training subset comprising 80% of the data (219 datasets) and an independent testing subset containing the remaining 20% (57 datasets). The training data was used to optimize the network parameters, while the testing data was reserved exclusively for evaluating the predictive performance and generalization capability of the model. Backpropagation was selected due to its proven effectiveness in modeling complex multivariate metallurgical systems, where strong nonlinear interactions exist between composition, processing conditions, and creep behavior, as reported in previous studies [22]. The detailed working principles of the back-propagation algorithm are well documented in the literature [23]. All simulations were conducted under consistent computational settings to ensure reproducibility. Fig. 2 presents a schematic overview of the data-science framework adopted in this study, illustrating the workflow from data preprocessing to ANN-based prediction of creep-rupture life at elevated temperatures.
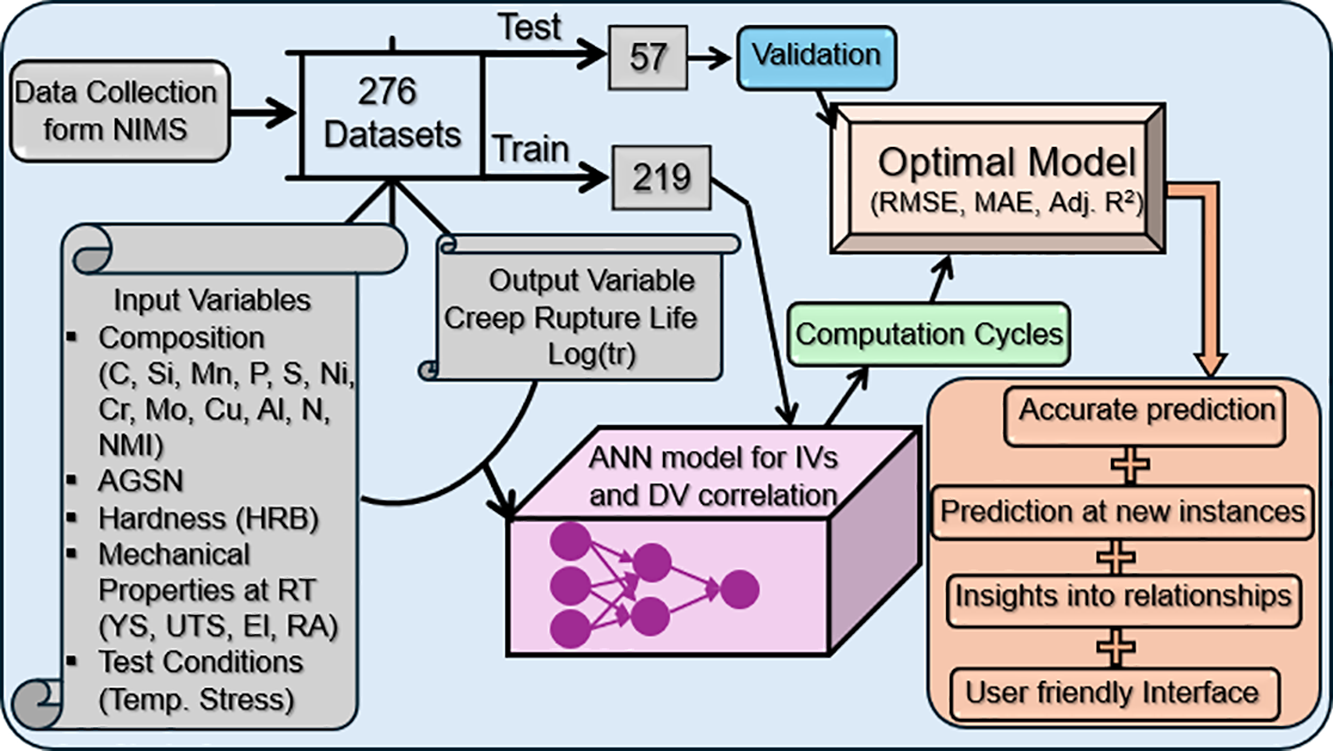
Figure 2: Schematic workflow of the data-science framework adopted for predicting the creep-rupture life of 1.25Cr-0.5Mo steel.
3.1 Training Behavior of the Developed Data Science ANN Model
3.1.1 Optimal Layers and Neurons
To optimize the performance of the developed model, various network architectures were systematically evaluated. The number of hidden layers was varied from one to three, and for each architecture, the number of neurons per layer was adjusted from 10 to 30. Model performance was assessed using four statistical indicators, such as RMSE, Adjusted R2 (adj. R2), Pearson’s r, and mean absolute error (MAE). Among all tested configurations, the architecture comprising three hidden layers with 21 neurons demonstrated the highest predictive accuracy, as illustrated in Fig. 3. This optimized model yielded the lowest RMSE of 0.00007 (Fig. 3a), the highest adj. R2 of 0.9930 (Fig. 3b), a maximum Pearson’s r of 0.9965 (Fig. 3c), and the minimum MAE of 0.0504 (Fig. 3d). The training behavior and performance trends for the single-layer and two-layer architectures are provided in Supplementary Figs. S1 and S2, respectively.
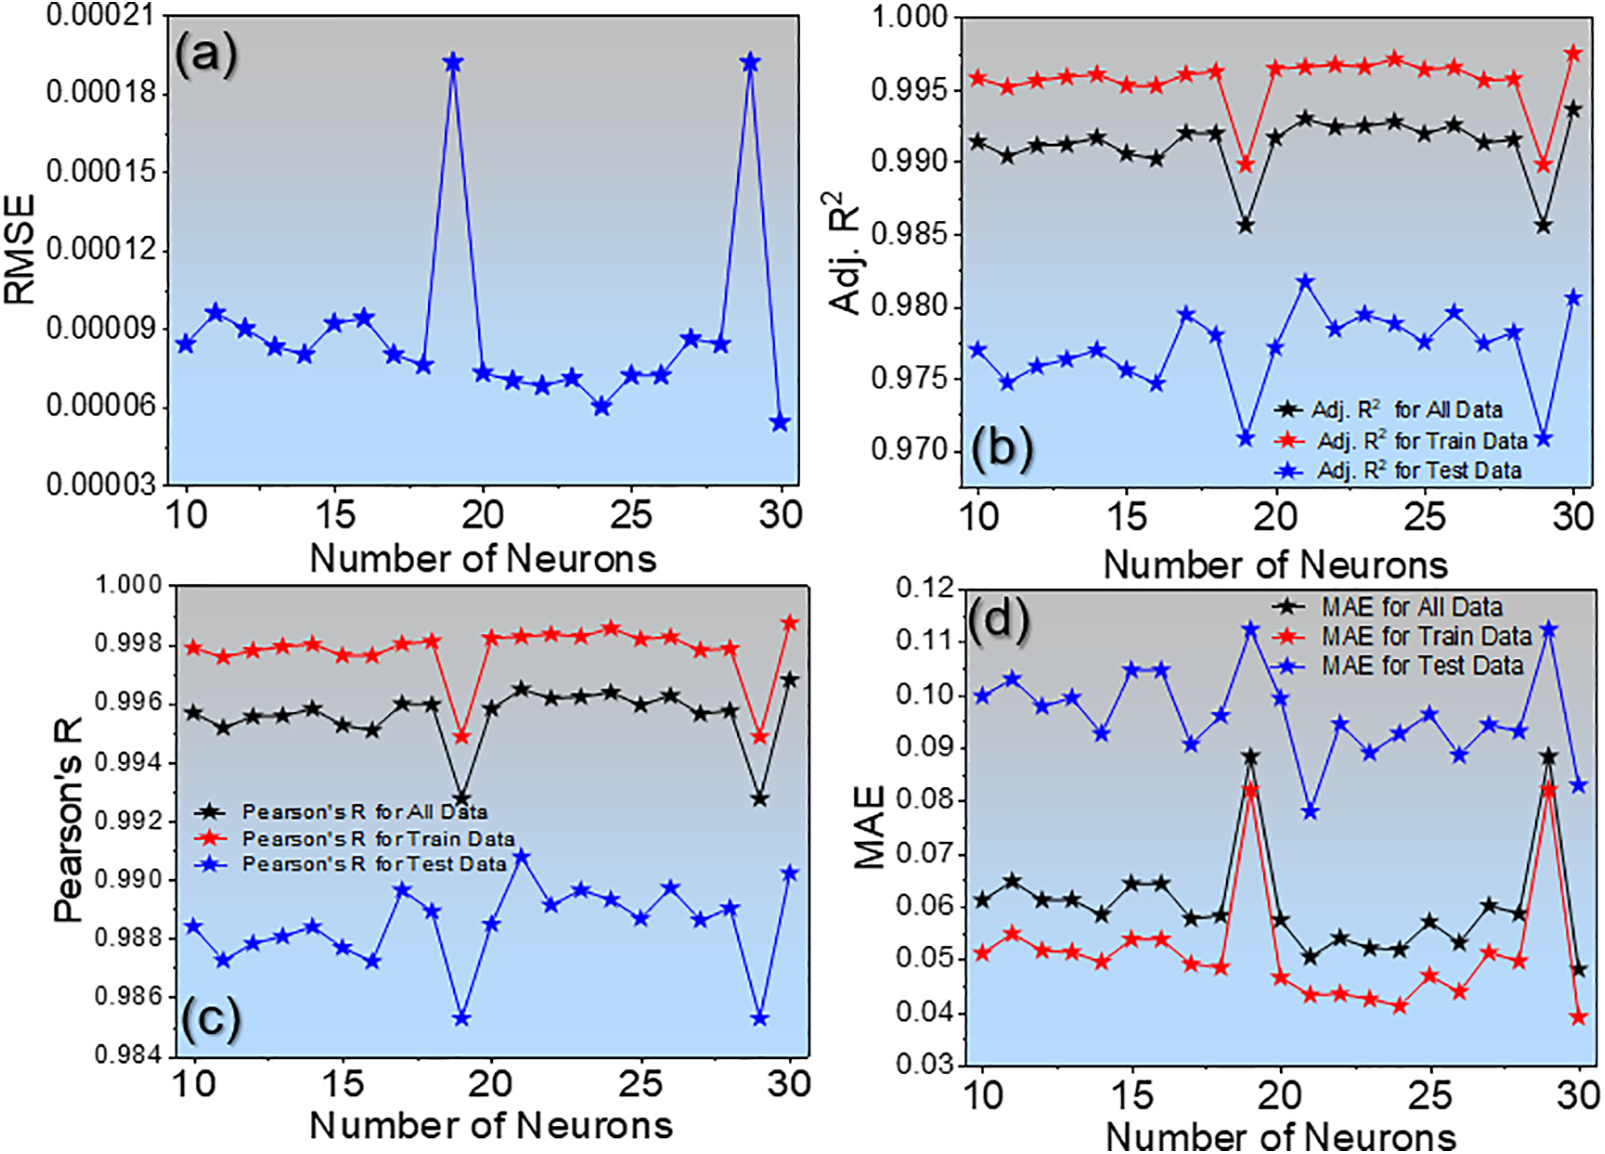
Figure 3: Performance evaluation of ANN models with different neurons. The three-layer architecture with 21 neurons demonstrates superior predictive capability, achieving (a) The lowest RMSE, (b) The highest adj. R2, (c) The highest Pearson’s r, and (d) The lowest MAE.
3.1.2 Optimal Momentum, Learning Rate, and Iterations
To optimize the hyperparameters of the developed ANN model, specifically the momentum term, learning rate, and number of iterations, systematic trials were conducted using the architecture with three hidden layers and 21 neurons. The momentum term was varied from 0 to 1, and the corresponding RMSE values were recorded to identify the optimal setting. As shown in Fig. 4a, a momentum value of 0.6 resulted in the lowest RMSE, indicating the most stable convergence behavior. Furthermore, the adj. R2 values were evaluated for all datasets. The model achieved an adj. R2 of 0.9930 for the complete dataset, 0.9966 for the training set, and 0.9817 for the test set, as presented in Fig. 4b. Pearson’s r and MAE were also computed to further assess predictive accuracy. Pearson’s r reached 0.9965 for all data, 0.9983 for the training set, and 0.9908 for the test set, while the corresponding MAE values were 0.0504, 0.0432, and 0.0779, respectively. The full trends in Pearson’s r and MAE as a function of the momentum term are provided in Supplementary Fig. S3a,b, offering a comprehensive view of the model’s sensitivity to this hyperparameter.
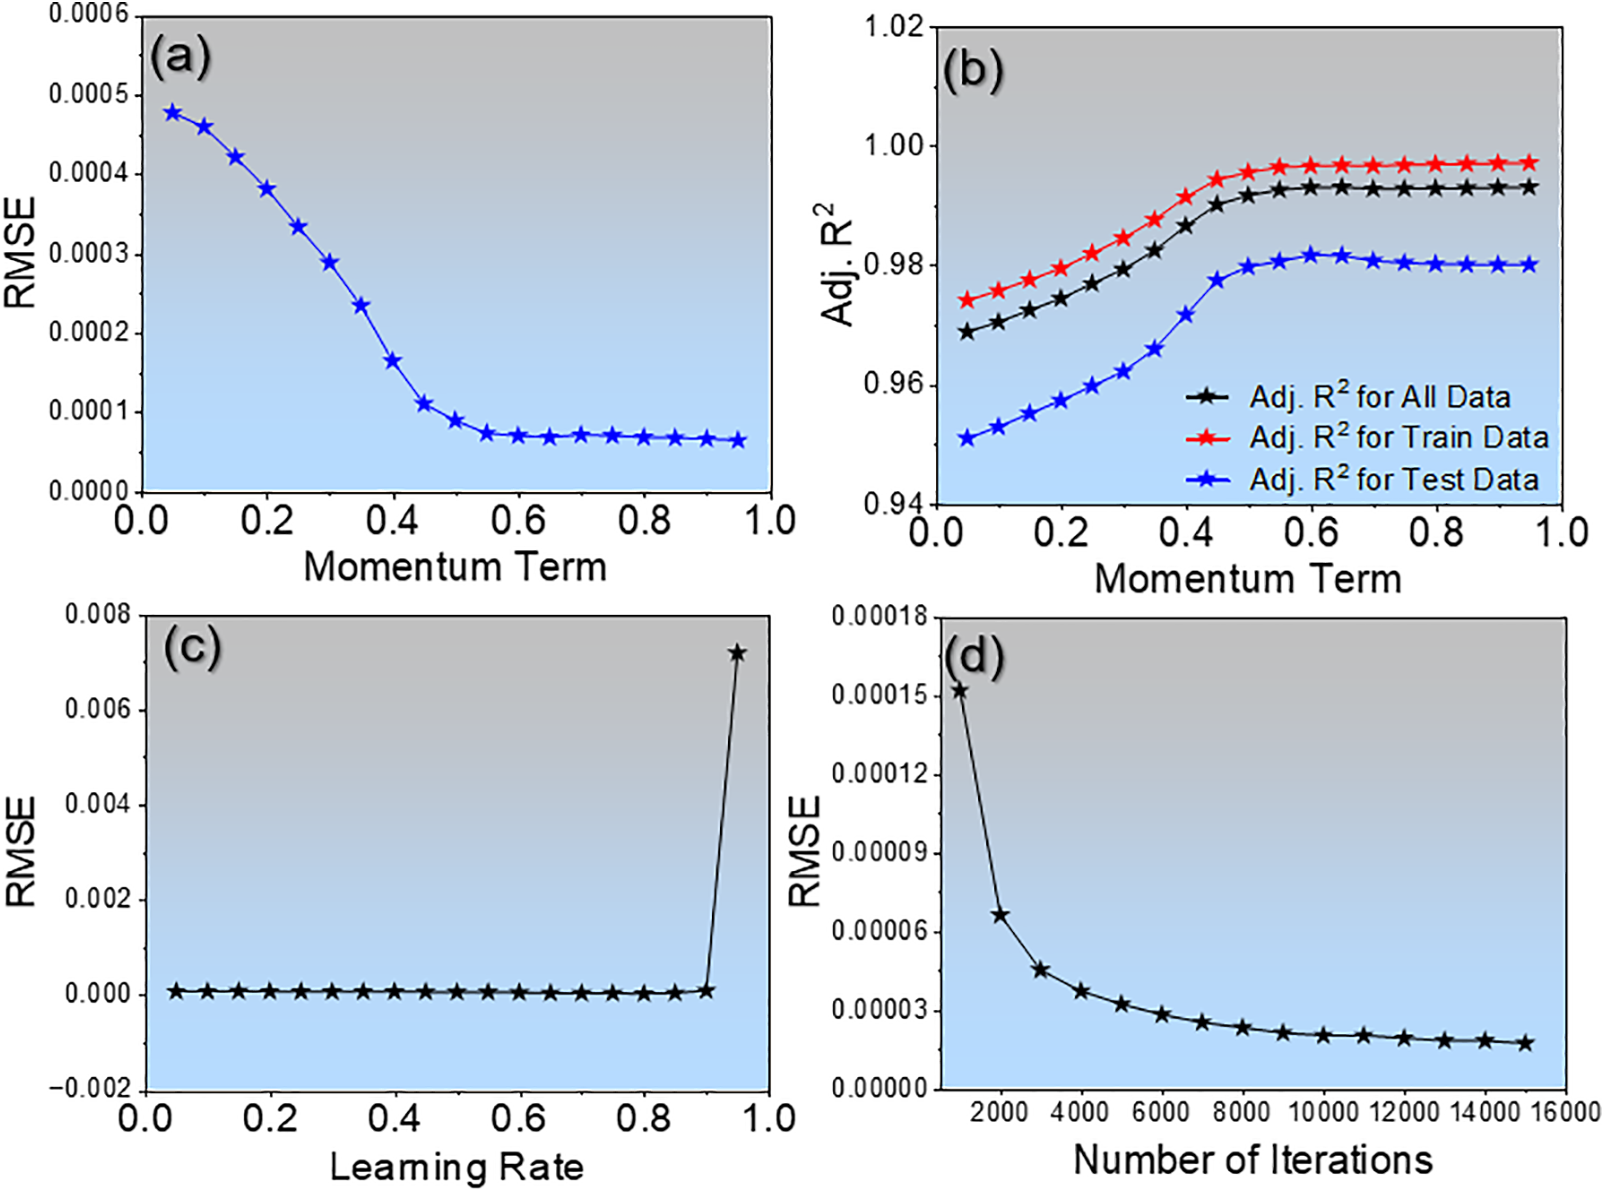
Figure 4: Performance evaluation of ANN models with different hyperparameters, (a) Change in RMSE by changing momentum term, (b) Change in Adj. R2 by changing momentum term, (c) Change in RMSE by changing learning rate, and (d) Change in RMSE by changing number of iterations.
The influence of learning rate and the number of iterations on the model’s RMSE performance is presented in Fig. 4c,d. The learning rate systematically varied from 0.05 to 0.95, and the analysis revealed that a learning rate of 0.7 produced the lowest RMSE value of 0.000032. The corresponding variations in adj. R2, Pearson’s r, and MAE for different learning rates are provided in Supplementary Figs. S4a–c. These results indicate that a learning rate of 0.7 yields an adj. R2 of 0.9818, a Pearson’s r of 0.9974, and an MAE of 0.0738 for the test dataset, with the full behavior for the training and overall datasets detailed in the Supplementary Information. Similarly, the number of training iterations were varied between 1000 and 15 000. An optimal performance was observed at 9000 iterations, which resulted in an RMSE of 0.000021, as shown in Fig. 4d. The complete trends for all data subsets (training, testing, and combined), along with their associated adj. R2, Pearson’s r, and MAE values, are illustrated in Supplementary Figs. S5a–c.
3.2 Performance Evaluation of the Developed Model with Optimum Architecture
The predictive performance of the optimized ANN model with three hidden layers, 21 neurons, 0.6 momentum term, 0.7 learning rate, and 9000 iterations is illustrated in Fig. 5, where the experimental creep rupture lives are plotted against the model-predicted values alongside a 1:1 reference line. For the entire dataset, the model demonstrates excellent fidelity, achieving an RMSE of 0.000048, an adj. R2 of 0.993346, a Pearson’s r of 0.9967, and MAE of 0.0471. A detailed breakdown of the training and testing performance further confirms the performance of the framework. For the training subset, the model attains an adj. R2 of 0.9975, a Pearson’s r of 0.9987, and MAE of 0.0382, indicating exceptional agreement with the reference data (Fig. 5a). For the unseen testing subset, the model retains strong generalization capability, exhibiting an adj. R2 of 0.9789, a Pearson’s r of 0.9894, and MAE of 0.0134 (Fig. 5b). Collectively, these metrics substantiate the reliability and predictive strength of the developed model for estimating creep rupture life across a wide range of compositions and testing conditions.
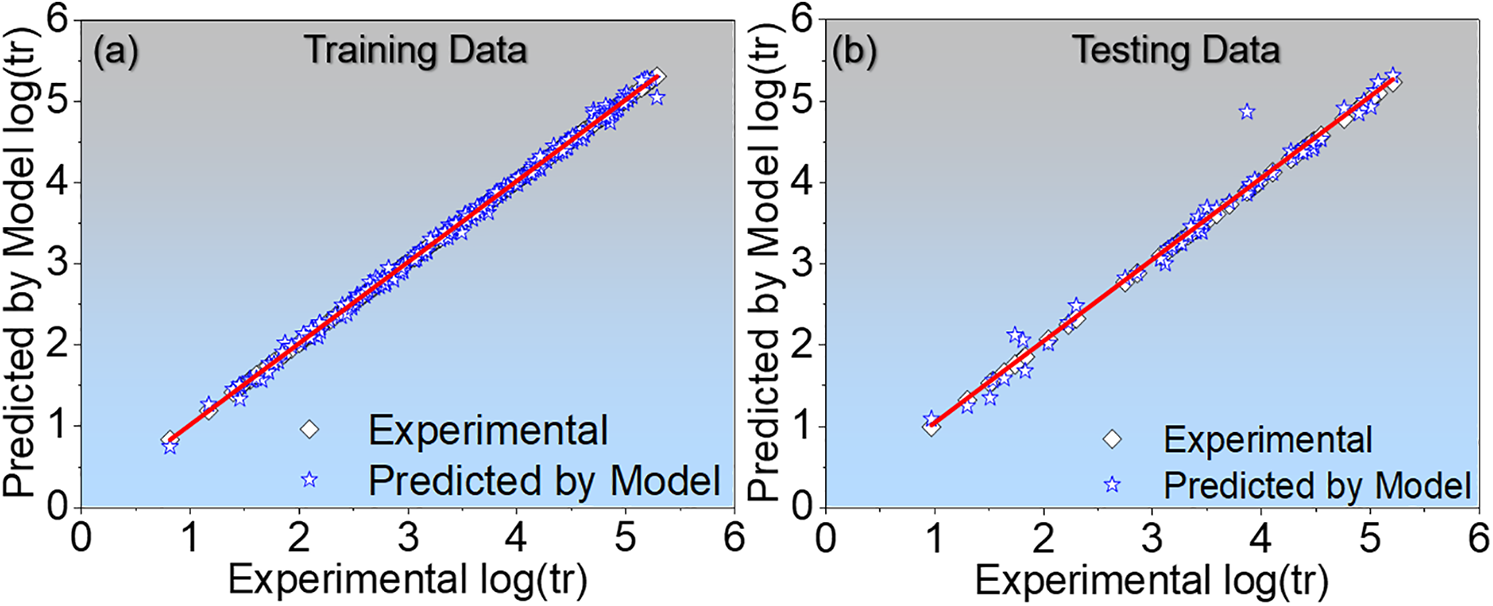
Figure 5: Performance evaluation of the optimum model architecture. Scatter plots showing the comparison between experimental and model-predicted creep rupture life of 1.25Cr-0.5Mo steel for (a) Training dataset, (b) Testing dataset. The red line represents the ideal 1:1 correlation between experimental and model-predicted values.
3.3 Cross-Validation and Statistical Performance Analysis
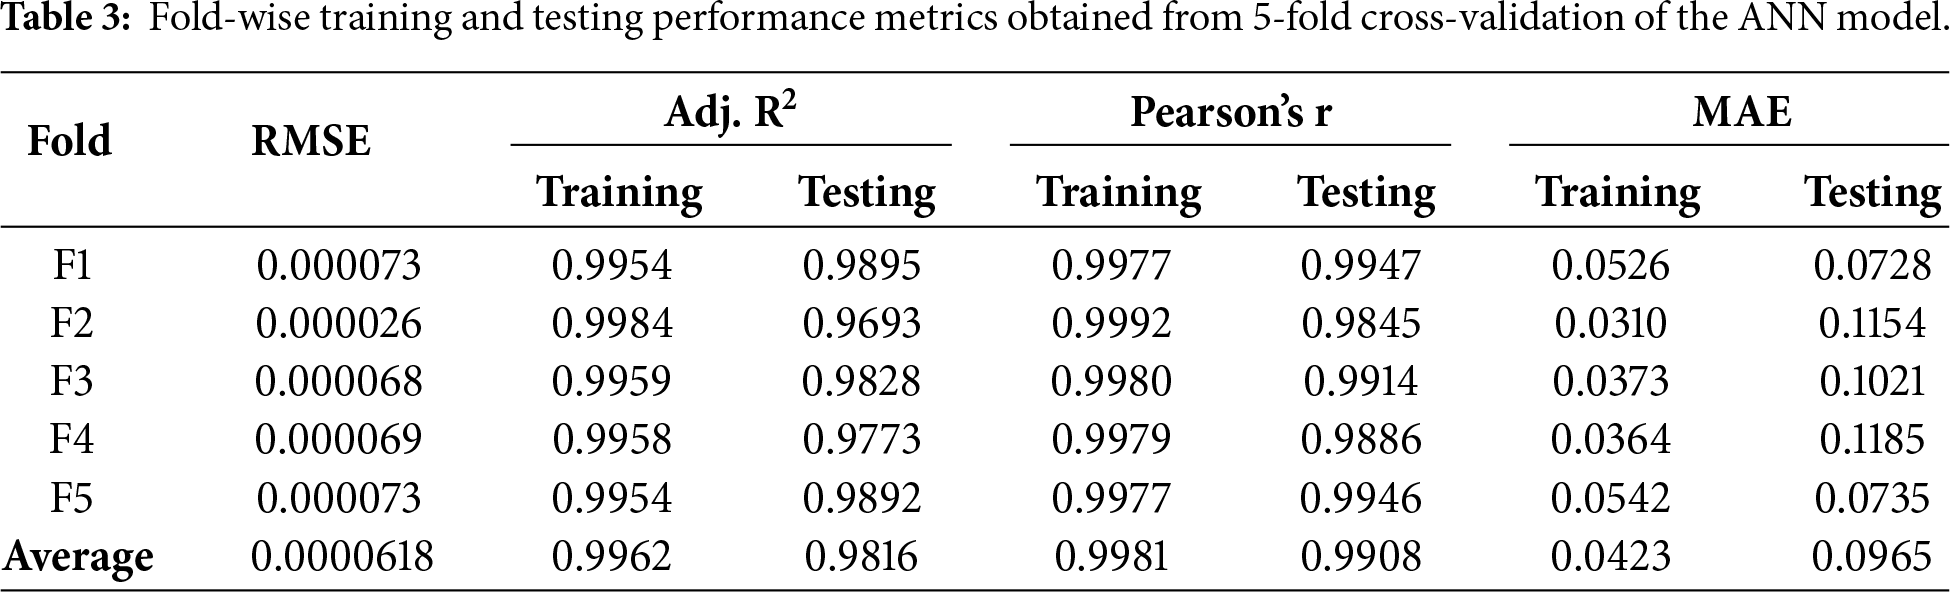
A 5-fold cross-validation procedure was applied to the dataset of 276 samples to evaluate model generalization. The data were randomly partitioned into five folds with test sizes of 55, 55, 55, 55, and 56 samples, and the remaining folds were used for training in each iteration. Model training and testing were conducted independently for each fold. The fold-wise training and testing performance metrics are presented in Table 3, including RMSE, adj. R2, Pearson’s r, and MAE. Across all folds, the testing results show low RMSE and MAE together with high adj. R2 and Pearson’s r values. The average testing adj. R2 (0.9816) and Pearson’s r (0.9908) indicate a strong correspondence between predicted and experimental hardness values. The close agreement between training and testing metrics and the limited inter-fold variability indicate that the model performance is stable across different data partitions, supporting the generalization capability of the proposed ANN model under the adopted validation framework.
3.4 Comparison with Baseline ML Models
To evaluate the predictive capability of the developed ANN model and to justify its selection, a comparative assessment was conducted against several widely used ML models. The benchmarked models included linear regression (LR), Gaussian process regression (GPR), multilayer perceptron (MLP), extra trees (ET), stochastic gradient descent (SGD), k-nearest neighbors (KNN), support vector machines (SVM), XGBoost, random forest (RF), and decision tree (DT). All models were trained and evaluated using identical training and testing datasets to ensure a fair and unbiased comparison.
The predictive performance of each model was quantified using the adj. R2, RMSE, and MAPE for both the training and testing datasets. The comparative results are summarized using radar (spider) plots in Fig. 6a for the training dataset and Fig. 6b for the testing dataset. As evident from these plots, the ANN demonstrates consistently high R2 values combined with low RMSE and MAPE in both training and testing phases, indicating robust learning and superior generalization capability. Among the selected models, ensemble-based approaches such as RF, ET, and XGBoost exhibit competitive performance, particularly during training; however, a noticeable reduction in predictive accuracy is observed for some of these models on the testing dataset, suggesting comparatively weaker generalization. Kernel-based models such as SVM and instance-based learning (KNN) show moderate predictive capability but remain inferior to the ANN, especially in terms of error metrics. In contrast, simpler models, including LR and SGD, display the lowest predictive accuracy, reflecting their limited ability to capture the complex nonlinear relationships between the input variables and the output response log(tr).
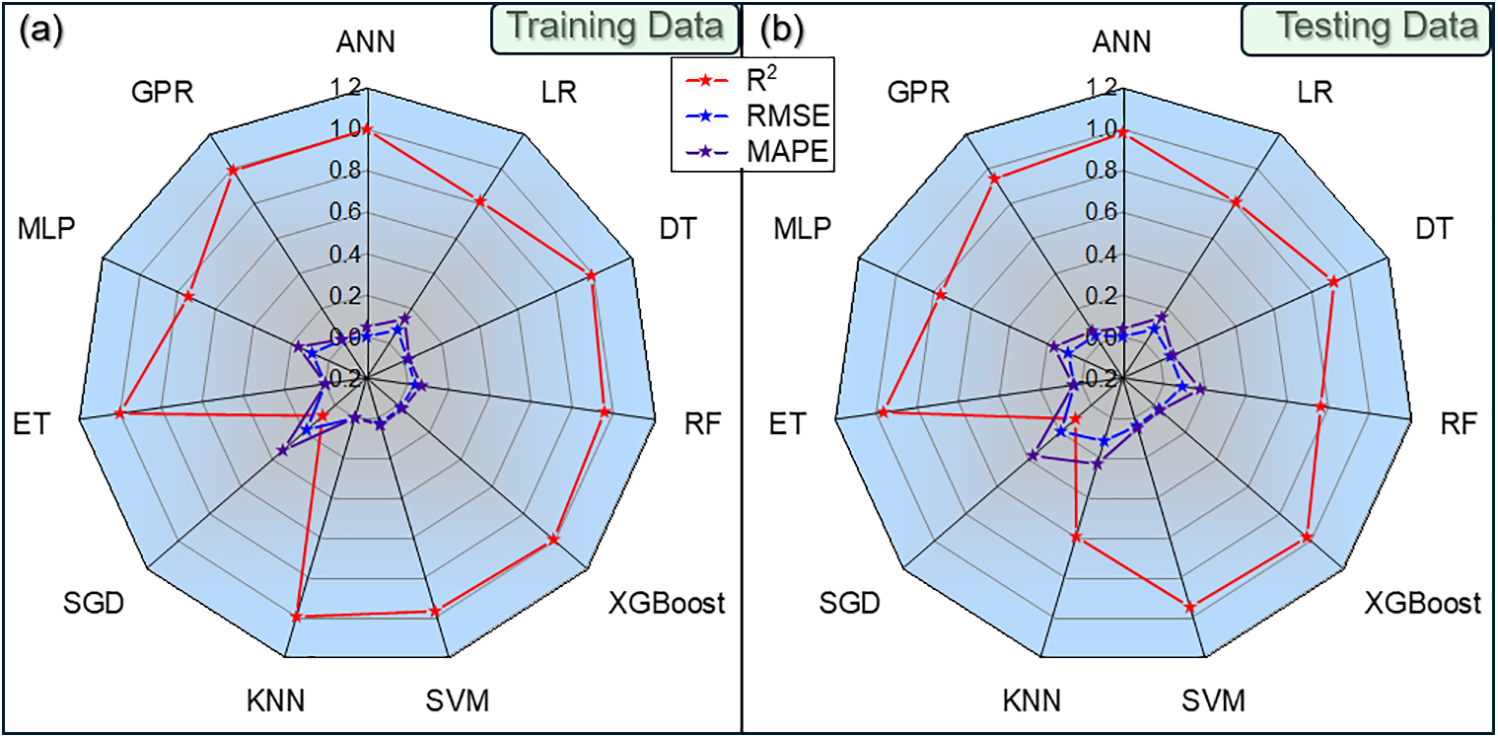
Figure 6: Comparative radar plots of predictive performance metrics (R2, RMSE, and MAPE) for the ANN and benchmark machine-learning models on (a) Training and (b) Testing datasets.
Beyond predictive accuracy, the ANN framework offers additional advantages, including systematic single- and multi-variable sensitivity analyses and the development of a user-friendly GUI. These features are not readily achievable with many alternative machine-learning approaches and further motivated the selection of ANN as the primary model for in-depth analysis in this study.
3.5 Graphical User Interface (GUI) of ANN Model
The model, developed using Java version 1.4, provides a user-friendly interface with several functionalities accessible in a single click. The screenshot of the GUI is presented in Fig. 7. The prediction module enables users to input the chemical composition of any steel and obtain the logarithmic creep life. For representation purposes, the predicted creep life is shown for a specific alloy composition under a defined set of testing conditions. However, the developed model is capable of generating predictions for an unlimited number of input combinations, as the alloy composition and test parameters can be varied freely within the model’s permissible range. The sensitivity analysis 1 module allows the evaluation of the influence of a single variable on creep life, while the sensitivity analysis 2 enables exploration of the combined effect of any two variables. The optimization function facilitates the adjustment of composition or test conditions to achieve a desired creep life. Additionally, the index of relative importance quantifies the contribution of each input variable to the creep life. Detailed explanations of these functionalities, along with predictions supported by metallurgical insights, are provided in the subsequent section.
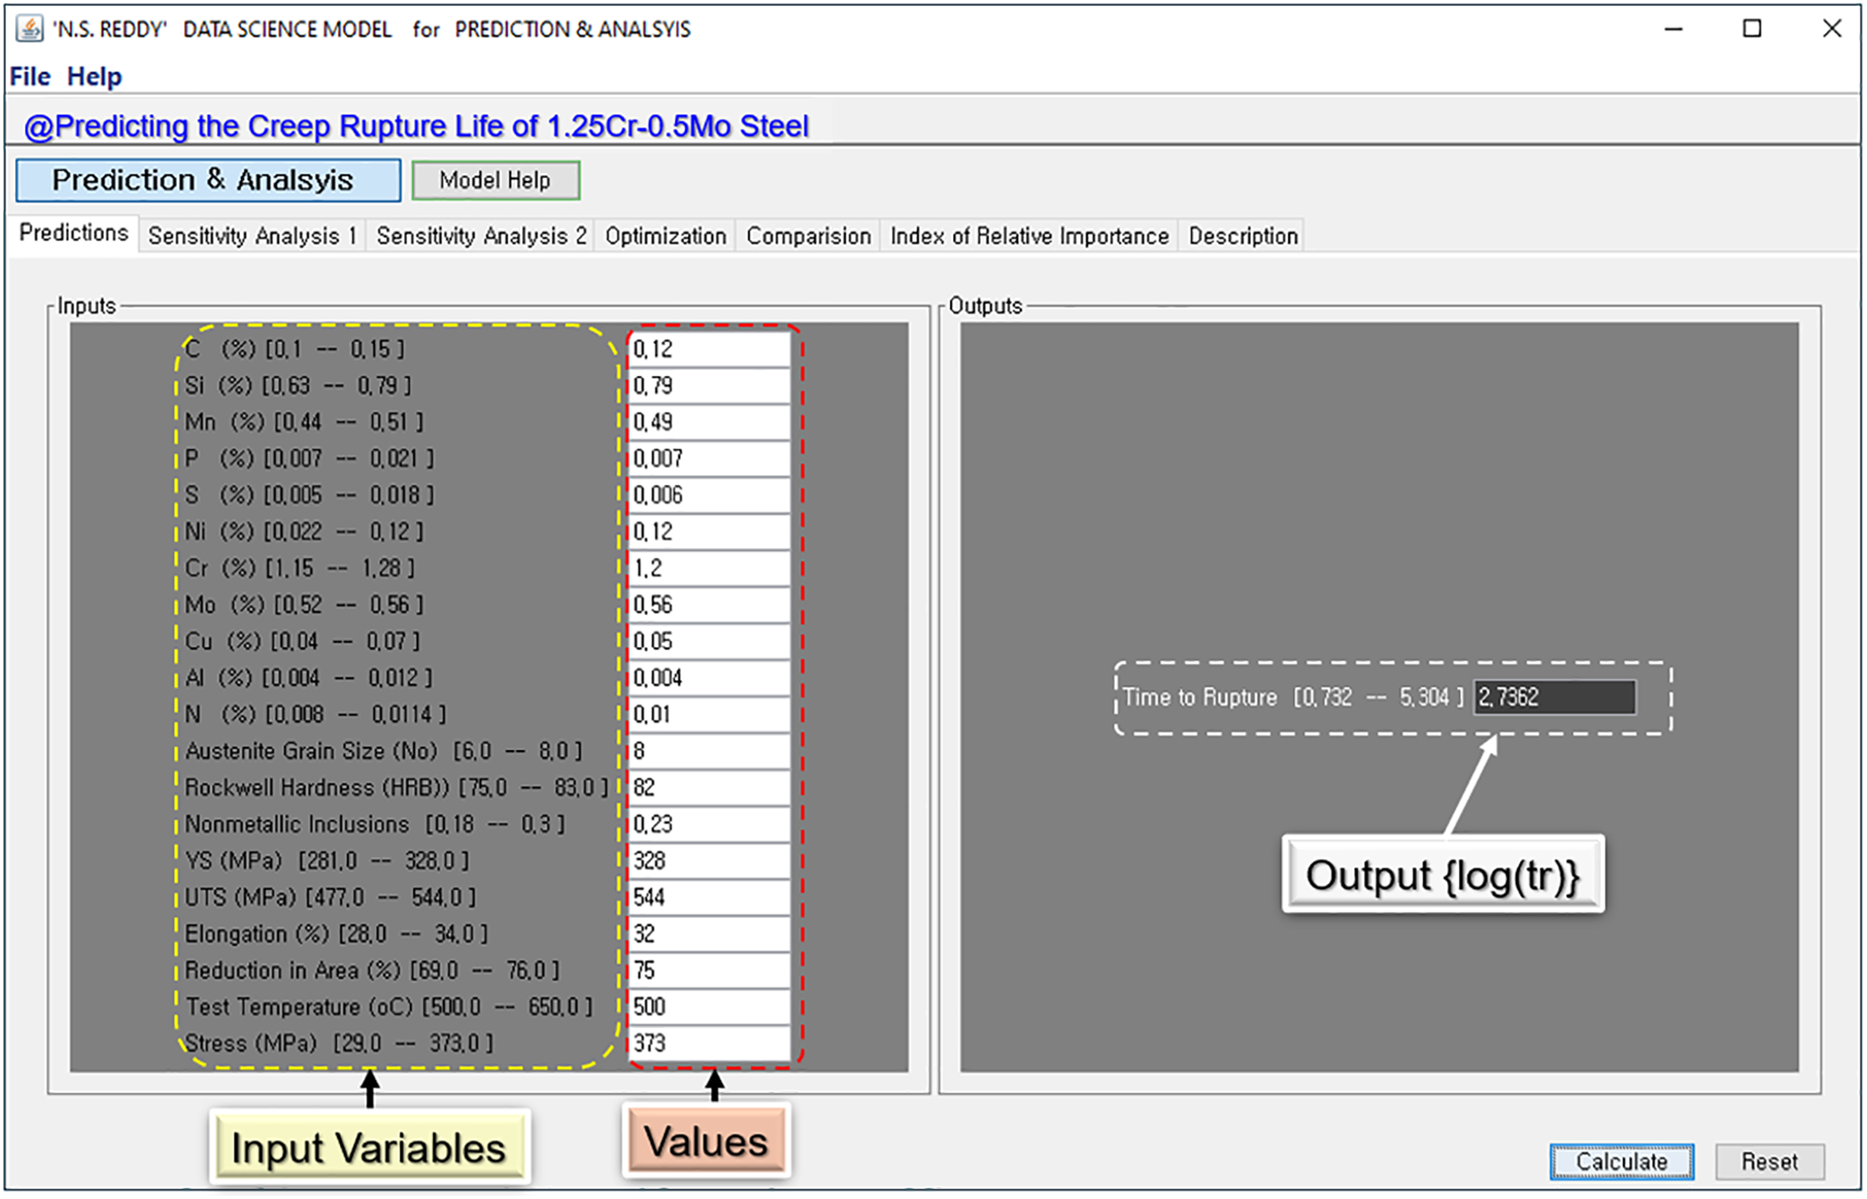
Figure 7: Screenshot of the graphical user interface of the data science framework to predict the creep rupture life of 1.25Cr-0.5Mo steel.
3.6 Single Variable Sensitivity Analysis
Chemical composition plays a critical role in governing the high-temperature performance of steels, primarily through alloying elements that contribute to solid-solution strengthening and carbide precipitation. These effects are well known to enhance creep resistance by impeding dislocation motion and stabilizing grain boundaries. Fig. 8a shows the model-predicted influence of carbon on the creep rupture life of 1.25Cr-0.5Mo steel, indicating that an increase in C content from 0.10 wt.% to 0.15 wt.% is associated with improved creep life. This trend is consistent with established metallurgical understanding, where carbon promotes the formation of strengthening carbides in combination with alloying elements such as Cr and Mo [24]. Similarly, the predicted effect of chromium shown in Fig. 8b indicates enhanced creep rupture life at higher Cr contents, which aligns with the role of Cr in stabilizing M23C6 and M6C carbides that are known to retard grain boundary sliding and dislocation motion [25]. In addition to compositional effects, creep rupture life is strongly influenced by test conditions. As shown in Fig. 8c, increasing temperature leads to a reduction in predicted creep life, consistent with accelerated atomic diffusion, enhanced dislocation activity, and grain boundary sliding at elevated temperatures [26]. Microstructural degradation mechanisms such as carbide coarsening, grain boundary weakening, and void nucleation further contribute to reduced creep resistance [27]. Applied stress also exhibits an inverse relationship with creep life, as higher stress levels increase the driving force for deformation and damage accumulation, resulting in shorter rupture times, as illustrated in Fig. 8d [28].
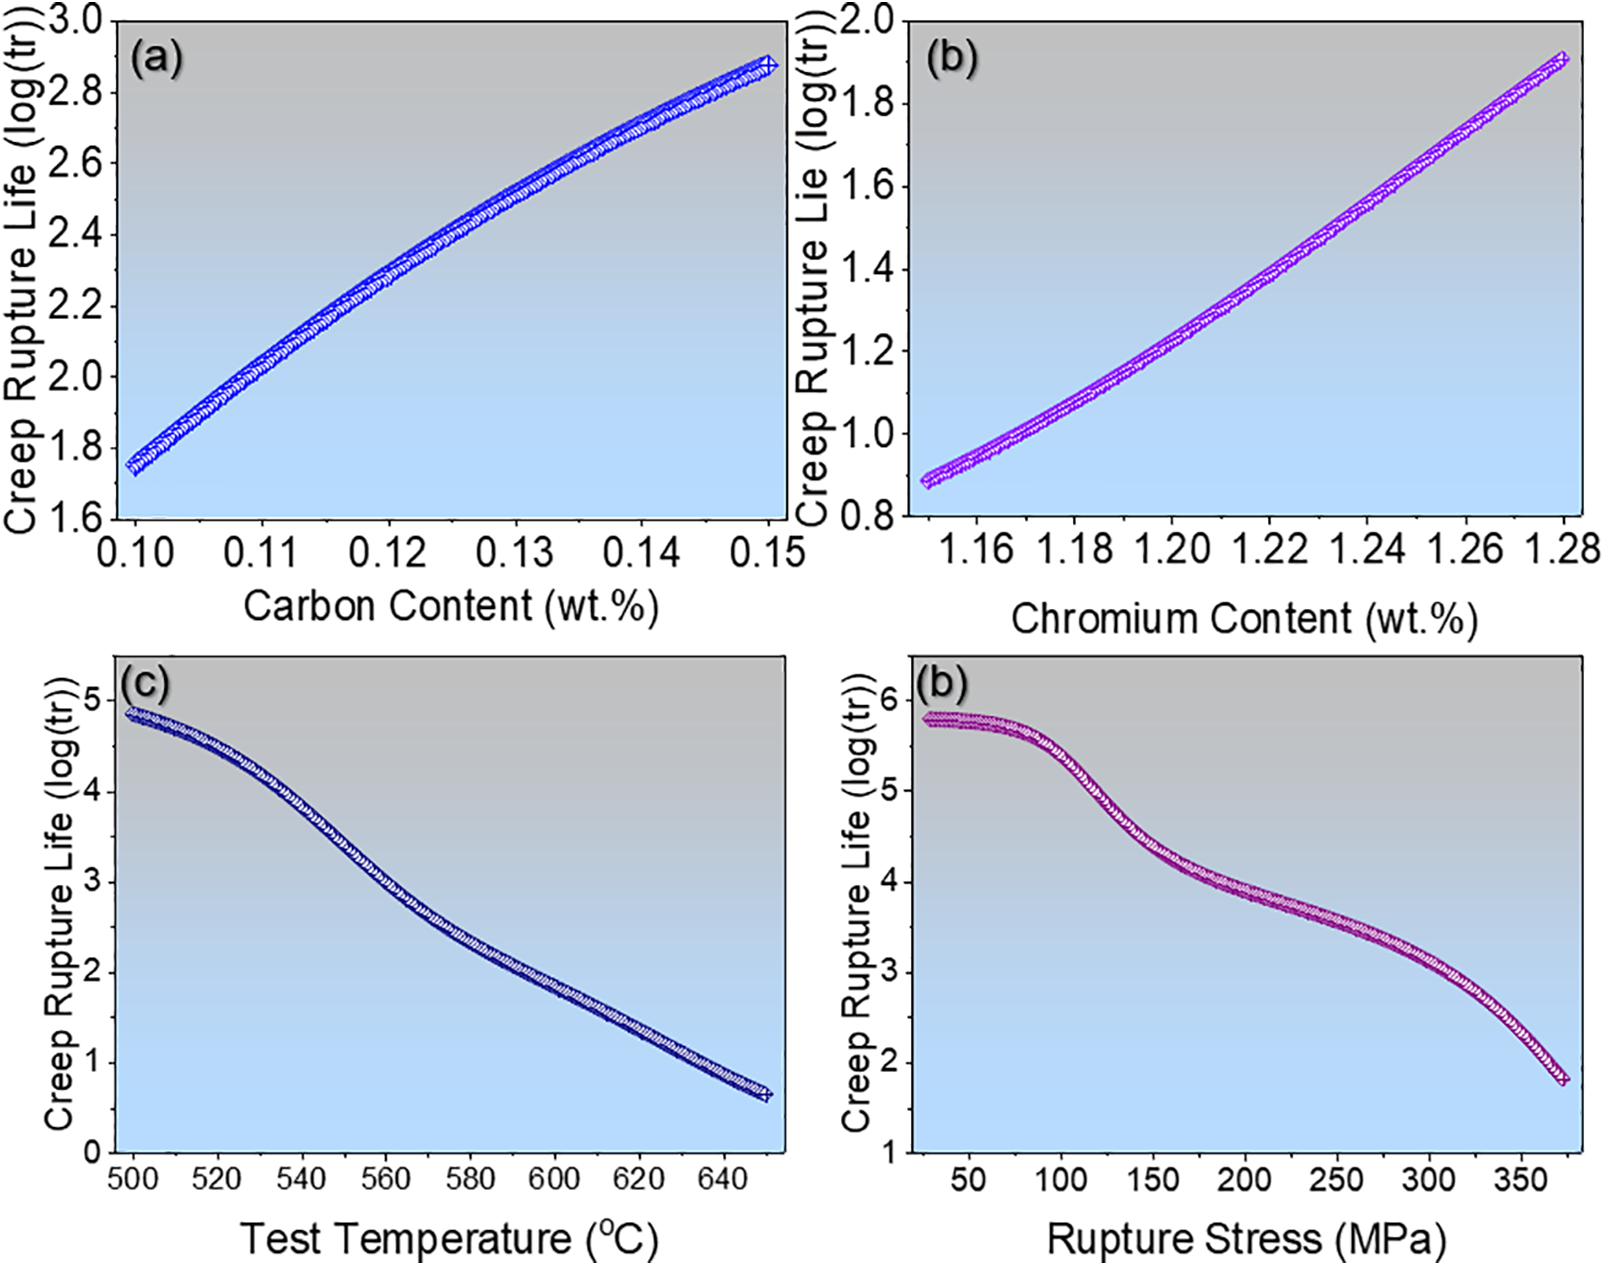
Figure 8: Single variable sensitivity analysis showing how the creep life of 1.25Cr-0.5Mo steel is changed by changing (a) Carbon content, (b) Chromium content. (c) Test temperature (°C), (d) Rupture stress (MPa).
3.7 Two-Variable Sensitivity Analysis
The influence of a single variable on creep rupture life is generally straightforward and can often be anticipated with basic metallurgical understanding. However, the combined effect of more than one variable is highly complex, nonlinear, and not easily predictable. The developed data-driven model is capable of capturing complex, nonlinear interactions between variables based on the underlying experimental data, without explicitly encoding metallurgical mechanisms as inputs. The contour plot in Fig. 9a illustrates the combined influence of the alloying elements Al and N, indicating a positive association with the predicted creep rupture life of 1.25Cr-0.5Mo steel according to the model. The positive trend associated with N is consistent with its known role in promoting fine nitrides or carbonitrides (e.g., Cr2N, MX-type precipitates) that strengthen the matrix and grain boundaries, pin dislocations, and reduce grain-boundary sliding [29,30]. The presence of Al may contribute to improved creep resistance through solid-solution strengthening or interactions with existing carbide/nitride phases; however, the formation of specific intermetallic precipitates is not explicitly confirmed within the present dataset. The predicted combined effect of Cu and N on creep rupture life is shown in Fig. 9b. At higher levels, Cu is associated with reduced creep resistance, potentially due to the formation of coarse Cu-rich precipitates or interacting with other non-metallic inclusions, which act as stress concentrators at high temperatures. As a result, the positive effect of N is progressively diminished at higher Cu levels, highlighting the need to carefully control Cu content to maximize the beneficial contribution of N to creep life [29]. The combined effect of grain size and Si is captured in the ANN-predicted contour plot presented in Fig. 9c. Although increasing Si content generally enhances creep rupture life through solid solution strengthening and carbide formation [31], thereby slowing dislocation motion and improving creep resistance.
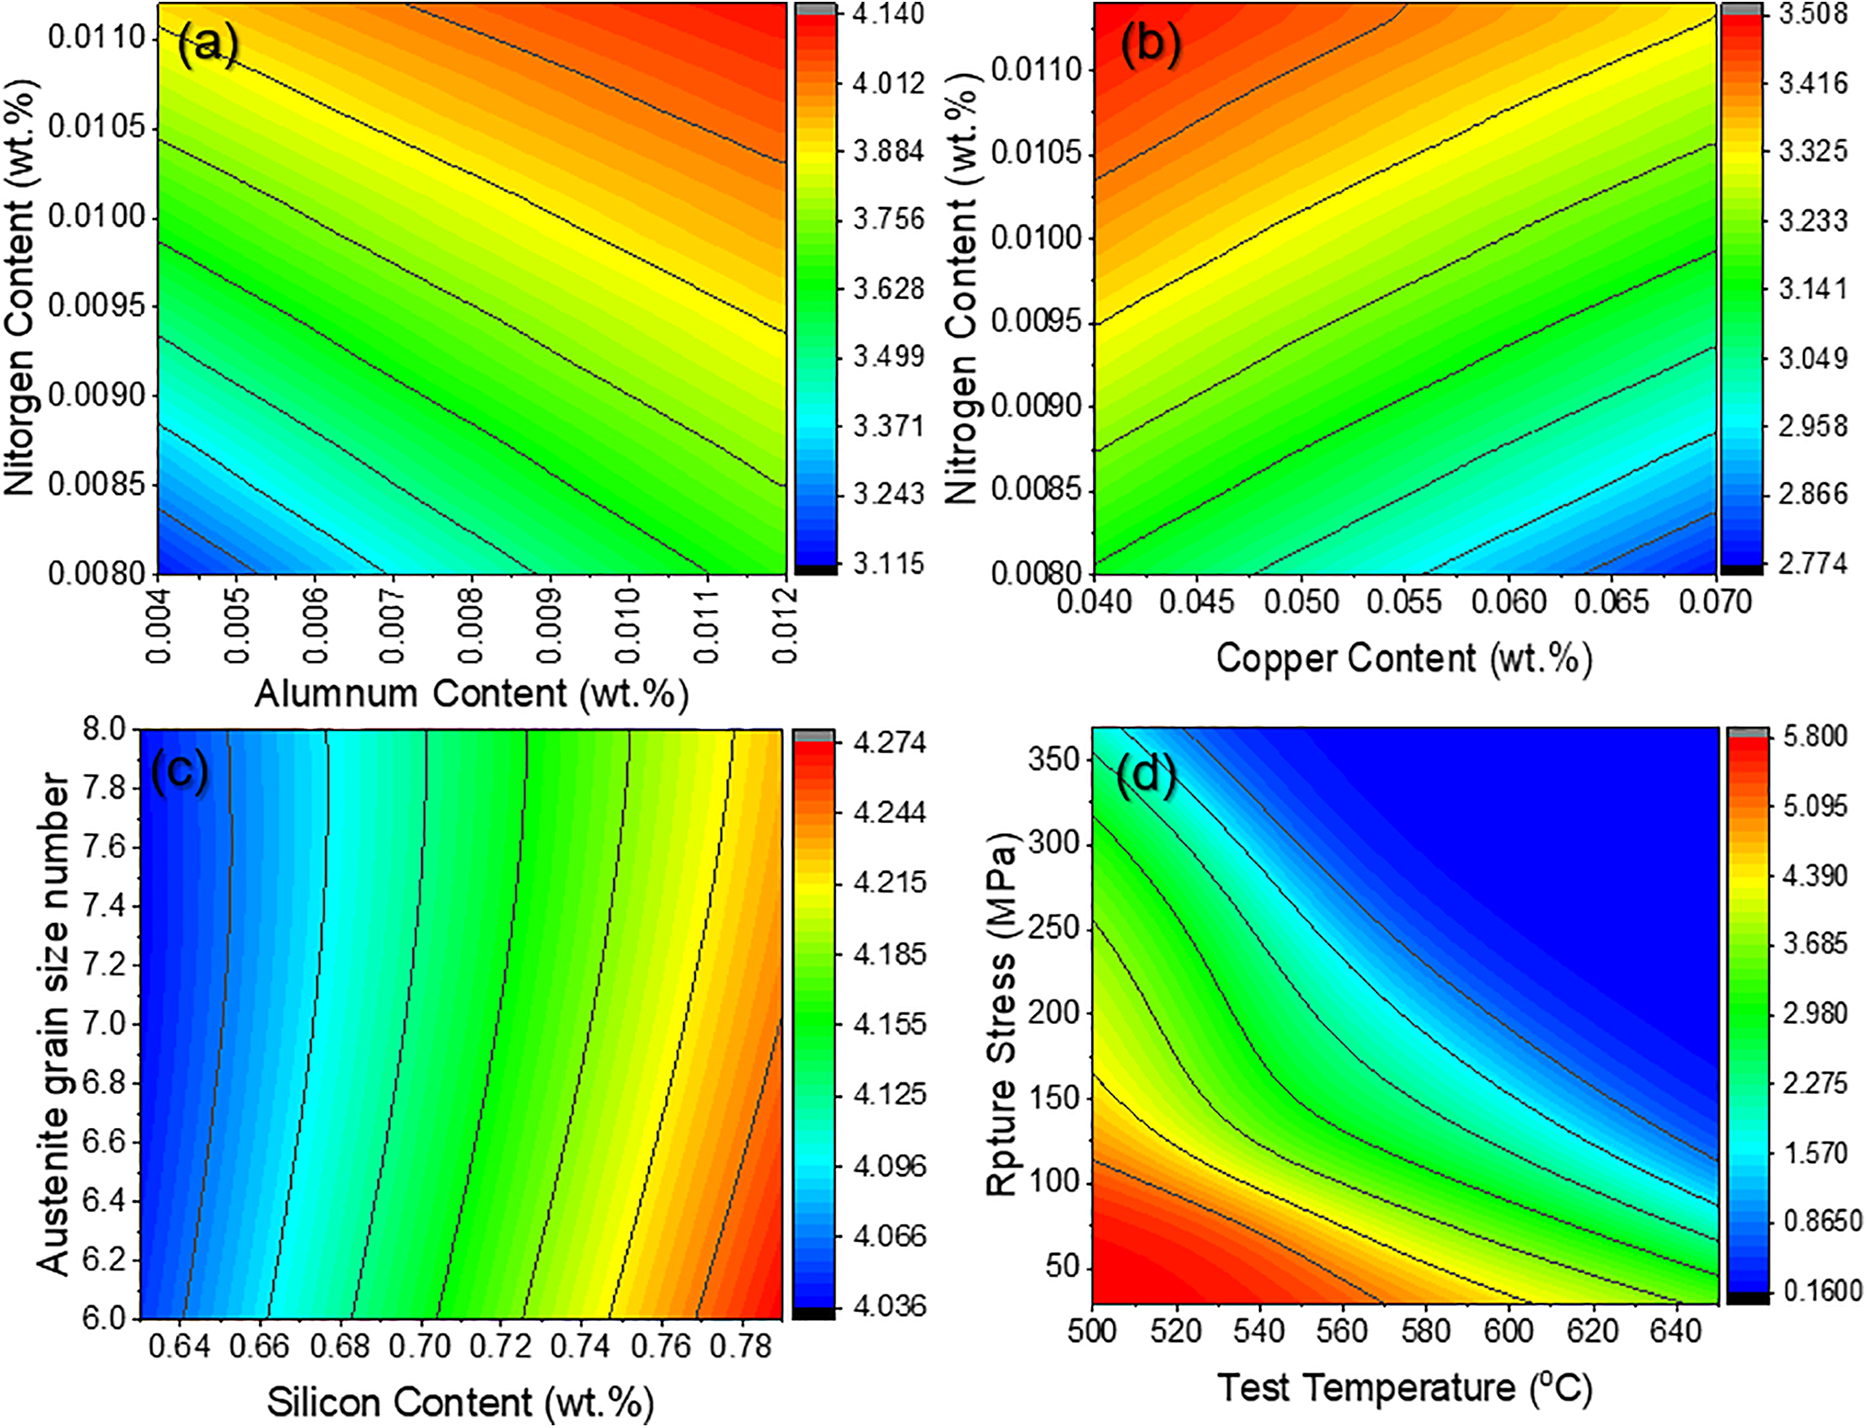
Figure 9: Contour plots obtained from two variable sensitivity analysis data showing the combined effect of (a) aluminum and nitrogen, (b) copper and nitrogen, (c) silicon and austenite grain size number, (d) test temperature and rupture stress.
Si is reported to act as an austenite stabilizer and may be associated with increased austenite grain size [32]. Larger grains reduce the grain-boundary area available for carbide precipitation [33], which may weaken the beneficial contribution of Si to creep resistance. The contour plot in Fig. 9d illustrates the effect of test conditions on the creep rupture life of 1.25Cr-0.5Mo steel. Steel can withstand lower stresses for longer periods at lower temperatures; however, increasing both stress and temperature leads to a considerable reduction in creep rupture life. This trend is consistent with the fact that higher temperatures accelerate diffusion and dislocation motion, while higher stress increases the driving force for creep deformation, both of which promote cavity formation and grain-boundary sliding, consistent with previous findings [34].
3.8 Index of Relative Importance
To quantify the relative contribution of input parameters such as composition, material properties, and test conditions, the model-derived Index of Relative Importance (IRI) is shown in Fig. 10. Fig. 10a corresponds to a typical composition of 1.25Cr-0.5Mo steel, tested at 500 °C under 333 MPa stress. Except for S and Cu, all other alloying elements show a positive association with the predicted creep rupture life, whereas the test conditions (temperature and stress) exhibit the most pronounced negative contribution, indicating their dominant influence within the model predictions. The negative contribution associated with S and Cu is consistent with established metallurgical understanding, where S is known to embrittle grain boundaries through sulfide formation, while Cu may form coarse Cu-rich precipitates or inclusions that act as stress concentrators at high temperature.
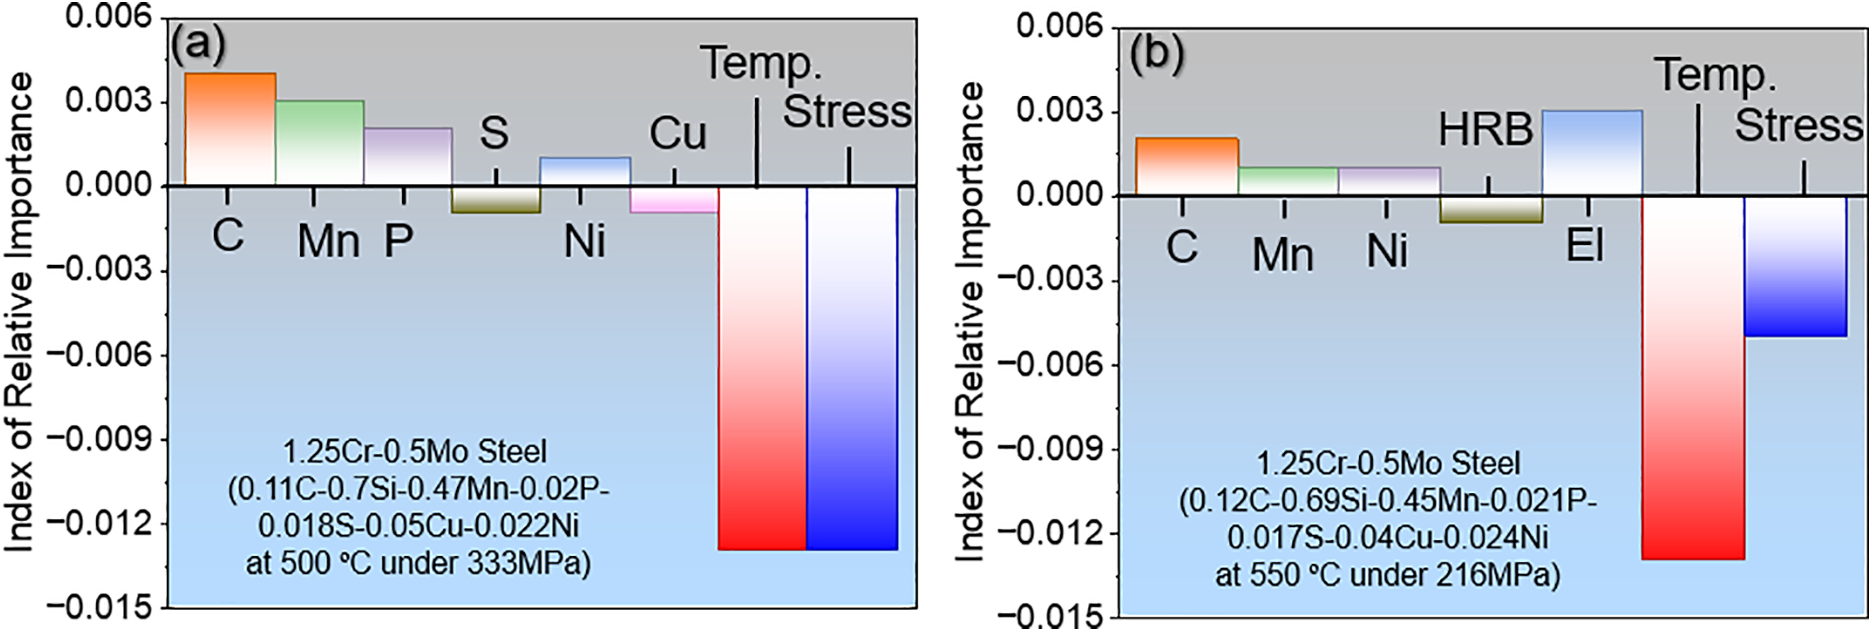
Figure 10: Index of relative importance of input parameters affecting the creep rupture life of 1.25Cr-0.5Mo steel predicted by the model: (a) influence of alloying elements and test conditions at 500°C and 333 MPa; (b) influence of alloying elements, hardness, and test conditions. Positive values indicate parameters that enhance creep life, while negative values indicate parameters that reduce it. Test conditions (temperature and stress) have the most pronounced negative effect.
Similarly, in Fig. 10b, both hardness and the applied test conditions (temperature and stress) show a negative contribution to the predicted creep rupture life, with temperature and stress exhibiting the most dominant influence within the model. The relatively minor contribution associated with hardness may be attributed to the fact that hardness measurements are obtained over a short timescale, and the underlying deformation mechanisms differ fundamentally from those governing long-term creep behavior. Among the alloying elements, C and Al show a moderate positive association with the predicted creep rupture life, consistent with their known roles in matrix and grain-boundary strengthening, while the dominating effect of stress and temperature underscores the critical role of service conditions on the material’s high-temperature performance.
It should be noted that the ANN employed in this study is a purely data-driven predictive model and does not explicitly encode physical or metallurgical mechanisms. The sensitivity and parametric analyses presented are therefore post hoc interpretations of the ANN outputs, intended to provide qualitative insight into compositional and processing trends rather than mechanistic descriptions embedded within the model. While these analyses are interpreted in light of established creep and diffusion theories, the inherent black-box nature of conventional ANN models limits direct physical interpretability. The integration of more explainable or physics-informed ML approaches represents an important avenue for future work.
The present study successfully establishes a user-friendly data-science framework based on an optimized Artificial Neural Network (ANN) model for reliable prediction of the creep rupture life of 1.25Cr-0.5Mo steel. The model integrates eleven alloying elements (C, Si, Mn, P, S, Ni, Cr, Mo, Cu, Al, N), average grain size, hardness, non-metallic inclusions, and test conditions (temperature and stress) as input features, providing a comprehensive representation of the factors governing long-term creep behavior. A total of 276 experimental datasets were compiled, and a systematic hyperparameter optimization, covering network architecture, neuron selection, learning rate, momentum coefficient, and number of iterations, identified the optimal configuration as a three-hidden-layer ANN with 21 neurons, a momentum coefficient of 0.6, a learning rate of 0.7, and 9000 training iterations. This architecture demonstrated strong predictive performance within the studied dataset, achieving an RMSE of 0.00007, an adj. R2 of 0.9930, a Pearson’s r of 0.9965, and a minimum MAE of 0.0504. The predictive performance of the developed ANN model was evaluated in comparison with several established machine-learning approaches, confirming its robust generalization capability. The optimized ANN model was implemented into a user-friendly graphical interface (GUI), enabling practical and rapid prediction of creep rupture life for any combination of alloy composition and test conditions within the studied range. Sensitivity analyses highlighted the dominant influence of key alloying elements, alongside the strong effects of test temperature and applied stress. The framework also demonstrated its capability to quantify the impact of individual compositional changes, supporting data-driven assessment and screening of alloy compositions.
In summary, the developed ANN-based predictive framework demonstrates strong predictive capability within the studied data range and provides a useful data-driven tool to support alloy optimization and creep performance assessment for high-temperature applications. The approach shows promising potential for assisting the design and screening of Cr-Mo steels, while further validation with broader datasets will enhance its general applicability.
Limitations and Future Work:
The present model is developed using a limited dataset and is primarily applicable within the range of the available data. Future work will focus on expanding the dataset and applying additional dropout and L1/L2 regularization to further improve prediction reliability and interpretability.
Acknowledgement: Not applicable.
Funding Statement: This work was supported by the Learning & Academic research institution for Master’s PhD students, and Postdocs [LAMP] Program of the National Research Foundation of Korea (NRF), funded by the Ministry of Education (No. RS-2023-00301974). This research was also supported by the Gyeongnam Aerospace & Defense Institute of Science and Technology (GADIST), Gyeongsang National University, as part of its research support.
Author Contributions: Study conception and design: Muhammad Ishtiaq, Nagireddy Gari Subba Reddy; data collection: Yeonwoo Kim; analysis and interpretation of results: Muhammad Ishtiaq, Yeonwoo Kim, Nagireddy Gari Subba Reddy, and Sung-Gyu Kang; draft manuscript preparation: Muhammad Ishtiaq, Sung-Gyu Kang, and Nagireddy Gari Subba Reddy. All authors reviewed and approved the final version of the manuscript.
Availability of Data and Materials: The authors confirm that the data supporting the findings of this study are available within the article and its supplementary materials.
Ethics Approval: Not applicable.
Conflicts of Interest: The authors declare no conflicts of interest.
Supplementary Materials: Supplementary Figs. S1–5 are provided as Supplementary Materials. The supplementary material is available online at https://www.techscience.com/doi/10.32604/cmc.2026.077416/s1.
References
1. Viswanathan R, Coleman K, Rao U. Materials for ultra-supercritical coal-fired power plant boilers. Int J Press Vessels Pip. 2006;83(11–12):778–83. doi:10.1016/j.ijpvp.2006.08.006. [Google Scholar] [CrossRef]
2. Jan MB, Chai M. Machine learning approaches for creep rupture life prediction of metallic materials: a comprehensive review. Int J Press Vessels Pip. 2026;219(16):105690. doi:10.1016/j.ijpvp.2025.105690. [Google Scholar] [CrossRef]
3. Mitchell DRG, Moss CJ, Griffiths RR. Optimisation of post-weld heat treatment of a 1.25Cr-0.5Mo pressure vessel for high temperature hydrogen service. Int J Press Vessels Pip. 1999;76(4):259–66. doi:10.1016/S0308-0161(98)00131-8. [Google Scholar] [CrossRef]
4. Kim MY, Chu DJ, Lee YS, Jung WS, Lee J, Lee YK, et al. Mechanical property change and precipitate evolution during long-term aging of 1.25Cr-0.5Mo steel. Mater Sci Eng A. 2020;789:139663. doi:10.1016/j.msea.2020.139663. [Google Scholar] [CrossRef]
5. Parker JD, Stratford GC. Microstructure and performance of 1.25Cr0.5Mo steel weldments. Mater High Temp. 1995;13(1):37–45. doi:10.1080/09603409.1995.11689499. [Google Scholar] [CrossRef]
6. Janovec J, Svoboda M, Vtfytfrostková A, Kroupa A. Time-temperature–precipitation diagrams of carbide evolution in low alloy steels. Mater Sci Eng A. 2005;402(1–2):288–93. doi:10.1016/j.msea.2005.04.048. [Google Scholar] [CrossRef]
7. Gope N, Mukherjee T, Sarma DS. Influence of long-term aging at 520°C and 560°C and the superimposed creep stress on the microstructure of 1.25Cr-0.5Mo steel. Metall Trans A. 1992;23(1):221–35. doi:10.1007/BF02660867. [Google Scholar] [CrossRef]
8. Bišs VA, Wada T. Microstructural changes in 1Cr-0.5Mo steel after 20 years of service. Metall Trans A. 1985;16(1):109–14. doi:10.1007/BF02656718. [Google Scholar] [CrossRef]
9. Lee YS, Lee HJ, Lee JH. Effect of alloying elements and microstructure on the dynamic strain aging behavior of 1.25Cr-0.5Mo and 2.25Cr-1Mo steels. Korean J Met Mater. 2021;59(11):769–80. doi:10.3365/kjmm.2021.59.11.769. [Google Scholar] [CrossRef]
10. del Carmen Wong-Moreno A, Luisillo AB. High-temperature oxidation of 1.25Cr-0.5Mo steel in SO2. Oxid Met. 1991;35(3):245–58. doi:10.1007/BF00738288. [Google Scholar] [CrossRef]
11. Ishtiaq M, Tiwari S, Nagamani M, Kang SG, Reddy NGS. Data-driven ANN-based predictive modeling of mechanical properties of 5Cr-0.5Mo steel: impact of composition and service temperature. Crystals. 2025;15(3):213. doi:10.3390/cryst15030213. [Google Scholar] [CrossRef]
12. Ishtiaq M, Tiwari S, Panigrahi BB, Seol JB, Reddy NS. Neural network-based modeling of the interplay between composition, service temperature, and thermal conductivity in steels for engineering applications. Int J Thermophys. 2024;45(10):137. doi:10.1007/s10765-024-03434-z. [Google Scholar] [CrossRef]
13. He L, Wang Z, Akebono H, Sugeta A. Machine learning-based predictions of fatigue life and fatigue limit for steels. J Mater Sci Technol. 2021;90:9–19. doi:10.1016/j.jmst.2021.02.021. [Google Scholar] [CrossRef]
14. Wang J, Fa Y, Tian Y, Yu X. A machine-learning approach to predict creep properties of Cr-Mo steel with time-temperature parameters. J Mater Res Technol. 2021;13(141):635–50. doi:10.1016/j.jmrt.2021.04.079. [Google Scholar] [CrossRef]
15. Fujibayashi S, Endo T. Creep analysis of a service-exposed 1.25Cr-0.5Mo steel using the omega method. Tetsu Hagane. 2002;88(7):406–12. doi:10.2355/tetsutohagane1955.88.7_406. [Google Scholar] [CrossRef]
16. Krivenyuk VV. Creep-rupture prediction for steels and alloys by parametric methods and the base diagram method. Part 1. Interpolation analysis of experimental data. Strength Mater. 2006;38(5):515–26. doi:10.1007/s11223-006-0071-0. [Google Scholar] [CrossRef]
17. Roy PK. Creep rupture analysis and life estimation of 1.25Cr-0.5Mo, 2.25Cr-1Mo and modified 9Cr-1Mo steel: a comparative study. J Inst Eng Ind Ser D. 2018;99(1):33–8. doi:10.1007/s40033-017-0141-4. [Google Scholar] [CrossRef]
18. Sakurai J, Demura M, Inoue J, Yamazaki M. Creep life predictions by machine learning methods for ferritic heat resistant steels. ISIJ Int. 2023;63(10):1786–97. doi:10.2355/isijinternational.isijint-2023-266. [Google Scholar] [CrossRef]
19. Chai M, He Y, Wang J, Wu Z, Lei B. Predicting creep life of CrMo pressure vessel steel using machine learning models with optimal feature subset selection. Int J Press Vessels Pip. 2024;212:105349. doi:10.1016/j.ijpvp.2024.105349. [Google Scholar] [CrossRef]
20. Chen J, Liu X, Zhu L, Fan P, Chen H, Xie Y, et al. A study of creep rupture life prediction for P91 steel with machine learning method: model selection and sensitivity analysis. Int J Press Vessels Pip. 2025;216(4):105494. doi:10.1016/j.ijpvp.2025.105494. [Google Scholar] [CrossRef]
21. Sekido K, Kushima H, Taniuchi Y, Nojima T, Sawada K, Ohba T, et al. Data sheets on the elevated-temperature properties of normalized and tempered 1.25Cr-0.5Mo-Si steel plates for boilers and pressure vessels (SCMV 3 NT). Tokyo, Japan: National Institute for Materials Science; 1994. doi:10.11503/nims.1025. [Google Scholar] [CrossRef]
22. Ishtiaq M, Tariq HMR, Reddy DYC, Kang SG, Reddy NGS. Prediction of creep rupture life of 5Cr-0.5Mo steel using machine learning models. Metals. 2025;15(3):288. doi:10.3390/met15030288. [Google Scholar] [CrossRef]
23. Lippmann R. An introduction to computing with neural nets. IEEE ASSP Mag. 1987;4(2):4–22. doi:10.1109/MASSP.1987.1165576. [Google Scholar] [CrossRef]
24. Shen Y, Matsuura H, Wang C. Evolution of carbide precipitates in 1.25Cr-0.5Mo steel during simulated postweld heat treatment. Metall Mater Trans A. 2018;49(10):4413–8. doi:10.1007/s11661-018-4806-x. [Google Scholar] [CrossRef]
25. Chen J, Liu H, Pan Z, Shi K, Zhang H, Li J. Carbide evolution and service life of simulated post weld heat treated 2.25Cr-1Mo steel. Mater Sci Eng A. 2015;622:153–9. doi:10.1016/j.msea.2014.11.020. [Google Scholar] [CrossRef]
26. Vakili-Tahami F, Sajjadpour M, Attari P. Experimental study of the creep lifetime of the 1.25Cr 0.5Mo steel pipes. Strain. 2011;47(5):414–20. doi:10.1111/j.1475-1305.2009.00702.x. [Google Scholar] [CrossRef]
27. Yang Y, Chen Y, Sridharan K, Allen TR. Evolution of carbide precipitates in 2.25Cr-1Mo steel during long-term service in a power plant. Metall Mater Trans A. 2010;41(6):1441–7. doi:10.1007/s11661-010-0194-6. [Google Scholar] [CrossRef]
28. Zhang X, Chen G, Wang W, Zhong J, Wang Q, Xu T, et al. Evaluation of residual creep life of steels using macro-pillar creep testing and Omega method. Measurement. 2021;174(5):108991. doi:10.1016/j.measurement.2021.108991. [Google Scholar] [CrossRef]
29. Shruti P, Sobti A, Sarma VS, Kamaraj M. Creep deformation behavior and microstructural evolution in pre-strained super austenitic stainless steel 304HCu. Mater Sci Eng A. 2025;940:148567. doi:10.1016/j.msea.2025.148567. [Google Scholar] [CrossRef]
30. Lyu Z, Kannan R, Saini N, Li J, Li L. Degradation of a Cr-Mo steel by carbide precipitation over long-term service. Mater Sci Eng A. 2024;898(5):146354. doi:10.1016/j.msea.2024.146354. [Google Scholar] [CrossRef]
31. Lu C, Yi H, Chen M, Xu Y, Wang M, Hao X, et al. Effects of Si on the stress rupture life and microstructure of a novel austenitic stainless steel. J Mater Res Technol. 2023;25(12):3408–24. doi:10.1016/j.jmrt.2023.06.131. [Google Scholar] [CrossRef]
32. Miura T, Ueji R, Fujii H, Komine H, Yanagimoto J. Stabilization of austenite in low carbon Cr-Mo steel by high speed deformation during friction stir welding. Mater Des. 2016;90:915–21. doi:10.1016/j.matdes.2015.11.037. [Google Scholar] [CrossRef]
33. Delagnes D, Lamesle P, Mathon MH, Mebarki N, Levaillant C. Influence of silicon content on the precipitation of secondary carbides and fatigue properties of a 5%Cr tempered martensitic steel. Mater Sci Eng A. 2005;394(1–2):435–44. doi:10.1016/j.msea.2004.11.050. [Google Scholar] [CrossRef]
34. Chaudhuri S, Ghosh RN. Creep behavior of 2.25Cr1Mo steel—Effects of thermal ageing and pre-strain. Mater Sci Eng A. 2009;510:136–41. doi:10.1016/j.msea.2008.04.108. [Google Scholar] [CrossRef]
Cite This Article
 Copyright © 2026 The Author(s). Published by Tech Science Press.
This work is licensed under a Creative Commons Attribution 4.0 International License , which permits unrestricted use, distribution, and reproduction in any medium, provided the original work is properly cited.
 Downloads
 Citation Tools