
 Login
Login Register
 Submit a Paper
 Propose a Special lssue
 Open Access
ARTICLE

YOLO-MARALight: Detection Algorithm for Small Ship Targets in Complex Scenes in Remote Sensing Images
1 School of Information Science and Engineering, Shenyang Ligong University, Shenyang, China
2 School of Computer Science and Engineering, Northeastern University, Shenyang, China
* Corresponding Author: Fang Liu. Email:
Computers, Materials & Continua 2026, 89(1), 54 https://doi.org/10.32604/cmc.2026.085708
Received 16 May 2026; Accepted 02 July 2026; Issue published 13 August 2026
 View Full Text
 Download PDF
Abstract
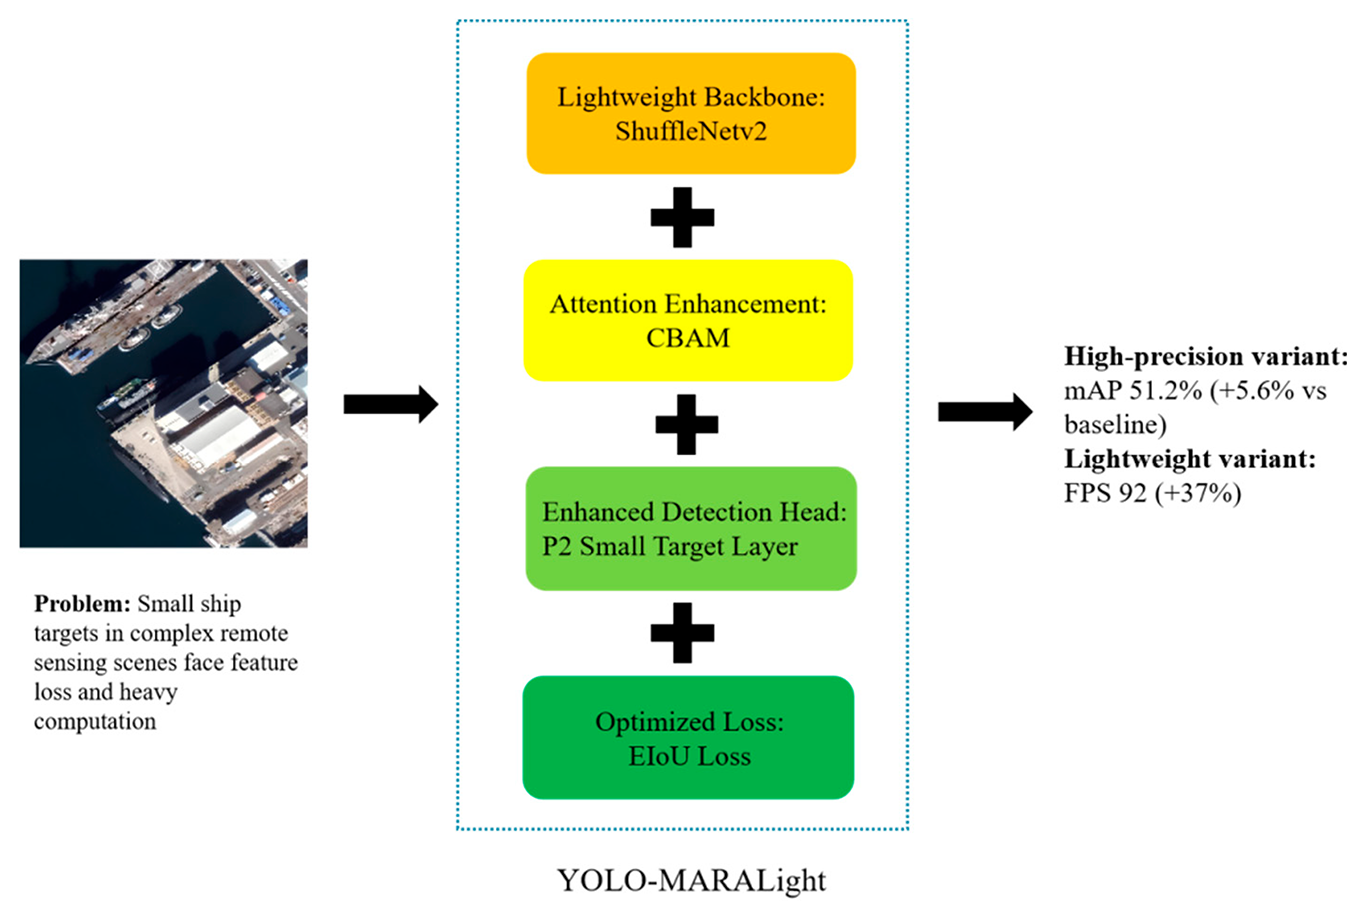
Ship detection is an effective way of sea area supervision, which has important research value in both military and civil fields. For small ship targets in the sea scene, the deep feature map is difficult to effectively capture their subtle features, resulting in the decline of small target detection accuracy and the increase of the missing detection rate. To solve this problem, this paper proposes a detection algorithm called YOLO-MARALight, which adds a small target detection layer in the head network, uses a larger scale feature map to retain the details, and improves the discrimination ability of the model for small targets; Adding CBAM attention mechanism can focus more accurately on the effective area of the target object, selectively strengthen the task related feature expression, reduce background interference, and effectively improve the robustness and generalization ability of the model; The EIoU loss function is introduced to accelerate the convergence speed of the target detection algorithm and improve the detection accuracy; The backbone network adopts ShuffleNetv2 structure, which greatly reduces the amount of calculation and parameters. Training and testing on datasets. Ablation and comparative experiments yield two performance-complementary variants: (1) The high-precision variant (integrating P2 small target detection layer, CBAM attention and EIoU loss) achieves a mAP of 51.2%, 5.6 percentage points higher than the YOLOv8 baseline; (2) The proposed lightweight YOLO-MARALight further incorporates ShuffleNetv2 backbone, boosting precision from 44.6% to 53.5% (significantly reducing false positives), increasing inference speed by 37% from 67 to 92 FPS, and cutting GFLOPs by 22%. Although its mAP slightly drops to 47.4% vs. the high-precision variant, YOLO-MARALight strikes an optimal balance between detection performance and computational efficiency, making it ideal for real-time remote sensing ship detection on resource-constrained edge devices.Graphic Abstract
Keywords
With the continuous development of remote sensing technology, the amount of land and ocean observation data obtained by remote sensing satellites has increased significantly, the data replacement cycle has been significantly compressed, and the recognition accuracy has been increasingly improved. Ship detection is an effective way of sea area supervision, which has important research value in both military and civil fields [1]. Therefore, ship detection based on derivative remote sensing images is to accurately locate and identify the ship type in large-area marine remote sensing images.
With the rise of deep learning, the single-stage detector based on YOLO [2] is widely used in ship detection tasks because of its speed and scalability. YOLO divides the image into multiple grids and classifies and regresses the targets in each grid at the same time. In the field of ship detection, compared with the traditional algorithm, the deep learning ship detection algorithm has stronger fitting and feature expression ability, and can still maintain a good detection effect in a complex environment.
However, there are many difficulties in this task, which are mainly reflected in the following aspects: the distance between satellite or UAV equipment and the sea surface is far, the area of ship target is small compared with the vast remote sensing image, and the features that can be extracted are less; If small targets are occluded or blurred at the same time, the difficulty of detection will be further aggravated. After image convolution many times, the feature information of the small target will be reduced or even lost layer by layer, which makes it difficult for the model to capture its key details in the recognition process, and ultimately affects the detection performance. Secondly, the YOLO algorithm is highly dependent on the number and quality of training samples. Even after Non-Maximum Suppression, there are still missing targets in areas where ships are heavily berthed [3].
Recently, new progress has been made in the research of ship detection in complex waters: Min et al. [4] focused on the problem of confusion between ship and shore based background in the nearshore scene, and proposed a context modulated CM-YOLO algorithm; Yang et al. [5] designed a lightweight framework for joint vessel detection and water area segmentation to meet the real-time perception needs of unmanned vessels in the canal channel. However, the existing methods still have the contradiction between the feature loss of the remote sensing minimal target and the difficulty in balancing the efficiency of edge deployment.
In this paper, a YOLO-MARALight algorithm is proposed. YOLO-MARALight takes YOLOv8 as the baseline model. The improvement of this paper is as follows:
Based on the baseline model of YOLOv8, a small target detection layer is added to the head network, and a CBAM attention mechanism is introduced into the backbone network, which can better extract the range of target objects, selectively focus on the features related to the required task, reduce the interference between the detection target and the environment, and improve the robustness and generalization ability of the network.
Replace the YOLOv8 backbone network with ShuffleNetv2 and use the EIoU loss function. In the case of not significantly reducing the accuracy rate, it reduces the amount of parameters and calculations, and achieves faster model convergence.
Traditional ship detection firstly needs to preprocess the remote sensing image, carry out image denoising, defogging, sea and land segmentation, and other processing, then screen the candidate areas with suspected ships, and then extract the ship target features in the candidate areas. Finally, with the help of the classifier, the feature set is completed, and the classification decision output is given. Traditional ship detection relies on a priori knowledge to design features, which have strong interpretability, but weak generalization ability. Manual feature construction is the main technical route of early detection methods. Before deep learning became mainstream, there was no reliable image feature extraction method. Early studies identified ships and eliminated false alarms from the complex sea environment by screening suspected ship areas. Corbane extracts ship targets from remote sensing images through morphological filtering, wavelet analysis, and random changes [6]. Satyanarayanna and Aparna proposed a method for ship detection using probability distribution of image features based on a semi-supervised hierarchical classification method [7].
The above method is only applicable to the single and calm sea surface, and the ship detection effect in complex scenes is general. Bi et al. proposed an algorithm based on a hierarchical breakthrough region to obtain the salient region and extract the shape and texture features of the ship, and use this feature to complete the ship detection [8]. Subsequently, in 2012, it was proposed to use the bottom-up visual attention mechanism to screen candidate regions and distinguish different candidate regions. Yokoya and Iwasaki proposed a ship detection method in remote sensing images by combining sparse representation and Hough transform [9]. Yang et al. [10] segmented the image by the method of region segmentation and combination, and then used the improved differential box technology to extract the image texture, ripple, and other features to analyze the situation of the sea area and detect the ships on the sea surface. After that, Yang et al. improved the above method by judging the uniformity of the sea background, combining pixels and regional features to build the target calculation function to select the ship, and designing conditions such as compactness and aspect ratio to eliminate false detection [10]. The improved algorithm effectively removes the non-candidate region and reduces the calculation time of the algorithm.
For ship detection under a specific sea background, many scholars have proposed corresponding solutions. Heiselberg used data with higher spatial resolution to achieve accurate positioning and identification of ships and navigation speed monitoring [11].
The target detection method based on deep learning has been far more dependent on the traditional method of artificial feature extraction, but the traditional idea of artificial feature extraction can not be ignored, and its idea continues to promote the frontier exploration in this field.
Deep learning is a branch of machine learning that combines shallow features to form abstract deep features to discover the semantic correlation between data. Convolutional neural network (CNN) [12] is a representative algorithm in the field of deep learning, and has made a breakthrough in the task of target detection. Compared with the traditional target detection methods, the target detection method based on deep learning is obviously stronger in the ability of feature expression, and the detection accuracy is also higher. Target detection methods based on deep learning can be divided into two categories, namely, two-stage and single-stage target detection methods. The two-stage target detection method is to extract candidate regions containing suspected targets first, and then carry out classification work for these candidate regions. The common methods are R-CNN [13] and faster R-CNN [14]. R-CNN first generates a large number of candidate regions by selective search, then extracts the features of the targets in the candidate regions by CNN, and finally determines the category of the targets in the candidate regions based on SVM. The single-stage target detection method predicts the target boundary box and category at the same time. Typical methods include YOLO [2] and SSD [15]. YOLO divides the image into multiple grids and classifies and regresses the targets in each grid at the same time. Compared with the two-stage detection framework, although the single-stage detector has a relatively short board in accuracy, its computational efficiency has been significantly improved, which can meet the requirements of real-time detection. In the field of ship detection, compared with the traditional algorithm, the deep learning ship detection algorithm has stronger fitting and feature expression ability, and can still maintain a good detection effect in a complex environment. Such algorithms rely heavily on the number and quality of training samples. Even after Non–Maximum Suppression, there are still missing targets in areas where ships are heavily berthed.
Due to the significant difference between ship remote sensing images and natural image, there are often some phenomena such as image blur and large target scale change, which lead to the poor performance of classical target detection algorithms in the ship detection task. Therefore, scholars have proposed a series of ship detection algorithms based on a convolutional neural network.
In order to make up for the lack of image quality, Liu et al. enhanced the detection performance by segmenting the image into multiple region fusion features, and introduced the multi region feature fusion module to enhance the ship representation ability [16]; Gao et al. enhanced ship feature information by adding attention mechanism during feature fusion [17]; Wu et al. ship detection in any direction based on attention module, multi-scale feature fusion and rotating pseudo Tags [18]; Luo et al. enhanced semantic features in the shallow layer through semantic information enhancement module to reduce background interference [19]. In view of the characteristics of large changes in ship target size. Li et al. adopted a supplementary scheme called MMAF network multi-scale coding and multi attention fusion to improve the accuracy of multi-scale target detection in complex marine background environment [20]; Bian et al. reduced the information loss of the feature pyramid by channel shuffling, and enhanced the model’s understanding of information at different scales [21].
Most of the above algorithms are based on the horizontal detection box. The ship targets in the remote sensing image are densely distributed and the direction is random. Therefore, scholars began to apply rotating frames and proposed a series of rotating target detection algorithms for ship targets. Liu et al. proposed the key sub region fusion network to improve the accuracy of ship target recognition through adaptive fusion of regional and overall features [22]; Zhang and Liu proposed an improved YOLOv5 network, which improved the detection accuracy of sparse targets by introducing sliding window branches [23]; Wang et al. proposed an improved YOLOv11 ship rotation detection algorithm, designed a multi-scale feature expansion neck module to improve the detection accuracy of ship targets in any direction and reduce the model volume [24].
To a certain extent, the above algorithm solves the problems of arbitrary target orientation, complex model, and large change of target scale in ship detection, but the problems of target and background confusion, insufficient detail feature extraction, and ship contour ambiguity have not been well solved, and the detection accuracy still needs to be improved. Based on the above problems, this paper improves the YOLOv8 model in order to reduce the missing detection of ships in dense arrangements and complex backgrounds.
This paper presents a YOLO-MARALight algorithm. As shown in Fig. 1. That is, a small target detection layer is added to the head network; CBAM attention mechanism is introduced into the backbone network, which can better extract the range of the target object, selectively focus on the features related to the required task, reduce the interference between the detection target and the environment, and improve the robustness and generalization ability of the network; Replace some Conv modules and C2f modules in the backbone network with ShuffleNetv2 network structure to achieve lightweight operation; Without reducing the accuracy rate, the amount of parameters and calculation is reduced, and the EIoU loss function is used to achieve faster model convergence, so as to obtain higher detection accuracy.

Figure 1: YOLO-MARALight algorithm.
3.1 Small Target Detection Module
In the detection layer architecture of the YOLOv8 network, the feature map output scale is set to 80 × 80, 40 × 40, and 20 × 20 levels, corresponding to the detection of small targets, medium targets, and large targets. The minimum size of the detection network outputs a feature map of 80 × 80, and each pixel corresponds to the information of the 8 × 8 pixel region in the original image. However, ship targets on the sea surface are often smaller than this scale, which makes it difficult for deep features to effectively learn their information, resulting in low detection accuracy and a high missing detection rate of small targets. Lin et al. pointed out that the shallow high-resolution feature map is the key support for small target detection, and further demonstrated that the spatial details of small targets are prone to irreversible loss in the continuous downsampling process [25]. Therefore, a 160 × 160 scale micro target detection layer is added to the head network, each grid point corresponds to the receptive field of 4 × 4 pixels in the original image, and can reserve edge contour and position information for the smallest ship with the shortest side of 4–8 pixels. The effectiveness of the design strictly depends on the target scale distribution of the dataset: only when there are significant objects with the shortest edge less than 8 pixels in the dataset, the new detection layer can play a role. And the up-sampling, Concat and C2F modules are introduced to the neck network. The design integrates shallow and deep features, and makes full use of the global context information for detection. The new prediction header and the original three prediction headers form a four prediction header structure. This design is not applicable to all remote sensing ship data sets, and its applicability is determined by the image spatial resolution and the pixel scale after the ship imaging. In low-resolution remote sensing images, even small ships may occupy dozens of pixels. At this time, the gain of the 160 × 160 detection layer is limited.
Because remote sensing images usually contain complex backgrounds such as ocean, port, land, clouds, and so on, they may have similarities with ship targets in texture, color, or shape, which makes traditional methods prone to false detection or missing detection, so the CBAM attention mechanism is introduced.
CBAM (Convolutional Block Attention Module) attention mechanism [26]. The CBAM module is composed of a channel attention module (CAM) and a spatial attention module (SAM). The main responsibility of CAM is to assign attention weights to different feature channels according to the importance of channels; SAM, on the other hand, focuses on assigning attention weights to key areas of the image at the spatial level. The two complement each other to ensure that the model can more comprehensively and accurately capture the core features in the image. The structure of the CBAM module is shown in Fig. 2.

Figure 2: CBAM attention mechanism.
The channel attention module adaptively modifies the input feature map

Figure 3: Structure diagram of channel attention module.
After the channel attention processing, a new feature map is generated, which is sent to the spatial attention module to generate two
Then, the convolution dimension reduction processing is performed, and the sigmoid activation function is applied for nonlinear processing [27]. The calculation formula of the final output
In Eq. (3),

Figure 4: Structure diagram of the spatial attention module.
3.3 ShuffleNetv2 Network Structure
The proposal of ShuffleNetv2 [28] is based on four practical guidelines for establishing a lightweight and efficient network architecture, which is proposed according to the deficiencies in Shufflenetv1 [29] and mobilenetv2 due to the design principles only for optimizing GFLOPs. According to these four principles, ShuffleNetv2 is further improved on the basis of Shufflenetv1. The unit module is shown in Fig. 5.

Figure 5: ShuffleNetv2 unit module.
Fig. 5 shows the basic unit on the left, which adopts the channel division operation to reduce the parameter quantity. The branch adopts the chain structure of convolution layer. After the number of channels is matched, it immediately switches to the feature extraction stage. After the feature extraction is completed, the number of channels is synchronized with another branch, and the other branch performs the same mapping operation. Perform a channel shuffle operation on two-channel information. On the right is the downsampling unit, which discards the channel shuffle operation and adds downsampling with a parameter step of 2 to each branch. After the implementation of such improvements, the amount of parameters decreased significantly. In this experiment, some Conv modules and C2f modules in the YOLOv8 backbone network were replaced by the ShuffleNetv2 network structure to reduce the amount of parameters and realize a lightweight model algorithm.
The EIoU loss function has brought various performance improvements to the YOLOv8 model. On the one hand, the center distance penalty significantly enhances the ability of the model to accurately locate the target position; On the other hand, the length-width ratio difference penalty makes the model more accurate in shape recognition [30].
The EIoU loss function is introduced in this paper, and its formula is as follows:
EIoU loss function is an advanced form of CIoU loss function [31]. In this improved method, the first two parts are the same as the CIoU structure. As shown in Formula (4), it includes three parts: overlap loss (
The formula of center distance loss (
The third part calculates the ratio of the Euclidean distance of the difference between the width and height of the prediction frame and the real frame to the square of the width and height of the minimum outer boundary frame. The formula of azimuth loss (
MyDataset: The remote sensing ship data set used in this paper is divided into 25 categories(remove a type with vague category and few samples), including 15,000 images, of which 12,000 images are used for training, 1500 images are used for verification, and 1500 images are used for testing. Fig. 6 shows the number of dataset instances on the left and the size of dataset images on the right.

Figure 6: Number of dataset instances and size of dataset images.
SSDD: The SSDD data set is represented by [32]. It contains 1160 images, 743 of which are used for training and 232 for testing. 2456 ships of different sizes are collected from Sentinel-1, TerraSAR, and RadarSat-2. These ships provide raw data with image resolution between 1 million and 15 million pixels. The length and width of each image are about 600 pixels. The imaging scene includes complex scenes such as a wharf and nearshore environment, as well as simple scenes such as the sea surface. Each SAR image contains different numbers, sizes, and categories of ship targets. In this data set, 60.2%, 36.8%, and 3.0% of ships are composed of small, medium, and large ships, respectively.
Experimental equipment. Parameters of the model training equipment used in the experiment: operating system: Windows 10; GPU: NVIDIA GeForce RTX 3050; Deep learning framework: pytorch 2.1.0 + cuda 12.1.
Experimental parameter setting. Training picture size: 640 × 640; The optimizer uses SGD, the learning rate is set to 0.01, the batch size is 4, and the training is 100 rounds.
Confusion matrix is a standard format used to evaluate the performance of a classification model. It shows the classification performance of the model for each category by comparing the prediction results of the model with the actual labels of the target, so as to better understand the advantages and disadvantages of the model.
In binary classification problems, the confusion matrix is usually represented by a 2 × 2 matrix. As shown in Table 1.

In addition, a variety of advanced performance indicators can be calculated according to the confusion matrix in the target detection algorithm, such as accuracy, recall, average accuracy, and so on.
Precision: it reflects the proportion of correct recognition of real positive samples by the model. The higher the precision, the better the effect of the model. The calculation formula is shown in Formula (8).
Recall: it reflects the detection ability of the model for positive categories. This indicator evaluates the comprehensiveness of the model for capturing positive categories. The calculation formula of the recall rate is shown in Formula (9).
Mean of average precision (mAP): used to evaluate the comprehensive level of the model for multi-category targets. The higher the mean of average precision, the better. The calculation formula is shown in Formula (10).
In order to strictly evaluate the individual contributions of the P2 small target detection layer, CBAM attention mechanism, EIoU loss function, and ShuffleNetv2 structure, this paper conducted ablation experiments under identical training settings, and the results are summarized in Table 2.

From the perspective of detection accuracy, as modules are added one by one, the comprehensive detection performance mAP of the model shows a trend of first rising and then slightly declining. The mAP of the YOLOv8 baseline model was 45.6%. After adding P2 small target detection layer, CBAM attention mechanism, and EIoU loss function in turn, the mAP gradually increased to 51.2%. This shows that these three modules have effectively enhanced the model’s feature extraction ability and bounding box regression accuracy, among which the CBAM attention mechanism and EIoU loss function have the most obvious effect on performance improvement. After the introduction of ShuffleNetv2 lightweight backbone network, the mAP dropped to 47.4%, and the recall rate also dropped from 51.2% to 47.3%.
From the perspective of calculation amount and reasoning speed, after adding CBAM and EIoU, the calculation amount (GFLOPs) of the model reaches the highest 13.5, and the number of images that can be processed per second (FPS) is 67. After ShuffleNetv2 is introduced, the calculation amount is reduced to 10.5, 22%; FPS increased from 67 to 92, with an increase of 37%. This shows that ShuffleNetv2 effectively simplifies the calculation structure of the model and greatly improves the reasoning speed.
However, the accuracy of the model rose from 47.7% to 53.5%. This shows that ShuffleNetv2 does not reduce the overall judgment ability of the model, but changes the wrong type: it reduces the situation of misjudging the background as a ship, but at the same time, it misses more real ships. We further compare the detection results of 24 types of ships and find that ShuffleNetv2 has different effects on targets of different sizes. For medium and small targets with a pixel size between 16 × 16 and 32 × 32, such as yachts, tugs, and command ships, the detection accuracy has significantly improved. The mAP of yachts has increased from 53.4% to 65.6%, and that of tugs has increased from 25.7% to 42.9%. Only for very small targets with a pixel size less than 16 × 16, such as barges, the detection accuracy decreased slightly by 1.2%. For large and medium-sized targets such as aircraft carriers and destroyers, the detection accuracy is basically stable, and the variation range is within 1%.
The decline in the recall rate is not the same in all scenarios. It mainly focuses on the port scene where ships are densely docked. In this kind of scene, multiple small targets are close together, and features are easy to overlap and interfere with each other. ShuffleNetv2 has relatively weak feature extraction ability, which makes it easier to identify multiple adjacent ships as one, or miss some occluded targets. But in the single ship detection scene on the open sea, the performance of the final model is almost the same as that of the version without ShuffleNetv2.
Based on these results, this paper actually gets two model versions with different positioning. The high-precision versions of P2, CBAM, and EIoU are reserved, and ShuffleNetv2 is not added. The mAP is 51.2%, and the FPS is 67. It is suitable for scenarios with strict requirements on the missing detection rate and low requirements on speed. The YOLO-MARALight lightweight version of ShuffleNetv2 is added, with the mAP of 47.4% and the FPS of 92, which is suitable for scenes requiring high frame rate reasoning.
5.2.1 Comparative Attention Mechanism
In order to verify the effectiveness of adding an attention mechanism, after introducing SE, CA, CBAM, and other different attention mechanisms into the baseline model of YOLOv8, Table 3 shows that CBAM attention mechanism performs best in the comparative experiment, with mAP increased by 1.3% and accuracy rate increased by 1.3% compared with the baseline model. According to the theoretical analysis, Se attention mechanism does not consider the context information, CA attention mechanism ignores the channel level information, while the CBAM attention mechanism pays attention to both spatial and channel information. It shows that adding the CBAM attention mechanism to YOLOv8 can effectively improve the model’s ability to learn features, so as to improve its performance in target detection tasks.

5.2.2 Contrast Confusion Matrix
As shown in Fig. 7, observe that the diagonals in the confusion matrix are the correct proportion of detection, and compare the detection results of the diagonals of the two models. In the figure, the vertical represents the real annotation category of the sample, and the horizontal represents the prediction output category of the model; The value on the diagonal of the matrix is the number of correctly predicted samples, and the value off the diagonal is the number of samples with misclassification/missed detection/false detection. The higher the value, the darker the color block. 1681 real cases were detected for the baseline model confusion matrix, and 1748 real cases were detected for the improved model confusion matrix, which shows that the accuracy of the model proposed in this paper has been improved.

Figure 7: Baseline model confusion matrix (left) and improved model confusion matrix (right).
As shown in Fig. 8, for the comparison of different categories in the dataset, this paper shows the baseline and the improved model PR curve.

Figure 8: Baseline model PR curve (left) and improved model PR curve (right).
Fig. 8 shows the PR curve comparison chart of ship target detection, which is used to comprehensively evaluate the balance performance of the accuracy and recall ratio of the model under different confidence thresholds. The larger the area covered by the curve, the better the comprehensive detection performance of the model. The abscissa in the figure is the recall rate, reflecting the detection coverage of the model to the real positive samples; The ordinate is the accuracy rate, which reflects the proportion of correct samples in the model prediction results; The all classes curve marked in the figure is the comprehensive test result of all categories, and the area under the curve corresponds to mAP@0.5 Indicators. By comparing the PR curves of the two models, we can see that the left figure shows the full category of YOLOv8 baseline model mAP@0.5 0.456, and the area under the overall curve is relatively small; The full category of the improved model in the right figure mAP@0.5 It is raised to 0.488, and the curve is closer to the upper right corner of the coordinate axis, indicating that the improved strategy proposed in this paper effectively improves the comprehensive detection performance of the model.
It can be seen that the improved model improves the ability of positive sample detection, and the mAP of each category is summarized as shown in Table 4 below.

It can be seen from the results that the performance of large objects such as warships has been steadily improved, and the average accuracy of six types of small targets, such as yachts, sailboats, and fishing boats, has increased by 8.8%, with a maximum of 17.2%. It has a good performance improvement. The analysis shows that the experiment in this paper has a strong targeted improvement for small target objects, which verifies the effectiveness of the experiment for improving the average accuracy of small targets.
In order to verify the effectiveness of the loss function EIoU, the EIoU was compared with SIoU and GIoU. The results of the loss function comparison experiment are shown in Table 5. The following compares several common loss functions. From Table 5, it can be seen that the EIoU loss function has the best performance, with an average accuracy increase of 2.4%, and an accuracy increase of 2.0%.

As shown in Fig. 9, for the comparison of different categories in the dataset, this paper shows the baseline and the improved model P curve, from which it can be concluded that the improved model has improved in different categories, and the results are summarized as shown in Table 6 below.

Figure 9: Baseline model P curve (left) and improved model P curve (right).

Fig. 9 is the accuracy confidence curve comparison diagram of ship target detection, which is used to show the change rule of the accuracy of model detection with the confidence threshold, and intuitively reflect the control ability of the model to false detection. The abscissa in the figure is the confidence threshold, representing the credibility of the model output test results; The ordinate is the accuracy rate, representing the proportion of real positive samples in the prediction results under the corresponding threshold; The all classes curve marked in the figure is the comprehensive test results of all categories, and the values marked on the curve are the highest accuracy rate and corresponding confidence points that can be achieved for all categories. By comparing the curves of the two models, it can be seen that the baseline model YOLOv8 in the left figure has the highest accuracy rate of 1.000 under the confidence of 0.992; The improved model in the right figure achieves the highest accuracy rate of 1.000 at the confidence level of 1.000, and the accuracy rate of the improved model is better than that of the baseline model in most confidence intervals, indicating that the improved strategy proposed in this paper effectively suppresses background error detection and improves the detection accuracy of the model.
For the stable improvement of large targets, the accuracy rate of six types of small targets, such as yachts, sailboats, and fishing boats, increased by 3.9% on average, with a maximum increase of 16.5%. It has a good performance improvement. The balance between detection speed and accuracy is achieved.
It should be noted that in Table 6, a few categories, such as Merchant Ship, Barge, Patrol, and so on, have a maximum accuracy of 100%. This result is mainly caused by two factors:
First, these categories are rare in the data set, and the sample size of the test set is very small—there are only 11 real test samples for merchant ships, 13 for barges, and 6 for patrol boats. The limited sample can not cover all the attitudes, lighting conditions, and background scenes of the ship, resulting in some fluctuations in the statistical results.
Second, the maximum precision of the P curve corresponds to the highest confidence threshold of the model output. When the confidence threshold is set high enough, the model will only output the most certain prediction results, and there will be no false detection at this time, so the maximum accuracy, in theory, can reach 100%. However, it needs to be clear that the recall rate corresponding to this precision is extremely low, and the model will miss most of the real targets, unable to reflect its comprehensive detection performance in actual deployment. The core improvement conclusion of this paper is mainly based on the categories with sufficient sample size and higher statistical reliability.
5.2.6 Compare Different Models
In order to verify the comprehensive performance and generalization ability of the algorithm in this paper, eight mainstream target detection algorithms, Faster RCNN, SSD, RetinaNet, FCOS, YOLOv5, YOLOv8, YOLOv10, and DiffusionDet, were selected to carry out horizontal comparison on the SSDD public data set mAP@0.5 mAP@0.75 and mAP@0.5: 0.95 The evaluation results of three core indicators are shown in Table 7.

Comprehensive test performance index mAP@0.5: 0.95, the algorithm in this paper achieves the optimal value with 0.653, the less optimal DiffusionDet increases by 0.019, 0.021 compared with the single-stage benchmark FCOS, YOLOv8, and 0.043, 0.036, 0.037, 0.045 compared with Faster RCNN, SSD, YOLOv5, YOLOv10, respectively. This shows that the multi-module combination improvement strategy in this paper can effectively integrate shallow details and deep semantic features, and significantly improve the comprehensive detection capability of the model under different IoU thresholds.
Reflects the regression accuracy of the bounding box mAP@0.75. In terms of indicators, the algorithm in this paper has a particularly significant advantage, reaching 0.763, 0.028 higher than the second-place DiffusionDet, and 0.038 higher than YOLOv8. This fully verifies the effectiveness of the EIoU loss function: the penalty term of the center distance and length-width ratio introduced by the EIoU can accelerate the model convergence and significantly improve the positioning accuracy of the bounding box, and more accurately fit the contour and position of the ship target.
mAP@0.5 In terms of indicators, the algorithm in this paper ranks second with 0.962, only second to 0.967 of DiffusionDet, which is superior to all other comparison models; 0.003 higher than YOLOv8 and FCOS, and 0.011 higher than SSD and YOLOv10, indicating that the algorithm still maintains excellent target recognition capability under a loose IoU threshold, which can effectively reduce the miss detection rate.
The comparison of technical routes shows that the two-stage detection algorithm, Faster RCNN, lags behind most of the single-stage models in three indicators, which further verifies the comprehensive advantages of the single-stage algorithm in real-time remote sensing ship detection tasks. Within the YOLO series, the algorithm in this paper comprehensively surpasses YOLOv5, YOLOv8, and YOLOv10, especially in the mAP@0.75 and mAP@0.5: 0.95, which proves the rationality and effectiveness of the small target detection layer, CBAM attention mechanism, and other improvement measures proposed for YOLOv8.
To sum up, the algorithm in this paper achieves the optimal comprehensive detection performance on the SSDD dataset, which can effectively deal with the detection challenges such as small target size and complex background of remote sensing ships, and has stronger generalization ability and engineering application value.
As shown in Fig. 10, in order to detect the ablation experimental results, the dense images, the representative images with smaller targets, and the images with darker backgrounds were randomly selected from the test data set, and the algorithms in Table 2 were visually analyzed.

Figure 10: Visualization of partial ablation test results. (a) Is the baseline model test result of YOLOv8? (b) Add the detection result of the small target detection layer to (a). (c) Add CBAM attention mechanism test results for (b). (d) Add the test results of the EIoU loss function to (c). (e) Add the ShuffleNetv2 backbone network detection results for (d).
The analysis shows that the model has a great improvement in small target detection, detects more types of small targets, and can better correct some false detection problems. It can be seen intuitively from the figure that the overall detection effect of the improved algorithm is better. At the same time, the further integration of multi-scale features combined with the CBAM attention mechanism promotes the stable improvement of large target objects.
Aiming at the core challenges of small target feature loss, complex background interference, and high computing cost in ship detection in remote sensing images, a lightweight ship detection algorithm, YOLO-MARALight, based on improved YOLOv8, was proposed. The algorithm introduces a 160 × 160 P2 small target detection layer to preserve the fine spatial details of small ships with pixels less than 8 × 8; Integrate CBAM attention mechanism, suppress ocean, cloud and land background noise, and enhance target feature expression; The EIoU loss function is used to accelerate the model convergence and improve the bounding box regression accuracy; ShuffleNetv2 is used to replace the original backbone to realize the remarkable lightweight of the model.
Through ablation experiments and comparative analysis, we obtained two model variants with different application directions:
High precision variant (combining P2 layer, CBAM, and EIoU): 51.2% mAP, 5.6 percentage points higher than YOLOv8 baseline (45.6%). This variant effectively reduces the miss detection rate of small dense ship targets, and is suitable for application scenarios that require strict detection integrity and low real-time requirements.
Lightweight YOLO MARALight (ShuffleNetv2 is further introduced): Compared with the high-precision variant, it reduces the computational complexity (GFLOPs) by 22% (from 13.5 to 10.5), and increases the reasoning speed by 37% (from 67 FPS to 92 FPS). At the same time, it improves the detection accuracy (P) from 44.6% to 53.5%, significantly reducing false detection caused by background similarity. Although its mAP (47.4%) and recall rate (47.3%) are slightly lower than the high-precision variant, this performance trade-off is acceptable for most real-time monitoring scenarios. It is worth noting that YOLO-MARALight still maintains significant performance improvement on the baseline for small and medium-sized ship targets such as yachts and tugs.
The effectiveness of this method is further verified by the comparison experiment with eight mainstream detection algorithms on the public SSDD dataset. High precision variants enable mAP@0.5: 0.95 of 0.653, superior to Faster RCNN, SSD, YOLOv5, and YOLOv8, showing strong comprehensive detection capability.
It should be pointed out that the performance degradation of YOLO-MARALight is mainly concentrated in the port scene with dense ships berthing, where adjacent small targets are prone to feature overlap and partial occlusion. In future work, we will optimize the feature fusion strategy of dense targets to improve the recall rate of YOLO-MARALight in complex scenes, and explore the deployment of this model on edge computing devices such as UAVs to achieve real-time on-board detection.
Acknowledgement: Not applicable.
Funding Statement: This work was supported by the Xingliao Talents Plan under Grant XLYC2202013, the National Natural Science Foundation of Liaoning Province under Grant 2025-MSLH-597, and the High-Level Talent Introduction Scientific Research Support Program of Shenyang Ligong University.
Author Contributions: Yufei Wang: Writing-original draft, Validation; Jiayi Shang: Software, Methodology, Writing-review & editing; Fang Liu: Conceptualization, Writing—review & editing; Jun Liu: Methodology, Investigation. All authors reviewed and approved the final version of the manuscript.
Availability of Data and Materials: Data will be made available on request.
Ethics Approval: Not applicable.
Conflicts of Interest: The authors declare no conflicts of interest.
References
1. Liao R, Zhang Y, Wang H, Lu L, Chen Z, Wang X, et al. An effective ship detection approach combining lightweight networks with supervised simulation-to-reality domain adaptation. Comput Aided Civ Infrastruct Eng. 2025;40(27):4732–57. doi:10.1111/mice.13501. [Google Scholar] [CrossRef]
2. Zhou Y. A YOLO-NL object detector for real-time detection. Expert Syst Appl. 2024;238(9):122256. doi:10.1016/j.eswa.2023.122256. [Google Scholar] [CrossRef]
3. Zhang H, Sun W, Sun C, He R, Zhang Y. HSP-YOLOv8: UAV aerial photography small target detection algorithm. Drones. 2024;8(9):453. doi:10.3390/drones8090453. [Google Scholar] [CrossRef]
4. Min L, Dou F, Zhang Y, Shao D, Li L, Wang B. CM-YOLO: context modulated representation learning for ship detection. IEEE Trans Geosci Remote Sensing. 2025;63:1–14. doi:10.1109/tgrs.2025.3538848. [Google Scholar] [CrossRef]
5. Yang X, She H, Lou M, Ye H, Guan J, Li J, et al. A joint ship detection and waterway segmentation method for environment-aware of USVs in canal waterways. IEEE Trans Automat Sci Eng. 2025;22:2132–44. doi:10.1109/tase.2024.3375300. [Google Scholar] [CrossRef]
6. Corbane C, Najman L, Pecoul E, Demagistri L, Petit M. A complete processing chain for ship detection using optical satellite imagery. Int J Remote Sens. 2010;31(22):5837–54. doi:10.1080/01431161.2010.512310. [Google Scholar] [CrossRef]
7. Satyanarayana MS, Aparna G. A method of ship detection from spaceborne optical image. Int J Adv Comput Math Sci. 2012;3:535–40. doi:10.4028/www.scientific.net/amm.190-191.1099. [Google Scholar] [CrossRef]
8. Fukun B, Liu F, Gao L. A hierarchical salient-region based algorithm for ship detection in remote sensing images. In: Advances in neural network research and applications. Berlin/Heidelberg, Germany: Springer; 2010. p. 729–38. doi:10.1007/978-3-642-12990-2_85. [Google Scholar] [CrossRef]
9. Yokoya N, Iwasaki A. Object detection based on sparse representation and Hough voting for optical remote sensing imagery. IEEE J Sel Top Appl Earth Obs Remote Sens. 2015;8(5):2053–62. doi:10.1109/jstars.2015.2404578. [Google Scholar] [CrossRef]
10. Yang G, Li B, Ji S, Gao F, Xu Q. Ship detection from optical satellite images based on sea surface analysis. IEEE Geosci Remote Sensing Lett. 2014;11(3):641–5. doi:10.1109/lgrs.2013.2273552. [Google Scholar] [CrossRef]
11. Heiselberg H. A direct and fast methodology for ship recognition in sentinel-2 multispectral imagery. Remote Sens. 2016;8(12):1033. doi:10.3390/rs8121033. [Google Scholar] [CrossRef]
12. Chen F, Li S, Han J, Ren F, Yang Z. Review of lightweight deep convolutional neural networks. Arch Comput Meth Eng. 2024;31(4):1915–37. doi:10.1007/s11831-023-10032-z. [Google Scholar] [CrossRef]
13. Xie X, Cheng G, Wang J, Li K, Yao X, Han J. Oriented R-CNN and beyond. Int J Comput Vis. 2024;132(7):2420–42. doi:10.1007/s11263-024-01989-w. [Google Scholar] [CrossRef]
14. Ren S, He K, Girshick R, Sun J. Faster R-CNN: towards real-time object detection with region proposal networks. IEEE Trans Pattern Anal Mach Intell. 2017;39(6):1137–49. doi:10.1109/tpami.2016.2577031. [Google Scholar] [PubMed] [CrossRef]
15. Liu W, Anguelov D, Erhan D, Szegedy C, Reed S, Fu CY, et al. SSD: single shot MultiBox detector. In: European Conference on Computer Vision. Cham, Switzerland: Springer; 2016. p. 21–37. [Google Scholar]
16. Liu K, Zhang M, Ren Y, Guo Y, Li G, Gao X. Enhanced rotating ship detection in SAR images via noise suppression and feature amplification. Visual Comput. 2025;41(14):12307–23. doi:10.1007/s00371-025-04158-3. [Google Scholar] [CrossRef]
17. Gao Y, Wu Z, Ren M, Wu C. Improved YOLOv4 based on attention mechanism for ship detection in SAR images. IEEE Access. 2022;10(6):23785–97. doi:10.1109/ACCESS.2022.3154474. [Google Scholar] [CrossRef]
18. Wu Y, Zhao W, Zhang R, Jiang F. AMR-net: arbitrary-oriented ship detection using attention module, multi-scale feature fusion and rotation pseudo-label. IEEE Access. 2021;9:68208–22. doi:10.1109/ACCESS.2021.3075857. [Google Scholar] [CrossRef]
19. Luo H, Wang P, Chen H, Xu M. Object detection method based on shallow feature fusion and semantic information enhancement. IEEE Sens J. 2021;21(19):21839–51. doi:10.1109/jsen.2021.3103612. [Google Scholar] [CrossRef]
20. Li Z, Kong D, Liu J, Sun X, Du Q, Zhang L. Multiscale accurate ship detection network driven by multiattention Fusi on for complex maritime backgrounds. IEEE Sens J. 2024;24(6):9208–16. doi:10.1109/JSEN.2024.3359702. [Google Scholar] [CrossRef]
21. Bian J, Feng M, Dong W, Wu F, Luo J, Wang Y, et al. Feature information driven position Gaussian distribution estimation for tiny object detection. In: Proceedings of the 2025 IEEE/CVF Conference on Computer Vision and Pattern Recognition (CVPR); 2025 Jun 10–17; Nashville, TN, USA. p. 30376–86. doi:10.1109/CVPR52734.2025.02828. [Google Scholar] [CrossRef]
22. Liu J, Chen H, Wang Y. Multi-source remote sensing image fusion for ship target detection and recognition. Remote Sens. 2021;13(23):4852. doi:10.3390/rs13234852. [Google Scholar] [CrossRef]
23. Zhang P, Liu Y. A small target detection algorithm based on improved YOLOv5 in aerial image. PeerJ Comput Sci. 2024;10(2):e2007. doi:10.7717/peerj-cs.2007. [Google Scholar] [PubMed] [CrossRef]
24. Wang Z, Li W, Fan Y, Wang L, Yao G. Ship target detection algorithm in remote sensing images based on improved YOLO11s. Ocean Eng. 2026;343(15):123204. doi:10.1016/j.oceaneng.2025.123204. [Google Scholar] [CrossRef]
25. Lin TY, Dollar P, Girshick R, He K, Hariharan B, Belongie S. Feature pyramid networks for object detection. In: Proceedings of the 2017 IEEE Conference on Computer Vision and Pattern Recognition (CVPR); 2017 Jul 21–26; Honolulu, HI, USA. p. 936–44. doi:10.1109/cvpr.2017.106. [Google Scholar] [CrossRef]
26. Wang W, Tan X, Zhang P, Wang X. A CBAM based multiscale transformer fusion approach for remote sensing image change detection. IEEE J Sel Top Appl Earth Obs Remote Sens. 2022;15:6817–25. doi:10.1109/JSTARS.2022.3198517. [Google Scholar] [CrossRef]
27. Narayan S. The generalized sigmoid activation function: competitive supervised learning. Inf Sci. 1997;99(1–2):69–82. doi:10.1016/S0020-0255(96)00200-9. [Google Scholar] [CrossRef]
28. Liu D, Du J, Li C, Yu C, Zhang M. Multi-unit stacked architecture: an urban scene segmentation network based on UNet and ShuffleNetv2. Appl Soft Comput. 2024;165(12):112065. doi:10.1016/j.asoc.2024.112065. [Google Scholar] [CrossRef]
29. Zhang X, Zhou X, Lin M, Sun J. ShuffleNet: an extremely efficient convolutional neural network for mobile devices. In: Proceedings of the 2018 IEEE/CVF Conference on Computer Vision and Pattern Recognition (CVPR); 2018 Jun 18–22. Salt Lake City, UT, USA. p. 6848–56. doi:10.1109/CVPR.2018.00716. [Google Scholar] [CrossRef]
30. Zhang YF, Ren W, Zhang Z, Jia Z, Wang L, Tan T. Focal and efficient IOU loss for accurate bounding box regression. Neurocomputing. 2022;506(9):146–57. doi:10.1016/j.neucom.2022.07.042. [Google Scholar] [CrossRef]
31. Zheng Z, Wang P, Liu W, Li J, Ye R, Ren D. Distance-IoU Loss: faster and better learning for bounding box regression. In: Proceedings of the 2020 AAAI Conference on Artificial Intelligence (AAAI); 2020 Feb 7–12; New York, NY, USA. p. 12993–3000. doi:10.1609/aaai.v34i07.6999. [Google Scholar] [CrossRef]
32. Zhang T, Zhang X, Li J, Xu X, Wang B, Zhan X, et al. SAR ship detection dataset (SSDDofficial release and comprehensive data analysis. Remote Sens. 2021;13(18):3690. doi:10.3390/rs13183690. [Google Scholar] [CrossRef]
33. Lin TY, Goyal P, Girshick R, He K, Dollar P. Focal loss for dense object detection. In: Proceedings of the 2017 IEEE International Conference on Computer Vision (ICCV); 2017 Oct 22–29; Venice, Italy. p. 2999–3007. doi:10.1109/iccv.2017.324. [Google Scholar] [CrossRef]
34. Tian Z, Shen C, Chen H, He T. FCOS: fully convolutional one-stage object detection. In: Proceedings of the IEEE/CVF International Conference on Computer Vision (ICCV); 2019 Oct 27–Nov 2; Seoul, Republic of Korea. p. 9626–35. doi:10.1109/iccv.2019.00972. [Google Scholar] [CrossRef]
35. Jocher G. Ultralytics YOLOv5. 2020 [cited 2026 Jan 1]. Available from: https://github.com/ultralytics/yolov5. [Google Scholar]
36. Jocher G, Chaurasia A, Qiu J. Ultralytics YOLOv8. 2023 [cited 2026 Jan 1]. Available from: https://github.com/ultralytics/ultralytics. [Google Scholar]
37. Chen S, Sun P, Song Y, Luo P. DiffusionDet: diffusion model for object detection. In: Proceedings of the IEEE/CVF International Conference on Computer Vision (ICCV); 2023 Oct 1–6; Paris, France. p. 19773–86. doi:10.1109/iccv51070.2023.01816. [Google Scholar] [CrossRef]
38. Wang A, Chen H, Liu L, Chen K, Lin Z, Han J, et al. YOLOv10: real-time end-to-end object detection. arXiv:240514458. 2024. [Google Scholar]
Cite This Article
 Copyright © 2026 The Author(s). Published by Tech Science Press.
This work is licensed under a Creative Commons Attribution 4.0 International License , which permits unrestricted use, distribution, and reproduction in any medium, provided the original work is properly cited.
 Downloads
 Citation Tools
