
 Login
Login Register
 Submit a Paper
 Propose a Special lssue
 Open Access
ARTICLE
TF-SAGE: Trust Filtered Graph Learning for Stable Internet of Things Intrusion Detection under Adversarial Attacks
1 Department of Electronic Engineering, National Kaohsiung University of Science and Technology, Kaohsiung, Taiwan
2 Department of Electrical and Electronic Engineering, School of Engineering and Technology, Nha Trang University, Khanh Hoa, Vietnam
* Corresponding Authors: Thanh-Tuan Nguyen. Email: ; Mong-Fong Horng. Email:
(This article belongs to the Special Issue: Deep Learning for Next-Generation Cybersecurity: Architectures, Robustness and Applications)
Computers, Materials & Continua 2026, 89(2), 73 https://doi.org/10.32604/cmc.2026.084993
Received 03 May 2026; Accepted 07 August 2026; Issue published 15 September 2026
 View Full Text
 Download PDF
Abstract
Internet of Things (IoT) intrusion detection systems face increasing pressure from adversarial attacks that can manipulate not only feature vectors but also the relational structure on which graph based models rely. This paper proposes Trust Filtered GraphSAGE (TF-SAGE), a graph based intrusion detection system (IDS) pipeline in which edges are assigned trust scores, filtered before message passing, and coupled with uncertainty aware inference to reduce overconfident decisions under unstable neighborhoods. The model is evaluated on NF-ToN-IoT-v2 as the main benchmark and CICIIoT2025 as an independent confirmation benchmark under the same FSAA and GSAA evaluation protocol. The results show that TF-SAGE is not the top clean score model, yet it maintains substantially stronger stability under attack: on NF-ToN-IoT-v2, it reaches clean macro averaged F1 (Macro-F1) 0.9789, retains 0.9776 under Feature Space Adversarial Attack (FSAA), and achieves 0.9048 with attack success rate (ASR) 0.0941 under GSAA, while the graph baselines degrade more severely. Evidence from calibration and neighborhood recovery further indicates that these gains are mechanistically grounded rather than reducible to a single summary score. These findings position TF-SAGE as a practical resilience oriented design direction for IoT intrusion detection based on graph neural networks (GNNs).Keywords
The Internet of Things (IoT) has become an operational infrastructure layer for factories, logistics, healthcare, transportation, and smart homes. This expansion enables automation and continuous monitoring, but it also enlarges the attack surface because IoT systems often operate under limited resources, fragmented protocols, long deployment lifecycles, and partially uncontrolled network environments. Recent bibliometric evidence shows that research on intrusion detection for IoT is growing rapidly in both scale and specialization [1]. Yet, in real deployment, an intrusion detection system (IDS) cannot be judged only by its accuracy on clean data; what matters more is whether it can still produce reliable alerts when traffic patterns shift, malicious behavior is disguised, or communication relations among devices are distorted.
What makes IoT IDS distinct is that many attack indicators do not reside in a single feature, but in the interaction pattern among hosts, protocols, time windows, and connection clusters. If the model relies only on independent feature vectors, it can easily miss the behavioral structure that often determines whether legitimate and malicious flows remain distinguishable when an attacker imitates benign behavior. Therefore, a useful IoT IDS should represent both feature information and relational context.
Machine learning and deep learning have substantially improved intrusion detection performance, but they have also exposed a weakness in common evaluation practice: clean performance is not equivalent to security value. Recent studies on feature optimization, classifier comparison, and real time IDS pipelines over IoT datasets continue to report strong performance under controlled settings [2,3]. Ensemble systems and attack specific pipelines also show how quickly machine learning/deep learning (ML/DL) IDS research is expanding [4,5]. However, strong benchmark performance does not automatically guarantee defensive value when the input is manipulated. Recent surveys on adversarial machine learning for network intrusion detection systems consistently emphasize that IDS based on machine learning (ML) can be misled by small but purposeful perturbations [6,7]. The central problem is therefore not merely to raise clean F1, but to preserve stable detection behavior under adversarial stress.
In recent years, graph neural networks (GNNs) have emerged as a particularly suitable direction for IDS because network traffic is not a collection of independent samples. The latest survey on GNNs for intrusion detection shows a clear shift from sample level learning toward relation aware and structure aware learning [8]. This shift is supported by positive evidence. Anomal-E shows that edge information and topological structure can be exploited effectively even in a self supervised setting [9]. Altaf et al. and Gao et al. likewise show that graph based learning can improve anomaly detection when topology and attributes are modeled jointly [10,11]. More recently, EMA-IDS highlights the role of edge features and multi hop attention, while Ngo et al. propose attribute based graph construction for IoT IDS [12,13]. In general, graph learning allows the model to represent the geometry of network behavior rather than only the value of each individual record.
However, a major gap in this literature is that most studies focus on the graph backbone while treating graph construction as a reasonable preprocessing step. In graph based IDS, the graph is not given; it is built from similarity thresholds, time windows, node definitions, and relation constraints. If edges are formed incorrectly or neighborhoods are retained poorly, message passing can amplify confusion rather than supply useful context. From a security perspective, graph construction should be treated as an attack surface, not only as preprocessing. This argument is consistent with recent warnings from the adversarial network intrusion detection systems (NIDS) literature [6,7], and becomes even more important in the GNN setting, where perturbations may simultaneously affect features and topology [14]. Moreover, the issue does not stop at attacked accuracy. Hsu et al. show that GNNs can be miscalibrated in ways that are specific to graph data [15]. In deployment oriented literature, work on federated learning and explainable IDS also suggests that reliability is increasingly tied to distributed settings and the need for interpretable decisions [16,17]. This indicates that a graph based IDS should not only be correct, but should also know when its neighborhood is no longer trustworthy.
These observations motivate the central question of this study: can an IDS based on GNNs preserve reliable detection behavior when the graph used for inference is itself exposed to perturbation? The contributions are listed as follows:
(i) TF-SAGE is proposed as a Trust Filtered GraphSAGE framework for IoT IDS, where graph construction is protected through edge persistence, trust filtering, and uncertainty aware inference.
(ii) A dual surface evaluation protocol is introduced to separate Feature Space Adversarial Attack (FSAA) from Graph Space Adversarial Attack (GSAA), making feature driven degradation distinguishable from neighborhood manipulation.
(iii) Experiments on NF-ToN-IoT-v2 and CICIIoT2025 show that protecting graph construction helps graph based IDS maintain more stable detection behavior under adversarial pressure while preserving competitive clean detection.
The related literature is reviewed along three complementary layers: IoT IDS based on machine learning and deep learning, IDS based on graph representations and graph neural networks, and evaluation directions that move beyond clean performance. The intersection of these layers is not only about which classifier to use, but about whether an IDS can retain its defensive value when data conditions, communication structure, and operational settings become less stable.
2.1 Machine Learning and Deep Learning IDS for IoT
Machine learning and deep learning IDS remain the largest foundation of the current IoT security literature. Recent reviews consistently show that most studies still follow a relatively stable pipeline: extract features from packets or flows, represent the data as vectors, and then apply supervised learning, deep learning, or hybrid learning to classify benign and malicious traffic [1,18]. Studies by Xu et al. and Shi et al. further confirm the continuing importance of feature selection and ensemble learning pipelines for IoT IDS [2,4]. The appeal of this line of work lies in its ease of deployment, reasonable training cost, and straightforward benchmarking on standardized datasets. Thus, even as graph based and robust IDS research expands rapidly, ML/DL IDS still provides the central baseline family in most IoT intrusion detection studies.
Within this family, classical learners and deep models continue to coexist. Berhili et al. show that random forest, decision tree, support vector machine (SVM), logistic regression, and gradient boosting remain widely used because they are relatively fast to train and easier to interpret [19]. Kikissagbe and Adda likewise note that supervised learning and hybrid systems still dominate many NetFlow and traffic feature benchmarks [18]. Musthafa et al. add an important point: class balancing, feature selection, and the way the training set is constructed can materially improve stability under class imbalance [20]. Schroetter et al., in their comparison between neural network based IDS and signature based IDS, further show that the benefit of learning based approaches should be evaluated against realistic traditional baselines rather than assumed by default [21]. In a more deployment oriented direction, Ashraf et al. build an INIDS pipeline over BoT-IoT and compare multiple classifiers to emphasize the role of classifier selection in realistic settings [3]. These results collectively show that IDS performance depends simultaneously on input quality, evaluation protocol, and the learning algorithm, not merely on model architecture. Recent optimization driven IoT IDS work also illustrates the continued emphasis on improving clean detection pipelines. For example, the Decisive Red Fox optimization and descriptive back propagated radial basis function framework reports an optimized IoT IDS design for attack classification [22].
Since 2024, the deep learning literature has expanded rapidly toward richer representation learning. Kim et al. propose a transferable deep learning framework to reduce dataset dependence and improve transferability in IoT IDS [23]. Cui et al. combine residual learning with attention mechanisms to strengthen feature learning and focus on informative traffic signals [24]. Yaras and Dener introduce a hybrid deep learning algorithm, showing that combined architectures remain attractive when attempting to balance accuracy and representational power [25]. Beyond central training, Chaurasia et al. place residual networks into a federated learning framework for industrial Internet of Things (IIoT) [16]. Ali and Al-Sharafi focus on man in the middle (MitM) specific attack mitigation, reflecting a broader movement toward more attack specific and deployment specific IDS design [5]. In another line, Tseng et al. introduce transformer based multiclass intrusion detection on CIC-IoT-2023, showing that the field has clearly shifted from manual feature engineering toward deeper representation learning [26]. These contributions indicate that the main point of debate is no longer whether deep learning should be used, but which representation learning strategy preserves the most useful information for intrusion detection.
Even so, most studies still evaluate performance in an in domain and label rich setting [18,19]. The reported metrics remain largely Accuracy, Precision, Recall, Macro-F1, and area under the curve (AUC) [23,26]. Even many recent deep models still emphasize clean classification performance under controlled conditions [24,25]. Such settings are useful for comparing classification ability, but they are not sufficient to represent the operational value of IDS in real IoT environments, where traffic evolves with usage patterns, communication among devices, and local network conditions. In addition, many approaches still treat each flow or each sample as a relatively independent classification unit, a limitation repeatedly noted in IoT IDS reviews [1,18]. From the perspective of representation, this point also motivates the move toward graph based modeling [8]. Therefore, ML/DL IDS remains indispensable as a foundation, but precisely because of both its strengths and its limitations, the literature naturally raises the next question: if relations among devices and traffic flows carry meaningful security information, is vector based representation still the only reasonable way to model IDS for IoT?
2.2 Graph Based IDS and Graph Neural Networks
The shift toward graph based IDS is driven by the recognition that network traffic is not a set of independent samples, but a system of interactions with source to destination relations, neighborhood context, and communication structure that changes over time. Zhong et al. show that the GNN based intrusion detection literature has evolved around three major axes: graph construction, network design, and deployment [8]. The attraction of this direction lies in the fact that graph learning models relations, context, and communication structure directly, rather than collapsing the data into fixed vectors at the outset. For IoT, this is particularly valuable because many attack traces emerge through repeated interaction patterns or structural shifts in traffic over a time window.
Empirically, graph based IDS has developed through several complementary lines. Caville et al., with Anomal-E, show that edge information and graph topology can support intrusion and anomaly detection even when labels are scarce, opening a path toward self supervised and weakly supervised IDS [9]. Altaf et al. propose a concatenated multigraph neural network and argue that a single graph is not always sufficient to capture the multiple relation types present in IoT communication [10]. Gao et al. exploit attribute graphs and meta path based GNNs for anomaly traffic detection, emphasizing the benefit of combining topology with node attributes [11]. Ngo et al. approach the problem through attribute based graph construction, showing that how the input graph is formed remains a decisive factor in downstream performance [13]. What unifies these studies is their shift of emphasis from choosing a classifier to constructing a data structure that preserves security relevant relational meaning.
Since 2024, this direction has advanced further in both representational depth and scalability. Tran and Park propose FN-GNN to improve graph embeddings for NIDS [27]. Yin et al. address large scale botnet detection through GraphSAINT based subgraph sampling combined with graph isomorphism networks, emphasizing that scalability and computational cost are central if IDS based on GNNs are to move closer to deployment [28]. Le and Park focus on multiclass attack detection through feature rearrangement, showing that even in multiclass settings the organization of input information can remain a performance bottleneck [29]. Deng and Huang propose EMA-IDS, exploiting edge features and multi hop attention to strengthen information aggregation in NIDS [12]. Together, these contributions suggest that graph based IDS is maturing from proof of concept demonstrations toward the optimization of representation quality, efficiency, and multiple attack discrimination.
Yet the strength of graph based IDS also depends heavily on graph construction. In IDS, graphs may be defined in several ways. One line treats hosts as nodes and flows as edges [10]. Another builds attribute graphs or models multiple relation types across features and entities [11,13]. Each graph definition implicitly encodes a different hypothesis about which relations carry security meaning and which signals should be propagated through message passing. This is why Zhong et al. identify graph construction as a central challenge for the field [8]. More recent work by Tran and Park also indirectly supports this observation, because improvements in embedding or feature arrangement generally matter only if the input graph already captures meaningful structure [27,29]. Therefore, graph based IDS should not be understood as merely replacing a multilayer perceptron (MLP) or convolutional neural network (CNN) with a GNN; it is fundamentally a problem of deciding which edges, neighborhoods, and graph building rules model the underlying IoT communication system correctly.
Accordingly, graph based IDS has made substantial progress in modeling relations, but it is not an automatic solution in every context. If the graph is poorly defined or heavily contaminated, message passing can propagate noise rather than useful context. Moreover, computational cost and deployment on large graphs remain recurring challenges [12,28]. At a broader level, model stability under structural shifts is also repeatedly emphasized [8,27]. Because graph based IDS introduces an additional structural representation layer, evaluation must become deeper as well: we must ask not only whether the model is correct, but whether the learned graph is stable and whether the resulting conclusions retain value when conditions deteriorate. This naturally leads to the next thread of literature on adversarial stability and reliability.
2.3 Adversarial Stability and Reliability Evaluation for IoT IDS
An increasingly important research axis concerns how IDS should be evaluated. Many studies still report Accuracy, Precision, Recall, F1, or AUC on clean data as their primary metrics, but the reality of IoT deployment imposes much broader requirements [6,7]. He et al. synthesize evidence that, in NIDS, carefully designed perturbations can severely degrade performance even when the resulting inputs remain within a valid domain [6]. Sharma and Chen similarly show that both white box and black box attacks can substantially affect intrusion detection systems [7]. High clean performance thus only demonstrates that the model learns well in a narrow setting; it does not guarantee defensive value when traffic, adversaries, or local network conditions change.
From this perspective, recent literature has begun to broaden evaluation from pure classification ability to operational trustworthiness. Schroetter et al. show that many ML based IDS papers still fail to compare against realistic signature based baselines, creating a risk of overstating the benefit of learning based methods [21]. This matters because IDS in practice are constrained by resources, false positives, latency, and maintainability. Closer to deployment, Wardana et al. emphasize trust management, privacy preserving collaboration, and lightweight design in collaborative IoT IDS [30]. Although this line is not identical to adversarial resistance in the narrow sense, it reflects a broader shift in evaluation thinking: an IDS is considered trustworthy not only because it is often correct, but because it behaves stably without imposing excessive operational cost.
For graph based IDS, this issue is even more difficult because perturbations can affect not only features but also topology and neighborhood structure. Zhao et al. show that resistance to adversarial perturbation in GNNs is tightly linked to the stability of graph dynamics [14]. Many observations in Zhong et al.’s survey also make this point clearer, as graph construction is treated as a central bottleneck in GNN based intrusion detection [8]. Therefore, evaluating graph based IDS under attack should not stop at attacked accuracy alone; it must also help answer whether the model fails in feature space, in topology, or in the very logic used to construct edges and neighborhoods.
Beyond stability under attack, the reliability of confidence estimates is becoming an equally important evaluation axis. Hsu et al. show that GNNs suffer from graph specific forms of miscalibration, meaning that model confidence should not be treated as an automatic consequence of high accuracy [15]. For IDS, this is a practical concern because a false alert with unjustifiably high confidence can create substantial operational cost. In a more application oriented direction, Alabbadi and Bajaber propose IoT data stream IDS with explainable artificial intelligence (XAI), reflecting how reliability is increasingly connected to interpretability and auditability [31]. The current literature therefore extends evaluation toward calibration, uncertainty quality, and interpretability, rather than concentrating solely on the final classification output [15,31].
Taken together, recent work suggests a broader evaluation framework for IoT IDS. On the attack stability axis, surveys and adversarial studies show that clean score is insufficient to establish defensive value [6,14]. On the reliability axis, miscalibration and XAI literature continue to emphasize the need to evaluate uncertainty and interpretability [15,17]. On the deployment axis, fair benchmarking, trust management, and operational constraints are increasingly treated as part of the problem itself [21,30]. This framing reconnects the two previous literature streams: from ML/DL IDS to graph based IDS, the key question is no longer only which model scores higher, but which one maintains more trustworthy conclusions when the environment degrades. This provides a natural transition to the proposed method, because the current literature needs not only new models, but also design and evaluation strategies that make IDS results more operationally meaningful.
TF-SAGE is organized around four components: the overall processing logic, trust aware graph construction, uncertainty aware representation learning, and the two attack spaces used to evaluate stability under adversarial stress. The design places graph construction before message passing as a component that must itself be controlled, and it incorporates uncertainty into inference to reduce overconfident decisions.
TF-SAGE is designed to prioritize stability under attack, in which graph construction is not treated as fixed preprocessing but as a vulnerable component that can itself be perturbed and should therefore be controlled. The system input is a normalized traffic window; flows inside the window are mapped to nodes, and the relations among these nodes are inferred rather than imposed through a single hard rule.
The pipeline contains three main blocks. First, TF-SAGE builds a candidate graph from pairwise compatibility among flows. Second, the candidate edges are reexamined through perturbation stability and uncertainty signals, so that fragile neighborhoods are weakened before message passing. Finally, GraphSAGE learns representations over the filtered graph and performs repeated stochastic inference to estimate both the predicted label and the confidence of the decision.
The key difference of TF-SAGE is therefore not a more complex backbone, but a control layer placed before information propagation. If graph construction is wrong, noise can spread across many nodes and create overconfident predictions. TF-SAGE reduces this risk by treating edge trust as an intermediate signal linking raw input, graph structure, and output inference. Fig. 1 summarizes the flow from traffic representation to trust filtering, GraphSAGE inference, and calibrated output.
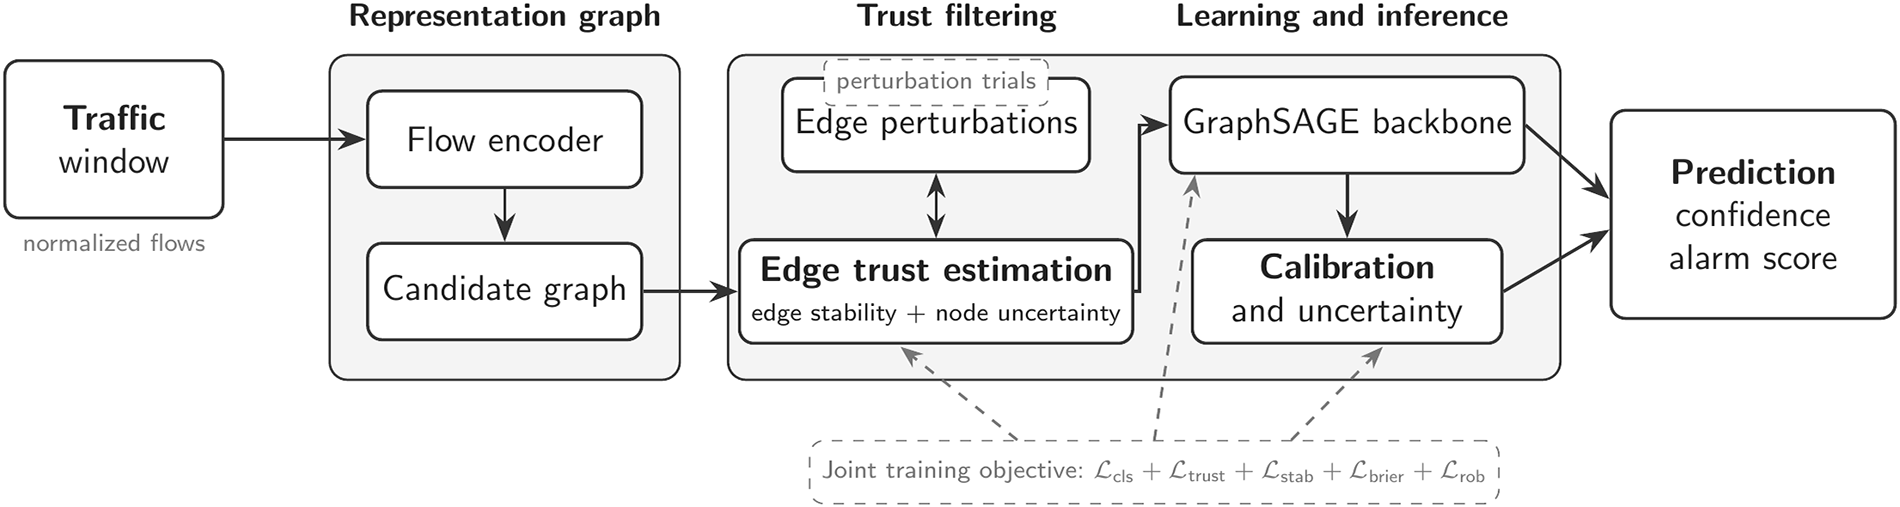
Figure 1: TF-SAGE processing flow.
3.2 Trust Aware Graph Construction for Intrusion Detection
The graph construction block turns a traffic window into a structural hypothesis about relations among flows. For
In (1), each node corresponds to a flow,
Within this latent space, TF-SAGE computes compatibility between two flows by combining representational similarity, temporal context, and relational cues. In the implemented TF-SAGE pipeline,
The score
The candidate graph may still contain fragile edges. TF-SAGE therefore reevaluates each edge by rebuilding the graph under multiple admissible perturbations and measuring how often the edge persists:
Edge filtering is estimated before final prediction from perturbation stability of candidate-edge compatibility scores. Prediction uncertainty is used as an inference-time reliability signal and calibration diagnostic, not as a direct dependency that recomputes the same final graph from its own final prediction. This ordering avoids a circular interpretation: candidate graph construction precedes trust estimation, trust filtering precedes message passing, and stochastic uncertainty is reported after the filtered representation is obtained.
To avoid a circular dependency between the final trust graph and predictions produced by that same graph, pi(y) in (6) is read from a preliminary phase. TF-SAGE first builds the candidate graph Acand through (3)–(5), runs either a warm up pass or uses cached predictions from the previous epoch on this preliminary graph, and then computes unode. Discrete operations such as TopK, the
From perturbation-based persistence, TF-SAGE defines tau(i, j) for each candidate edge and retains edges whose stability exceeds
TF-SAGE then filters edges using a trust threshold and normalizes the adjacency matrix before passing it to GraphSAGE:
These trust scores are used for edge selection and filtering rather than as direct message passing weights; GraphSAGE receives the filtered and normalized graph. The output of this block is the normalized trust graph Anorm, in which fragile neighborhoods have already been weakened before representation learning begins. Fig. 2 illustrates the transition from latent nodes to a candidate graph and then to a trust filtered graph.
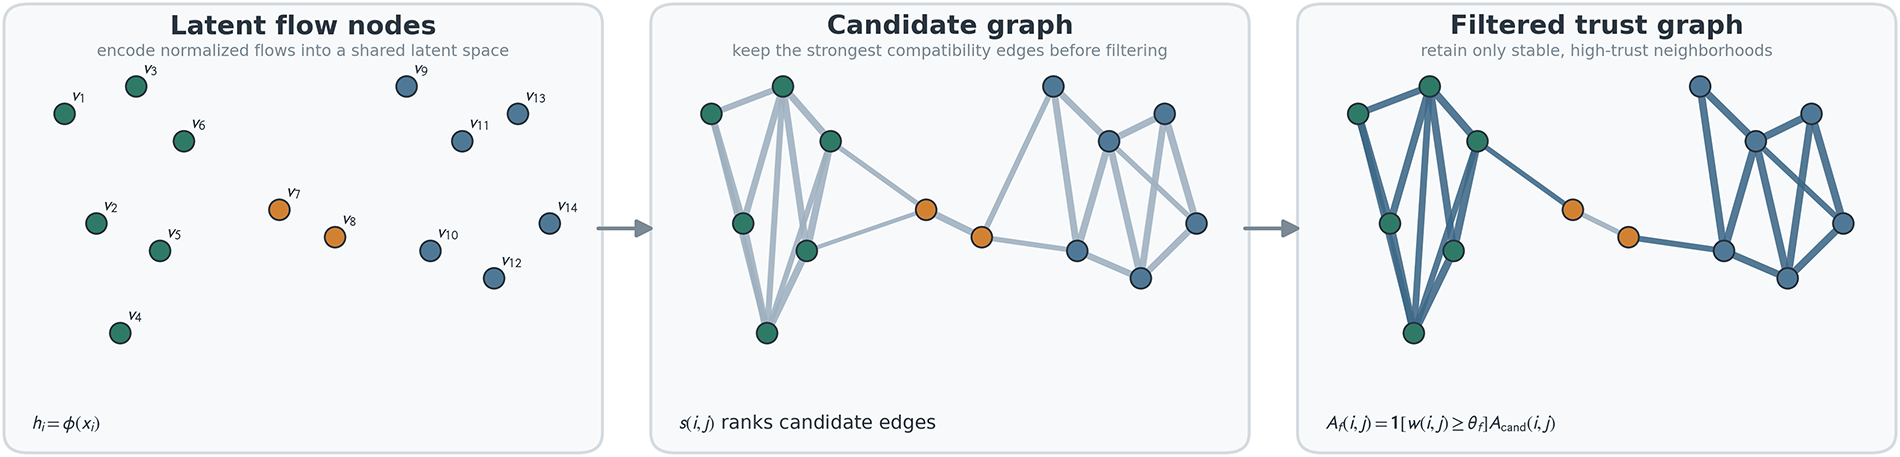
Figure 2: Trust graph construction in TF-SAGE.
3.3 Representation Learning and Uncertainty Aware Inference
Once the trust graph is obtained, TF-SAGE learns node representations by applying GraphSAGE over the filtered structure. At each layer, neighborhood signals are aggregated only through
The node state is then updated from both self information and trust filtered neighborhood information:
This separation is important in IDS because a flow should not be classified entirely based on edges that may themselves be manipulated.
To reduce overconfident predictions, TF-SAGE does not rely on a single forward pass. Instead, it generates
From the averaged distribution, the predicted label and base confidence are defined as:
Two types of uncertainty are estimated from predictive entropy and disagreement across stochastic forward passes:
In (13),
Fig. 3 illustrates the process from the trust graph, through stochastic GraphSAGE inference, to the averaged predictive distribution and uncertainty signals.
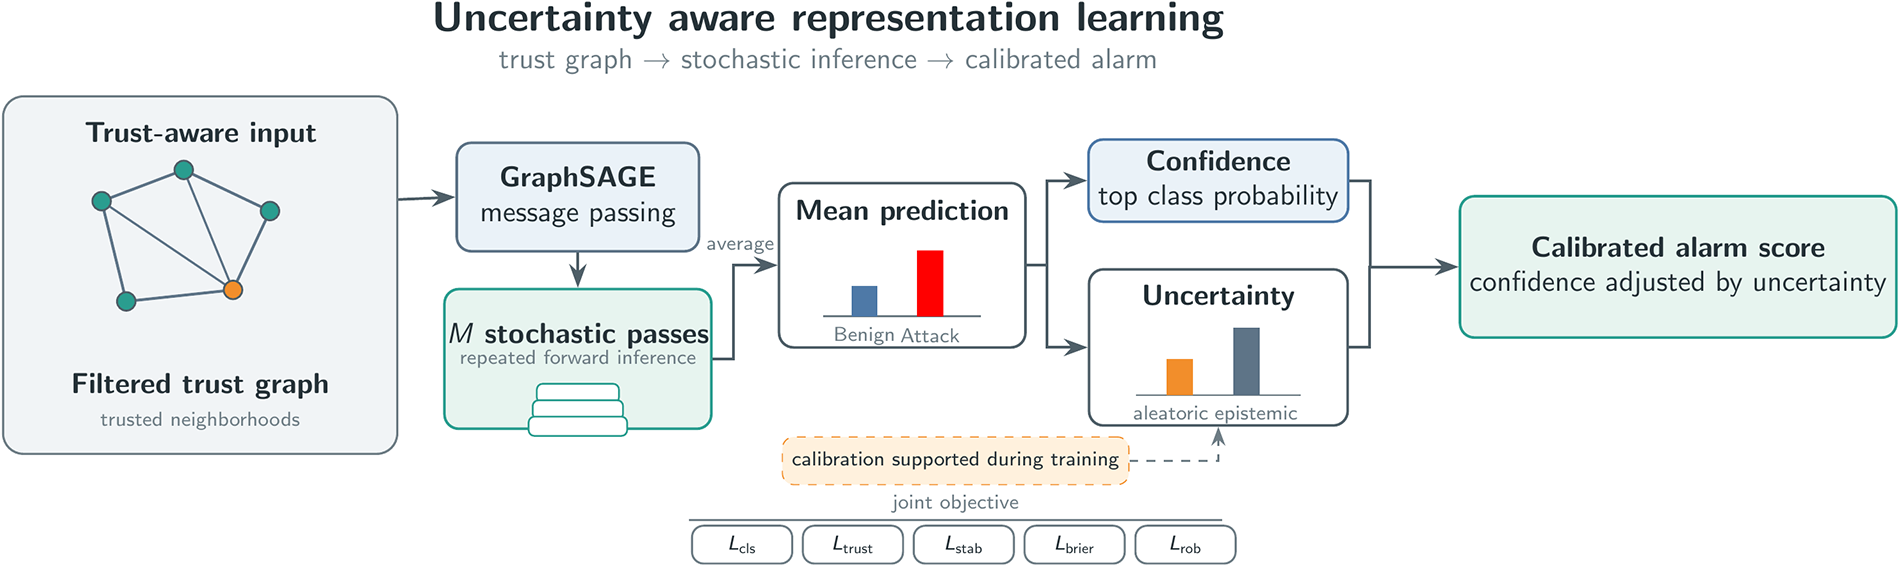
Figure 3: Stochastic inference and alarm calibration.
During training, TF-SAGE optimizes classification, trust consistency, local stability, calibration, and adversarial loss within a single objective:
In (15), Lcls is cross entropy on labeled clean samples and on admissible adversarial views when they are included in the mini batch. Ltrust penalizes inconsistency between candidate edge persistence and the edge selection scores retained after filtering, while Lstab limits prediction distribution drift between clean and perturbed views. Lbrier is the Brier score on predictive probabilities for calibration, and Lrob is the classification loss on FSAA or GSAA views generated during training. Gradients are used for the differentiable encoder, GraphSAGE, and classifier branches; TopK, thresholding, and edge selection are kept as stop gradient control operations.
To interpret behavior under attack consistently, this study separates two attack spaces at a conceptual level. Feature Space Adversarial Attack (FSAA) operates on the feature vector of each flow, whereas Graph Space Adversarial Attack (GSAA) operates on edges and neighborhoods that govern information propagation in the graph model. These are not implementation details of TF-SAGE itself, but complementary stress tests for two different forms of brittleness in IDS.
FSAA asks whether the model depends too strongly on fragile decision boundaries in feature space. GSAA asks whether graph construction and message passing remain stable when the neighborhood structure is manipulated. The following definitions therefore focus on the three elements required by the evaluation protocol: the perturbation domain, the attack objective, and the attack success rate (ASR).
3.4.1 Feature Space Adversarial Attack
Feature Space Adversarial Attack (FSAA) represents a family of attacks that act directly in the feature space of network flows. The purpose of FSAA is to generate admissible perturbations on the input representation so that malicious samples become more difficult to distinguish from benign behavior while remaining inside the valid data domain. FSAA therefore primarily tests the stability of models that depend strongly on decision boundaries in feature space.
For a flow
The FSAA perturbation domain is restricted by the budget and valid bounds of the chosen features:
In (16) and (17),
Attack success is measured as the fraction of true attack samples pushed into the benign decision region:
FSAA acts in feature space and does not directly edit graph edges. If the graph is reconstructed from perturbed features, structural effects may arise indirectly, but the attacker’s original manipulation space remains
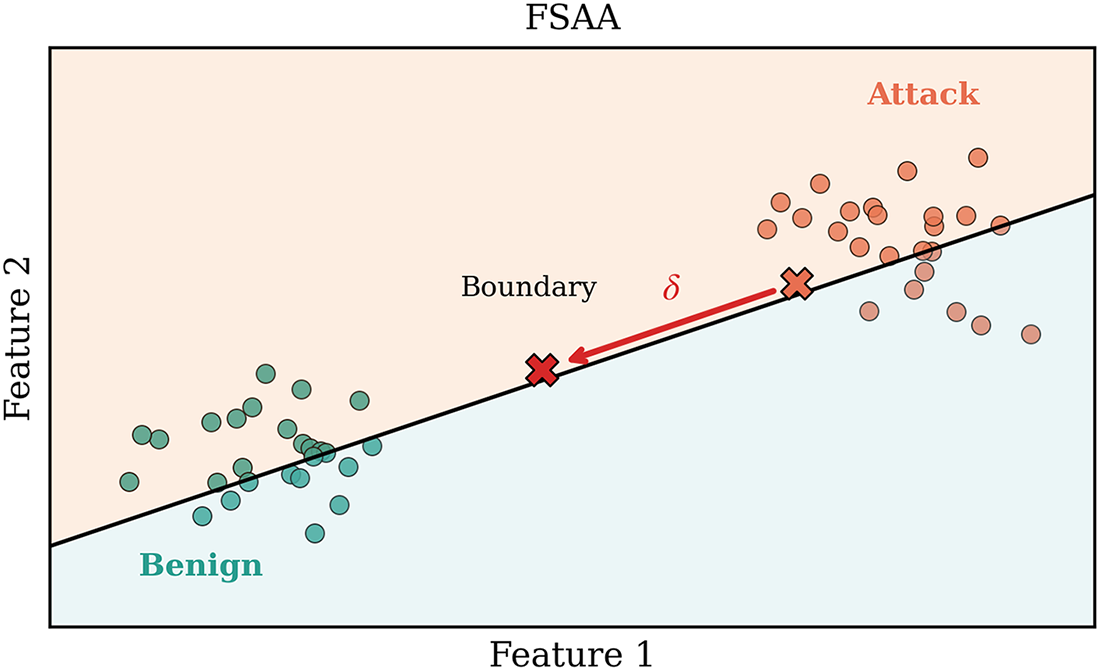
Figure 4: FSAA in feature space.
3.4.2 Graph Space Adversarial Attack
Graph Space Adversarial Attack (GSAA) represents a family of attacks that operate in the structural space used by the graph model for information propagation. Rather than perturbing each feature vector in isolation, GSAA targets the signals that influence edges, neighborhoods, and the relational dependencies inferred during graph construction. GSAA therefore directly tests the central hypothesis of TF-SAGE: graph construction itself is an attack surface that must be controlled before message passing takes place.
Unlike FSAA, GSAA modifies graph structure directly. With an edge edit matrix
The feasible domain of GSAA is restricted by a normalized graph-space budget
In these equations,
The attacker chooses edge edits that increase classification loss or reduce the probability of recognizing attack samples:
GSAA is particularly important for graph based IDS because a single misleading edge may influence many nodes through message passing. In addition to ASR, GSAA results are interpreted together with mechanism oriented signals such as neighborhood overlap, trusted neighbor recovery, and trust drop in order to determine which parts of the neighborhood are broken or restored after trust filtering. Fig. 5 illustrates this process through the insertion of misleading edges, the removal of stable relations, and the retention of more plausible connections after filtering. Given a clean candidate graph, node features, labels, a normalized graph-space budget
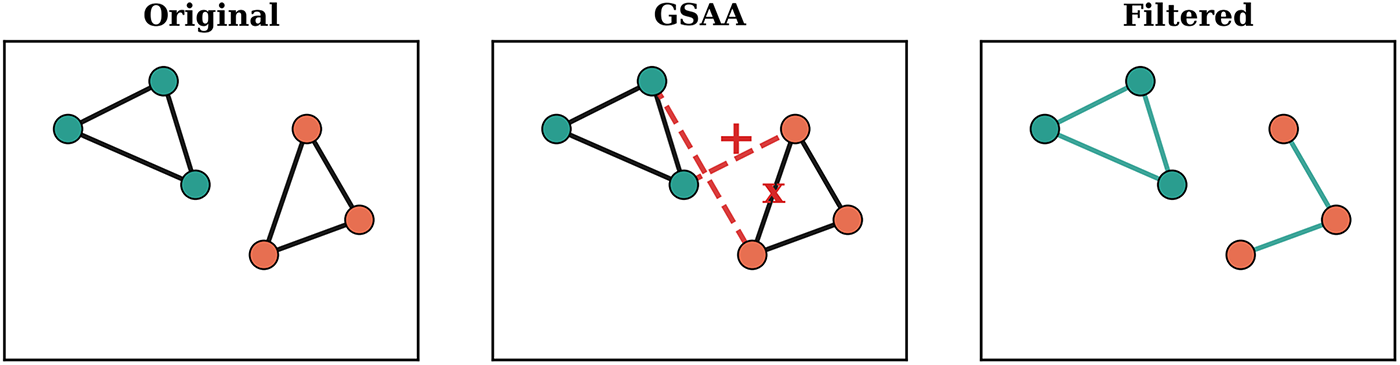
Figure 5: GSAA in graph space.
3.5 Algorithmic Specification of TF-SAGE
Once graph construction, representation learning, and the attack spaces have been defined, TF-SAGE can be specified algorithmically. The purpose of this presentation is to clarify execution order, define the inputs and outputs of each block, and separate methodological logic from experiment specific settings. By design, TF-SAGE is not organized as a deeper or more complicated GNN, but as a structural control pipeline: build a candidate graph, test edge stability, filter fragile neighborhoods, and only then perform representation learning and uncertainty aware inference.
Algorithm 1 specifies trust graph construction. It takes a normalized traffic window, produces latent embeddings, scores pairwise relations among flows, selects candidate neighbors, and then reevaluates these edges under a family of admissible perturbations. Node uncertainty is obtained from warm up predictions or cached predictions from the previous epoch, so trust estimation is not circularly dependent on the final filtered graph in the same update. The output is the normalized adjacency
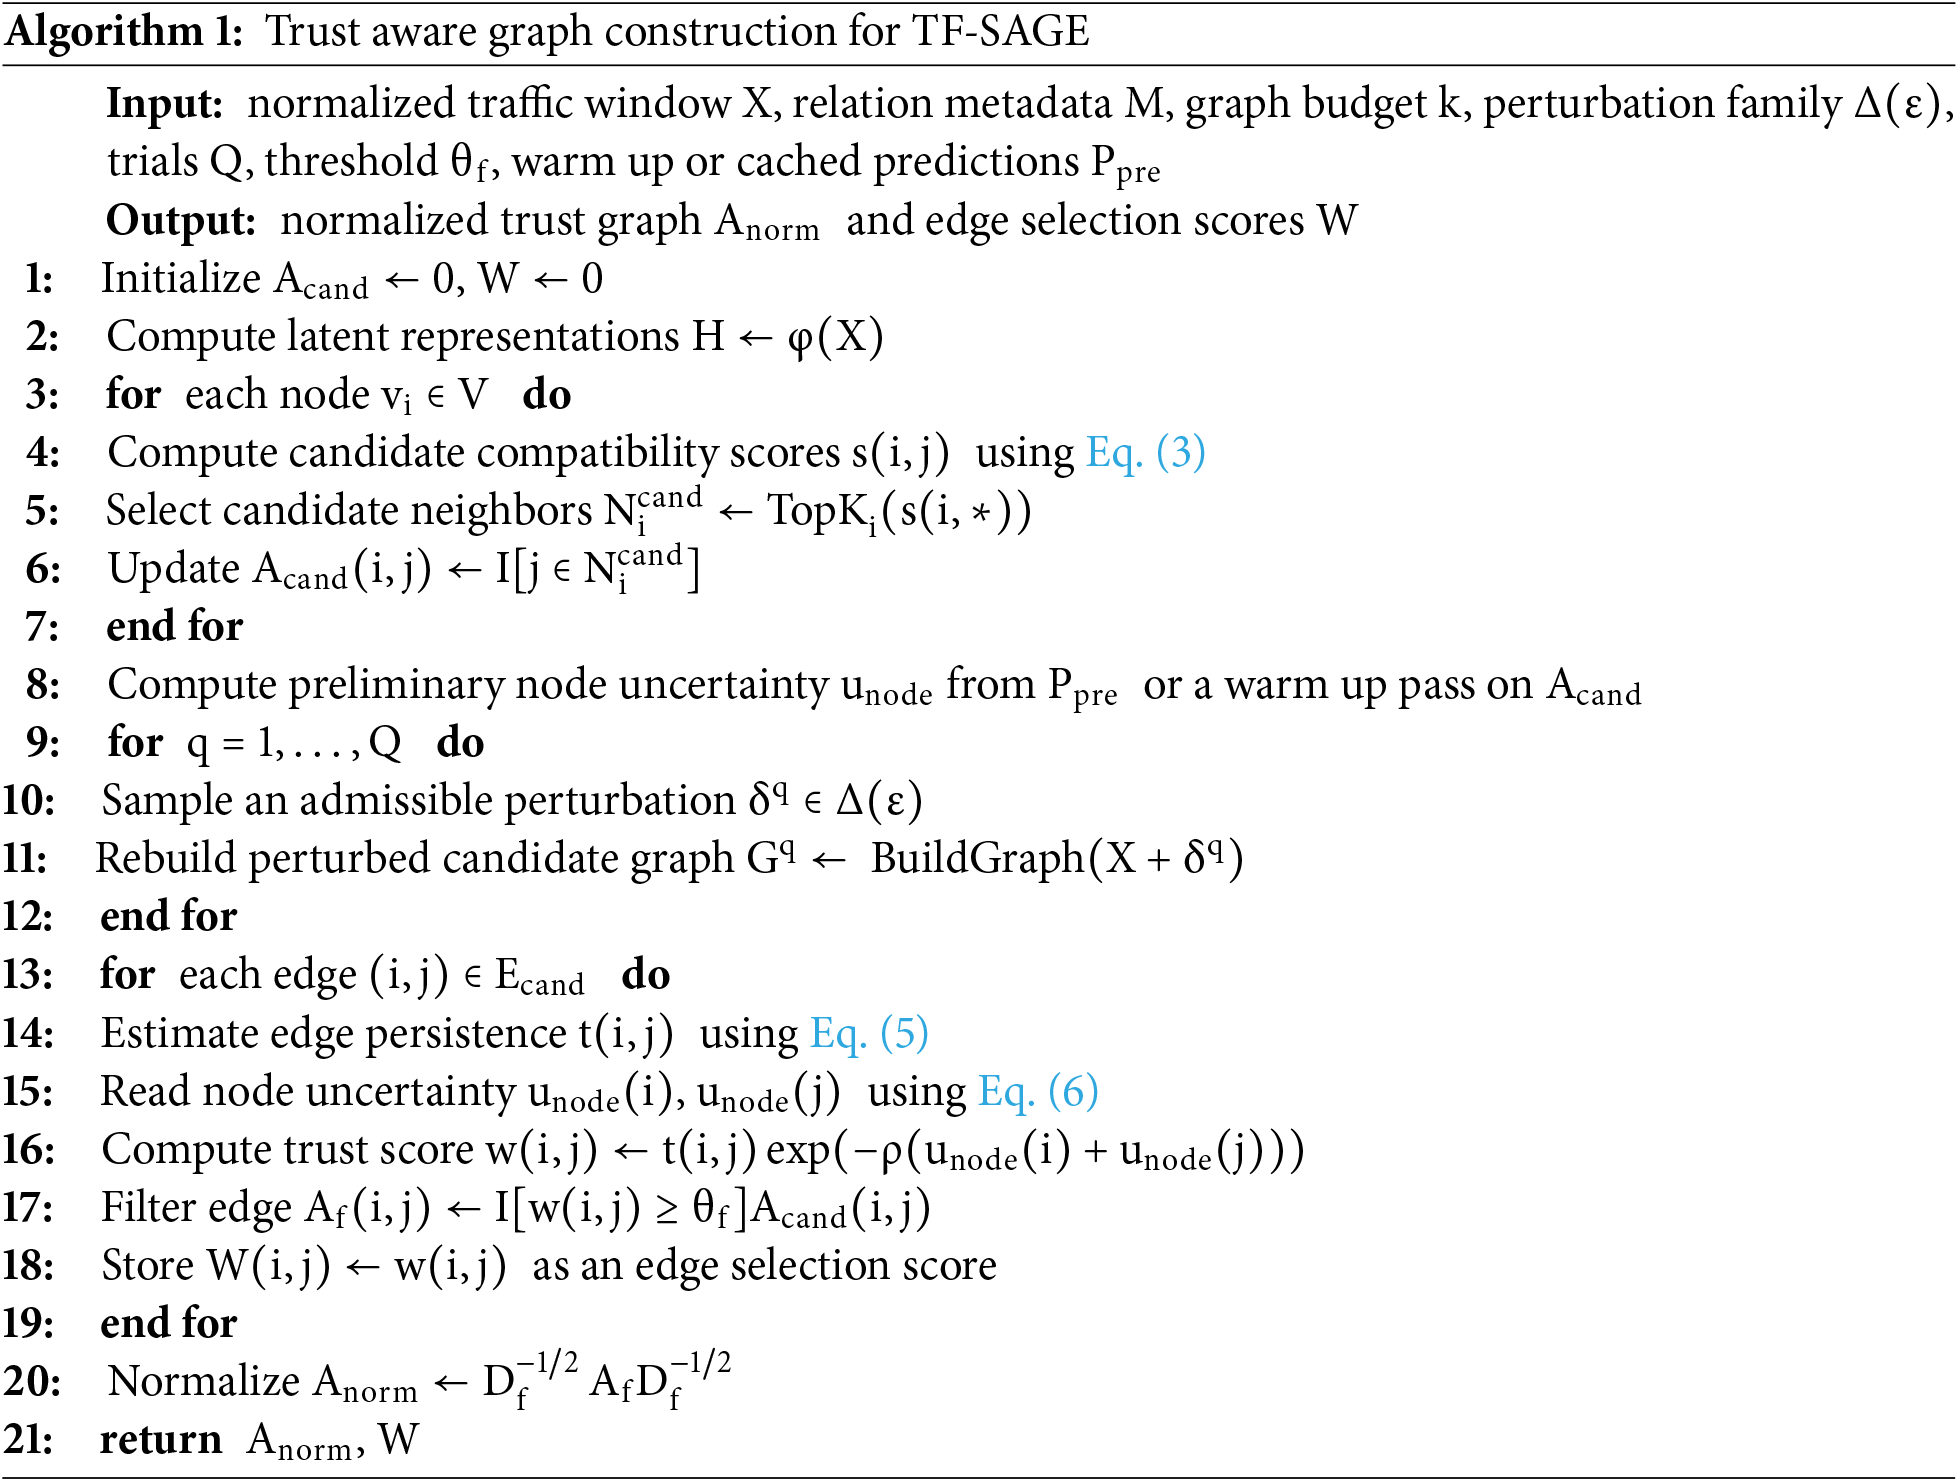
The key point of Algorithm 1 is that edge filtering happens before message passing. If an edge appears only because of local noise or random compatibility in latent space, it can be removed before it influences node representations. This reduces the risk that GraphSAGE becomes a mechanism for amplifying noise. In other words, the trust graph is not merely a variation of a kNN graph; it is a structural validation layer that decides which relations are stable enough to be admitted into representation learning.
Algorithm 2 describes the training and inference stage. It uses
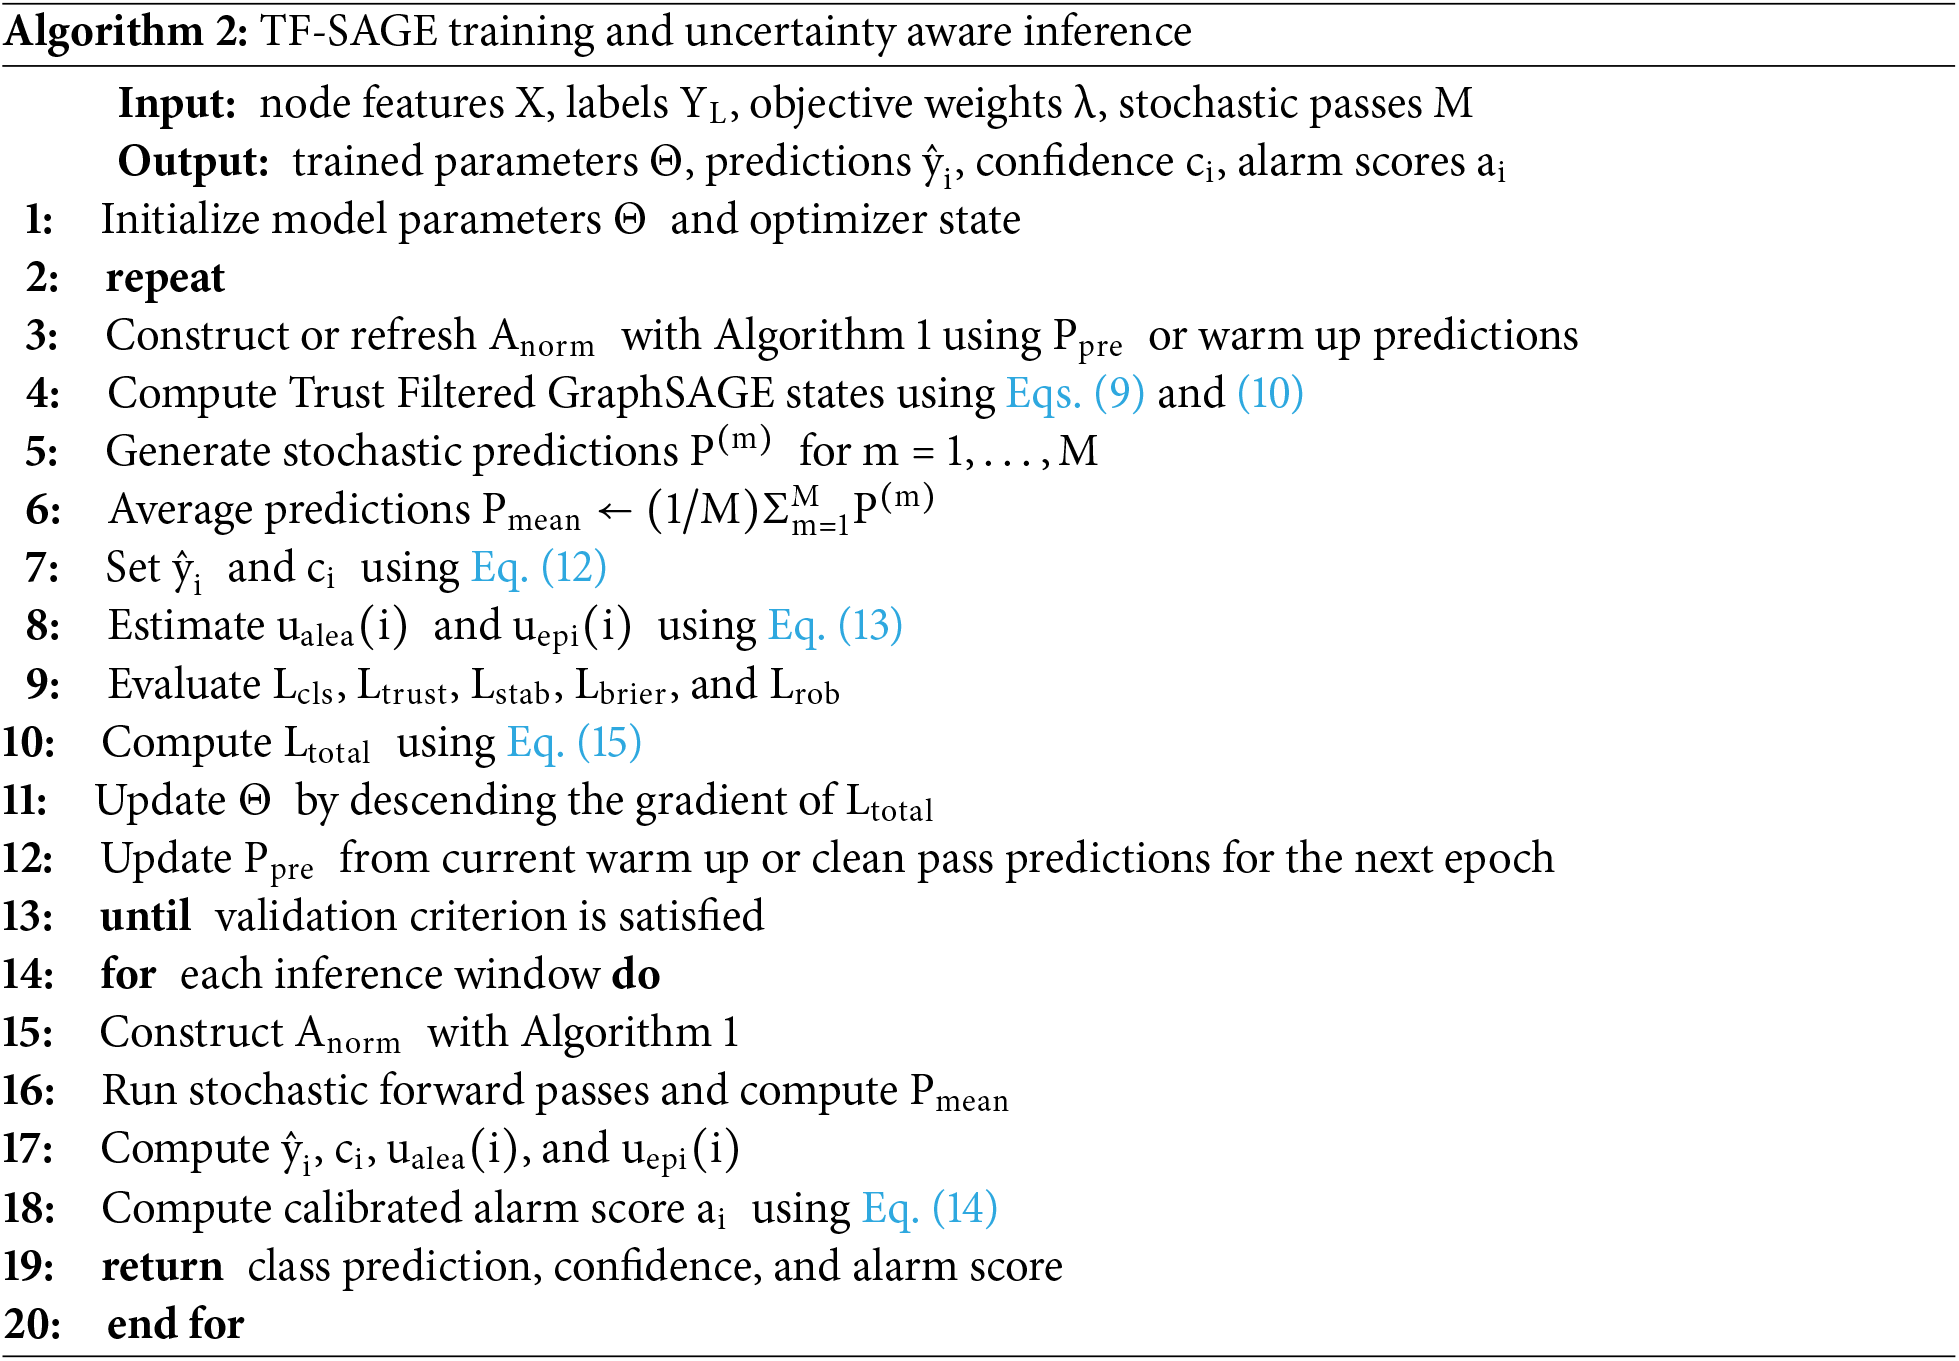
The two algorithms reveal two design anchors of TF-SAGE. The first is that graph construction is controlled before representation learning begins. This is consistent with the fact that, in IDS based on GNNs, the graph is not raw data but a structural hypothesis inferred from network flows. If this hypothesis is wrong, message passing may propagate incorrect relations and generate overconfident predictions. TF-SAGE therefore places trust filtering before the backbone instead of only adding regularization at the end.
The second design anchor is the separation between confidence and uncertainty. Confidence describes the largest predictive probability, whereas uncertainty reflects either class ambiguity or disagreement across stochastic inferences. In IDS, these two quantities should not be conflated. A prediction with high confidence but also high uncertainty is less trustworthy than one that is both confident and stable across repeated inference. The alarm score in (14) directly encodes this principle.
This design also makes mechanism evaluation possible at the component level. Trust filtering is reflected in neighborhood recovery, uncertainty aware inference is reflected in calibration, and the overall effect of the training objective is reflected in attacked Macro-F1 and ASR. As a result, the experimental results do not stop at score comparison; they connect improved outcomes to structural mechanism and model reliability.
The algorithmic specification is intentionally separated from concrete settings such as neighborhood size, the number of perturbation trials, or the number of stochastic forward passes. This separation keeps the method reusable, while specific execution conditions are defined by the evaluation protocol.
4 Threat Model and Evaluation Protocol
The threat model reflects how graph based IDS can be weakened in operation. The adversary does not need to alter the semantic label of a network flow; instead, it introduces admissible perturbations into the input representation or distorts the structural relations used by the model for information propagation. This assumption is well aligned with IoT settings, where even a small shift in traffic features or neighborhood relations may make malicious activity appear more benign.
The two attack surfaces are used to probe two different forms of model dependence. FSAA tests stability when the feature vector is purposefully perturbed, thereby applying direct pressure to the decision boundary in feature space. GSAA tests stability when neighborhood structure is edited, thereby evaluating whether message passing amplifies misleading relations. For TF-SAGE, the point to prove is not only that the model performs well on clean data, but that trust aware graph construction and uncertainty aware inference reduce degradation when both attack surfaces are activated.
The evaluation protocol places behavior under attack at the center. Clean performance confirms the baseline classification ability, whereas behavior under FSAA and GSAA determines the defensive value of the model. The empirical evidence is organized around three axes: comparison against appropriate baselines, degradation trends under larger attack budgets, and mechanism oriented signals from calibration and neighborhood recovery.
4.1 Benchmark, Baselines, and Experimental Configuration
NF-ToN-IoT-v2 is used as the main benchmark because it is the NetFlow v2 variant of ToN-IoT with 43 extended NetFlow features, developed within the standardized NIDS feature framework of Sarhan et al. (2022) [32]. In this study, the data are converted into a binary flow level representation, metadata fields such as IP addresses and labels are removed from model input, and 40 numerical features are retained for graph construction and classification. The evaluation set is stratified with seed 42 and contains 2.118M flows after combining train, validation, and test splits; the attack ratio remains approximately 64.0% across all three splits. This scale provides a sufficiently strong anchor for evaluation under attack while preserving reproducibility across attack settings.
CICIIoT2025 serves as a confirmation benchmark [33]. It is organized from two source families, attack_data and benign_data, and then standardized into the same binary benign/attack target used throughout this study. The evaluation package used here contains 85,721 flows, split into 60,004 training samples, 12,858 validation samples, and 12,859 test samples; the attack rate is held at 41.57% in each split. Although smaller, this benchmark has a different distribution and is therefore useful for checking whether the degradation trend persists beyond NF-ToN-IoT-v2.
Fig. 6 summarizes dataset structure through two side by side charts, highlighting the train/validation/test flow volume and the benign/attack composition of each benchmark. The remaining configuration choices are condensed into Table 1 to keep the protocol concise and auditable.
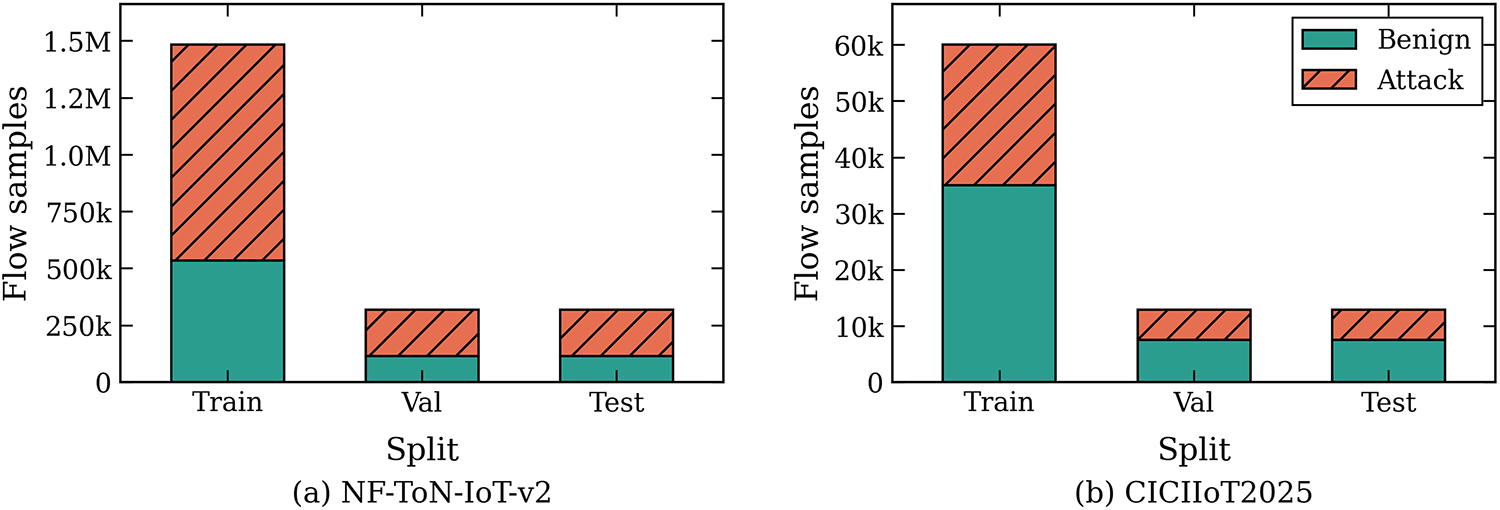
Figure 6: Benchmark scale and class composition.
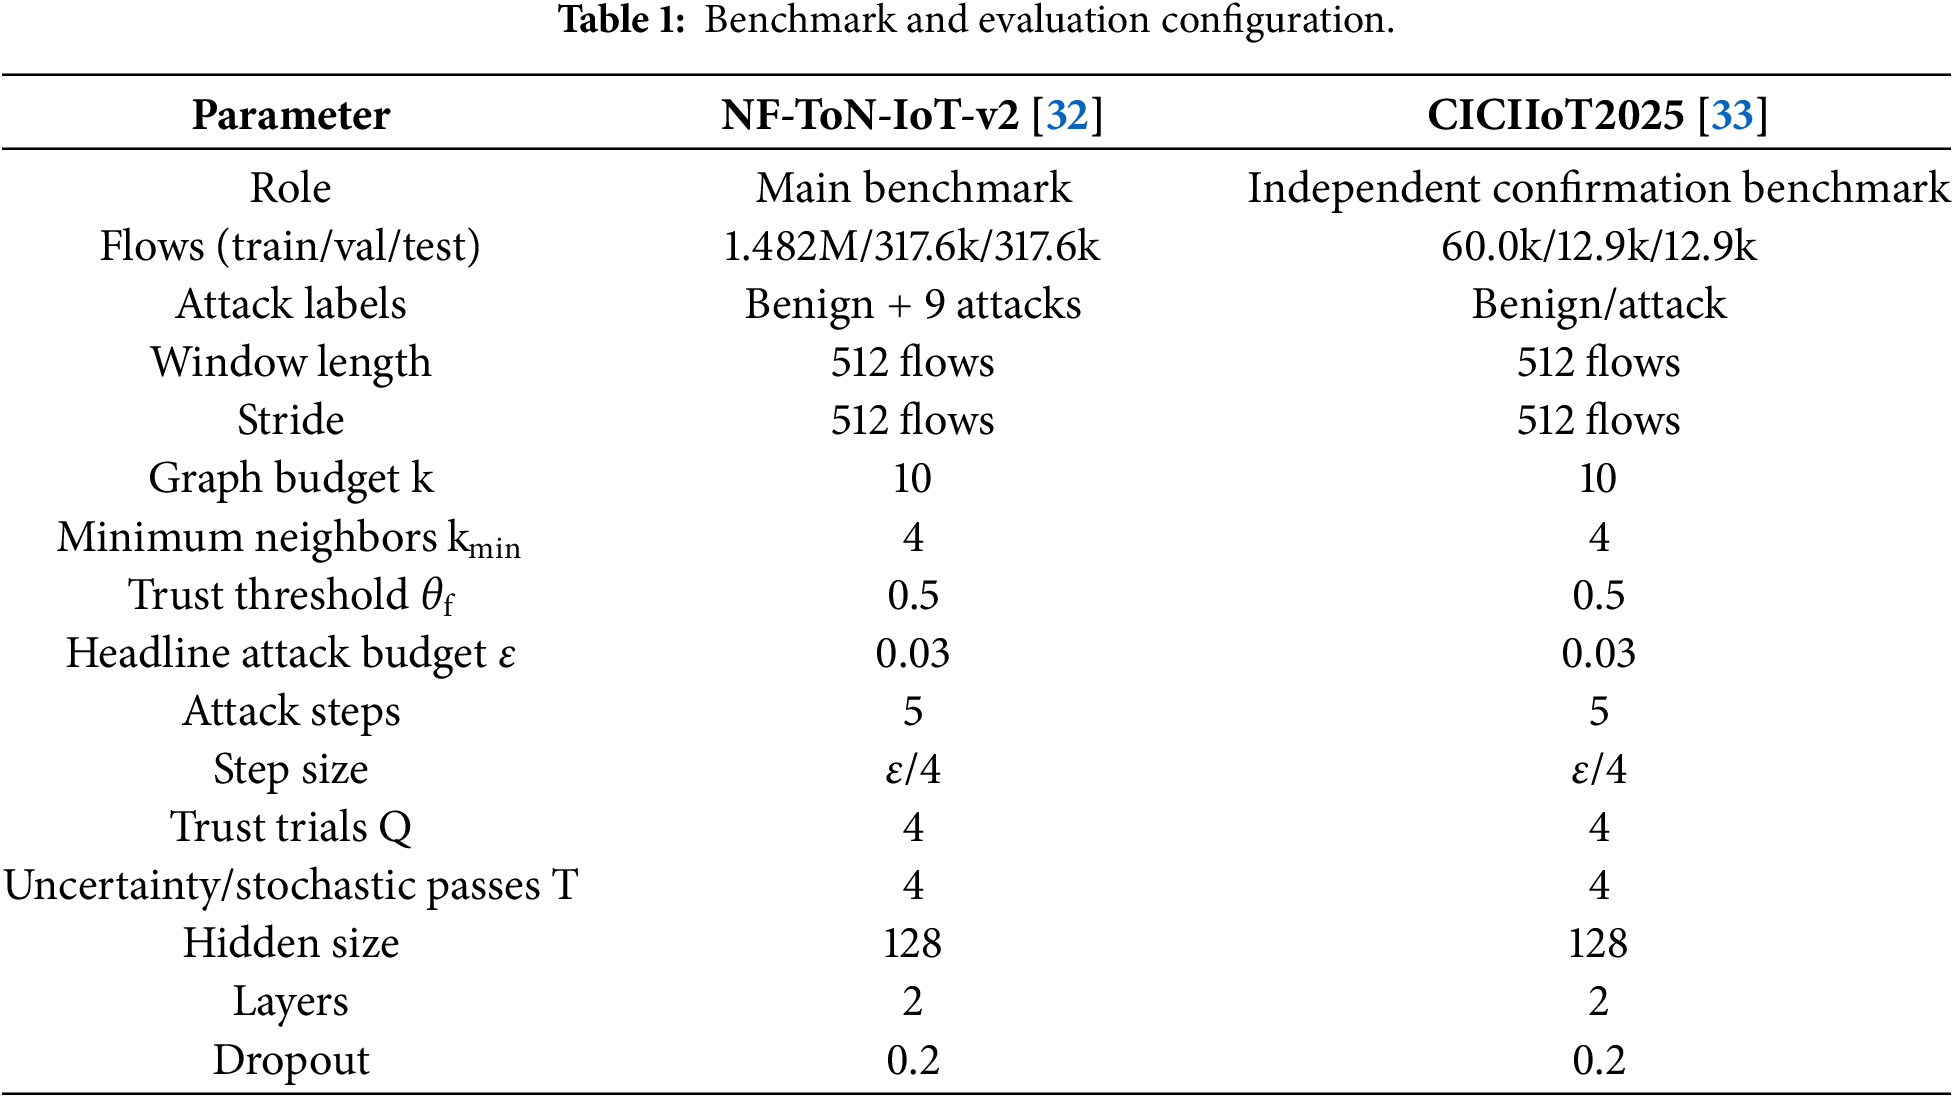
The comparison models are organized into two families to reflect the different ways in which they consume input data. The tabular family includes Logistic Regression (LR), multilayer perceptron (MLP), and Random Forest (RF), all of which remain common in recent IoT IDS evaluations, notably in Ashraf et al. (2025) [3]. XGBoost is included from the interpretable XGBoost based IoT NIDS line of Hu et al. (2026) [34], while LightGBM represents the gradient boosting and feature selection direction of Chen et al. (2024) [35]. Because these models operate directly on flow level feature vectors, FSAA is the appropriate test for their decision boundary stability in feature space.
The graph baseline family includes graph convolutional network (GCN), GraphSAGE, and graph attention network (GAT). Retaining these backbones is consistent with recent IDS based on GNNs trends summarized by Zhong et al. (2024) [8], while also staying close to newer applied variants such as FN-GNN by Tran and Park (2024) [27], Deep GraphSAGE enhancements by Saidane et al. (2025) [36], BS-GAT by Wang et al. (2025) [37], and GAT based IoT IDS by Ahanger et al. (2025) [38]. Because this family depends on neighborhood structure, GSAA is used to test its sensitivity to structural perturbation.
Experimental settings are kept separate from the methodological definition. The runs were executed on a workstation with an NVIDIA RTX 3060 graphics processing unit (GPU); this detail is reported only as minimal reproducibility context and is not used as a comparison variable. Table 1 retains only benchmark information and the main numerical configuration parameters of the pipeline, including window size, stride, k, kmin, the threshold
The main values
For the attack protocol, the budget sweep uses nine ε values from 0 to 0.03. FSAA perturbs only numeric perturbable features and projects the perturbed samples back to valid feature bounds. During FSAA, the candidate edge set is kept fixed, while TF-SAGE recomputes trust filtering from the perturbed features; no direct edge editing is applied. For GSAA, structural edits are applied before trust filtering and message passing, so the attack tests whether the trust filtering stage can suppress unstable or misleading edges before aggregation.
4.2 Reported Metrics and Interpretation Principles
The reported metrics serve two goals: measuring classification quality and measuring degradation under attack. On clean data, Accuracy, Macro-F1, area under the receiver operating characteristic curve (AUROC), and false positive rate (FPR) describe benign/attack discrimination under nominal conditions. Among them, Macro-F1 is prioritized over Accuracy because both benchmarks are class imbalanced and missed attacks carry a more substantial operational cost than a small change in overall correct rate.
For each class
Recall measures the fraction of true samples from class
F1 balances these two quantities, while Macro-F1 averages class wise F1 to reduce the influence of class imbalance:
Under FSAA and GSAA, the same Macro-F1 computation is applied to adversarial samples in order to obtain attacked Macro-F1. Attack success rate (ASR) directly measures the fraction of true attacks pushed into the benign decision region and is therefore the central defensive metric:
FPR is used to track false alarms on benign traffic:
Expected calibration error (ECE) evaluates whether predictive probabilities match empirical correctness. With
AUROC is treated as a supporting metric because it reflects ranking quality across thresholds, but attacked Macro-F1 and ASR determine the main conclusion under attack. A model may have strong AUROC while still being unsuitable if ASR remains high under attack, or if FPR rises sharply when the decision threshold is deployed in practice.
Calibration, neighborhood overlap, trust drop, and adversarial retention add a mechanism oriented layer to the classification metrics. If attacked Macro-F1 improves but the filtered neighborhood remains unstable, the trust filtering argument would still be weak. Conversely, when lower degradation under attack is accompanied by better calibration and stronger neighborhood recovery, the result becomes more mechanically grounded.
5.1 Clean Detection Performance
Table 2 reports clean in domain performance on NF-ToN-IoT-v2 for all baselines used in the later sections. All models achieve strong nominal classification quality, but the ordering reveals different nominal advantages across tabular and graph based classifiers. In the tabular family, XGBoost, LightGBM, and RF reach Macro-F1 values of 0.9948, 0.9968, and 0.9968, respectively, reflecting their ability to exploit clear decision boundaries in normalized flow level data. MLP also maintains high Recall (0.9889), but its FPR of 0.0616 suggests a noticeably higher false alarm cost.
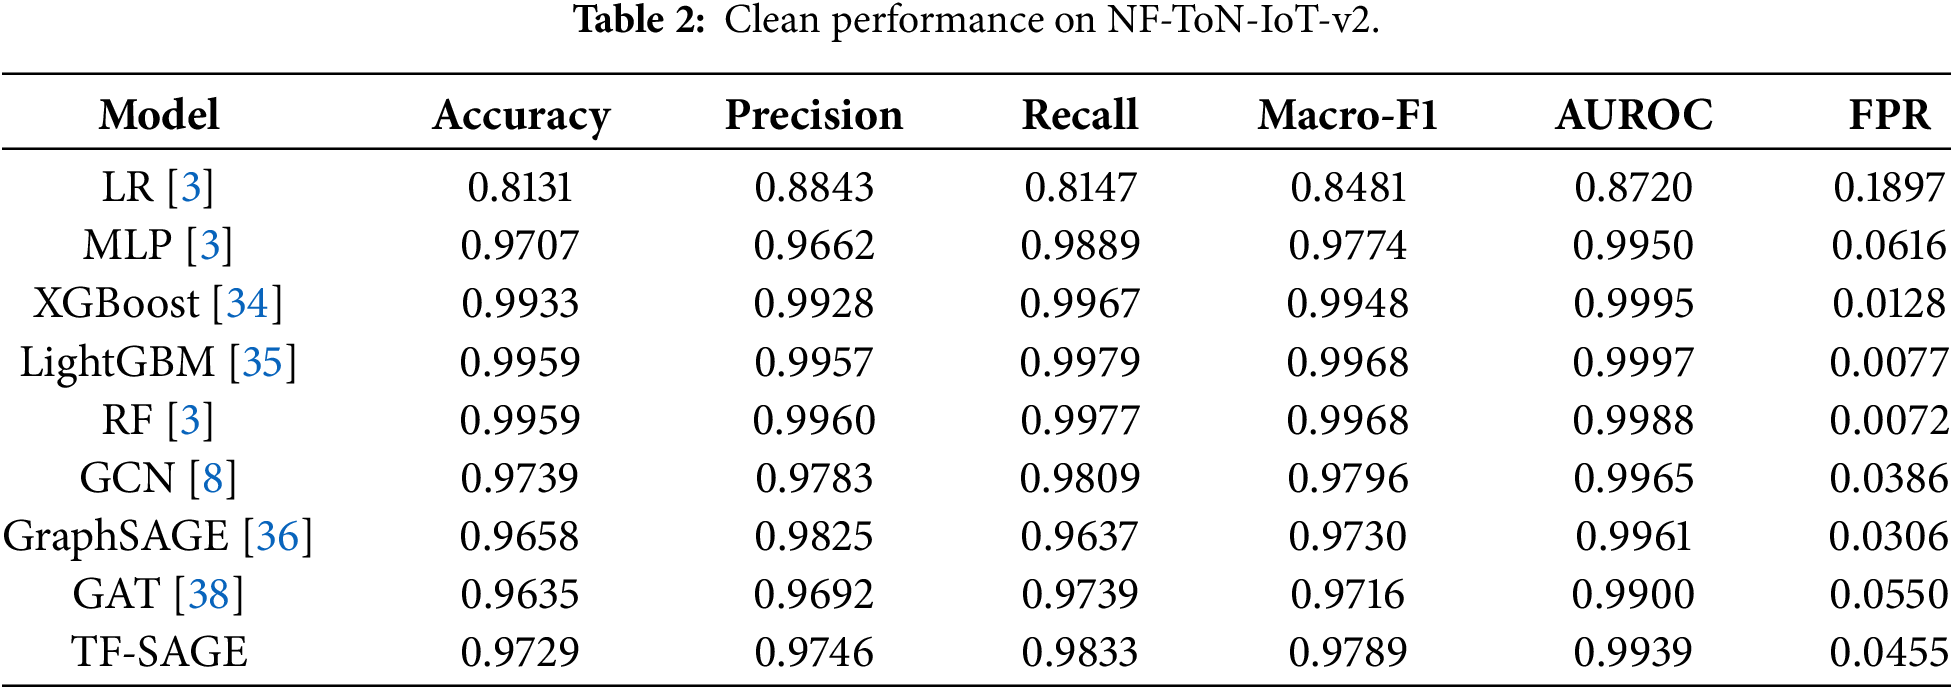
Within the graph based group, GCN reaches Macro-F1 0.9796, TF-SAGE reaches 0.9789, GraphSAGE reaches 0.9730, and GAT reaches 0.9716. TF-SAGE does not outperform the strongest clean baselines, yet it remains competitive even after adding trust filtering and uncertainty aware inference. Its AUROC of 0.9939 indicates sufficiently strong ranking quality, while its FPR of 0.0455 marks a tradeoff that would matter in operational environments sensitive to false alarms.
These results place TF-SAGE in a reasonable position: the model is not designed to maximize clean score alone, but its clean classification base is strong enough for the gaps under FSAA and GSAA to be interpreted as changes in stability and reliability rather than artifacts of weak clean performance.
The three slices in Fig. 7 clarify the structure of the clean results for a representative subset of models: Accuracy, Macro-F1, and receiver operating characteristic (ROC). The first two panels keep a shared scale so that small nominal differences are not exaggerated, while the ROC panel adds a zoomed inset over the low FPR, high true positive rate (TPR) region because all curves are already concentrated near the upper left corner. Table 2 remains the full coverage source when all baselines need to be compared.
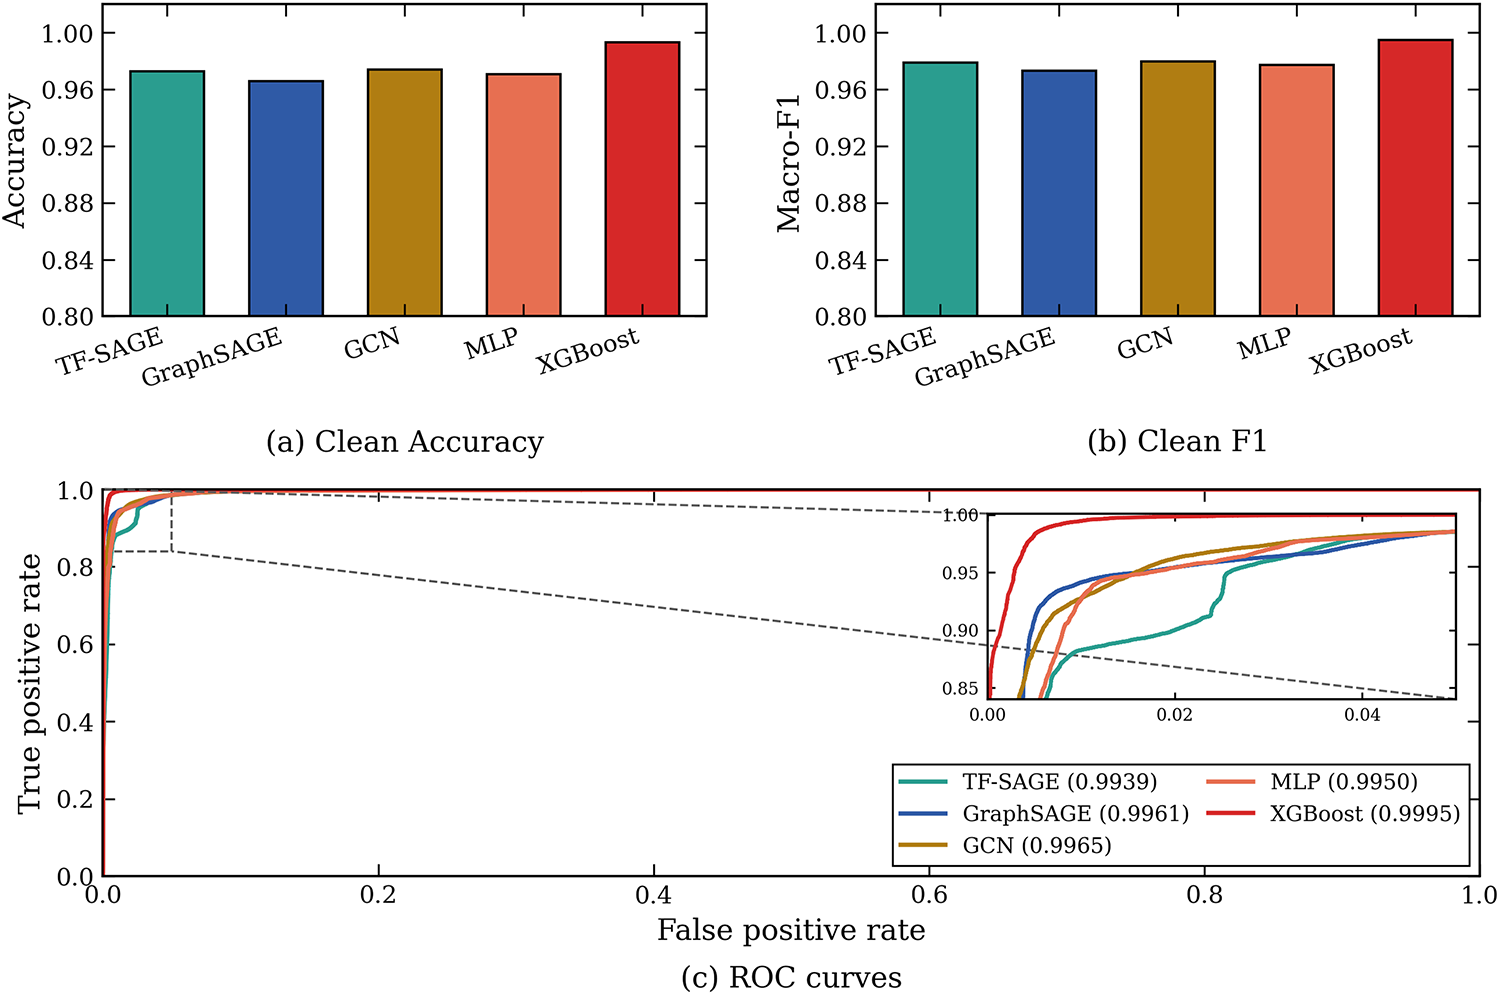
Figure 7: Clean performance on NF-ToN-IoT-v2.
XGBoost remains the strongest clean reference, while GCN, GraphSAGE, and MLP follow closely on the nominal panels. TF-SAGE does not lead absolutely on clean data, but it still preserves competitive ranking quality in the ROC panel. This clean starting point is strong enough for the later gaps under attack to be interpreted as adversarial stability and reliability evidence rather than as artifacts of a weak nominal baseline.
5.2 Stability under FSAA and GSAA
FSAA and GSAA examine two different adversarial surfaces of graph based IDS. FSAA acts directly in feature space, where decision boundaries may be shifted by small but purposeful perturbations. GSAA acts in graph space, where edge insertions and removals can alter neighborhoods and propagate misleading signals through message passing. The two scenarios are therefore complementary: FSAA measures stability under feature manipulation, whereas GSAA measures stability of the model’s structural dependence.
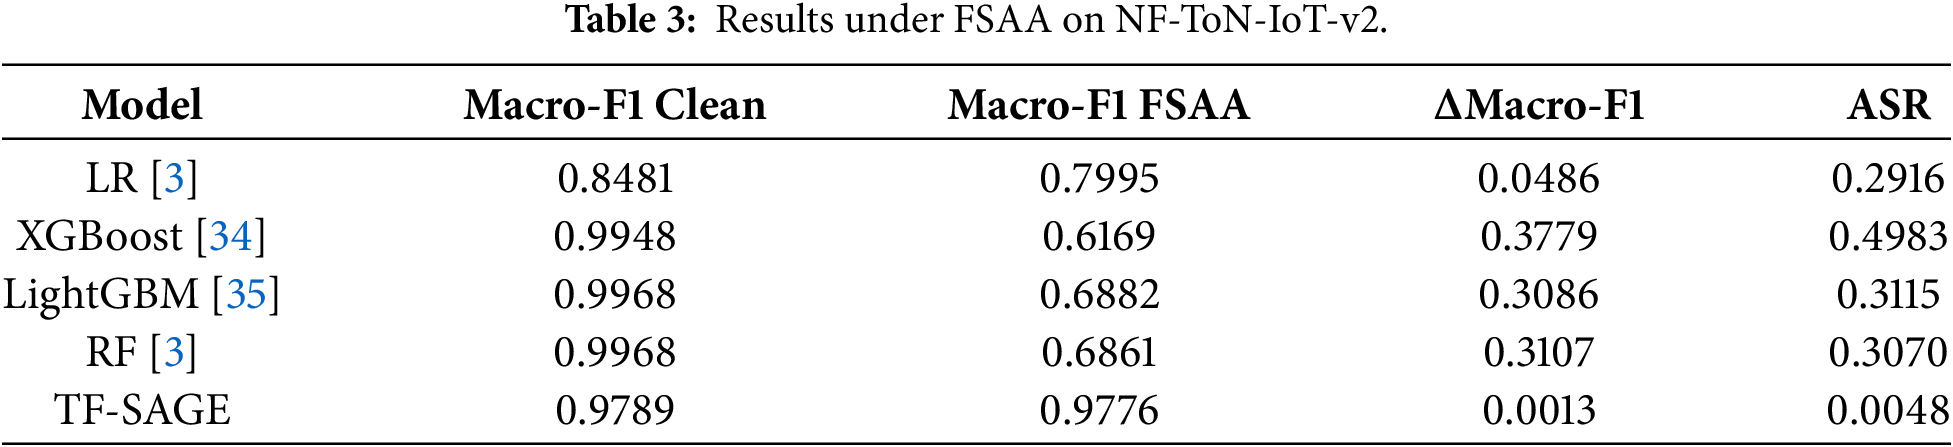
On NF-ToN-IoT-v2, TF-SAGE preserves Macro-F1 0.9776 under FSAA with ASR 0.0048, a decrease of only 0.0013 from its clean Macro-F1 of 0.9789. This mild degradation contrasts sharply with the tabular models that are otherwise very strong on clean data. XGBoost drops from Macro-F1 0.9948 to 0.6169 with ASR 0.4983; LightGBM and RF drop from clean Macro-F1 0.9968 to 0.6882 and 0.6861, with ASR 0.3115 and 0.3070, respectively. LR starts from a lower clean Macro-F1 (0.8481) but still yields ASR 0.2916, indicating that a considerable fraction of attack samples can be pushed into the benign decision region. Clean nominal advantage therefore does not translate automatically into resistance to degradation when features are adversarially perturbed.
These FSAA results should be interpreted in relation to the training setup. TF-SAGE is evaluated as a complete robustness pipeline that includes the robust training term Lrob, whereas the tabular baselines in Table 3 are trained only on clean samples. Therefore, the comparison supports the conclusion that the full TF-SAGE pipeline remains stable under the specified FSAA setting, but it should not be read as evidence that the graph architecture alone accounts for the full performance gap. A natural follow-up control would be an adversarially trained MLP, which would allow the effect of robust training to be compared more directly across model families.
Under GSAA, the contrast shifts to structure dependent behavior. TF-SAGE reaches attacked Macro-F1 0.9048 with ASR 0.0941, whereas GraphSAGE, GCN, and GAT achieve attacked Macro-F1 values of 0.8156, 0.7964, and 0.6992, respectively. This gap shows that a standard GNN backbone does not automatically protect IDS when the neighborhood is manipulated. A single misleading edge may distort many nodes through repeated message passing, whereas trust filtering reduces the chance that fragile relations are allowed to propagate in the first place.
The six panels in Fig. 8 place FSAA and GSAA results side by side, allowing attacked Macro-F1, ASR, and Macro-F1 drop to be compared under a fixed model order.
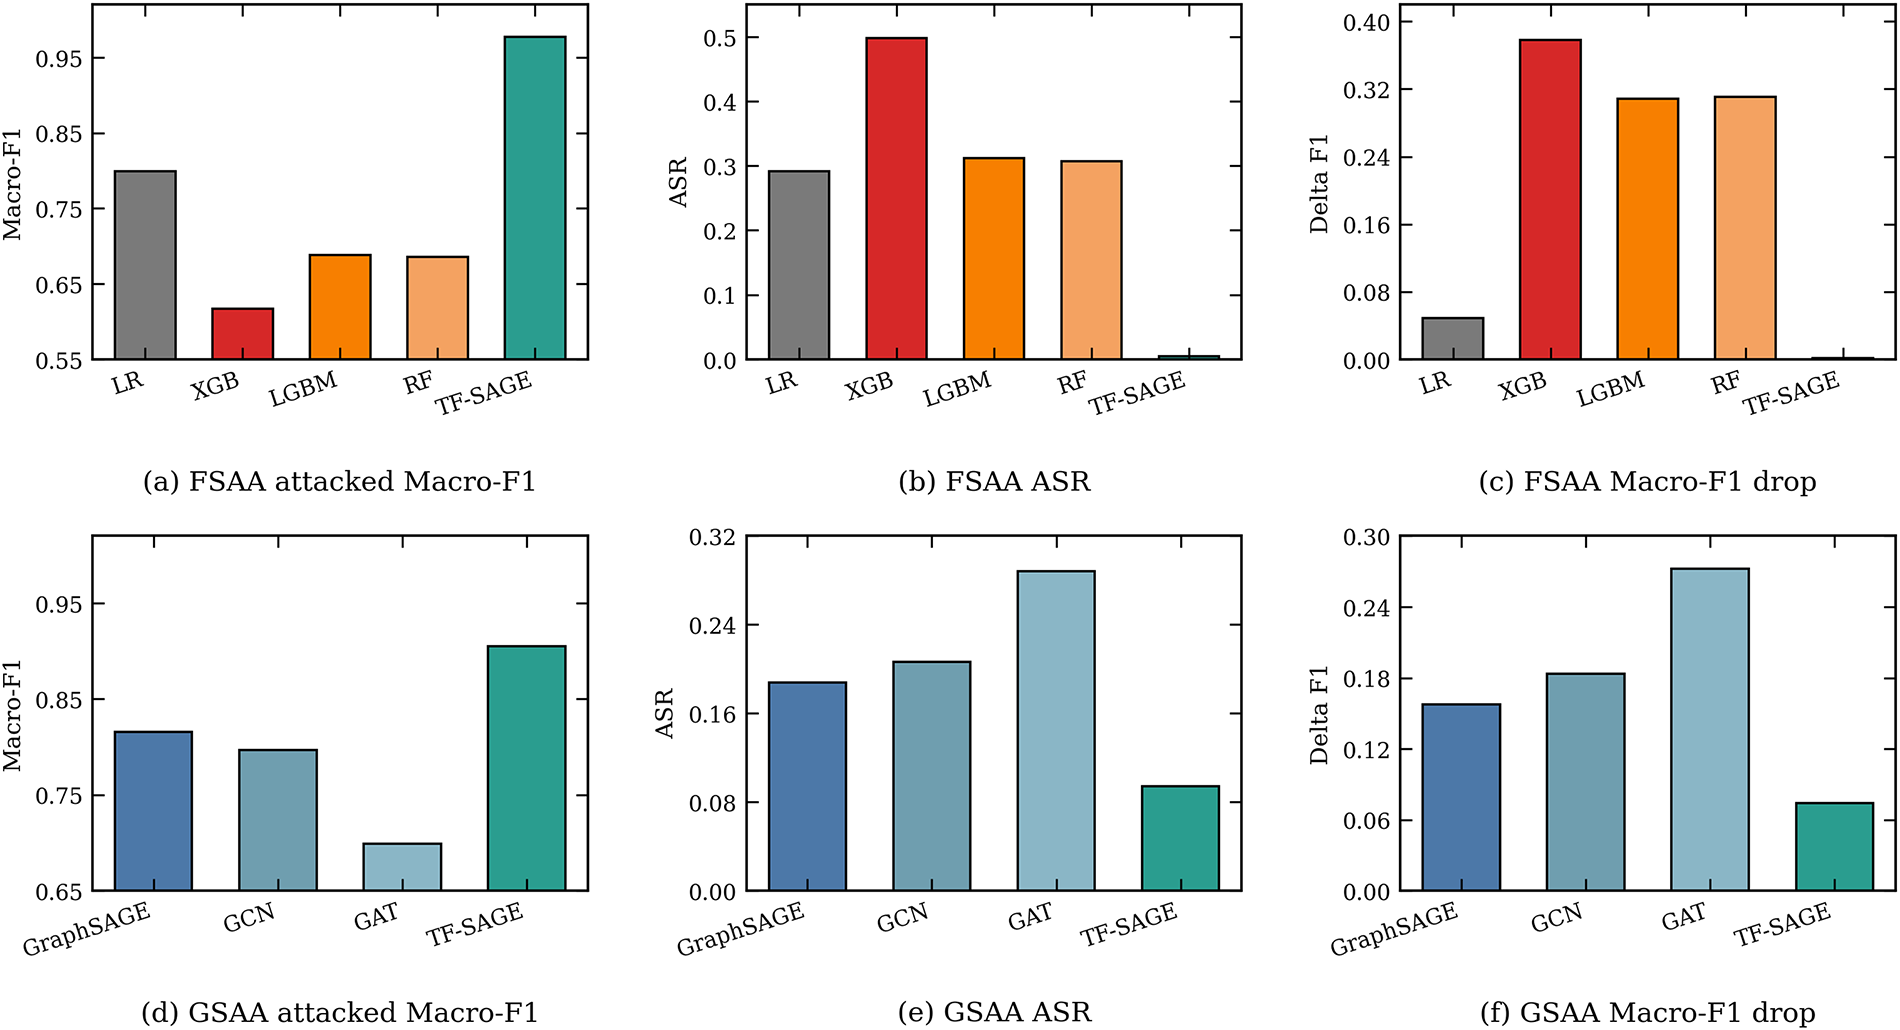
Figure 8: Degradation under FSAA and GSAA on NF-ToN-IoT-v2.
The shared pattern across FSAA and GSAA is that TF-SAGE does not rely on a single signal source. When features are perturbed, decisions are still supported by trust filtered neighborhoods and uncertainty aware inference; when graph connectivity is edited, low trust edges are weakened before they can be amplified through message passing.
Tables 3 and 4 summarize the two complementary attack surfaces. Table 3 focuses on FSAA for tabular classifiers and TF-SAGE, whereas Table 4 focuses on GSAA for graph based models and TF-SAGE. In both cases, the TF-SAGE advantage is reflected not only in attacked Macro-F1, but also in the lower fraction of attack samples pushed into the benign class.

5.3 Sensitivity to Attack Budget
To examine degradation trends under increasing perturbation budgets, we vary epsilon over nine levels from 0 to 0.03. Table 5 reports the budget sensitivity comparison between TF-SAGE and plain GraphSAGE, while Fig. 9 extends the same budget range to a representative model group. This analysis complements the fixed GSAA evaluation in Table 4 by showing how attacked Macro-F1 and ASR change as epsilon increases. Table 4 reports a fixed GSAA evaluation under a structural attack configuration used for direct comparison among graph based models. Table 5 serves a different purpose: it reports a budget sensitivity analysis in which
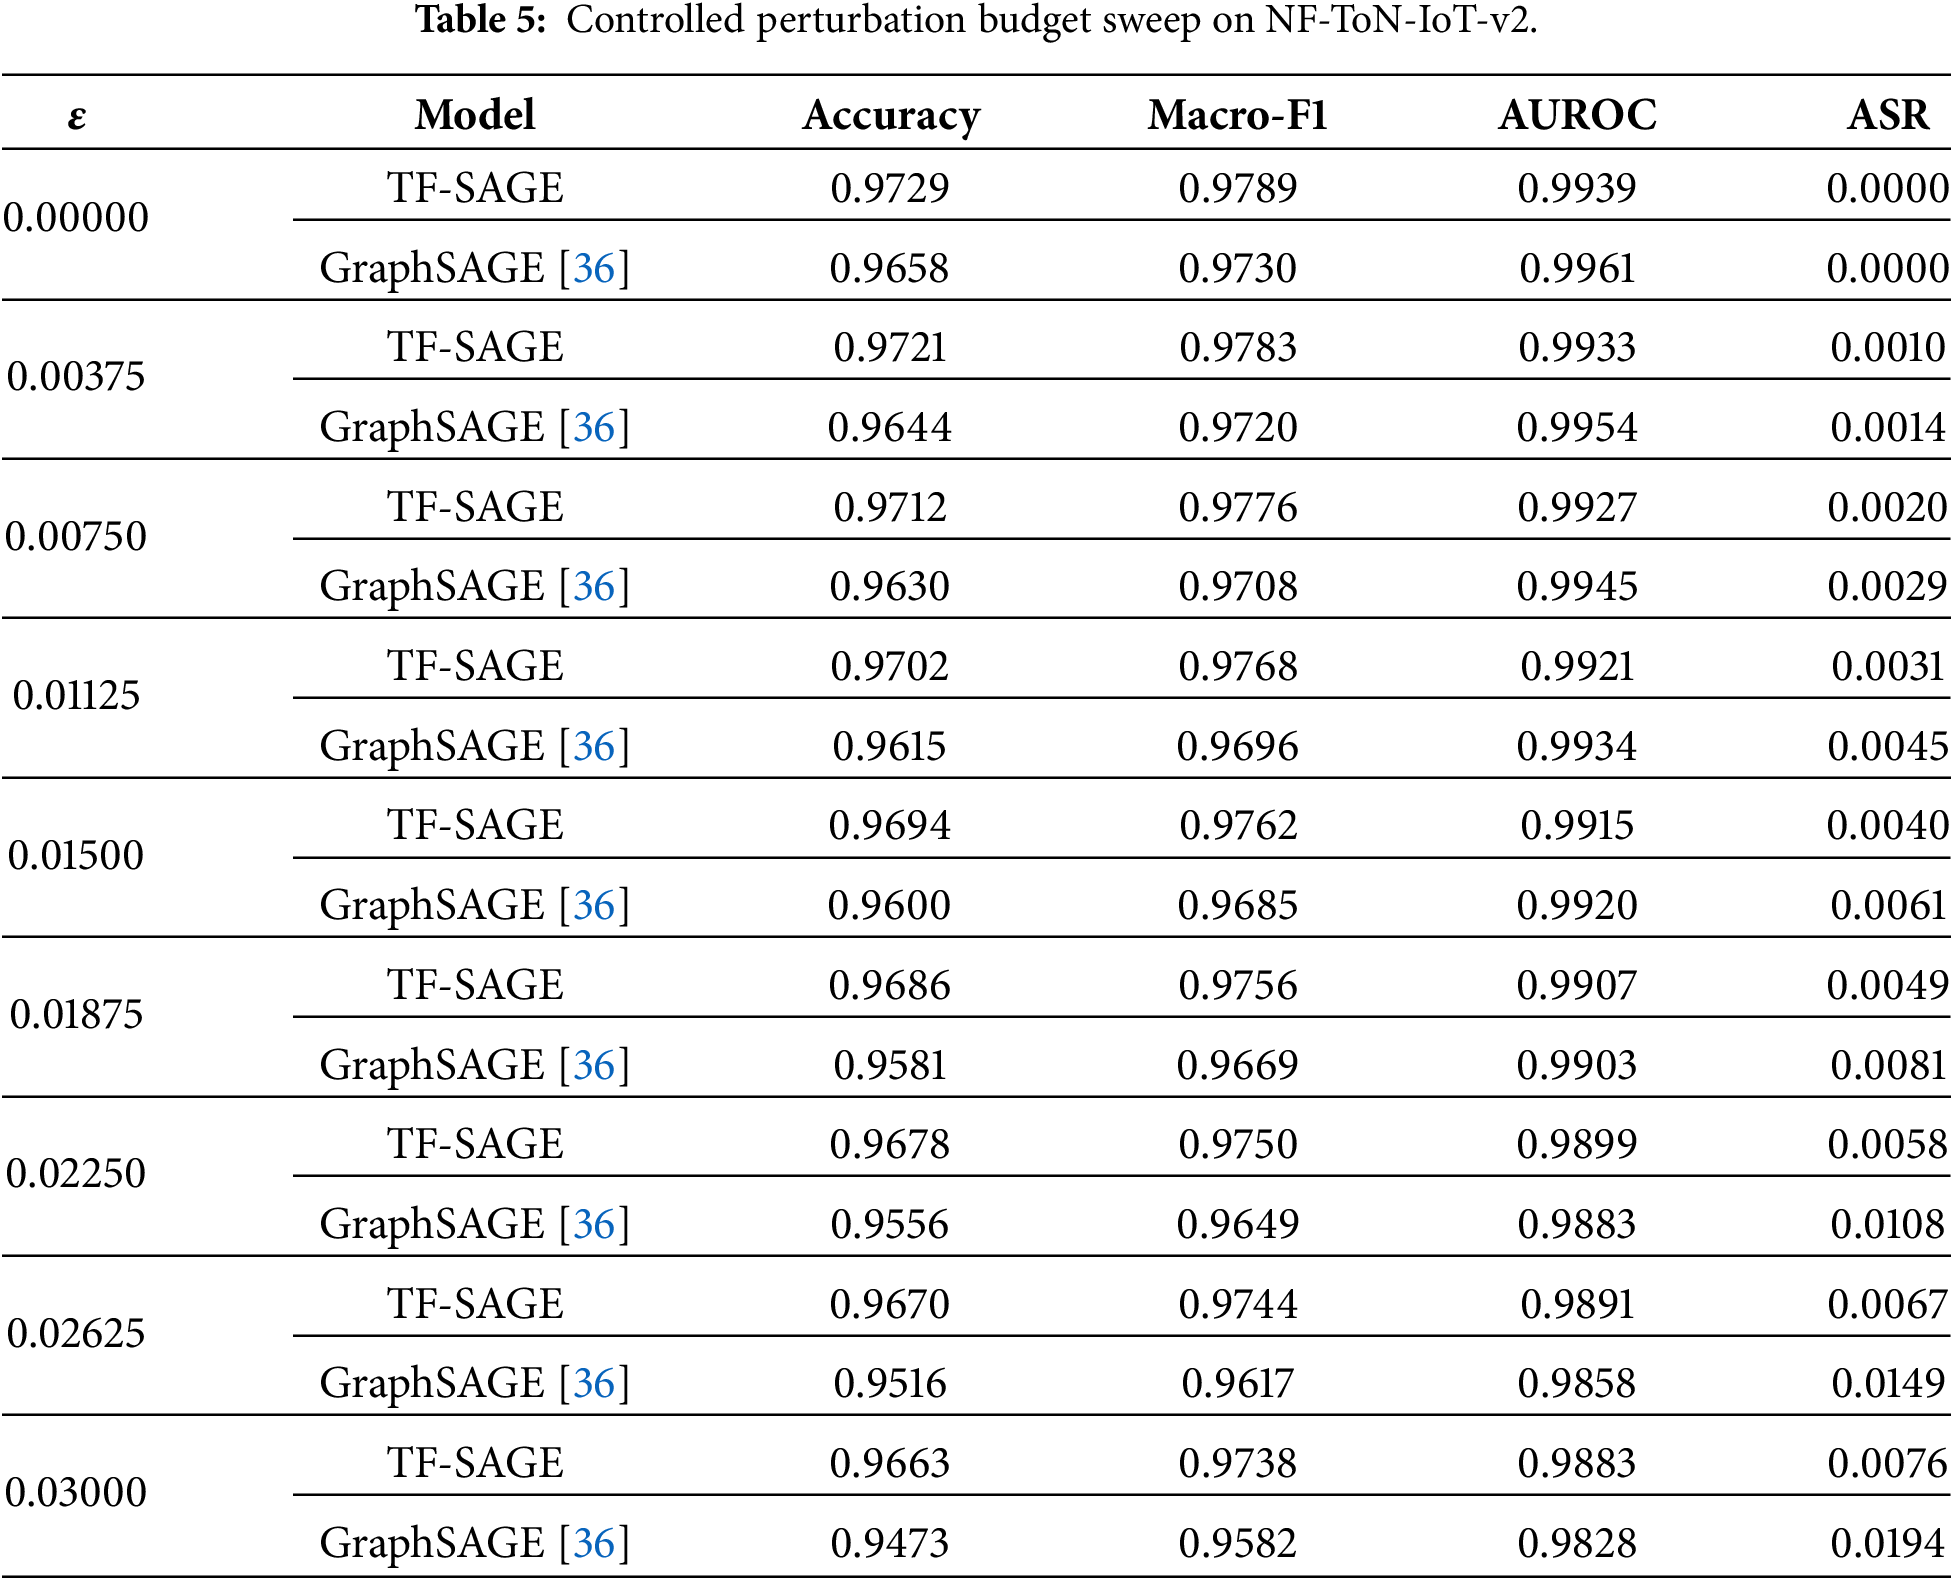
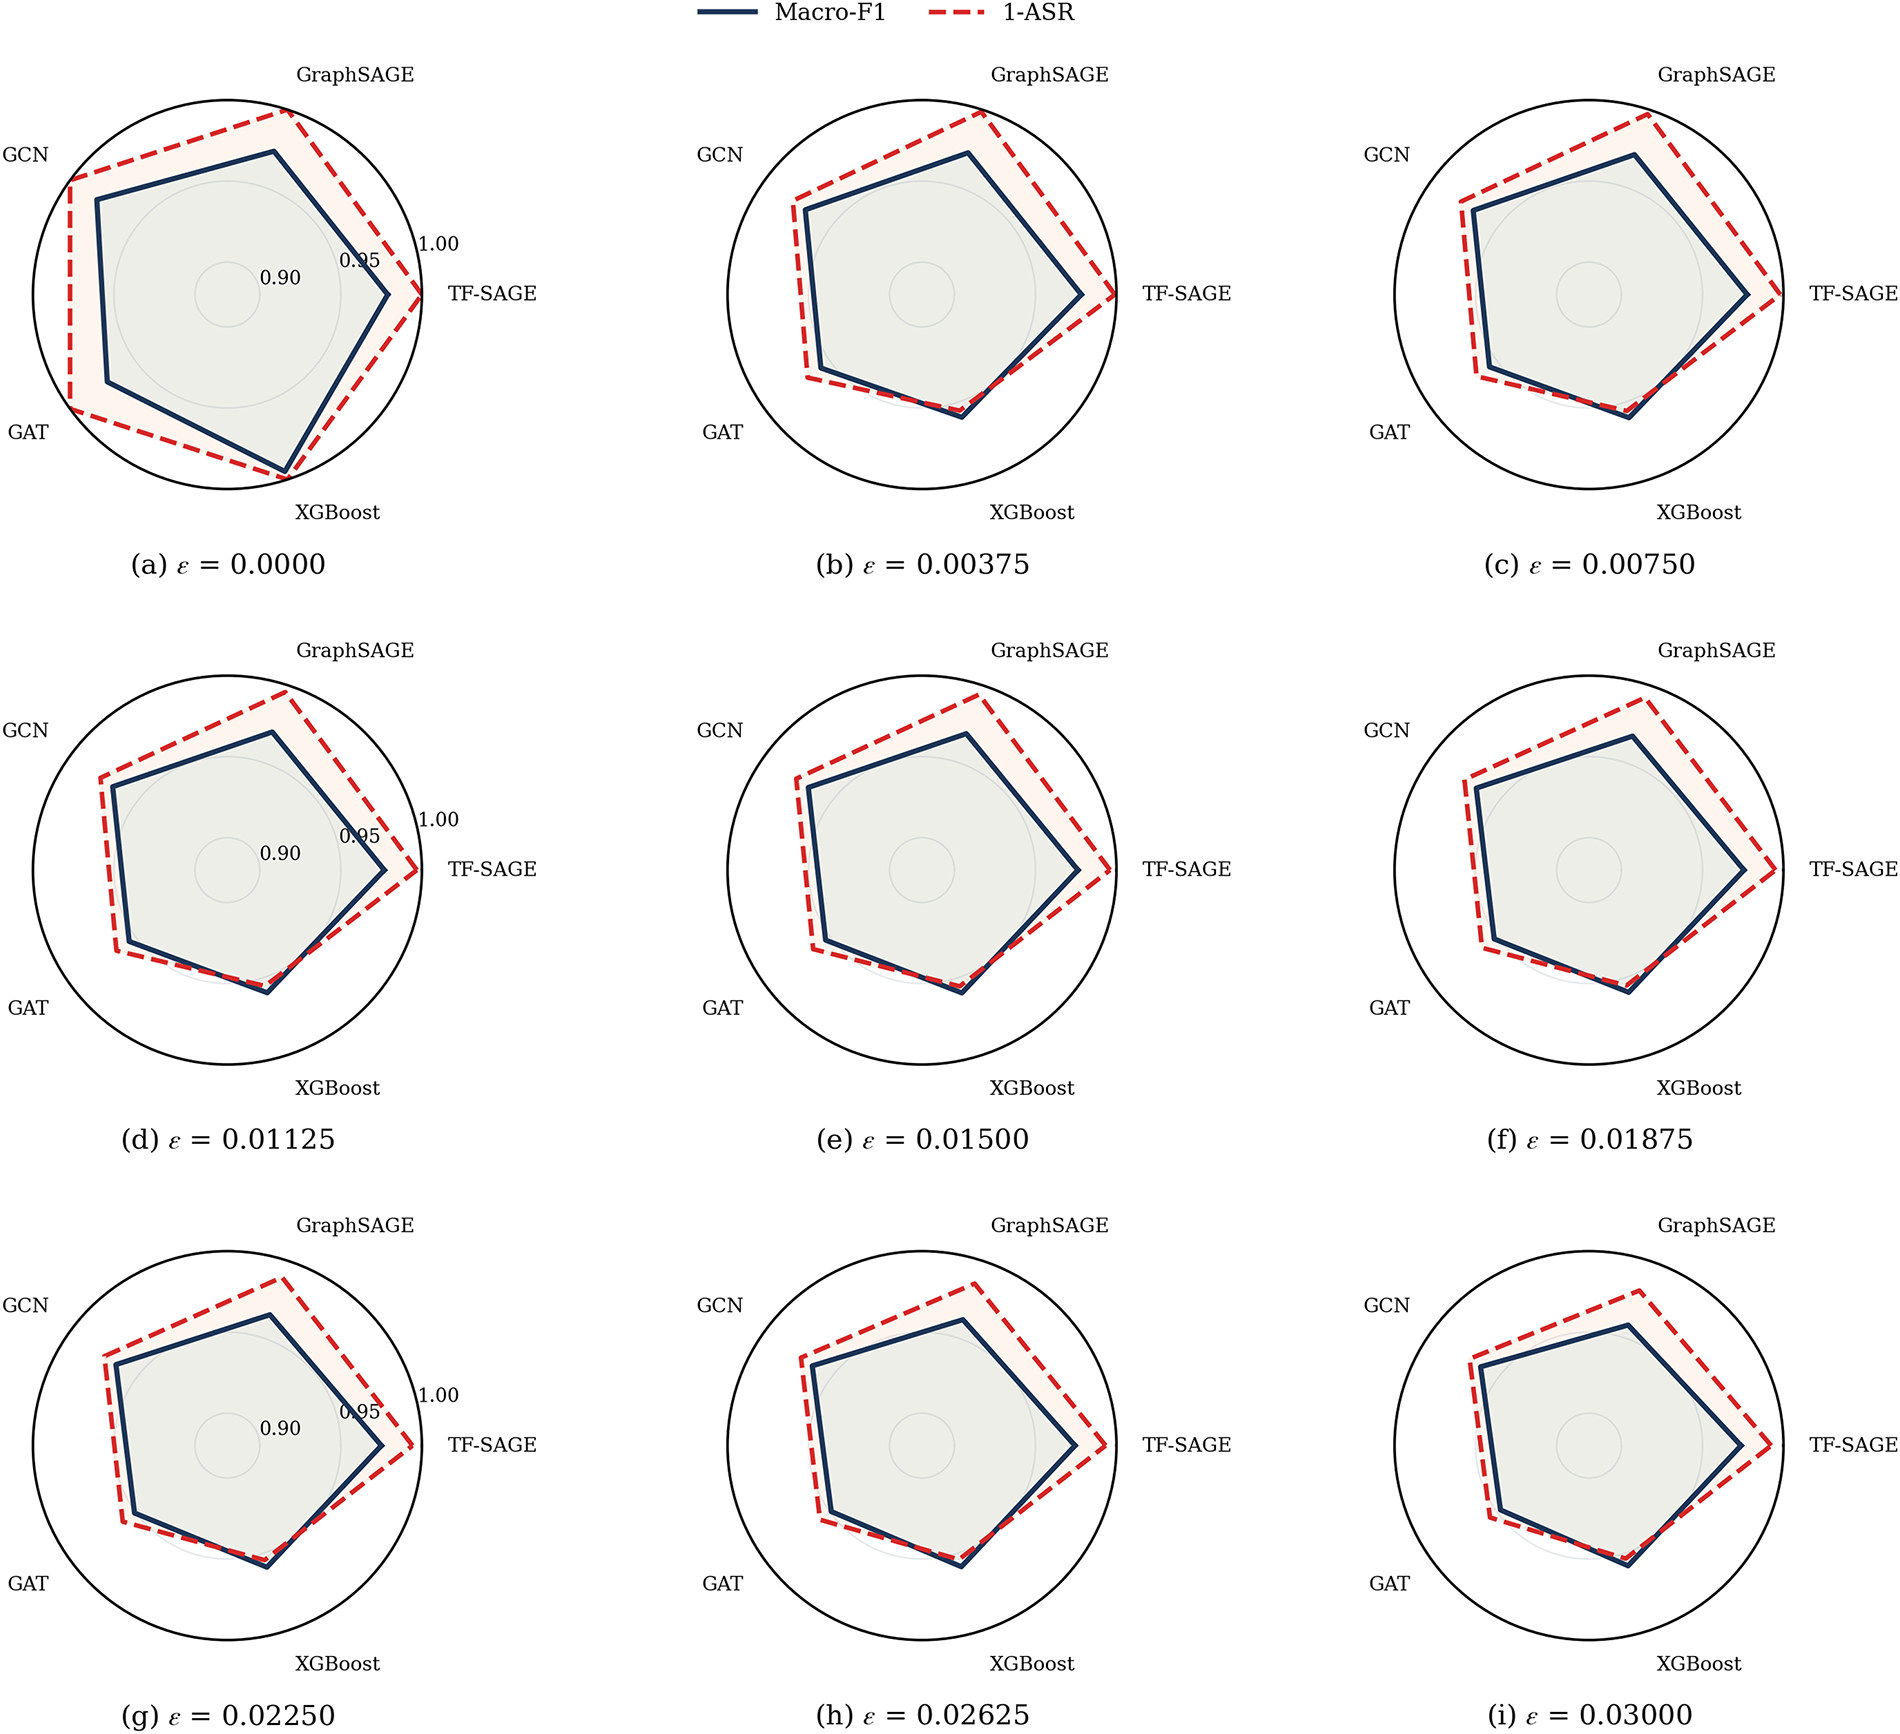
Figure 9: Controlled perturbation budget profile of the five models.
Table 5 shows that as the budget increases, both models degrade, but at very different rates. From the clean anchor to epsilon = 0.03, TF-SAGE drops from Macro-F1 0.9789 to 0.9738 and ASR rises from 0.0000 to 0.0076. Over the same range, plain GraphSAGE drops from Macro-F1 0.9730 to 0.9582 and ASR rises from 0.0000 to 0.0194. If only the nonzero segment from epsilon = 0.0075 to 0.03 is considered, TF-SAGE loses 0.0038 Macro-F1 while GraphSAGE loses 0.0126; the ASR increase is 0.0056 for TF-SAGE but 0.0165 for GraphSAGE.
The key point is not only that TF-SAGE remains better at every value of epsilon, but that the gap itself widens under stronger perturbation. The Macro-F1 gap between TF-SAGE and GraphSAGE grows from 0.0068 at epsilon = 0.0075 to 0.0156 at epsilon = 0.03, while the ASR gap grows from 0.0009 to 0.0118. This pattern complements the main attack results: the benefit of TF-SAGE is not limited to a favorable operating point, but persists as the perturbation budget increases in this auxiliary sweep.
Fig. 9 uses the same nine budget levels but expands the visualization to five models, using attacked Macro-F1 and 1-ASR as the two plotted axes.
In the clean panel (ε = 0), XGBoost provides the strongest nominal starting point, with GCN and TF-SAGE immediately behind it. As ε increases, TF-SAGE maintains higher Macro-F1 and lower ASR: its Macro-F1 decreases only from 0.9789 to 0.9738, while 1-ASR remains close to 0.9924 even at the largest budget. The gap to GraphSAGE, GAT, and XGBoost widens near the end of the sweep. This pattern complements the earlier attack results: the TF-SAGE advantage is not tied to a single favorable budget within the auxiliary sweep, but remains visible across the full perturbation range under study.
5.4 Mechanism Evidence: Calibration and Neighborhood Recovery
The mechanism analysis focuses on two signals close to how TF-SAGE forms its decisions: the reliability of predictive probabilities and the stability of neighborhoods after trust filtering. Attacked Macro-F1 and ASR have already described the overall performance loss; the more important question here is why the model continues to behave stably when both confidence and input structure are stressed by attack.
The TF-SAGE reliability diagram in Fig. 10 shows where confidence diverges from empirical accuracy across the probability range, rather than reducing the evidence to a single aggregate statistic.
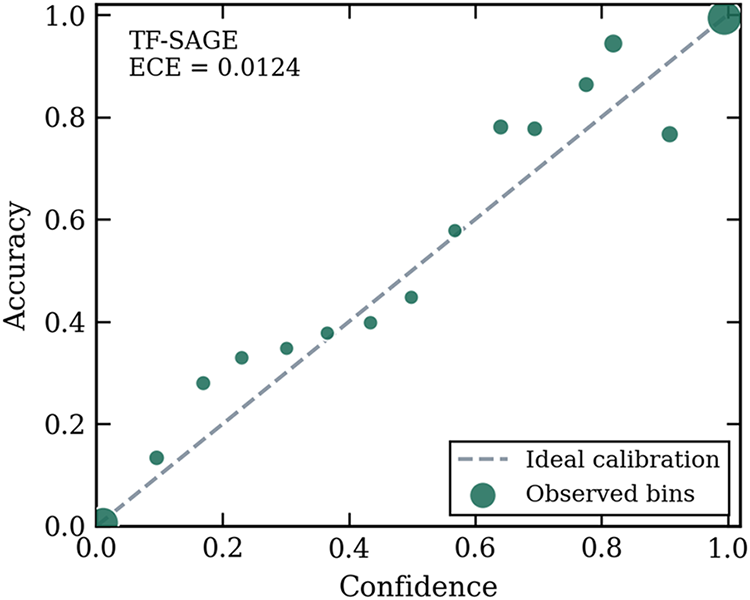
Figure 10: TF-SAGE reliability diagram.
With ECE = 0.0124 over 317,440 samples, the reliability signal is extracted from a sufficiently large validation slice rather than from a few isolated examples. Most predictive mass remains concentrated at low confidence and very high confidence extremes where the observed accuracy still tracks the reported probability closely. This indicates that TF-SAGE’s predicted probabilities remain operationally informative, rather than merely accompanying high accuracy.
The remaining mismatch is concentrated mainly in middle to high confidence bins such as the 0.60–0.93 region, where the boundary between benign and attack traffic becomes more ambiguous. This mismatch pattern is less concerning than calibration failure across the full probability range, because it suggests that uncertainty aware inference still carries discriminative value exactly where the cases become difficult. For IDS deployment, that point matters almost as much as attacked Macro-F1 itself: a model may retain strong scores under attack while still becoming operationally risky if it turns overconfident in ambiguous regions.
The second mechanism dimension lies in the neighborhood dynamics under GSAA. Fig. 11 provides a window level view of the overlap between clean and filtered neighborhoods, as well as the proportion of candidate edges retained after trust filtering reorganizes the structure. This evidence explains filter behavior at the window level rather than replacing the full scale benchmark results.
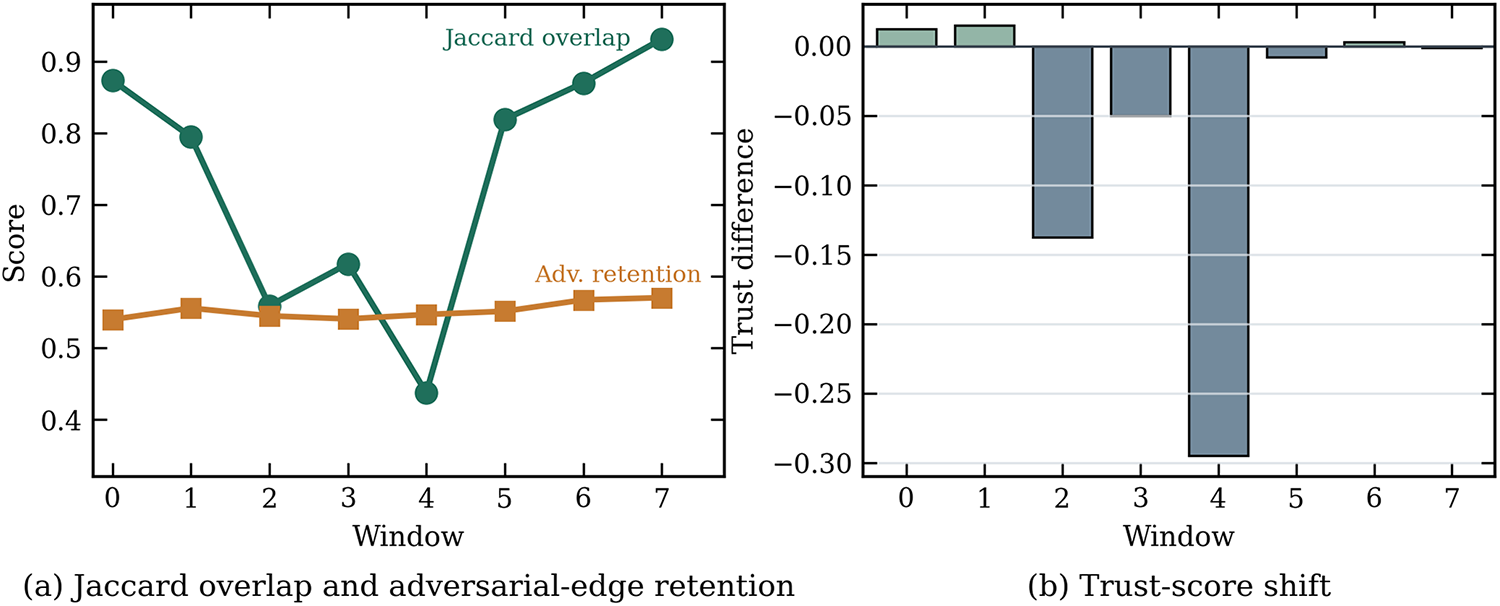
Figure 11: Neighborhood recovery under GSAA.
Avg Jaccard overlap = 0.7379 indicates that a substantial core of the clean neighborhood still survives after GSAA, while Avg adversarial retention = 0.5520 shows that trust filtering does not react by deleting the graph wholesale. More than half of the candidate edges are still retained after refiltering, which means TF-SAGE tries to preserve enough structure for message passing to remain useful rather than defending itself by cutting relations indiscriminately.
Table 6 evaluates the component removals under the same GSAA setting used in Table 4. The No-robust-objective row evaluates the role of adversarial training by removing the robust objective from the training loss. The No-Trust setting evaluates trust filtering by disabling trust based edge rejection, implemented by setting
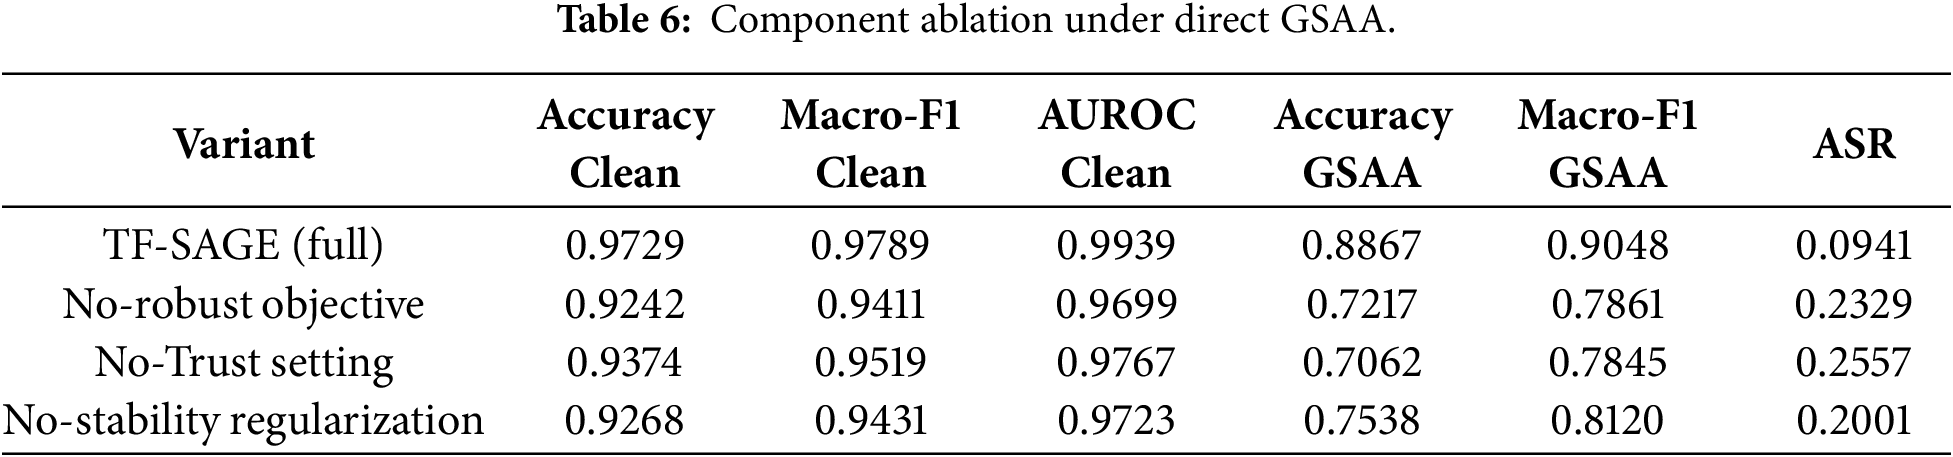
These direct GSAA ablation results support the design of TF-SAGE as a coupled robustness pipeline rather than a collection of interchangeable modules. Robust training improves adversarial consistency, stability regularization supports uncertainty-aware local smoothness and calibration-facing behavior, and trust-filtered graph construction preserves reliable message-passing neighborhoods under perturbation. The ablation evidence therefore suggests that the observed robustness is not explained by the GraphSAGE backbone alone, but by the interaction between trust-aware graph construction, adversarially regularized learning, and stability-aware inference.
More importantly, the trust score shift is not uniform across windows: some windows lose trust clearly, some remain nearly unchanged, and some even rise slightly after refiltering. This pattern fits the role of TrustFilter better than a rigid thresholding rule. It suggests that the filter responds to local neighborhood conditions rather than forcing every window into the same degree of contraction. This does not imply that every attacked neighborhood is preserved equally; rather, TF-SAGE retains a sufficiently large structural core while redistributing trust under graph disturbance.
These two evidence layers support the same mechanism argument from complementary directions. The reliability diagram shows that the combined objective in Eq. (15) does not drive the model into overconfident probability outputs, while the neighborhood recovery slice shows that trust filtering in Algorithm 1 does not destroy structure but reselects a more stable neighborhood core before message passing begins. The calibration and neighborhood recovery analyses complement the component ablation in Table 6 by showing how TF-SAGE maintains both prediction reliability and neighborhood stability under attack. The performance gap under attack therefore has a more direct explanation: TF-SAGE controls both the reliability of its predictions and the quality of the neighborhood structure passed into representation learning.
5.5 Independent Confirmation on CICIIoT2025
Although NF-ToN-IoT-v2 is the main benchmark, CICIIoT2025 provides an independent confirmation benchmark with a different and more difficult distribution. The purpose of this benchmark is to examine whether the stability advantage of TF-SAGE remains visible beyond the main dataset under the same FSAA and GSAA evaluation logic. Under FSAA, TF-SAGE reaches attacked Macro-F1 0.8308 and ASR 0.1016, whereas the tabular baselines degrade more strongly: XGBoost falls to 0.7655 with ASR 0.2145, LightGBM to 0.6742 with ASR 0.3775, and RF to 0.6902 with ASR 0.3375. This reproduces the same pattern seen on the main benchmark: nominal clean advantage does not automatically translate into stability when feature space perturbation is introduced.
On the GSAA side, CICIIoT2025 further confirms the structural stability advantage of TF-SAGE. GraphSAGE, GCN, and GAT drop to attacked Macro-F1 values of 0.7528, 0.6108, and 0.7518, whereas TF-SAGE maintains 0.8797 with ASR only 0.0351. This gap indicates that when neighborhood structure is distorted, TF-SAGE preserves substantially more attack detection behavior than standard graph backbones. The auxiliary benchmark therefore reinforces the same central argument obtained from NF-ToN-IoT-v2: the value of TF-SAGE lies in controlling graph construction and message passing under perturbation, not merely in clean performance.
Table 7 reports the CICIIoT2025 confirmation results under the same evaluation logic used for the main benchmark. FSAA evaluates feature space perturbation for tabular models and TF-SAGE, whereas GSAA evaluates structural perturbation for graph based models and TF-SAGE. This setup allows CICIIoT2025 to serve as an independent benchmark for checking whether the stability advantage of TF-SAGE persists beyond NF-ToN-IoT-v2.
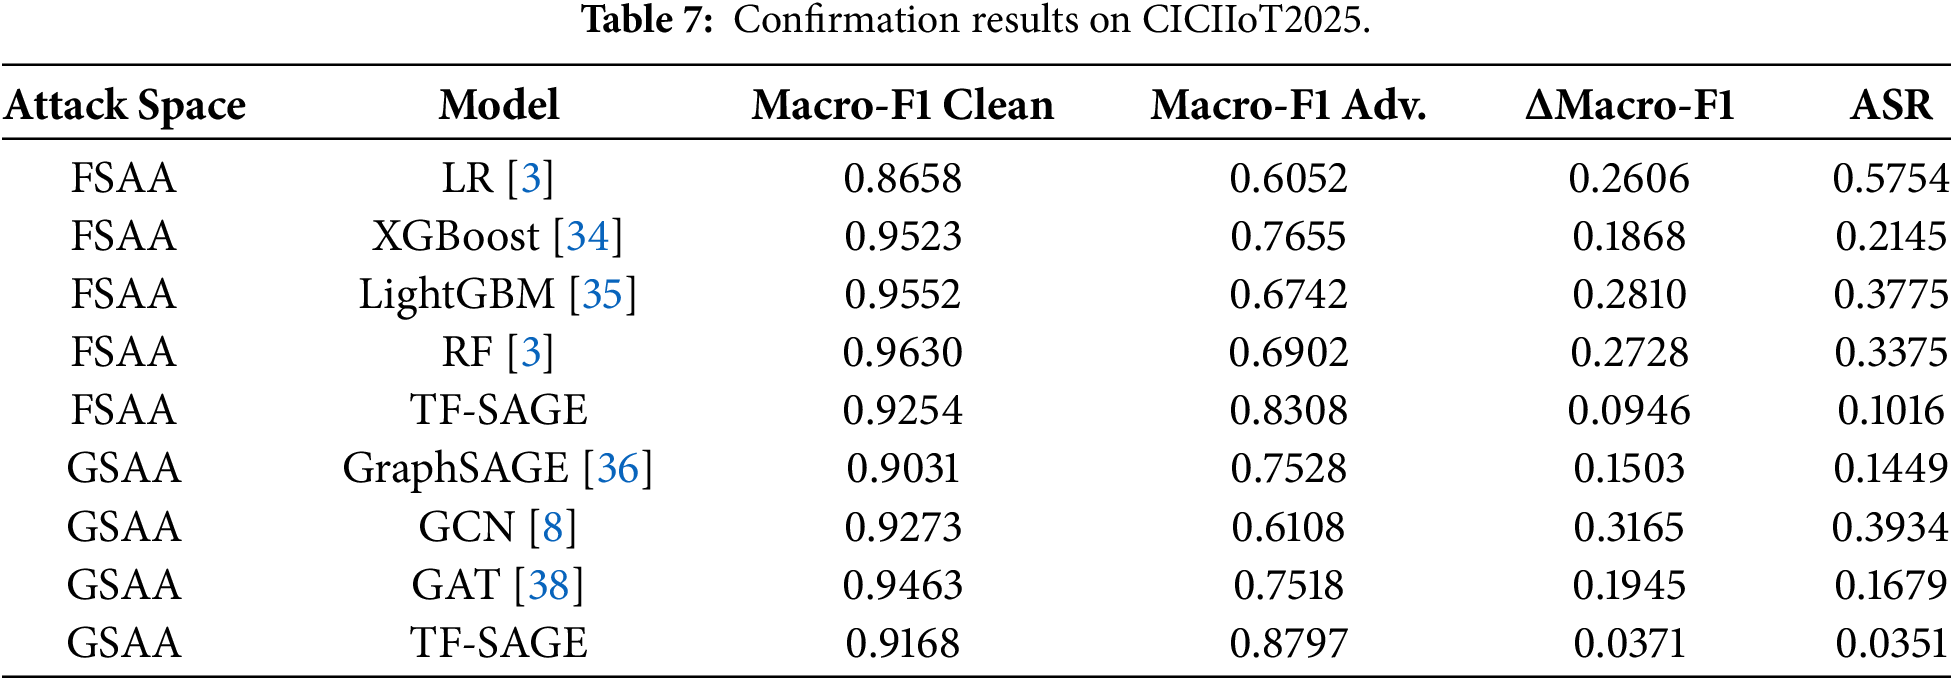
Fig. 12 presents the same result package in a compact 2 × 2 layout, with the two upper panels for FSAA and the two lower panels for GSAA. This layout makes it easier to check the consistency of the trend on the confirmation benchmark without shifting the focus away from the main results.
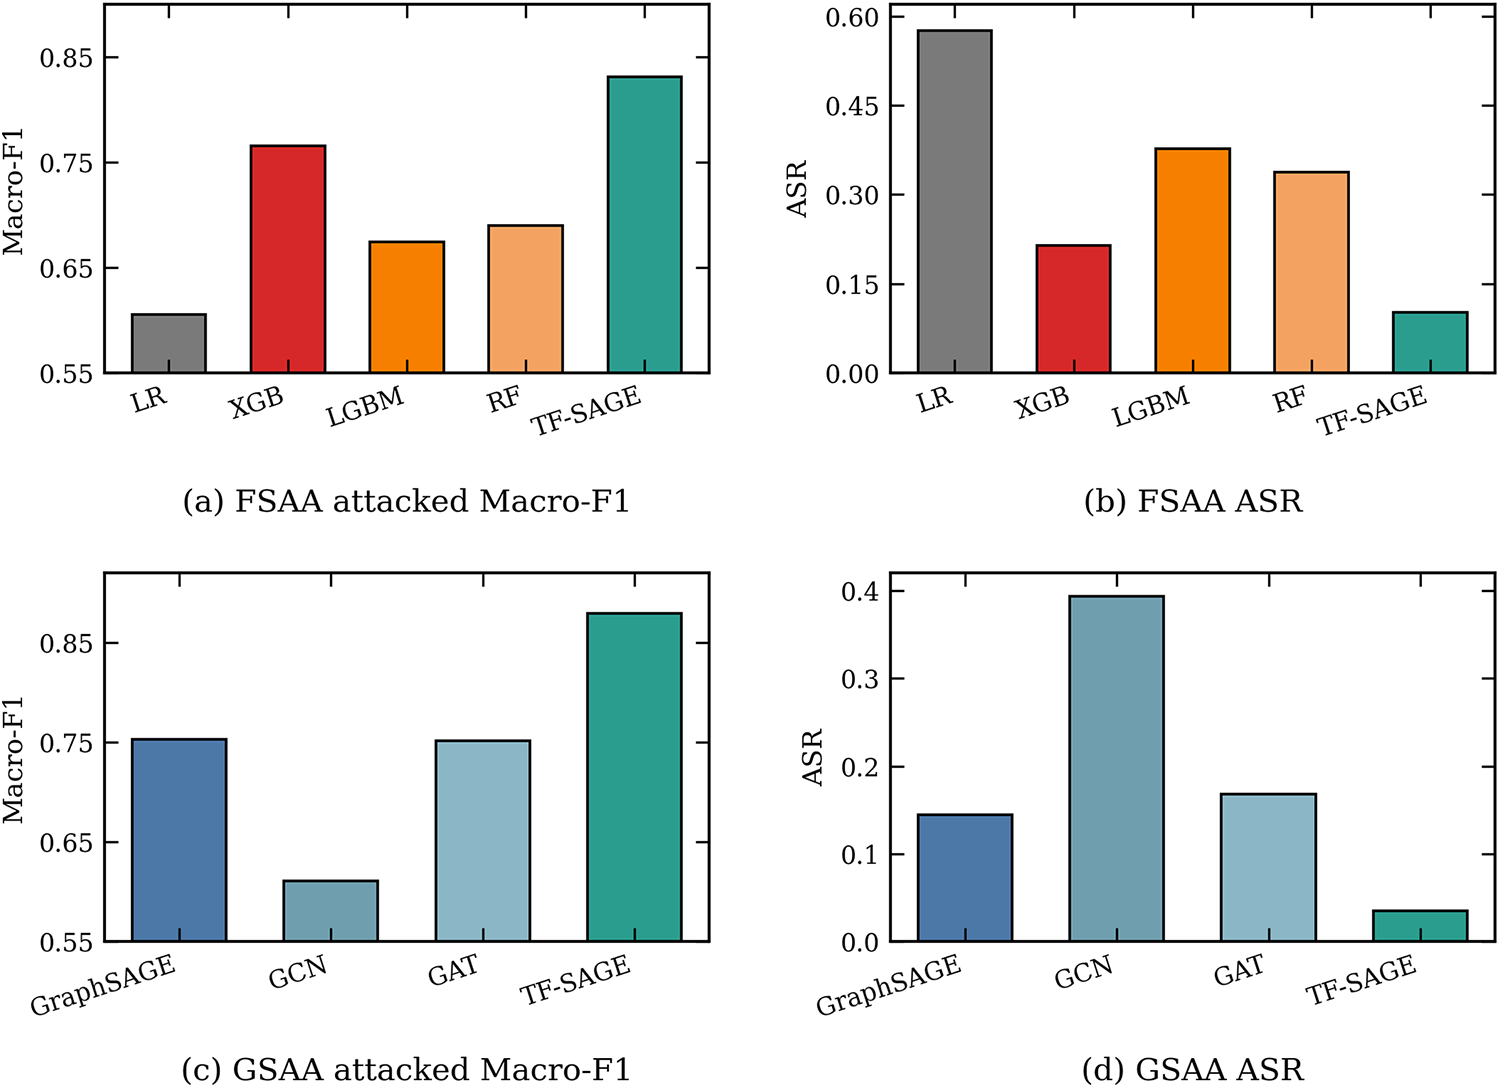
Figure 12: Confirmation results on CICIIoT2025.
Under FSAA, TF-SAGE preserves stronger attacked Macro-F1 and lower ASR than the tabular baselines. Under GSAA, the separation from standard graph backbones is also clear, with TF-SAGE retaining higher attacked Macro-F1 and substantially lower ASR. These results show that the same stability pattern observed on NF-ToN-IoT-v2 also appears on CICIIoT2025, supporting the conclusion that TF-SAGE improves robustness under both feature space and graph space perturbations.
The experimental results point to an important conclusion: in IoT IDS, clean score is a necessary condition, but not a sufficient one. On the main benchmark, tabular baselines may still achieve very high Accuracy and AUROC on clean data, yet when feature space is actively manipulated through FSAA, their attacked Macro-F1 degradation and ASR increase become much larger than those of TF-SAGE. This means that an IDS judged only by clean score may still lack defensive value precisely at the attack surface most relevant to real operation. To provide a statistical reliability check without mixing different checkpoints or evaluation subsets, Table 8 reports Wilson confidence intervals for selected ASR values already reported in Tables 3, 4, and 7. The intervals are computed from aggregate attack flip counts and therefore quantify uncertainty in the reported attack success rates. They do not estimate training-seed variance or support unpaired statistical-superiority claims.
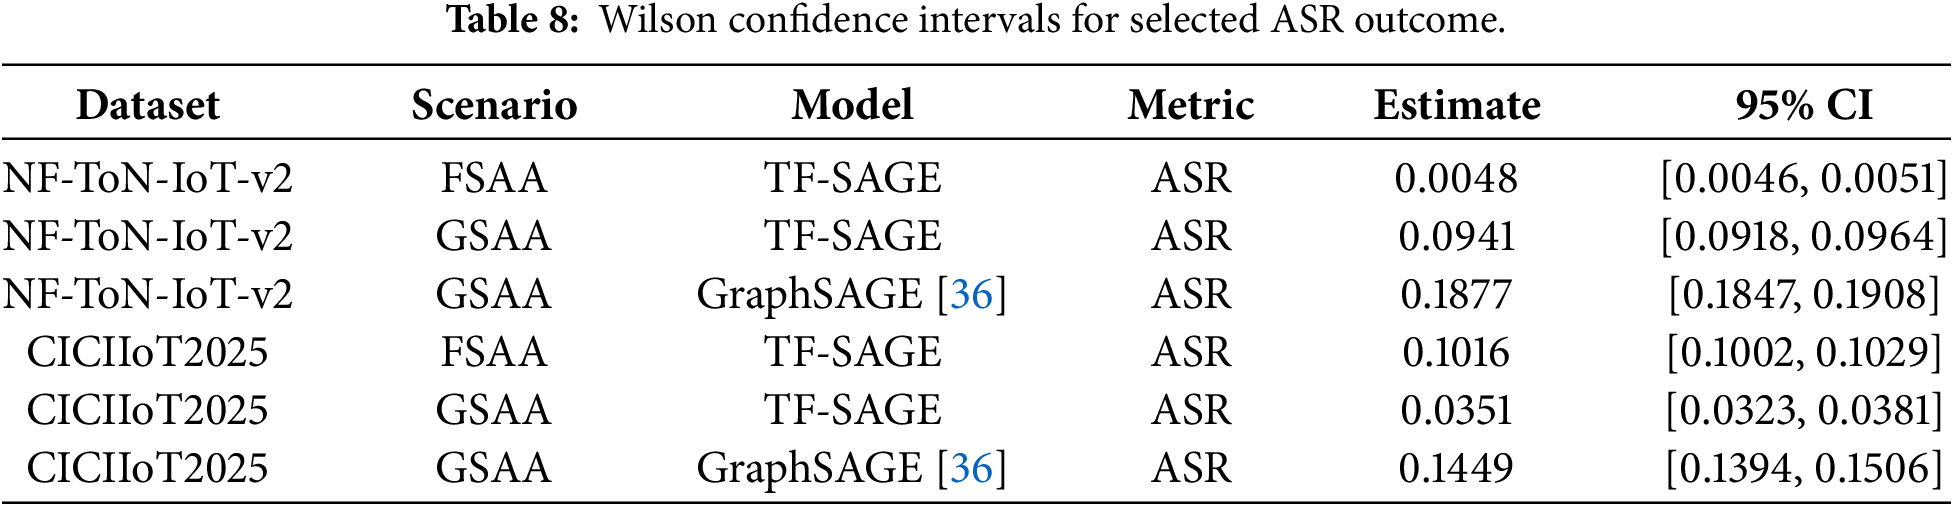
The resulting intervals are narrow for the selected ASR outcomes, suggesting that the reported attack success estimates are not driven by small test samples or unstable aggregate flip counts. On NF-ToN-IoT-v2, the GSAA ASR interval of TF-SAGE remains clearly below that of GraphSAGE, which reinforces the observed robustness pattern at the flip-rate level under the evaluated GSAA setting. At the same time, these results are interpreted conservatively: they complement the main tables by bounding finite-sample uncertainty, but they do not replace a future multi-seed variance study.
The GSAA results push this argument further by showing that graph construction is not a neutral preprocessing step, but a decisive component of model stability. When the neighborhood is purposefully edited, GraphSAGE, GCN, and GAT all degrade more severely in attacked Macro-F1 and yield higher ASR, whereas TF-SAGE preserves a narrower performance loss. This gap is consistent with the mechanism evidence: predictive probabilities remain well calibrated at scale, while trust filtering does not cut the graph aggressively but preserves a substantial structural core after the neighborhood is edited. In this sense, the main contribution of TF-SAGE is not making the backbone deeper, but transforming graph construction from a heuristic into a verifiable structural control layer.
The robustness results should be interpreted within the FSAA and GSAA threat models defined in this study. FSAA examines whether the IDS remains stable when flow features are perturbed, whereas GSAA examines whether graph based inference remains stable when neighborhood relations are perturbed. These evaluations support the robustness claims within the defined feature space and graph space settings, but they should not be read as a complete assessment of adversarial robustness for GNN based IDS. A broader evaluation with additional adaptive GNN attack baselines remains as direction for future work.
The deployment tradeoff is shown by placing attacked Macro-F1 and ASR next to latency within the graph model family.
If latency alone is considered, TF-SAGE requires more computation because graph updating, trust filtering, and stochastic inference add extra processing to the inference pipeline. Fig. 13 places this cost next to the GSAA robustness results, where TF-SAGE achieves attacked Macro-F1 of 0.9048 and ASR of 0.0941.
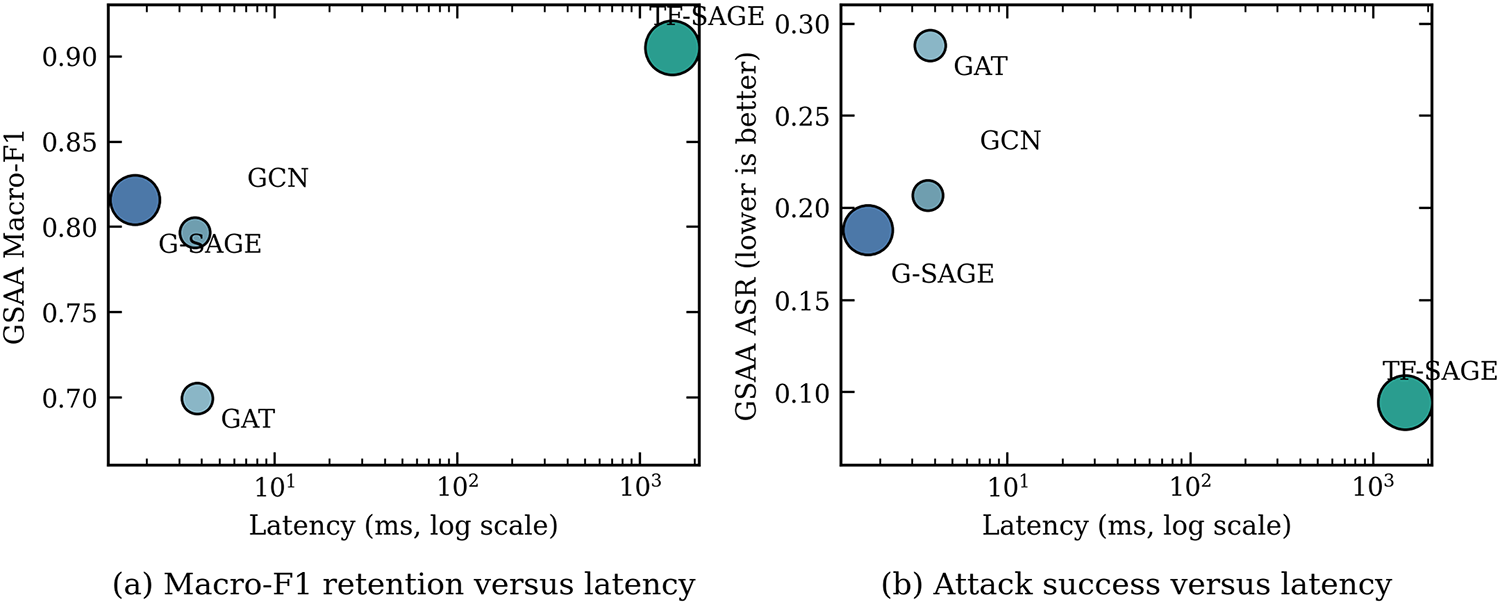
Figure 13: GSAA Macro-F1 and inference cost tradeoff.
These results should therefore be interpreted as an operational tradeoff rather than a cost free improvement. Faster graph baselines such as GraphSAGE [36] and GCN [8] retain a speed advantage, but they show greater sensitivity to structural corruption under GSAA. From a practical perspective, TF-SAGE is more suitable for IDS layers where stability under attack matters more than minimum per-flow latency, such as centralized monitoring gateways, edge analysis clusters with stable compute budgets, or settings in which false negatives on malicious traffic are more costly than the added computation. In contrast, very low-latency environments may still favor lighter models, especially when they are deployed as one layer within a broader defense stack. The practical choice therefore depends on how a deployment balances latency, reliability, and acceptable security loss.
In deployment, the uncertainty output is intended to support analyst triage rather than to replace analyst judgment. High-confidence malicious predictions can be prioritized for rapid review or automated response when site policy allows it, while low-confidence or high-entropy cases can be routed to manual inspection, correlated with additional telemetry, or held for delayed confirmation. In this role, uncertainty helps security teams avoid treating ambiguous predictions as fully reliable alerts and allocate review effort to traffic windows that require closer inspection. This operational interpretation also defines the scope of the present classification setting. Although both NF-ToN-IoT-v2 and CICIIoT2025 contain multiple attack families, the experiments in this paper focus on binary benign-vs.-attack detection. This setting is suitable for examining whether graph construction, message passing, and uncertainty reporting remain stable when the IDS is exposed to feature space and graph space perturbations. Multiclass attack-family attribution is a valuable deployment task, but it requires a different label definition, class-imbalance treatment, and robustness evaluation protocol. The present results should therefore be interpreted as evidence for binary intrusion detection under the evaluated FSAA and GSAA settings, while multiclass robustness analysis remains a future extension.
The confirmation results on CICIIoT2025 further suggest that the attack stability interpretation is not tied to a single benchmark. Under the same evaluation logic, TF-SAGE continues to preserve smaller degradation and lower ASR after the data distribution changes, strengthening the central argument that graph construction should be explicitly controlled in graph based IDS. The present experiments evaluate adversarial stability under feature space and graph space perturbations, which is related to robustness but is not the same as zero-day or unseen attack-family generalization. Therefore, the reported results should not be read as evidence that attack families absent from training can be detected reliably. Zero-day intrusion detection requires a dedicated problem formulation, including an unseen-family evaluation protocol, appropriate training objectives, and model mechanisms designed to recognize traffic patterns that are not represented in the known attack classes. Developing and evaluating such zero-day oriented graph based IDS models remains an important direction for future work. More broadly, graph based IoT IDS should be evaluated by placing clean quality, feature space stability, graph space stability, predictive reliability, and unseen-family generalization in a coherent evaluation framework; if any of these axes is missing, the resulting conclusion about defensive value may still be incomplete.
This study presents TF-SAGE as a graph based IDS framework that protects graph construction rather than treating it as a fixed preprocessing step. Across NF-ToN-IoT-v2 and CICIIoT2025, the results show that clean detection performance alone is not sufficient to characterize IDS value. Although TF-SAGE is not always the top clean score model, it maintains more stable behavior than the evaluated baselines under both FSAA and GSAA, with lower degradation and lower ASR under the defined threat models.
The mechanism evidence further supports this interpretation. The budget sweep shows that the stability pattern persists as the perturbation budget increases, while calibration and neighborhood recovery analyses indicate that the observed robustness is not reducible to a single summary score. By applying trust filtering before message passing and coupling it with uncertainty aware inference, TF-SAGE reduces dependence on fragile neighborhoods and avoids treating unstable predictions as fully reliable decisions. These findings suggest that graph based IDS should be evaluated not only by nominal accuracy, but also by how well graph formation, information propagation, and prediction reliability remain stable under attack.
However, there are some limitations to the scope of the current evaluation scope. The experiments are conducted under the defined FSAA and GSAA protocols and focus on binary benign-vs.-attack detection; they do not establish complete adversarial robustness, multiclass attack-family attribution, or zero-day detection. Future work should therefore extend the evaluation to broader adaptive GNN attacks, larger and more diverse benchmarks, multiclass and unseen-family protocols, multi-seed variance analysis, and finer grained studies of uncertainty use in analyst triage. These directions would help determine whether TF-SAGE and its successors can serve not only as high performing models in one experimental setting, but also as a broader design framework for resilience oriented graph based IDS.
Acknowledgement: Not applicable.
Funding Statement: This research was partly supported by the National Science and Technology Council, Taiwan, with grant numbers NSTC 115-2622-8-992-005-TD1 and NSTC 114-2622-8-992-007-TD1.
Author Contributions: Chin-Shiuh Shieh supervised the study. Thanh-Tuan Nguyen and Thanh-Lam Nguyen developed the methodology, conducted the experiments, curated the data, and prepared the original draft. Mong-Fong Horng contributed to formal analysis and manuscript review. Xuan-Huy Nguyen and Chau-Tan-Phat Le contributed to validation, data checking, and manuscript preparation. All authors reviewed and approved the final version of the manuscript.
Availability of Data and Materials: The NF-ToN-IoT-v2 and CICIIoT2025 benchmarks used in this study are publicly available from their original sources. The processed tables, figure assets, and manuscript-supporting materials used in this study are available from the corresponding authors upon reasonable request.
Ethics Approval: Not applicable.
Conflicts of Interest: Given his role as Editorial Board Members and Guest Editor of this journal, Chin-Shiuh Shieh had no involvement in the peer review of this article and had no access to information regarding its peer review. Given his role as Guest Editor of this journal, Thanh-Tuan Nguyen had no involvement in the peer review of this article and had no access to information regarding its peer review. Full responsibility for the editorial process for this article was delegated to another journal editor. The authors declare no other conflicts of interest.
References
1. Goranin N, Hora SK, Čenys HA. A bibliometric review of intrusion detection research in IoT: evolution, collaboration, and emerging trends. Electronics. 2024;13(16):3210. doi:10.3390/electronics13163210. [Google Scholar] [CrossRef]
2. Xu B, Sun L, Mao X, Ding R, Liu C. IoT intrusion detection system based on machine learning. Electronics. 2023;12(20):4289. doi:10.3390/electronics12204289. [Google Scholar] [CrossRef]
3. Ashraf J, Raza GM, Kim BS, Wahid A, Kim HY. Making a real-time IoT network intrusion-detection system (INIDS) using a realistic BoT-IoT dataset with multiple machine-learning classifiers. Appl Sci. 2025;15(4):2043. doi:10.3390/app15042043. [Google Scholar] [CrossRef]
4. Shi L, Yang Q, Gao L, Ge H. An ensemble system for machine learning IoT intrusion detection based on enhanced artificial hummingbird algorithm. J Supercomput. 2024;81(1):110. doi:10.1007/s11227-024-06475-1. [Google Scholar] [CrossRef]
5. Ali MA, Al-Sharafi SAH. Intrusion detection in IoT networks using machine learning and deep learning approaches for MitM attack mitigation. Discov Internet Things. 2025;5(1):48. doi:10.1007/s43926-025-00104-w. [Google Scholar] [CrossRef]
6. He K, Kim DD, Asghar MR. Adversarial machine learning for network intrusion detection systems: a comprehensive survey. IEEE Commun Surv Tutorials. 2023;25(1):538–66. doi:10.1109/comst.2022.3233793. [Google Scholar] [CrossRef]
7. Sharma S, Chen Z. A systematic study of adversarial attacks against network intrusion detection systems. Electronics. 2024;13(24):5030. doi:10.3390/electronics13245030. [Google Scholar] [CrossRef]
8. Zhong M, Lin M, Zhang C, Xu Z. A survey on graph neural networks for intrusion detection systems: methods, trends and challenges. Comput Secur. 2024;141(3):103821. doi:10.1016/j.cose.2024.103821. [Google Scholar] [CrossRef]
9. Caville E, Lo WW, Layeghy S, Portmann M. Anomal-E: a self-supervised network intrusion detection system based on graph neural networks. Knowl Based Syst. 2022;258(1):110030. doi:10.1016/j.knosys.2022.110030. [Google Scholar] [CrossRef]
10. Altaf T, Wang X, Ni W, Yu G, Liu RP, Braun R. A new concatenated multigraph neural network for IoT intrusion detection. Internet Things. 2023;22(1):100818. doi:10.1016/j.iot.2023.100818. [Google Scholar] [CrossRef]
11. Gao M, Wu L, Li Q, Chen W. Anomaly traffic detection in IoT security using graph neural networks. J Inf Secur Appl. 2023;76(5):103532. doi:10.1016/j.jisa.2023.103532. [Google Scholar] [CrossRef]
12. Deng P, Huang Y. Edge-featured multi-hop attention graph neural network for intrusion detection system. Comput Secur. 2025;148(4):104132. doi:10.1016/j.cose.2024.104132. [Google Scholar] [CrossRef]
13. Ngo T, Yin J, Ge YF, Wang H. Optimizing IoT intrusion detection—a graph neural network approach with attribute-based graph construction. Information. 2025;16(6):499. doi:10.3390/info16060499. [Google Scholar] [CrossRef]
14. Zhao K, Kang Q, Song Y, She R, Wang S, Tay WP. Adversarial robustness in graph neural networks: a Hamiltonian approach. In: Proceedings of the Neural Information Processing Systems 36; 2023 Dec 10–16; New Orleans, LA, USA. doi:10.52202/075280-0148. [Google Scholar] [CrossRef]
15. Hsu HH, Shen Y, Tomani C, Cremers D. What makes graph neural networks miscalibrated? In: Proceedings of the Neural Information Processing Systems 35; 2022 Nov 28–Dec 9; New Orleans, LA, USA. doi:10.52202/068431-1001. [Google Scholar] [CrossRef]
16. Chaurasia N, Ram M, Verma P, Mehta N, Bharot N. A federated learning approach to network intrusion detection using residual networks in industrial IoT networks. J Supercomput. 2024;80(13):18325–46. doi:10.1007/s11227-024-06153-2. [Google Scholar] [CrossRef]
17. Arreche O, Guntur T, Abdallah M. XAI-IDS: toward proposing an explainable artificial intelligence framework for enhancing network intrusion detection systems. Appl Sci. 2024;14(10):4170. doi:10.3390/app14104170. [Google Scholar] [CrossRef]
18. Kikissagbe BR, Adda M. Machine learning-based intrusion detection methods in IoT systems: a comprehensive review. Electronics. 2024;13(18):3601. doi:10.3390/electronics13183601. [Google Scholar] [CrossRef]
19. Berhili M, Chaieb O, Benabdellah M. Intrusion detection systems in IoT based on machine learning: a state of the art. Procedia Comput Sci. 2024;251:99–107. doi:10.1016/j.procs.2024.11.089. [Google Scholar] [CrossRef]
20. Musthafa MB, Huda S, Kodera Y, Ali MA, Araki S, Mwaura J, et al. Optimizing IoT intrusion detection using balanced class distribution, feature selection, and ensemble machine learning techniques. Sensors. 2024;24(13):4293. doi:10.3390/s24134293. [Google Scholar] [CrossRef]
21. Schrötter M, Niemann A, Schnor B. A comparison of neural-network-based intrusion detection against signature-based detection in IoT networks. Information. 2024;15(3):164. doi:10.3390/info15030164. [Google Scholar] [CrossRef]
22. Rabie OBJ, Selvarajan S, Hasanin T, Alshareef AM, Yogesh CK, Uddin M. A novel IoT intrusion detection framework using decisive red fox optimization and descriptive back propagated radial basis function models. Sci Rep. 2024;14(1):386. doi:10.1038/s41598-024-51154-z. [Google Scholar] [CrossRef]
23. Kim H, Park S, Hong H, Park J, Kim S. A transferable deep learning framework for improving the accuracy of Internet of Things intrusion detection. Future Internet. 2024;16(3):80. doi:10.3390/fi16030080. [Google Scholar] [CrossRef]
24. Cui B, Chai Y, Yang Z, Li K. Intrusion detection in IoT using deep residual networks with attention mechanisms. Future Internet. 2024;16(7):255. doi:10.3390/fi16070255. [Google Scholar] [CrossRef]
25. Yaras S, Dener M. IoT-based intrusion detection system using new hybrid deep learning algorithm. Electronics. 2024;13(6):1053. doi:10.3390/electronics13061053. [Google Scholar] [CrossRef]
26. Tseng SM, Wang YQ, Wang YC. Multi-class intrusion detection based on transformer for IoT networks using CIC-IoT-2023 dataset. Future Internet. 2024;16(8):284. doi:10.3390/fi16080284. [Google Scholar] [CrossRef]
27. Tran DH, Park M. FN-GNN: a novel graph embedding approach for enhancing graph neural networks in network intrusion detection systems. Appl Sci. 2024;14(16):6932. doi:10.3390/app14166932. [Google Scholar] [CrossRef]
28. Yin L, Chen W, Luo X, Yang H. Efficient large-scale IoT botnet detection through GraphSAINT-based subgraph sampling and graph isomorphism network. Mathematics. 2024;12(9):1315. doi:10.3390/math12091315. [Google Scholar] [CrossRef]
29. Le HD, Park M. Enhancing multi-class attack detection in graph neural network through feature rearrangement. Electronics. 2024;13(12):2404. doi:10.3390/electronics13122404. [Google Scholar] [CrossRef]
30. Wardana AA, Kołaczek G, Sukarno P. Lightweight, trust-managing, and privacy-preserving collaborative intrusion detection for Internet of Things. Appl Sci. 2024;14(10):4109. doi:10.3390/app14104109. [Google Scholar] [CrossRef]
31. Alabbadi A, Bajaber F. An intrusion detection system over the IoT data streams using eXplainable Artificial Intelligence (XAI). Sensors. 2025;25(3):847. doi:10.3390/s25030847. [Google Scholar] [CrossRef]
32. Sarhan M, Layeghy S, Portmann M. Towards a standard feature set for network intrusion detection system datasets. Mob Netw Appl. 2022;27(1):357–70. doi:10.1007/s11036-021-01843-0. [Google Scholar] [CrossRef]
33. Firouzi A, Dadkhah S, Maret SA, Ghorbani AA. DataSense: a real-time sensor-based benchmark dataset for attack analysis in IIoT with multi-objective feature selection. Electronics. 2025;14(20):4095. doi:10.3390/electronics14204095. [Google Scholar] [CrossRef]
34. Hu Y, Xiao K, Luo L, Chen L. An XGBoost-based intrusion detection framework with interpretability analysis for IoT networks. Appl Sci. 2026;16(2):980. doi:10.3390/app16020980. [Google Scholar] [CrossRef]
35. Chen W, Yang H, Yin L, Luo X. Large-scale IoT attack detection scheme based on LightGBM and feature selection using an improved salp swarm algorithm. Sci Rep. 2024;14(1):19165. doi:10.1038/s41598-024-69968-2. [Google Scholar] [CrossRef]
36. Saidane S, Telch F, Shahin K, Granelli F. Deep GraphSAGE enhancements for intrusion detection: analyzing attention mechanisms and GCN integration. J Inf Secur Appl. 2025;90(5):104013. doi:10.1016/j.jisa.2025.104013. [Google Scholar] [CrossRef]
37. Wang Y, Han Z, Du Y, Li J, He X. BS-GAT: a network intrusion detection system based on graph neural network for edge computing. Cybersecurity. 2025;8(1):27. doi:10.1186/s42400-024-00296-8. [Google Scholar] [CrossRef]
38. Ahanger AS, Khan SM, Masoodi F, Salau AO. Advanced intrusion detection in Internet of Things using graph attention networks. Sci Rep. 2025;15(1):9831. doi:10.1038/s41598-025-94624-8. [Google Scholar] [CrossRef]
Cite This Article
 Copyright © 2026 The Author(s). Published by Tech Science Press.
This work is licensed under a Creative Commons Attribution 4.0 International License , which permits unrestricted use, distribution, and reproduction in any medium, provided the original work is properly cited.
 Downloads
 Citation Tools
