
 Login
Login Register
 Submit a Paper
 Propose a Special lssue
 Open Access
ARTICLE
An ISSA-Optimized Attention-Enhanced ConvNeXt Model for Partial Discharge Pattern Recognition in Gas-Insulated Switchgear
1 School of Electrical Engineering, Xinjiang University, Urumqi, China
2 Sichuan Energy Internet Research Institute, Tsinghua University, Chengdu, China
3 China Electric Power Research Institute, Beijing, China
* Corresponding Author: Ziwei Zhang. Email:
Computers, Materials & Continua 2026, 89(2), 33 https://doi.org/10.32604/cmc.2026.086232
Received 26 May 2026; Accepted 22 July 2026; Issue published 15 September 2026
 View Full Text
 Download PDF
Abstract
The accuracy of partial discharge (PD) pattern recognition is essential for assessing the insulation condition of gas-insulated switchgear (GIS). However, in practical recognition tasks, phase-resolved partial discharge (PRPD) patterns often exhibit complex feature distributions, and key discharge characteristics may be weakened during feature extraction. This study proposes an improved sparrow search algorithm (ISSA)-optimized attention-enhanced ConvNeXt model for GIS PD pattern recognition. A multi-criterion grayscale evaluation scheme is first employed to select the most suitable grayscale conversion for PRPD patterns, aiming to preserve informative discharge regions and reduce redundant color interference. Subsequently, an attention-enhanced ConvNeXt model is built, where the convolutional block attention module (CBAM) is embedded after each stage of ConvNeXt to selectively emphasize salient discharge features, and additive angular margin loss (ArcFace) is introduced to enlarge inter-class feature margins and enhance feature discriminability. To automatically determine the optimal hyperparameters and improve optimization stability, the recognition model is then optimized by an ISSA that incorporates a random restart strategy. This strategy triggers population restart upon evolutionary stagnation or diversity collapse, helping the optimizer escape local optima and maintain global search capability. The optimized model is evaluated on five typical GIS PD categories. Experimental results show that the proposed method achieves an accuracy of 97.59%, with precision, recall, and F1-score reaching 97.59%, 97.64%, and 97.61%, respectively. Compared with conventional convolutional neural network and ResNet-series models, the proposed ISSA-optimized ConvNeXt model improves accuracy by 10.95%–13.74%, which provides a practical approach for GIS PD pattern recognition.Keywords
Gas-insulated switchgear (GIS) is widely used in high-voltage power systems because of its compact configuration, high insulation strength, and operational reliability. Nevertheless, insulation defects introduced during manufacturing, installation, or long-term service can initiate partial discharge (PD). Reliable detection and source identification are therefore important for insulation assessment, condition diagnosis, and maintenance planning [1–4].
PD diagnosis in GIS may be performed under factory routine tests, on-site dielectric tests, or in-service monitoring, where voltage procedures, interference levels, signal stability, and diagnostic objectives may differ. In addition, the physical size, geometry, and location of insulation defects can influence local electric-field distortion, PD inception, discharge intensity, and the resulting phase-resolved partial discharge (PRPD) characteristics [5,6]. Therefore, PRPD-based recognition results should be interpreted together with the defect configuration and data-acquisition conditions.
PRPD representations organize discharge activity according to phase, magnitude, and occurrence, providing an image-based basis for distinguishing different insulation defects. Recent studies have applied convolutional neural networks (CNNs) and other deep-learning models to PRPD patterns or related PD representations, thereby reducing reliance on manually designed statistical descriptors [7–10]. However, the representation capability of conventional CNNs remains closely related to their receptive-field design and hierarchical feature-extraction strategy, motivating the exploration of more advanced convolutional architectures. ConvNeXt modernizes conventional CNN design through stage-wise scaling, large-kernel depthwise convolution, inverted bottlenecks, and layer normalization (LayerNorm) while retaining a purely convolutional architecture [11]. ConvNeXt V2 further demonstrates the scalability of modern ConvNets through coordinated architectural and training improvements [12]. A recent study also applied ConvNeXt to GIS PD recognition, supporting its suitability as a backbone for this task [13].
Although deep neural networks learn their trainable weights through gradient-based optimization, their predictive performance and training stability still depend on external hyperparameters, such as the learning rate, regularization strength, learning-rate schedule, warm-up duration, and stochastic-depth rate. Hyperparameter optimization therefore constitutes an outer-loop problem distinct from the inner-loop optimization of network weights. Recent studies continue to treat hyperparameter optimization as an integral component of modern machine-learning workflows, covering Bayesian optimization, evolutionary search, multi-fidelity methods, and multi-objective optimization [14–18]. Accordingly, the choice of search strategy should be matched to the characteristics of the task and the available computational budget.
The sparrow search algorithm (SSA) is a population-based optimizer organized around discoverer, follower, and scouter roles [19]. Recent SSA variants have introduced diversity-enhancement, adaptive-perturbation, and staged-search mechanisms to alleviate premature convergence and search stagnation [20–22]. Nevertheless, maintaining an appropriate balance between population diversity and local exploitation remains a practical challenge, particularly when the population gradually concentrates around the current best solution.
In addition, color-to-grayscale conversion is commonly used to reduce the input dimensionality of image-based recognition models. However, different conversion rules preserve chromatic information and contrast structures in different ways, which may alter the discriminative characteristics of PRPD patterns and consequently affect recognition performance [23,24]. Moreover, variations in color composition across PRPD datasets make it difficult for a single fixed conversion method to consistently retain the most informative features.
To address these issues, this study proposes an ISSA-optimized attention-enhanced ConvNeXt model for GIS PD pattern recognition. A multi-criterion grayscale evaluation scheme is first employed to select a suitable grayscale conversion for PRPD patterns, preserving key discharge regions while reducing redundant color interference. The core recognition network is built by embedding the convolutional block attention module (CBAM) into each stage of ConvNeXt and adopting additive angular margin loss (ArcFace), enabling the model to focus on informative discharge features and learn more discriminative representations. To achieve robust hyperparameter optimization, an improved sparrow search algorithm (ISSA) incorporating a partial random-restart mechanism is employed as an outer-loop optimizer for six predefined hyperparameters. The restart mechanism is activated when the search exhibits prolonged stagnation or excessive population concentration, thereby restoring population diversity and reducing the risk of premature convergence. Through these designs, the proposed method effectively improves feature extraction robustness and classification accuracy for GIS PD pattern recognition.
The remainder of this paper is structured as follows. Section 2 introduces the experimental data and basic methods used in this study. Section 3 presents the proposed recognition framework, including adaptive grayscale selection, ISSA-based hyperparameter optimization, and the attention-enhanced ConvNeXt model. Section 4 reports the experimental results and discusses the comparative and ablation analyses. Section 5 concludes the paper.
2.1 Laboratory GIS PD Platform and Simulated Defect Models
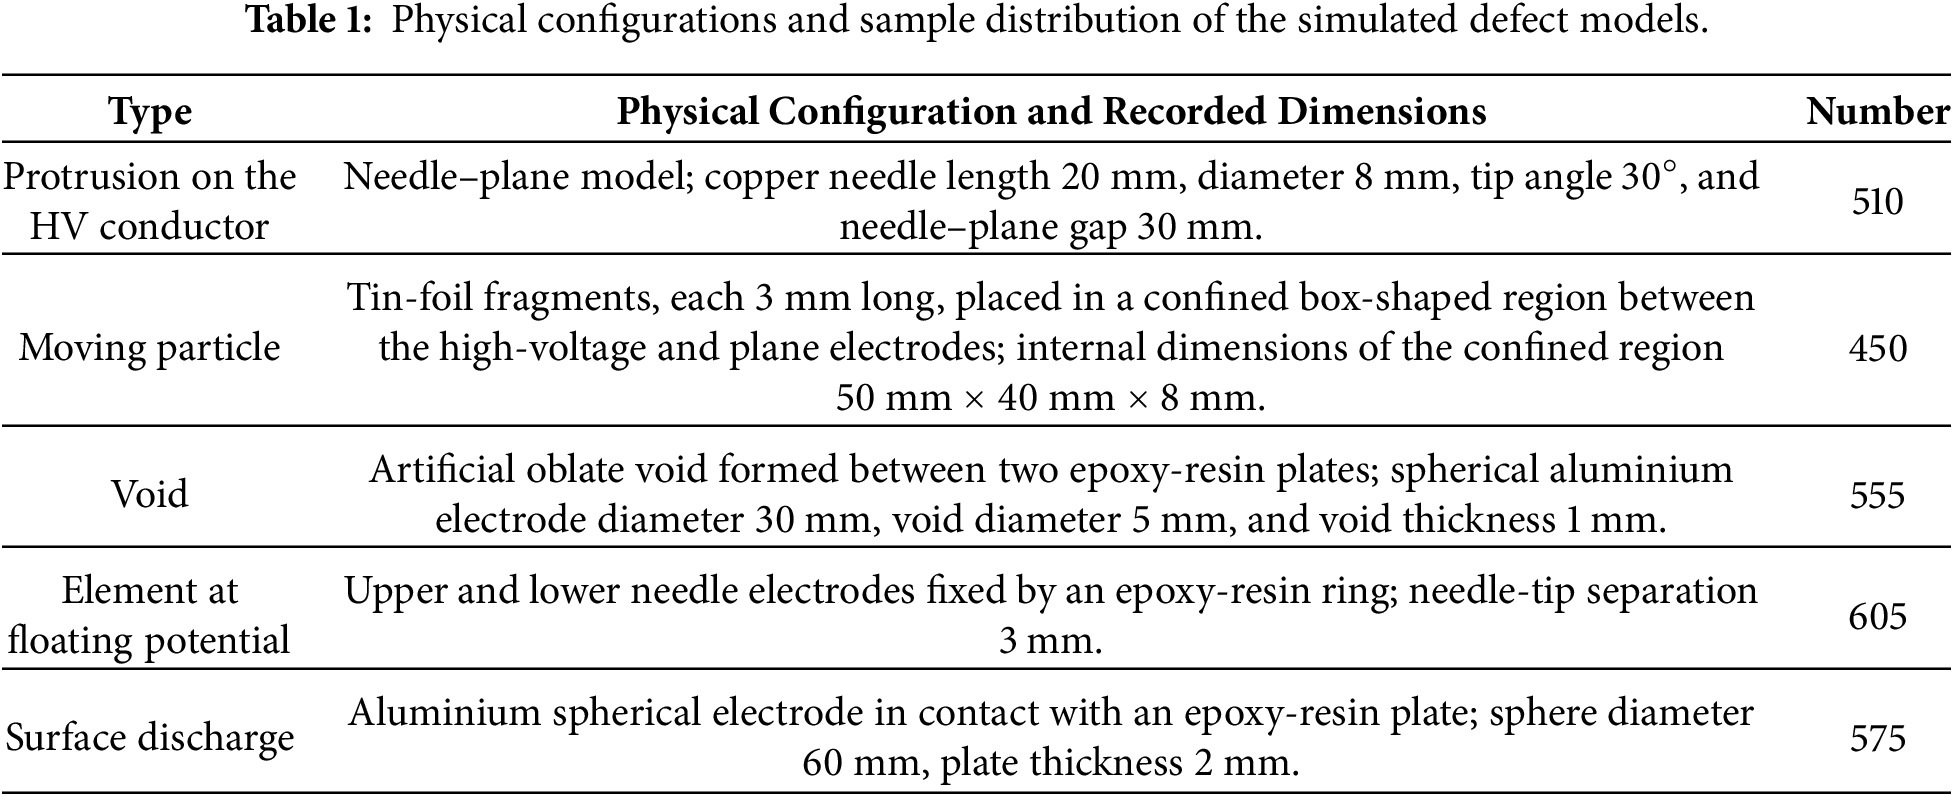
PD is a major factor that can trigger insulation failure in GIS. Defects such as air gaps, burrs, and metallic particles may damage insulation and eventually cause breakdown. The simulated GIS defect categories considered in this study are protrusion on the high-voltage (HV) conductor, void, surface discharge, moving particle, and element at floating potential.
A laboratory PD platform was constructed using an XD5936 GIS simulation chamber. Only one defect model was installed at a time to avoid simultaneous multi-source discharge. The chamber supported SF6 pressures of 0–0.6 MPa and an applied-voltage range of 0–220 kV. PD signals were acquired using an SDMT-PD71 detector with a frequency band of 300–1500 MHz, a dynamic range of −80 to 5 dBm, and a sampling rate of 100 MS/s. The experimental platform and detector are shown in Fig. 1.
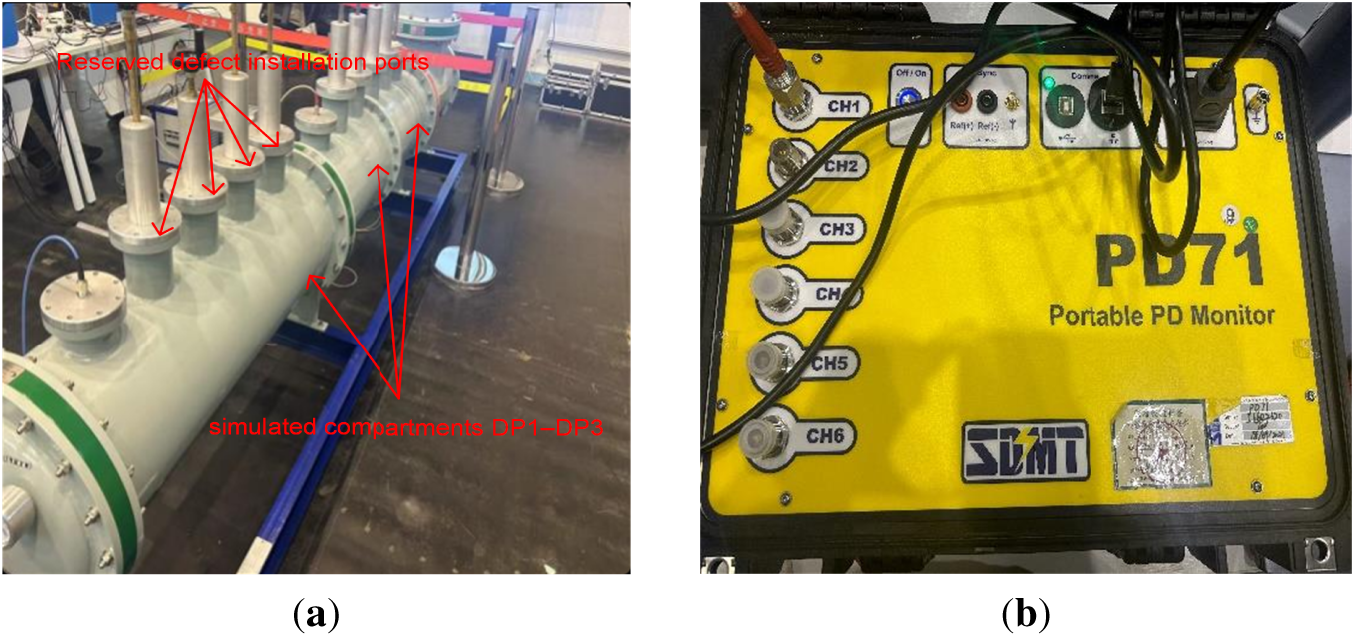
Figure 1: Experimental simulation platform. (a) XD5936 GIS simulation chamber; (b) SDMT-PD71 PD detector. In panel (a), DP1–DP3 denote the three reserved defect-installation positions in the simulated GIS chamber.
The sample distribution of the dataset is shown in Table 1.
Representative PRPD patterns of the five simulated GIS defect models are shown in Fig. 2. During the tests, the applied voltage was gradually increased until measurable PD activity was first detected by the ultra-high-frequency (UHF) measurement system. The recorded PD inception voltages for the five simulated defect categories—protrusion on the HV conductor, void, surface discharge, moving particle, and element at floating potential—were 24, 22, 38, 28, and 25 kV, respectively.
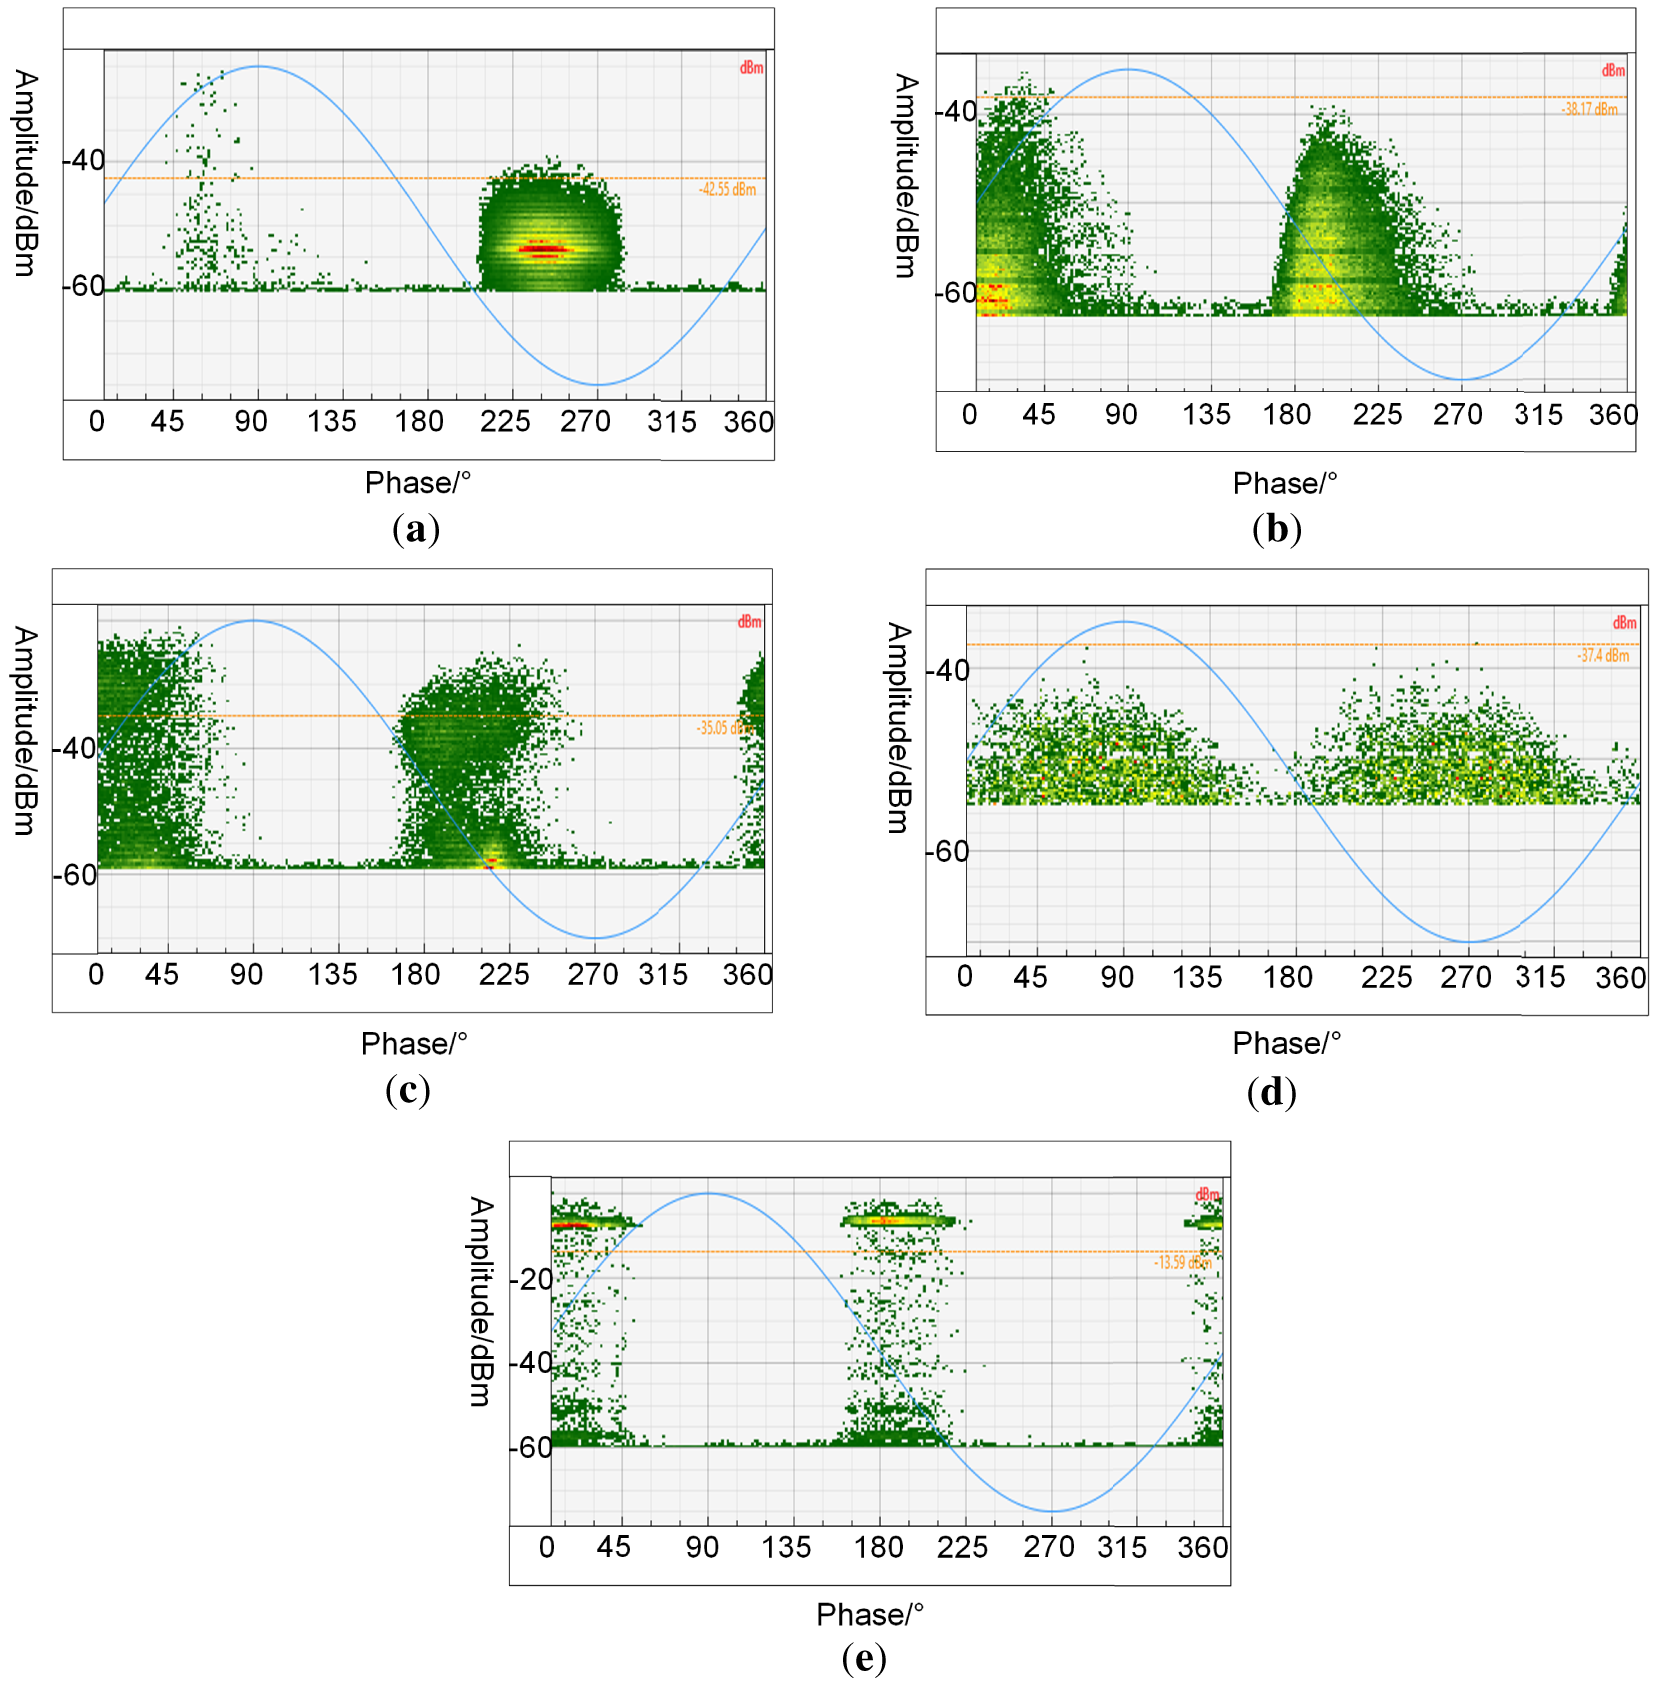
Figure 2: Typical PRPD patterns of partial discharge. (a) Protrusion on the HV conductor; (b) Void; (c) Surface discharge; (d) Moving particle; (e) Element at floating potential.
2.2 Grayscale Conversion and Evaluation Metrics
Image decolorization maps a three-channel red–green–blue (RGB) image to a single intensity channel. Common basic approaches include direct channel selection, arithmetic averaging, weighted luminance conversion, and maximum- or minimum-channel mapping [25]. Although a grayscale representation reduces data dimensionality, it may also suppress chromatic contrasts; accordingly, the conversion method should be selected with reference to the downstream recognition task.
(1) Average method: The average of the RGB channel values is used as the grayscale value, as expressed in Eq. (1):
where
(2) Component method: One of the RGB channels is directly used as the grayscale value. In this study, the green component is adopted, as expressed in Eq. (2):
(3) Maximum and minimum methods: The maximum or minimum channel value among the three RGB components is used as the grayscale value, as expressed in Eq. (3):
(4) Weighted average method: The three RGB channels are combined using different weights, as expressed in Eq. (4):
Among these methods, the component method tends to preserve local details, the average method is simple and computationally efficient, the maximum and minimum methods generate brighter or darker grayscale patterns, respectively, and the weighted average method produces a visually natural brightness distribution. PRPD patterns processed by different grayscale methods are illustrated in Fig. 3.
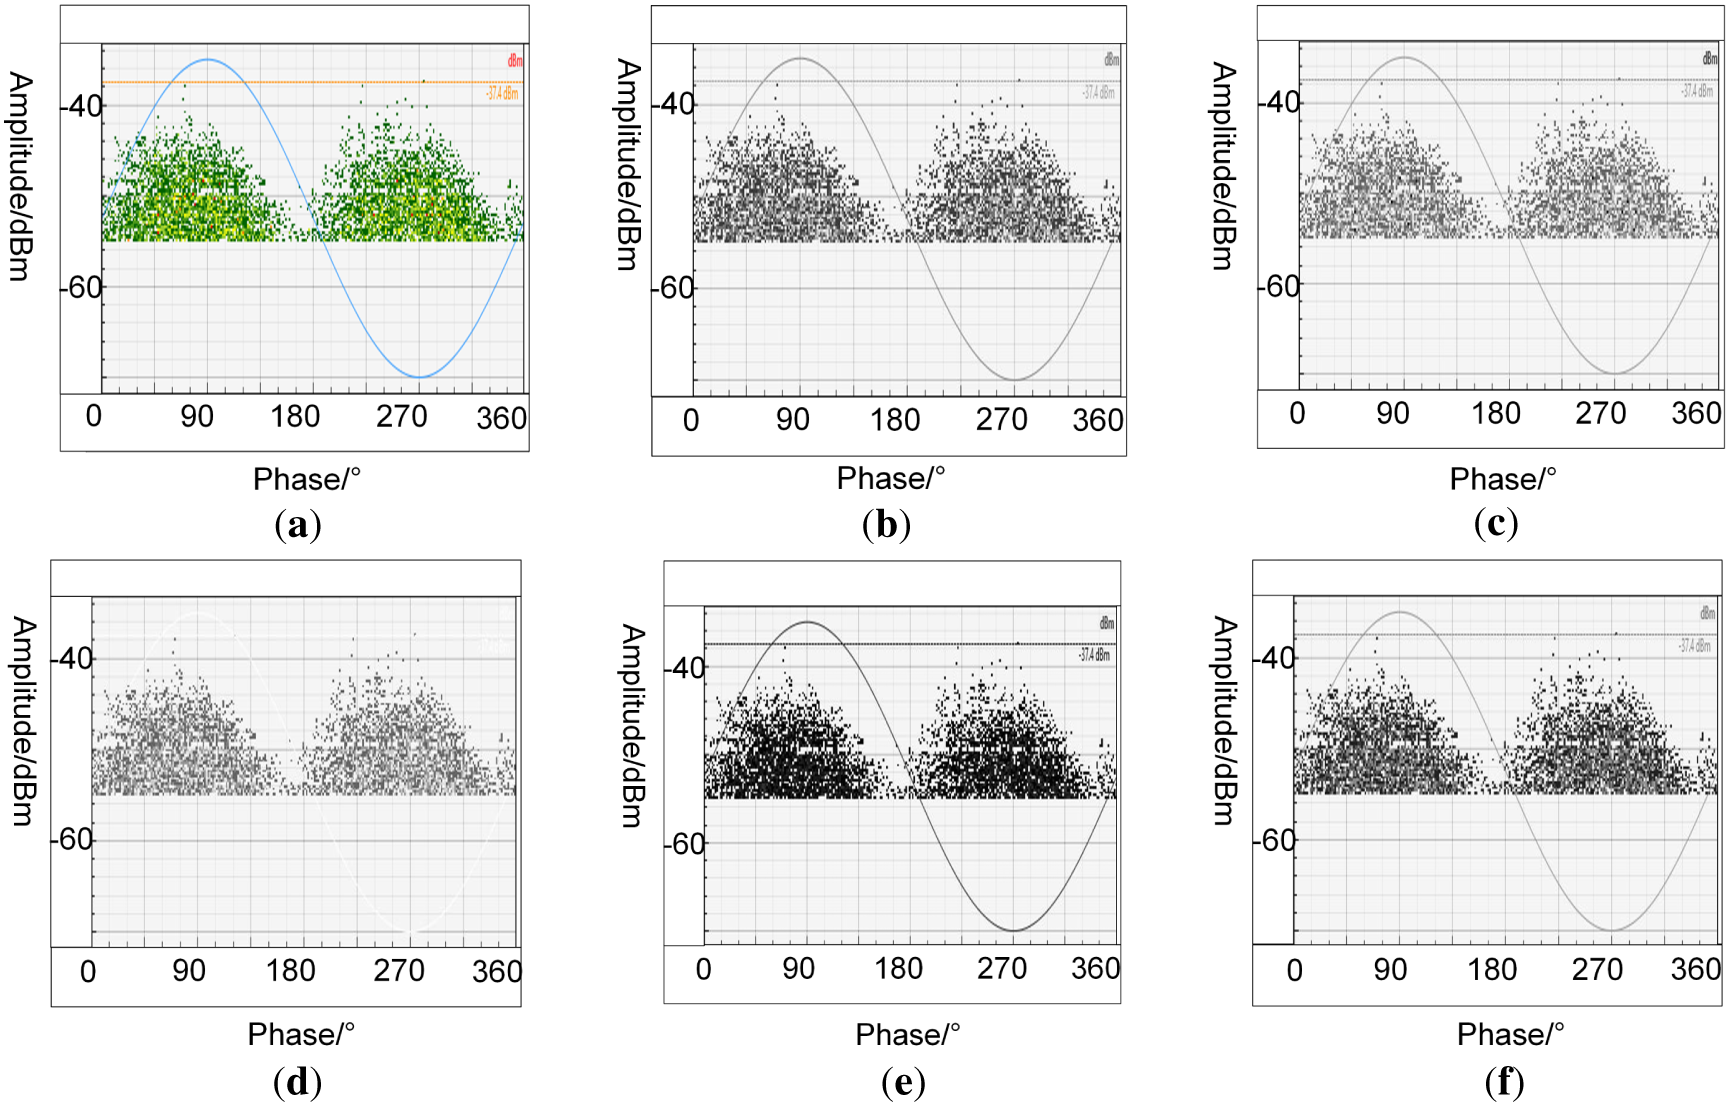
Figure 3: Grayscale images processed with different methods. (a) Original image; (b) Weighted average method; (c) Green channel; (d) Maximum method; (e) Minimum method; (f) Average method.
The grayscale conversion methods were quantitatively evaluated using three metrics: color contrast preserving ratio (CCPR), color contrast fidelity ratio (CCFR), and E-score, which is the harmonic mean of CCPR and CCFR [26]. The three metrics are defined in Eq. (5):
where Ω is the set of color pairs whose color difference between adjacent pixels in the original color image is greater than a threshold, ||Ω|| is the number of elements in Ω, τ is the perceptual difference threshold, and
The SSA is a swarm intelligence optimization algorithm proposed by Xue and Shen in 2020 [19]. It has strong search capability and rapid convergence. The sparrow population is first initialized randomly within the search space, and the fitness of each individual is calculated. According to fitness values, individuals are divided into discoverers, followers, and scouters. Discoverers are responsible for global search; followers conduct local search around the current best individual; and scouters perform random perturbation when a risk of search stagnation is perceived.
The discoverer position update is shown in Eq. (6):
where R is the alarm value, ST is the safety threshold, Q is a random number following a standard normal distribution, L is a
The follower position update is shown in Eq. (7):
where n is the population size,
The scouter position update is shown in Eq. (8):
where
These update rules enable SSA to balance global exploration and local exploitation. However, followers may gradually concentrate around the current best individual as the search proceeds, leading to diversity loss and premature convergence.
ConvNeXt is a pure convolutional neural network proposed by Meta FAIR in 2022 [11]. It modernizes the standard ResNet architecture by using stage-wise scaling, large-kernel convolution, an inverted bottleneck structure, and LayerNorm normalization. Unlike conventional CNNs that often enlarge the receptive field by stacking multiple small convolution kernels, ConvNeXt adopts a modernized convolutional design to capture broader spatial dependencies while maintaining computational efficiency. As shown in Fig. 4, the network follows a hierarchical architecture consisting of a stem layer, four feature extraction stages, a global average pooling layer, and a linear classifier.
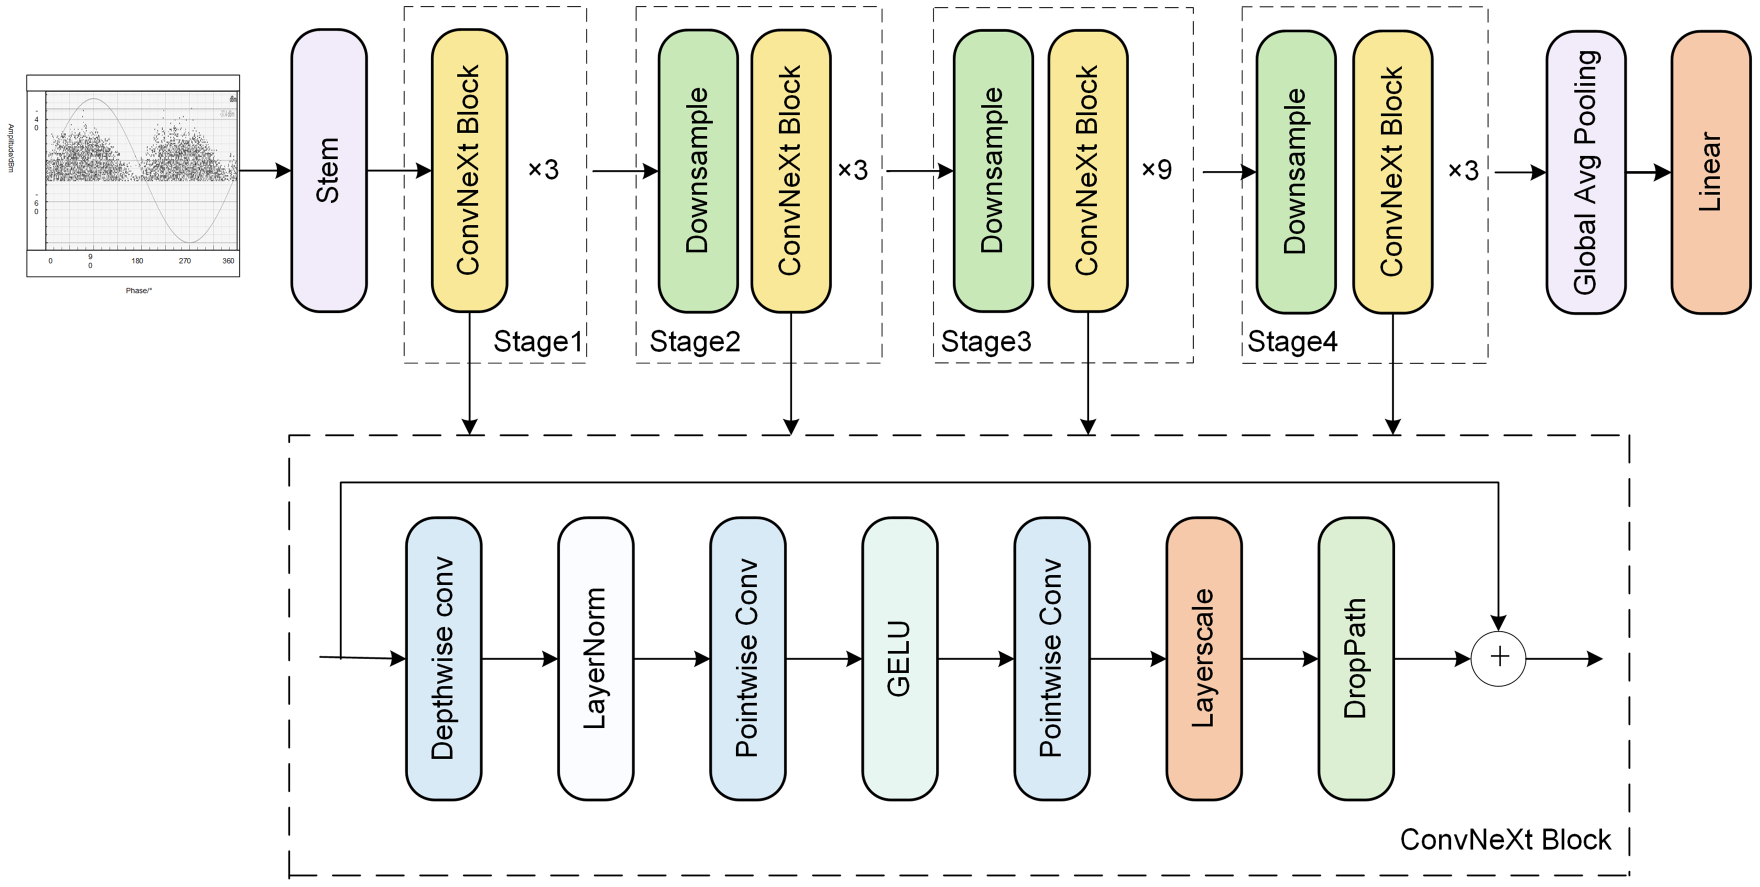
Figure 4: Architecture of the ConvNeXt network and the internal structure of the ConvNeXt block. In the figure, Conv, Avg, LayerNorm, and GELU denote convolution, average pooling, layer normalization, and Gaussian error linear unit, respectively.
The input PRPD image is first processed by the stem layer, where a convolution operation is used for initial downsampling and feature mapping. The extracted features are then passed through four consecutive stages. Each stage contains ConvNeXt blocks, and the number of repeated blocks varies across stages. In the architecture shown in Fig. 4, Stage 1, Stage 2, Stage 3, and Stage 4 contain 3, 3, 9, and 3 ConvNeXt blocks, respectively. Downsampling is performed between adjacent stages to reduce the spatial resolution and increase the feature dimension. Through this hierarchical process, the network progressively transforms low-level texture and edge information into high-level semantic representations. This structure is suitable for PRPD pattern recognition because discharge features may be distributed across different phase intervals and amplitude regions.
The lower part of Fig. 4 illustrates the internal structure of a ConvNeXt block. The block first applies depthwise convolution to extract spatial features independently from each channel. LayerNorm is then used to stabilize feature distribution during training. Two pointwise convolution layers are employed to adjust the channel representation, with GELU inserted between them to enhance nonlinear feature learning. After that, Layer Scale and DropPath are introduced to improve training stability and regularization. A residual connection is retained across the block, allowing the original feature information to be directly propagated to the output and reducing feature degradation in deep networks.
Compared with traditional CNN and ResNet models, ConvNeXt provides a larger receptive field and a stable hierarchical feature extraction structure, allowing it to capture dispersed discharge features in PRPD patterns more effectively. Nevertheless, the original ConvNeXt does not explicitly focus on key feature channels or important spatial regions, and its conventional classification objective may be inadequate when different PD categories exhibit similar pattern distributions.
3 Proposed ISSA-Optimized Attention-Enhanced ConvNeXt Recognition Model
3.1 Adaptive Grayscale Selection Strategy
Color-to-grayscale conversion is a basic preprocessing step, but its difficulty lies in preserving both the global brightness distribution and the color contrast. An adaptive grayscale selection strategy is therefore proposed. Because the grayscale method corresponding to the maximum value of one metric may differ from that of another metric, a hierarchical selection rule is designed to determine the optimal conversion method.
In the proposed strategy, E-score is taken as the primary criterion because it jointly reflects CCPR and CCFR and avoids the bias that may arise from relying on a single metric. The grayscale method with the highest E-score is therefore selected as the preferred method. When several methods obtain the same maximum E-score, CCPR is used as the secondary criterion. In PD pattern recognition, a clear separation between discharge regions and background is essential for reliable classification. A higher CCPR indicates that the grayscale image better preserves regional contrast, producing clearer edges and more separable discharge regions. Under this tie-breaking condition, CCFR is not compared again because the harmonic mean imposes a coupled constraint between CCPR and CCFR.
The adaptive grayscale selection procedure is shown in Fig. 5. The original GIS PRPD patterns are first collected and processed using different grayscale methods. CCPR, CCFR, and E-score are then calculated for each processed image. If the maximum E-score corresponds to only one method, that method is selected. Otherwise, the method with the highest CCPR among the tied candidates is selected.
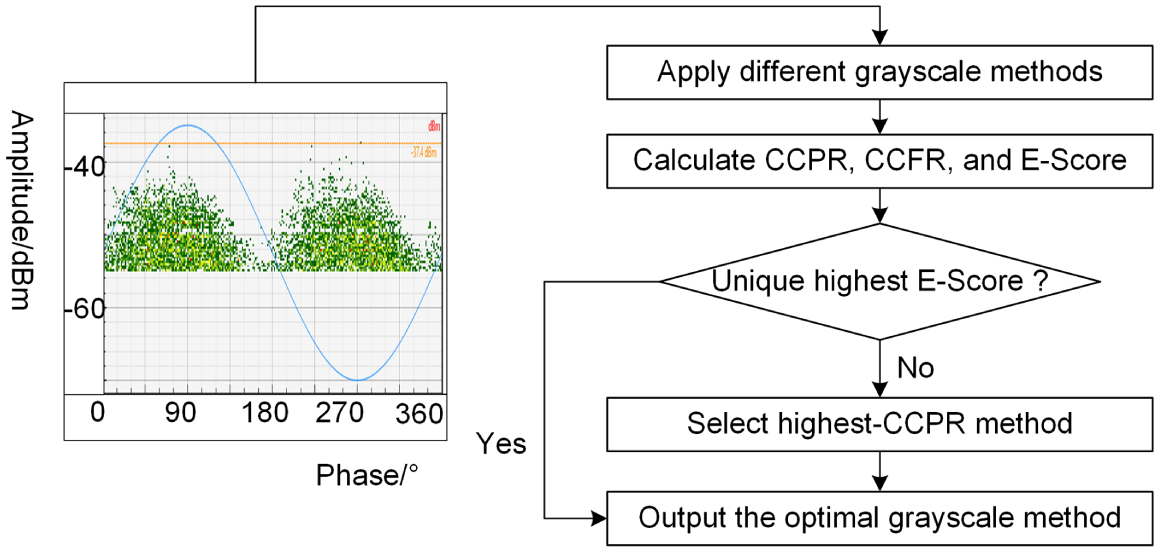
Figure 5: Flowchart of the adaptive grayscale selection strategy.
3.2 Improved Sparrow Search Algorithm
SSA can effectively coordinate global exploration and local exploitation through the collaborative behavior of discoverers, followers, and scouters. However, in the original SSA, the follower strategy drives most individuals toward the current best solution. This tendency can reduce population diversity, weaken global exploration, and increase the risk of being trapped in a local optimum at later iterations. To alleviate this problem, a restart mechanism is introduced in this study.
In each iteration, the positions of the three groups are updated, boundary constraints are handled, fitness values are recalculated, and the individual and global best solutions are updated. The random restart mechanism is controlled by two triggers.
The first trigger is related to fitness improvement. The current best fitness
where
The second trigger monitors population diversity. Let
Thus,
where
If either trigger condition is satisfied, the random restart operation is performed. The top 15% of individuals are retained as the elite set. Among the remaining individuals, the worst 30% are uniformly reinitialized in the search space. This strategy improves the global search ability of SSA while preserving useful historical information.
3.3 Improvement of the ConvNeXt Model
Although ConvNeXt has a strong hierarchical feature extraction structure, the original model does not explicitly emphasize discharge-sensitive channels or informative spatial regions in PRPD patterns. This limitation may weaken key feature representation when different PD categories have similar distributions. Moreover, the conventional Softmax classifier mainly learns decision boundaries for correct classification. It does not directly enforce intra-class compactness or inter-class separation in the feature space. To address these issues, an attention-enhanced ConvNeXt model is built by incorporating CBAM and replacing the Softmax loss with ArcFace loss.
Specifically, a CBAM module is inserted after each stage of the original ConvNeXt network. Given an intermediate feature map, CBAM sequentially infers channel-attention and spatial-attention maps [27]. The channel-attention branch evaluates the relative importance of different feature channels and reweights the input features accordingly. The channel-refined features are then passed to the spatial-attention branch, which identifies informative locations within the feature map. The resulting attention maps are successively multiplied with the input features to produce adaptively refined representations. Through this sequential attention mechanism, the network is encouraged to emphasize discharge-related features while reducing the influence of less relevant responses in PRPD patterns.
In addition, the original Softmax classification layer is replaced with ArcFace loss to improve the discriminability of the learned features. Softmax mainly learns decision boundaries for correct classification, but it does not directly enforce intra-class compactness or inter-class separation in the feature space. ArcFace introduces an additive angular margin into the normalized classification space, explicitly encouraging intra-class compactness and inter-class separation [28]. This property is particularly useful for PRPD pattern recognition, because some discharge types may exhibit similar feature distributions. By combining CBAM-based attention refinement with ArcFace-based discriminative learning, the attention-enhanced ConvNeXt model can better extract key discharge features and reduce inter-class confusion.
With these improvements, the attention-enhanced ConvNeXt model can highlight key discharge features during feature extraction and reduce confusion among visually similar PD categories. This design improves both recognition accuracy and robustness.
3.4 Construction of the ISSA-Optimized Attention-Enhanced ConvNeXt Model
The proposed GIS PD recognition framework consists of the following three stages: PRPD preprocessing, hyperparameter optimization of the attention-enhanced ConvNeXt model using ISSA, and GIS PD classification using the optimized recognition model. The overall recognition process is shown in Fig. 6.
(1) PRPD pattern preprocessing. The original PRPD patterns are first processed using the proposed adaptive grayscale selection strategy. The grayscale method with the best evaluation performance is selected according to the grayscale assessment criteria. After grayscale conversion, marginal regions that may interfere with recognition, such as reference signal lines and background areas, are removed. All images are then resized to 128 × 128 pixels for standardized model input.
(2) Population initialization. In the ISSA optimization stage, the sparrow population is initialized using a uniform random distribution within the predefined search space. Each individual represents a candidate hyperparameter combination of the attention-enhanced ConvNeXt model, including the learning rate, weight decay, warm-up epochs, minimum learning rate, exponential moving average decay, and stochastic depth drop-path rate. In this way, the hyperparameter optimization problem is transformed into a population-based search problem.
(3) Fitness evaluation and position update. For each individual, the corresponding hyperparameter combination is assigned to the attention-enhanced ConvNeXt model, and the model performance on the validation set is used to calculate the fitness value. According to the fitness values, individuals are divided into discoverers, followers, and scouters. Their positions are then updated based on the SSA update rules, allowing the population to search for better hyperparameter combinations. After boundary processing, the individual best solution and the global best solution are updated.
(4) Random restart judgment. To reduce premature convergence, the search state is monitored from two aspects: fitness improvement and population diversity. If the best fitness does not show an effective improvement over consecutive iterations, the search is regarded as stagnant. If the population diversity falls below the preset threshold, the individuals are considered overly concentrated. Once either condition is satisfied, the random restart mechanism is triggered.
(5) Partial population restart and iterative optimization. During the restart operation, elite individuals with better fitness values are retained to preserve useful search information. A portion of poorly performing individuals is then reinitialized within the search space to restore population diversity and enhance global exploration. The optimization process continues until the maximum number of iterations is reached. When the stopping condition is satisfied, the best hyperparameter combination is output.
(6) Model training and recognition. The optimized hyperparameters are used to construct the final ISSA-optimized attention-enhanced ConvNeXt recognition model. The preprocessed PRPD patterns are then input into the model for training and classification. Five-fold cross-validation is adopted to evaluate the recognition performance, and the final classification results are obtained based on the trained model.
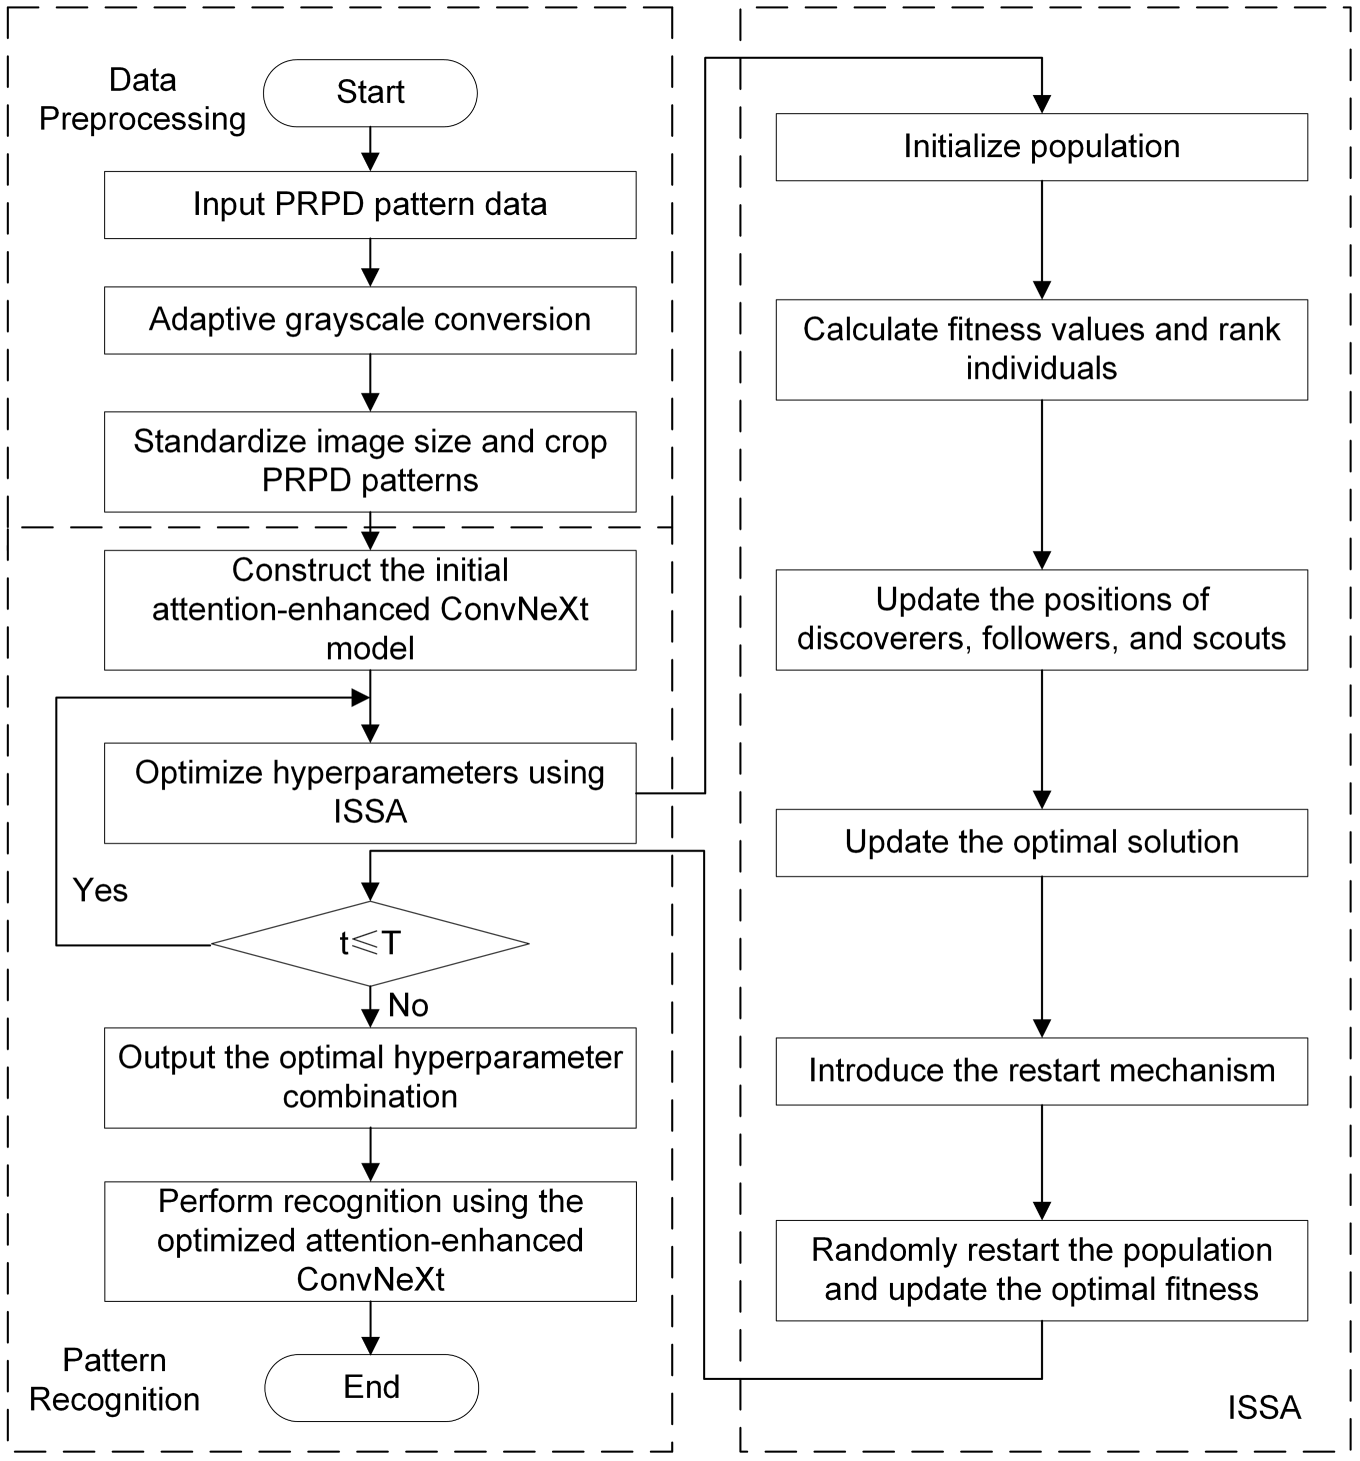
Figure 6: Flowchart of the proposed recognition model.
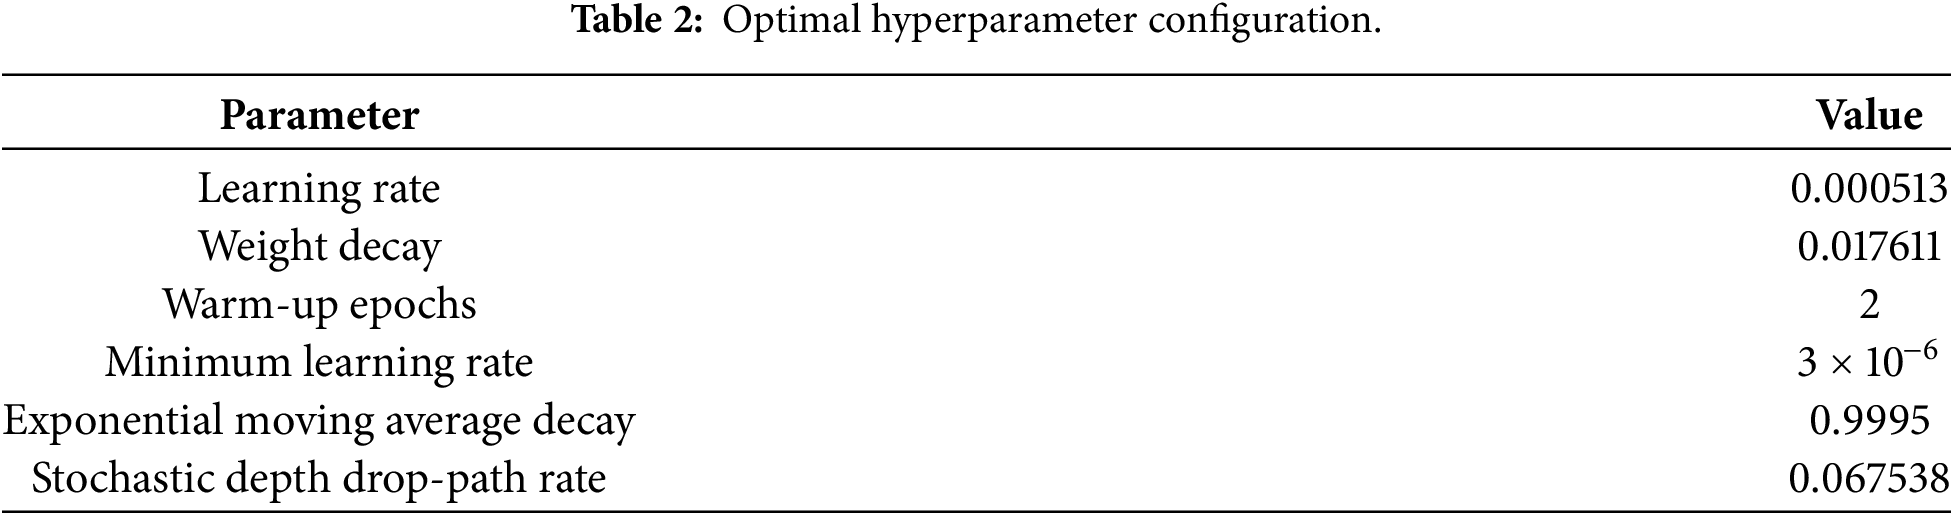
All experiments were implemented in the PyTorch framework. The ISSA optimizer was used to search for the hyperparameters of the attention-enhanced ConvNeXt model. The optimal configuration is listed in Table 2.
A stratified five-fold cross-validation procedure was used to evaluate the models. The dataset contained 2695 PRPD images. In each fold, 2156 images were used for training and 539 images were used for validation; each image served as a validation sample exactly once. The out-of-fold predictions from the five validation subsets were then combined to form a single confusion matrix covering all 2695 samples.
4.1 Evaluation of Grayscale Selection and Data Preprocessing
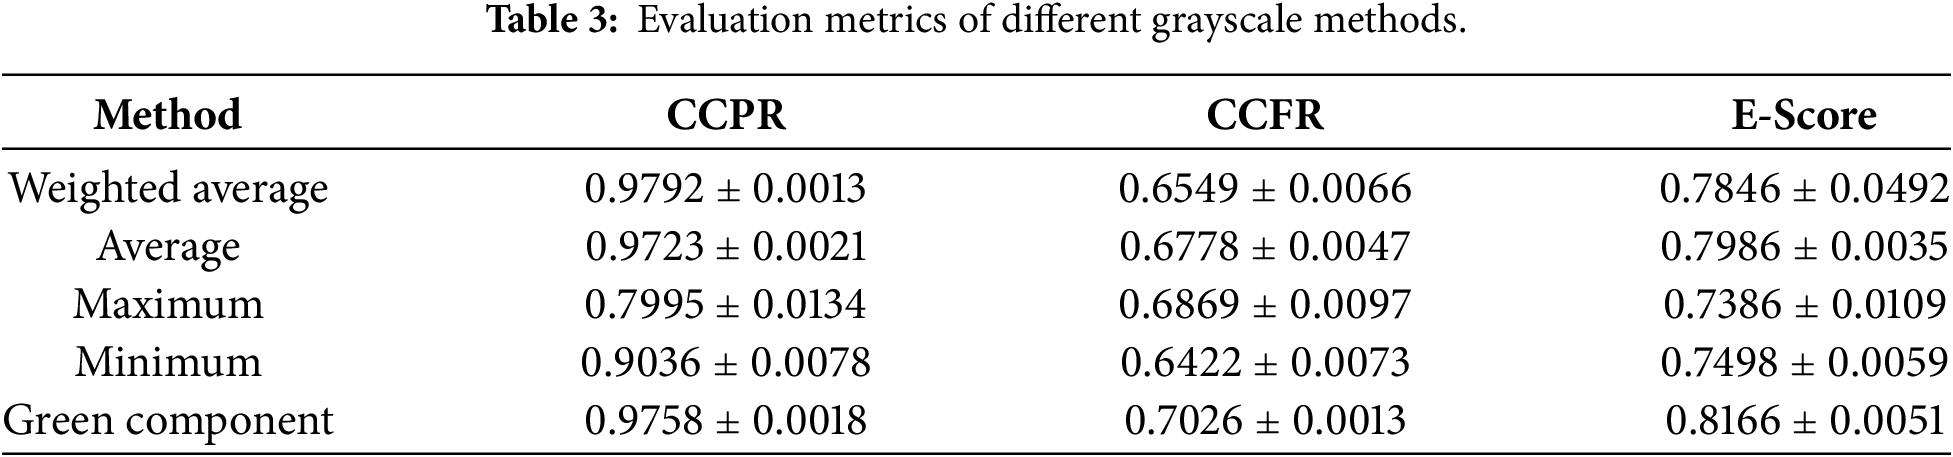
The adaptive grayscale selection strategy was validated using simulated typical GIS PD patterns. To objectively compare the effects of different grayscale methods and reduce random errors from a single trial, 30 samples were randomly selected from the discharge images of the five defect categories, and 10 independent experiments were conducted.
The metric values for each method are given in Table 3. The green-component method produced the highest E-score and CCFR, indicating the best overall performance in preserving color contrast and retaining discharge-feature regions. Although the weighted average method obtained a slightly higher CCPR, its CCFR was markedly lower, suggesting that the linear fusion of the three channels weakened the contrast of key feature regions. The maximum method was more susceptible to background interference, while the minimum method excessively suppressed the brightness of discharge regions. Both methods therefore failed to effectively preserve the original feature distribution of PRPD patterns. In comparison, the green component retained the main brightness distribution and provided higher-quality grayscale images for subsequent recognition. Accordingly, the green-component method was selected for grayscale conversion in this study.
After grayscale conversion, the color channels were simplified to improve computational efficiency. However, the patterns still contained irrelevant information that could introduce noise and bias into subsequent feature extraction and classifier training. In addition, inconsistent image sizes could affect deep learning model operation. Therefore, the grayscale images were further processed by cropping the marginal regions that interfered with recognition, including reference sinusoidal signal lines and background areas, and by resizing all images to 128 × 128 pixels.
To evaluate the adaptive grayscale selection strategy, the original RGB and grayscale PRPD patterns were separately fed into the ISSA-optimized attention-enhanced ConvNeXt model, and the results are shown in Table 4.
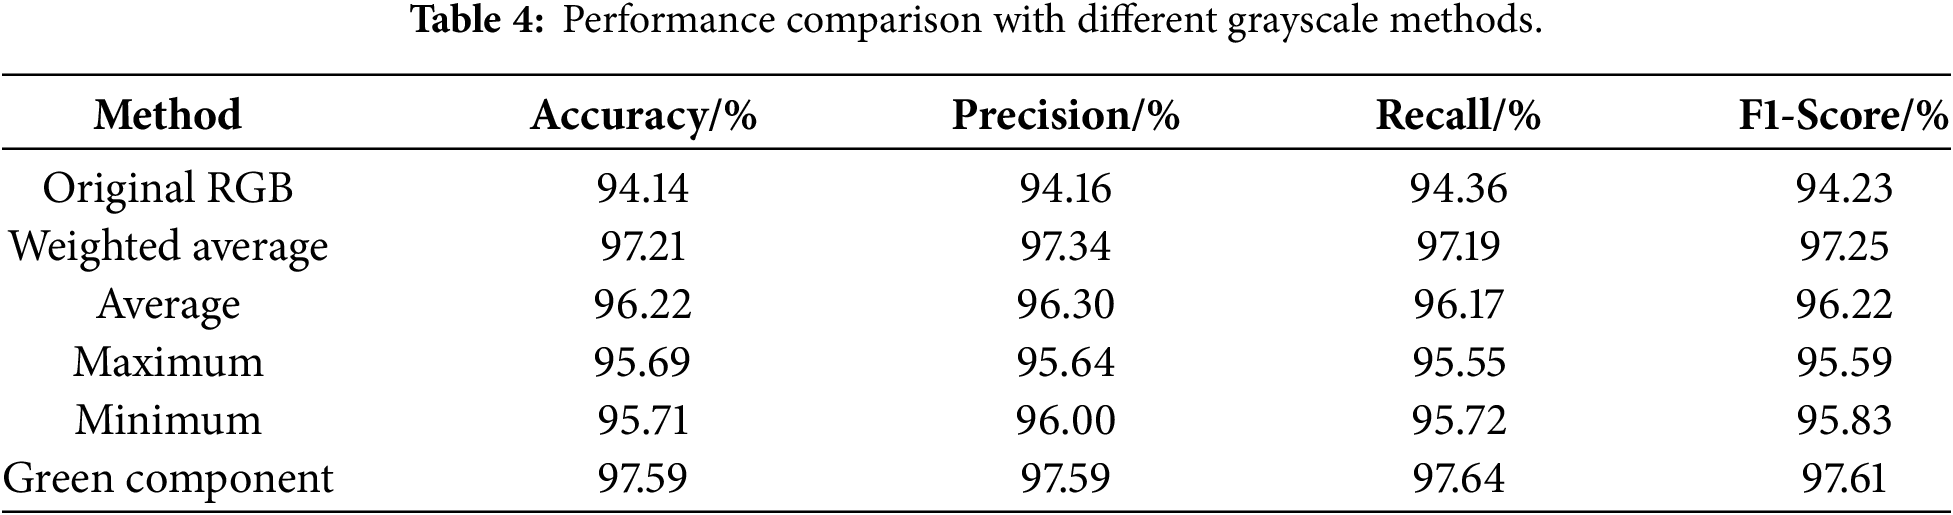
The original RGB input achieved an accuracy of 94.14% and an F1-score of 94.23%, whereas the green-component method achieved 97.59% and 97.61%, respectively. The improvements are mainly attributed to the yellow-green distribution of high-density discharge regions, which allows the green channel to retain key discharge information while reducing redundant color and background interference. The other grayscale methods may weaken local contrast, introduce noise, or distort texture information. These results agree with the metric-based evaluation in Table 3 and confirm the effectiveness of the adaptive grayscale selection strategy.
4.2 Sensitivity Analysis of the Restart Thresholds
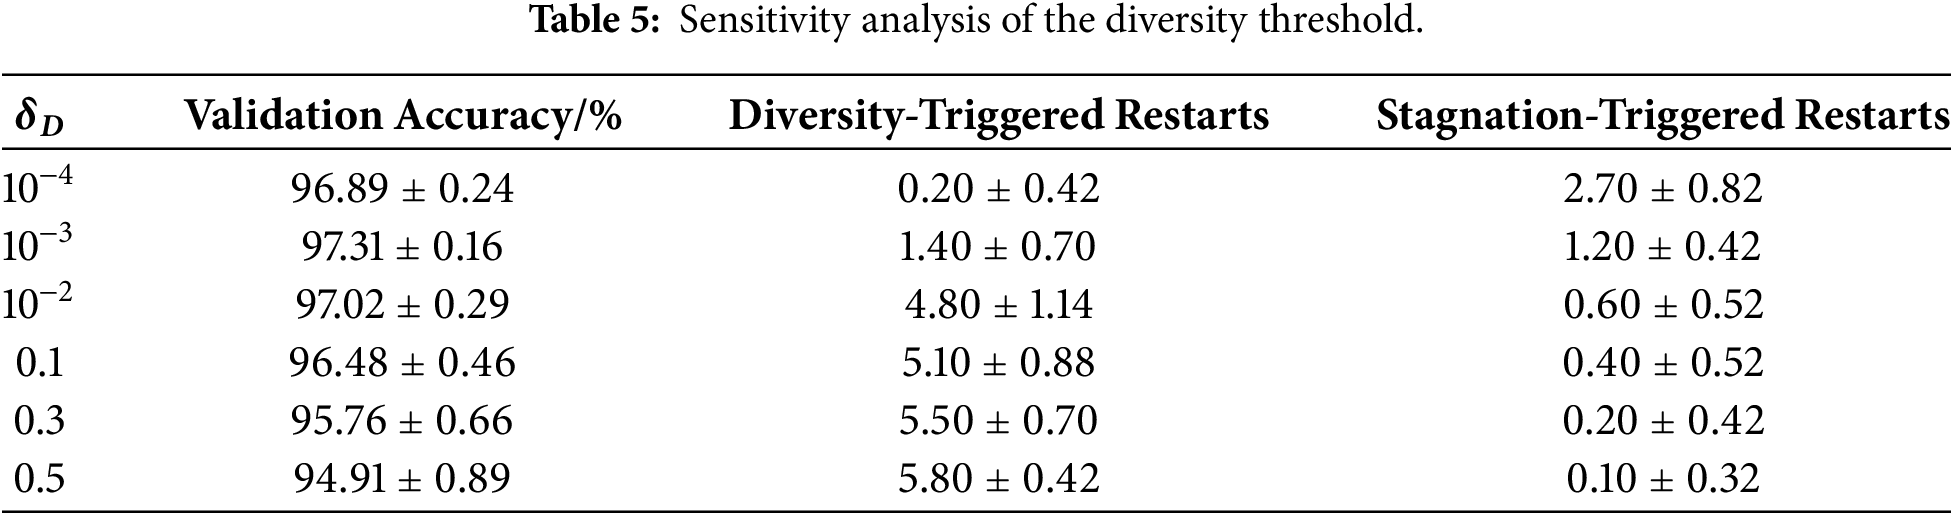
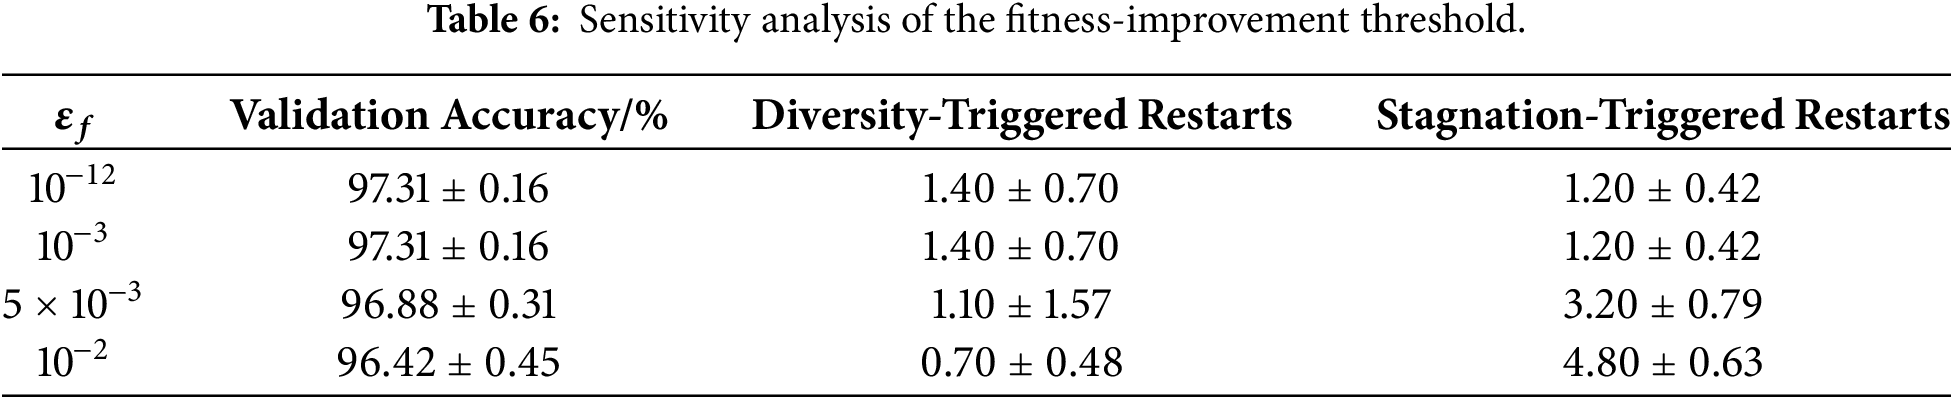
Sensitivity analyses were conducted for the diversity threshold
4.2.1 Diversity-Threshold Sensitivity
To examine the influence of the diversity threshold on restart behavior, different values of
4.2.2 Fitness-Improvement-Threshold Sensitivity
To evaluate the influence of the fitness-improvement threshold on stagnation detection, different values of
4.3 Comparison with Different Recognition Models
To evaluate the effectiveness of the ISSA-optimized attention-enhanced ConvNeXt model, it was compared with CNN, ResNet18, ResNet50, ResNet101, and ResNet152. To ensure a fair and reproducible comparison, the baseline models retained their standard network configurations, with only the final classification layer modified for the five-class PRPD recognition task. The CNN baseline consisted of three convolutional blocks with 32, 64, and 128 output channels, respectively, each followed by max pooling, and a fully connected classifier with five output units. ResNet18 adopted the BasicBlock configuration [2, 2, 2, 2], whereas ResNet50, ResNet101, and ResNet152 adopted the Bottleneck configurations [3, 4, 6, 3], [3, 4, 23, 3], and [3, 8, 36, 3], respectively [29]. All baseline models were trained for 50 epochs using the Adam optimizer, with an initial learning rate of 0.001 and a batch size of 32. The same data partitions, preprocessing procedure, and evaluation metrics were used for all comparison models, and ISSA-based hyperparameter search was not applied to the baseline models. The results are listed in Table 7.
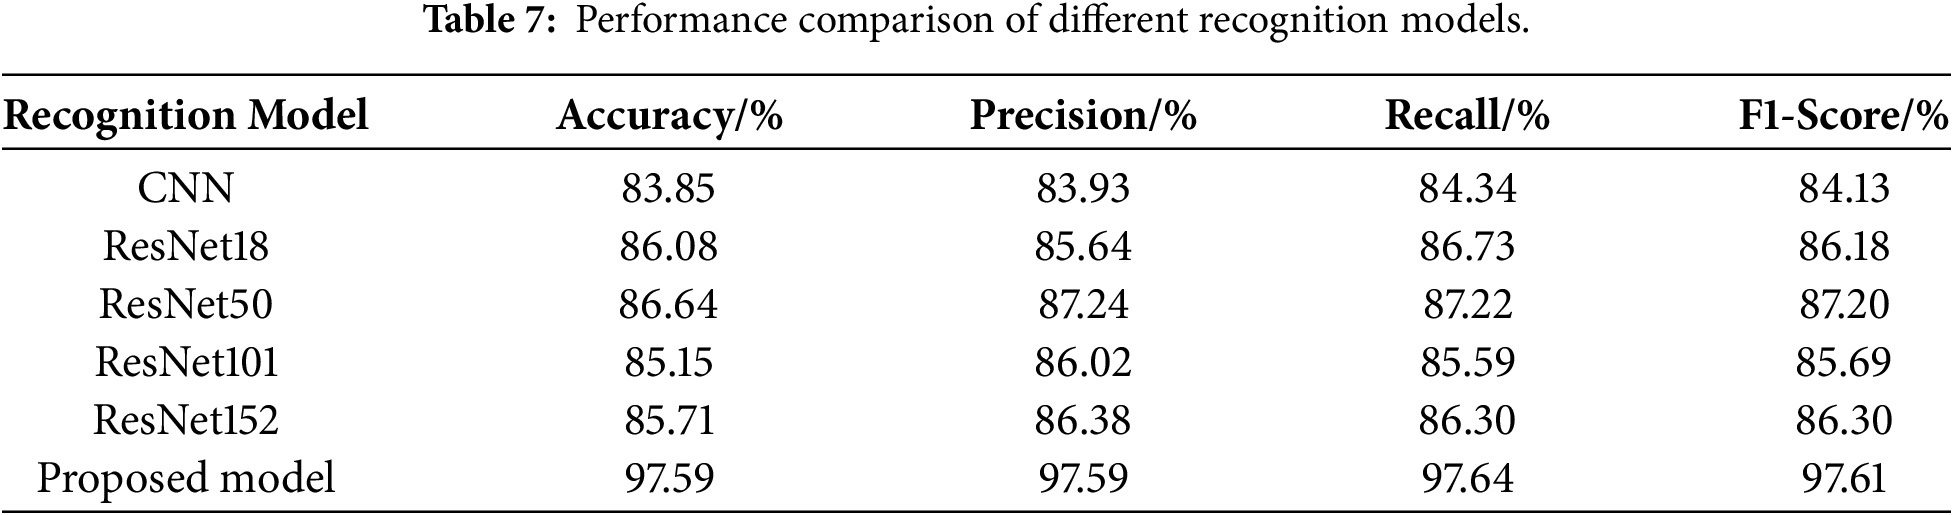
The proposed model achieved an accuracy of 97.59%, a precision of 97.59%, a recall of 97.64%, and an F1-score of 97.61%, demonstrating high recognition performance in GIS PD pattern recognition. The CNN reached an accuracy of only 83.85%, indicating that conventional convolutional models are limited by fixed convolutional receptive fields and have difficulty capturing long-range dependencies among discharge features distributed across different phase intervals in PRPD patterns. Among the ResNet models, ResNet50 achieved the highest accuracy of 86.64%, outperforming ResNet18, ResNet101, and ResNet152, whose accuracies were 86.08%, 85.15%, and 85.71%, respectively. Model performance did not improve monotonically with depth. This suggests that the feature complexity of the PRPD recognition task is relatively limited, and overly deep networks may introduce redundant parameters and weaken the focus on key features. ResNet18 is too shallow to extract sufficiently discriminative features, whereas ResNet50 provides a better balance between feature extraction capability and parameter redundancy. In contrast, the proposed model benefits from the larger convolution kernels and hierarchical structure of ConvNeXt, which provide a broader receptive field for capturing discharge features. CBAM further guides the network toward key discharge regions, and ArcFace loss improves feature discriminability. Consequently, the proposed model outperforms the comparison models in both feature extraction and classification performance.
An ablation study was conducted to evaluate the contribution of each module. The results are shown in Table 8. M1 denotes the original ConvNeXt network; M2 denotes ConvNeXt with CBAM; M3 denotes the improved ConvNeXt model with both CBAM and ArcFace loss; M4 denotes the SSA-optimized attention-enhanced ConvNeXt; and M5 denotes the ISSA-optimized attention-enhanced ConvNeXt.
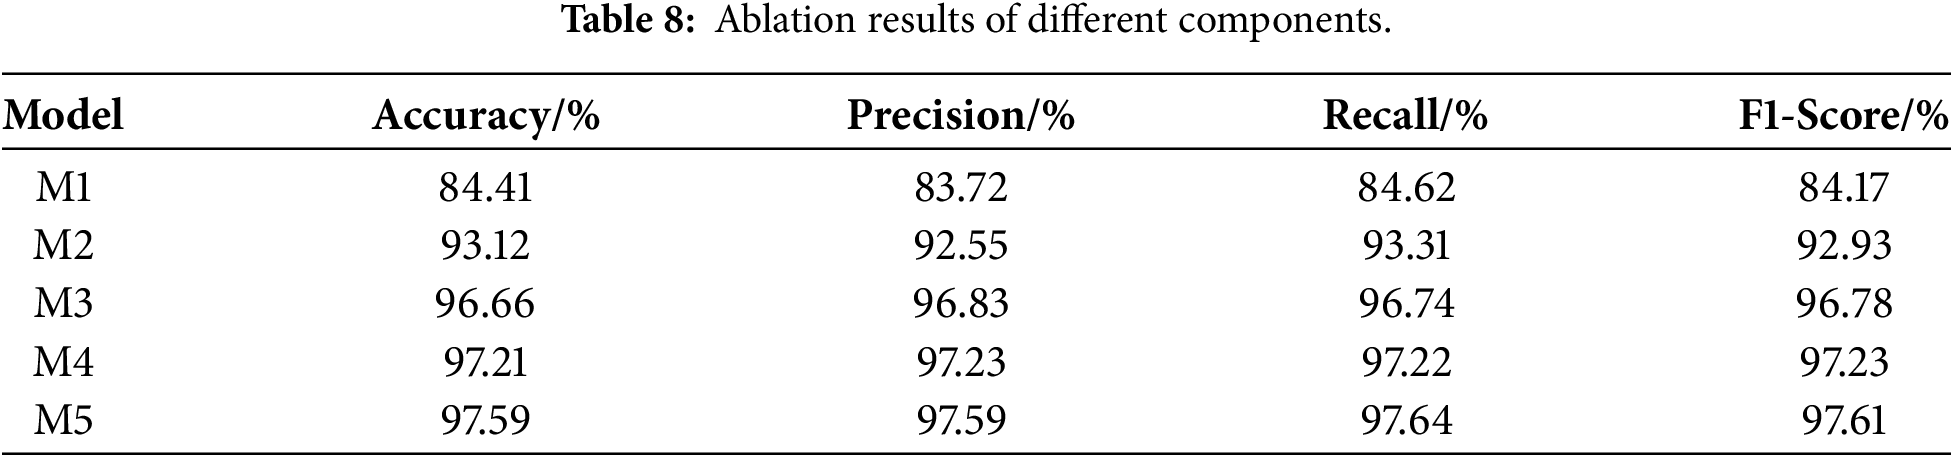
To further illustrate the class-wise recognition behavior of each ablation model, the corresponding confusion matrices are presented in Fig. 7. The original ConvNeXt achieved an accuracy of only 84.41%. Although this network uses large convolution kernels and a hierarchical structure, it lacks an explicit mechanism for selecting discharge-sensitive features, which limits its ability to extract discriminative information from PRPD patterns. With CBAM incorporated, the accuracy increased to 93.12%, showing that channel and spatial attention can guide the model toward informative discharge regions and suppress less relevant features. The use of ArcFace loss raised the accuracy to 96.66%, suggesting that angular-margin learning improves the separability of different PD categories in the feature space. Hyperparameter optimization with SSA further improved the accuracy to 97.21%, as the optimizer searched for a configuration better matched to the dataset. When the random restart mechanism was introduced, the ISSA-optimized model reached the highest accuracy of 97.59%. This improvement indicates that the restart strategy helps the optimizer escape local optima and reduces premature convergence. Overall, M5 achieved the best performance across all metrics, confirming the contribution of adaptive attention, discriminative loss learning, and ISSA-based optimization to GIS PD pattern recognition. For M5, the main residual confusion occurred between void and surface discharge: 14 void samples were classified as surface discharge, whereas 11 particle-on-the-spacer-surface samples were classified as void. The other three categories exhibited only a few misclassifications.
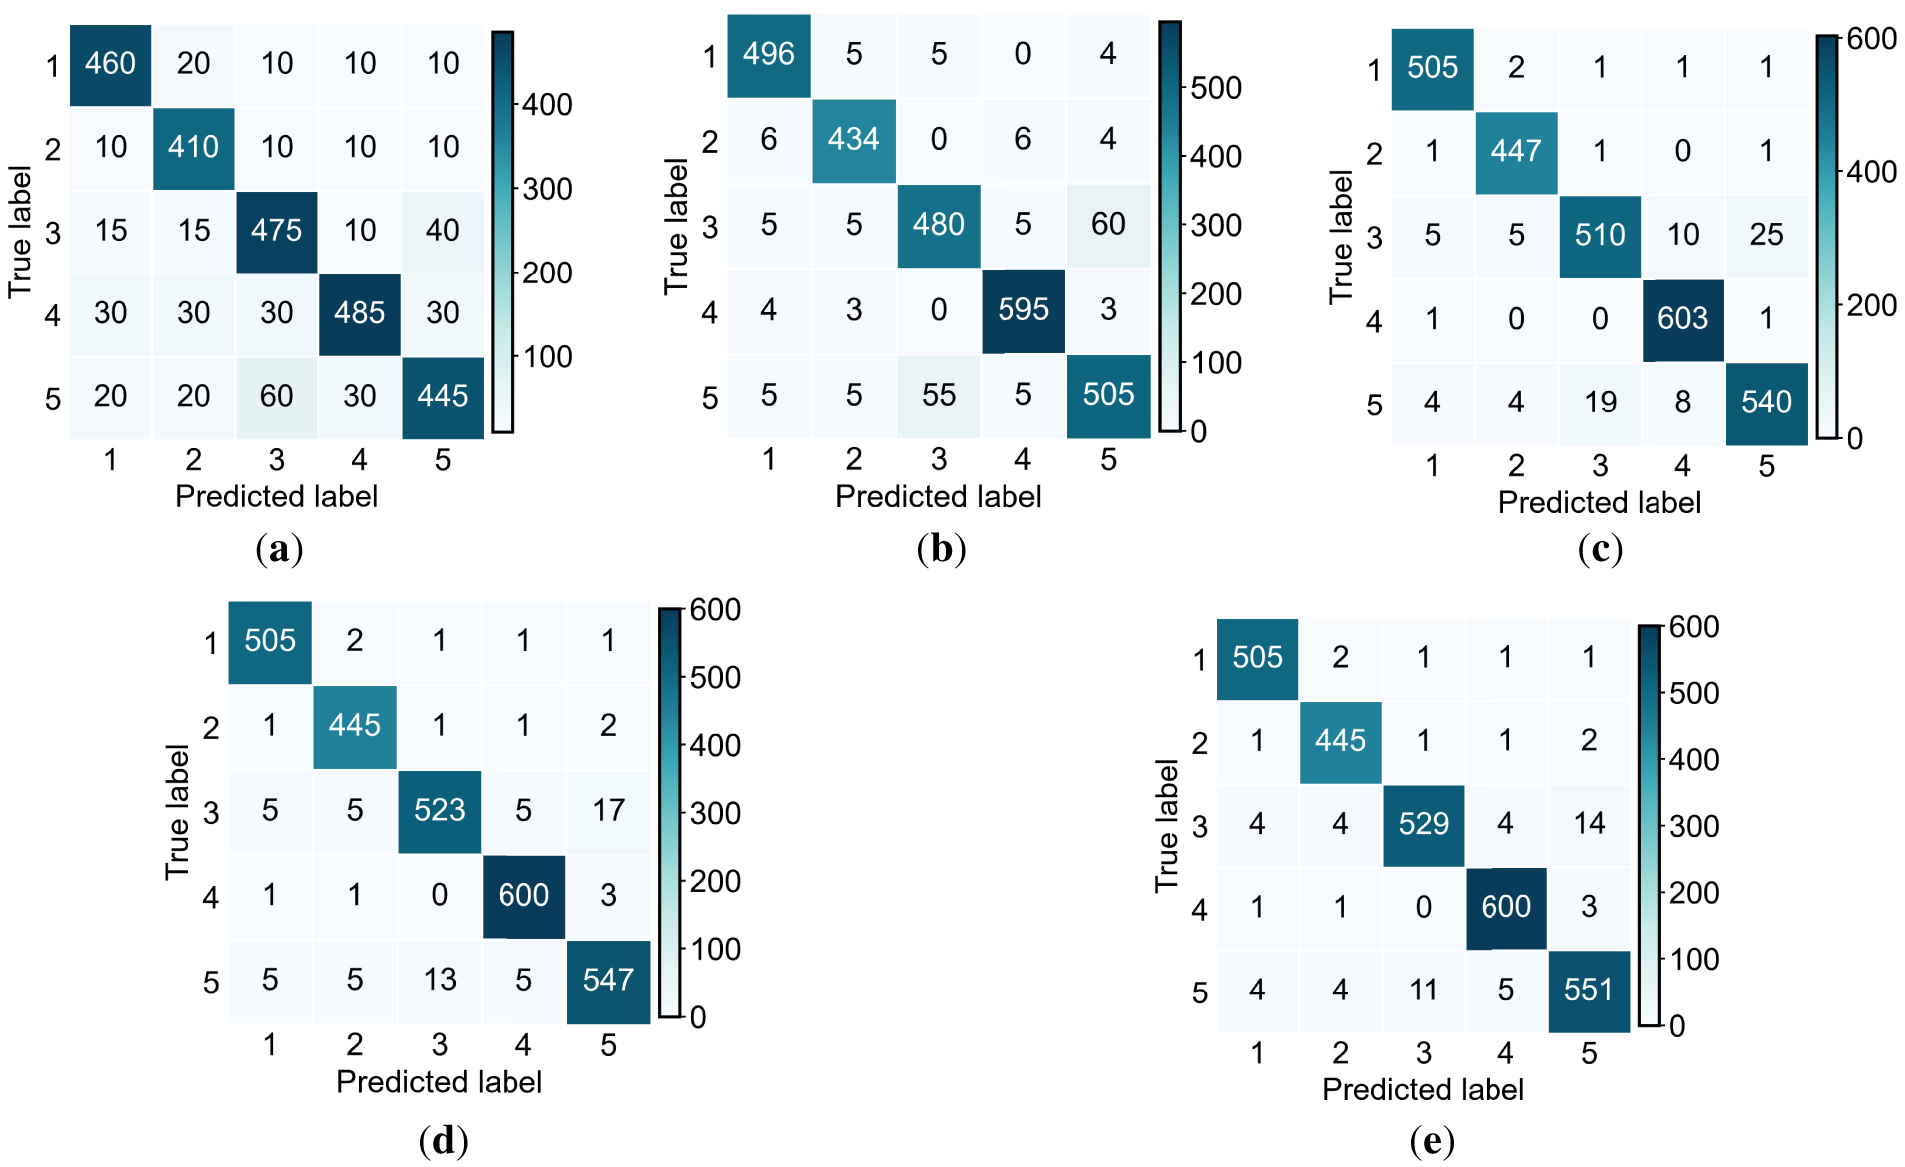
Figure 7: Confusion matrices of the ablation models for GIS PD pattern recognition. (a) M1; (b) M2; (c) M3; (d) M4; (e) M5. Rows represent true labels, and columns represent predicted labels. The class labels 1–5 denote protrusion on the HV conductor, moving particle, void, element at floating potential, and surface discharge, respectively.
This paper develops a GIS PD pattern recognition method that combines adaptive grayscale selection and an ISSA-optimized attention-enhanced ConvNeXt model. In the proposed model, CBAM is embedded to enhance key discharge feature extraction, while ArcFace loss is introduced to improve feature discrimination among different PD categories. A multi-criterion grayscale evaluation scheme based on CCPR, CCFR, and E-score is established to guide grayscale method selection. The results show that the proposed strategy can adaptively select a suitable grayscale conversion method according to PRPD pattern characteristics, thereby providing cleaner and more informative inputs for subsequent recognition.
To improve hyperparameter optimization, a random restart mechanism is incorporated into SSA. By monitoring fitness stagnation and population concentration, the mechanism partially reinitializes the population when either trigger condition is satisfied. The sensitivity results indicate that appropriate threshold settings can maintain population diversity without causing excessively frequent restarts.
The recognition model is further enhanced by embedding CBAM into ConvNeXt and introducing ArcFace loss to improve feature discrimination. After ISSA-based optimization, the proposed model achieves an accuracy of 97.59% for five typical PD pattern recognition tasks, with precision, recall, and F1-score reaching 97.59%, 97.64%, and 97.61%, respectively. The performance is consistently better than that of CNN and ResNet-series models, confirming the effectiveness of the proposed method for GIS PD pattern recognition.
Some limitations remain. The experimental data used in this study were collected from a single experimental platform, and the generalization ability of the model under different operating conditions still needs further validation. Future work will focus on expanding the data sources and evaluating the robustness of the method in more complex field scenarios.
Acknowledgement: Not applicable.
Funding Statement: This research was funded by the National Natural Science Foundation of China, grant number 52207156; the Major Special Project of Xinjiang Uygur Autonomous Region, grant number 2025A01006-3; and the Key Research and Development Project of Xinjiang Uygur Autonomous Region, grant number 2024B04002-1.
Author Contributions: Rui Huang contributed to methodology, validation, formal analysis, investigation, writing—original draft preparation, visualization, and all major research work. Ziwei Zhang and Kari Tusongjiang contributed to conceptualization, supervision, project administration, funding acquisition, and writing—review and editing. Bowen Zhang and Ning Yang provided experimental resources and technical support and participated in result discussion. Xiaowei Li and Aimudula Maierdan performed data curation. All authors reviewed and approved the final version of the manuscript.
Availability of Data and Materials: Data not available due to commercial restrictions.
Ethics Approval: Not applicable.
Conflicts of Interest: The authors declare no conflicts of interest.
References
1. Kaziz S, Hadj Said M, Imburgia A, Maamer B, Flandre D, Romano P, et al. Radiometric partial discharge detection: a review. Energies. 2023;16(4):1978. doi:10.3390/en16041978. [Google Scholar] [CrossRef]
2. CIGRE Working Group D1.03. Risk assessment on defects in GIS based on PD diagnostics. Paris, France: CIGRE; 2013. Technical Brochure No. 525. [Google Scholar]
3. Xu Z, Xu H, Yuan C, Chen S, Chen Y. Recognition of partial discharge in GIS based on image feature fusion. AIMS Energy. 2024;12(6):1096–112. doi:10.3934/energy.2024052. [Google Scholar] [CrossRef]
4. Fang W, Chen G, Li W, Xu M, Xie W, Chen C, et al. A PRPD-based UHF filtering and noise reduction algorithm for GIS partial discharge. Sensors. 2023;23(15):6763. doi:10.3390/s23156763. [Google Scholar] [PubMed] [CrossRef]
5. CIGRE Working Group D1.25. UHF partial discharge detection system for GIS: application guide for sensitivity verification. Paris, France: CIGRE; 2016. Technical Brochure No. 654. [Google Scholar]
6. CIGRE Working Group D1.66. Requirements and application of UHF PD monitoring systems for gas insulated systems. Paris, France: CIGRE; 2024. Technical Brochure No. 933. [Google Scholar]
7. Zheng J, Chen Z, Wang Q, Qiang H, Xu W. GIS partial discharge pattern recognition based on time-frequency features and improved convolutional neural network. Energies. 2022;15(19):7372. doi:10.3390/en15197372. [Google Scholar] [CrossRef]
8. Chen YZ, Peng XS, Wang HY, Zhou J, Zhang Y, Liang ZM. Generator stator partial discharge pattern recognition based on PRPD-Grabcut and DSC-GoogLeNet deep learning. IEEE Trans Dielectr Electr Insul. 2023;30(5):2267–76. doi:10.1109/TDEI.2023.3275548. [Google Scholar] [CrossRef]
9. Chen CH, Chou CJ. Deep learning and long-duration PRPD analysis to uncover weak partial discharge signals for defect identification. Appl Sci. 2023;13(19):10570. doi:10.3390/app131910570. [Google Scholar] [CrossRef]
10. Sun C, Wu G, Pan G, Zhang T, Li J, Jiao S, et al. Convolutional neural network-based pattern recognition of partial discharge in high-speed electric-multiple-unit cable termination. Sensors. 2024;24(8):2660. doi:10.3390/s24082660. [Google Scholar] [PubMed] [CrossRef]
11. Liu Z, Mao H, Wu CY, Feichtenhofer C, Darrell T, Xie S. A ConvNet for the 2020s. In: Proceedings of the 2022 IEEE/CVF Conference on Computer Vision and Pattern Recognition (CVPR); 2022 Jun 19–24; New Orleans, LA, USA. p. 11966–76. doi:10.1109/CVPR52688.2022.01167. [Google Scholar] [CrossRef]
12. Woo S, Debnath S, Hu R, Chen X, Liu Z, Kweon IS, et al. ConvNeXt V2: co-designing and scaling ConvNets with masked autoencoders. In: Proceedings of the 2023 IEEE/CVF Conference on Computer Vision and Pattern Recognition; 2023 Jun 17–24; Vancouver, BC, Canada. Piscataway, NJ, USA: IEEE; 2023. p. 16133–42. doi:10.1109/CVPR52729.2023.01548. [Google Scholar] [CrossRef]
13. Liu YQ, Hua XC, Li WD, Lai ZK, Zhang GJ, Chen XX, et al. Enhancement of GIS partial discharge pattern recognition accuracy based on domain adversarial ConvNeXt. IEEE Trans Dielectr Electr Insul. 2025;33(1):742–751. doi:10.1109/TDEI.2025.3579444. [Google Scholar] [CrossRef]
14. Bischl B, Binder M, Lang M, Pielok T, Richter J, Coors S, et al. Hyperparameter optimization: foundations, algorithms, best practices and open challenges. WIREs Data Min Knowl Discov. 2023;13(2):e1484. doi:10.1002/widm.1484. [Google Scholar] [CrossRef]
15. Lindauer M, Eggensperger K, Feurer M, Biedenkapp A, Deng D, Benjamins C, et al. SMAC3: a versatile Bayesian optimization package for hyperparameter optimization. J Mach Learn Res. 2022;23(54):1–9. doi:10.48550/arxiv.2109.09831. [Google Scholar] [CrossRef]
16. Karl F, Pielok T, Moosbauer J, Pfisterer F, Coors S, Binder M, et al. Multi-objective hyperparameter optimization in machine learning—an overview. ACM Trans Evol Learn Optim. 2023;3(4):1–50. doi:10.1145/3610536. [Google Scholar] [CrossRef]
17. Morales-Hernández A, Van Nieuwenhuyse I, Rojas Gonzalez S. A survey on multi-objective hyperparameter optimization algorithms for machine learning. Artif Intell Rev. 2023;56(8):8043–93. doi:10.1007/s10462-022-10359-2. [Google Scholar] [CrossRef]
18. Raiaan MAK, Sakib S, Fahad NM, Mamun AA, Rahman MA, Shatabda S, et al. A systematic review of hyperparameter optimization techniques in convolutional neural networks. Decis Anal J. 2024;11(1):100470. doi:10.1016/j.dajour.2024.100470. [Google Scholar] [CrossRef]
19. Xue J, Shen B. A novel swarm intelligence optimization approach: sparrow search algorithm. Syst Sci Control Eng. 2020;8(1):22–34. doi:10.1080/21642583.2019.1708830. [Google Scholar] [CrossRef]
20. Ma J, Hao Z, Sun W. Enhancing sparrow search algorithm via multi-strategies for continuous optimization problems. Inf Process Manag. 2022;59(2):102854. doi:10.1016/j.ipm.2021.102854. [Google Scholar] [CrossRef]
21. Xue J, Shen B, Pan A. An intensified sparrow search algorithm for solving optimization problems. J Ambient Intell Humaniz Comput. 2023;14(7):9173–89. doi:10.1007/s12652-022-04420-9. [Google Scholar] [CrossRef]
22. Du X, Chen K, Du H, Qiao Z. TS-SSA: an improved two-stage sparrow search algorithm for large-scale many-objective optimization problems. PLoS One. 2025;20(3):e0314584. doi:10.1371/journal.pone.0314584. [Google Scholar] [PubMed] [CrossRef]
23. Kanan C, Cottrell GW. Color-to-grayscale: does the method matter in image recognition? PLoS One. 2012;7(1):e29740. doi:10.1371/journal.pone.0029740. [Google Scholar] [PubMed] [CrossRef]
24. Žeger I, Šetka I, Marić D, Grgic S. Exploring image decolorization: methods, implementations, and performance assessment. Appl Sci. 2024;14(23):11401. doi:10.3390/app142311401. [Google Scholar] [CrossRef]
25. Khudhair ZN, Khdiar AN, El Abbadi NK, Mohamed F, Saba T, Alamri FS, et al. Color to grayscale image conversion based on singular value decomposition. IEEE Access. 2023;11:54629–38. doi:10.1109/ACCESS.2023.3279734. [Google Scholar] [CrossRef]
26. Zhu Z, Gao M, Huang X, Huang X, Zhao Y. Quaternion chromaticity contrast preserving decolorization method based on adaptive singular value weighting. Electronics. 2024;13(1):191. doi:10.3390/electronics13010191. [Google Scholar] [CrossRef]
27. Woo S, Park J, Lee JY, Kweon IS. CBAM: convolutional block attention module. In: Ferrari V, Hebert M, Sminchisescu C, Weiss Y, editors. Computer vision—ECCV 2018. Vol. 11211. Cham, Switzerland: Springer; 2018. p. 3–19. doi:10.1007/978-3-030-01234-2_1. [Google Scholar] [CrossRef]
28. Deng J, Guo J, Xue N, Zafeiriou S. ArcFace: additive angular margin loss for deep face recognition. In: Proceedings of the 2019 IEEE/CVF Conference on Computer Vision and Pattern Recognition; 2019 Jun 15–20; Long Beach, CA, USA. Piscataway, NJ, USA: IEEE; 2019. p. 4690–9. doi:10.1109/CVPR.2019.00482. [Google Scholar] [CrossRef]
29. He K, Zhang X, Ren S, Sun J. Deep residual learning for image recognition. In: Proceedings of the 2016 IEEE Conference on Computer Vision and Pattern Recognition; 2016 Jun 27–30; Las Vegas, NV, USA. Piscataway, NJ, USA: IEEE; 2016. p. 770–8. doi:10.1109/CVPR.2016.90. [Google Scholar] [CrossRef]
Cite This Article
 Copyright © 2026 The Author(s). Published by Tech Science Press.
This work is licensed under a Creative Commons Attribution 4.0 International License , which permits unrestricted use, distribution, and reproduction in any medium, provided the original work is properly cited.
 Downloads
 Citation Tools
