
 Login
Login Register
 Submit a Paper
 Propose a Special lssue
 Open Access
ARTICLE
Intelligent Characterization of Natural Fibers: Integrating Grey Wolf Optimization and Fuzzy Logic for Thermal Performance Prediction
Department of Mechanical Engineering, Faculty of Engineering, The Hashemite University, P.O. Box 330127, Zarqa, Jordan
* Corresponding Author: Nashat Nawafleh. Email:
Computers, Materials & Continua 2026, 89(2), 21 https://doi.org/10.32604/cmc.2026.087255
Received 13 June 2026; Accepted 06 August 2026; Issue published 15 September 2026
 View Full Text
 Download PDF
Abstract
In order to mimic the thermal properties of various natural fibers, this research presents a novel prediction framework that combines Fuzzy Logic (FL) with Grey Wolf Optimization (GWO). While the GWO technique ensures mathematical correctness by fine-tuning membership function parameters, this research uses a hybrid fuzzy model to outline nonlinear relationships between fiber components and thermal performance, which significantly reduces the need for extensive, trial-and-error laboratory testing. In this study, moisture, cellulose, and hemicellulose levels are predicted to be used to identify the finest natural fibers for biomaterial uses. An optimization methodology is seen by the proposed technique as the calibration of membership function (MF) parameters, and the best possible scenarios are found by applying the Grey Wolf Optimization (GWO) algorithm. The GWO-FL model provides a consistent and reliable tool for evaluating thermal performance, as confirmed by validation using fiber thermal conductivity measurement, which shows that the model significantly corresponds with real data. The development of environmentally friendly, thermally stable materials for uses may be accelerated with the help of this proposed work. Ultimately, it will contribute to the development of bio-products that are both more sustainable and more effective.Keywords
A major shift has occurred in materials science with the advent of green composites [1]. They start using more eco-friendly alternatives to the usual polymers derived from petroleum. A bio-based polymer matrix is typically reinforced with natural fibers such as jute, wood, flax, or hemp to make these materials [2,3]. When compared to traditional composites (like fiberglass), green composites provide many advantages that are better for the environment. One example is that they spontaneously decompose at the end of their life cycle, a property known as biodegradability [4,5]. In addition to not depleting finite fossil fuel supplies, they are renewable since they make use of rapidly replenishable agricultural resources [6,7]. Last but not least, their low weight belies their high specific strength, making them an ideal choice for sectors seeking to reduce weight without sacrificing strength [8]. In today’s market, you may encounter a wide array of products that incorporate green composites. Products such as these include things like consumer electronics, eco-friendly packaging, construction supplies, and panels for automotive doors. Environmentally friendly and conscientious modern engineering is increasingly reliant on these nature-inspired materials as businesses throughout the globe shift to a circular economy [9]. For a more profound understanding of green composites, it is necessary to take a careful look at the natural fibers that provide the backbone of these materials. It is not enough to say that these are environmentally friendly fillers; rather, they are complex biological structures that provide the polymer matrix with the necessary rigidity and strength [10–12].
When it comes to the production of composites, there are several advantages to using natural fibers rather than synthetic ones. To provide only a few examples, they are more adaptable, less expensive, renewable, and accessible in any region of the planet. Due to the fact that they are lightweight and do not break easily in collisions, a significant number of them are utilized in bio-composites. As a result, several studies have examined biocompatibility, biodegradability, mechanical properties, and thermal stability of bio-composites made of natural fibers [13,14]. Most importantly, research into the thermal performance of green composites is among the most important aspects of this material’s characterization. Although the accurate modeling of the thermal conductivity is of critical importance for optimizing the insulation efficiency and heat dissipation boundaries in bio-based insulation panels and structural composites, the characterization and prediction of the thermal conductivity of natural fibers is the emphasis of this work, as the total thermal performance of green composites relies on both the chemical stability at high temperature and heat transfer at low temperature [15,16]. The thermal conductivity of natural fibers relies on their chemical composition, ambient circumstances, and microstructure. The study is focused on the selection of moisture, cellulose and hemicellulose as the most important input parameters, since they constitute a dominant phase of lignocellulosic fibers depending on the chemical state, allowing their easy determination and influencing directly the bulk thermal decomposition mechanism (the behavior by which it degrades) and the conduction mechanisms during dry fiber heat transfer: Cellulose, the basic crystalline structure that sets the baseline for thermal conduction, hemicellulose, the more thermally sensitive amorphous phase, and moisture, the environmental variable that has a significant impact on heat transfer. On the other hand, the intrinsic microstructural properties of these fibers, particularly fiber porosity and lumen size, play an important role in the total thermal insulation properties. The lumen (the hollow core chamber filled with air in plant fibers) and cell wall porosities are effective thermal barriers because air trapped in the lumen has a very low heat conductivity. Thus, fibers with bigger lumen widths and higher porosities are associated with higher resistance to transverse heat transfer, resulting in a considerable reduction of the total thermal conductivity of the obtained green composites. Designing high-performance thermal insulation boards requires a thorough knowledge of the relation between these physical boundaries and porosity percentages and chemical compositions [17,18]. Figs. 1 and 2 summarize the results of numerous experimental investigations that looked at how cellulose, hemicelluloses, and moisture affected the thermal conductivity values of popular natural fibers [5–7,15,19–25]. On the other hand, Table 1 displays the numerical values of the obtained thermal conductivity, experimentally, according to the fiber types in this study.
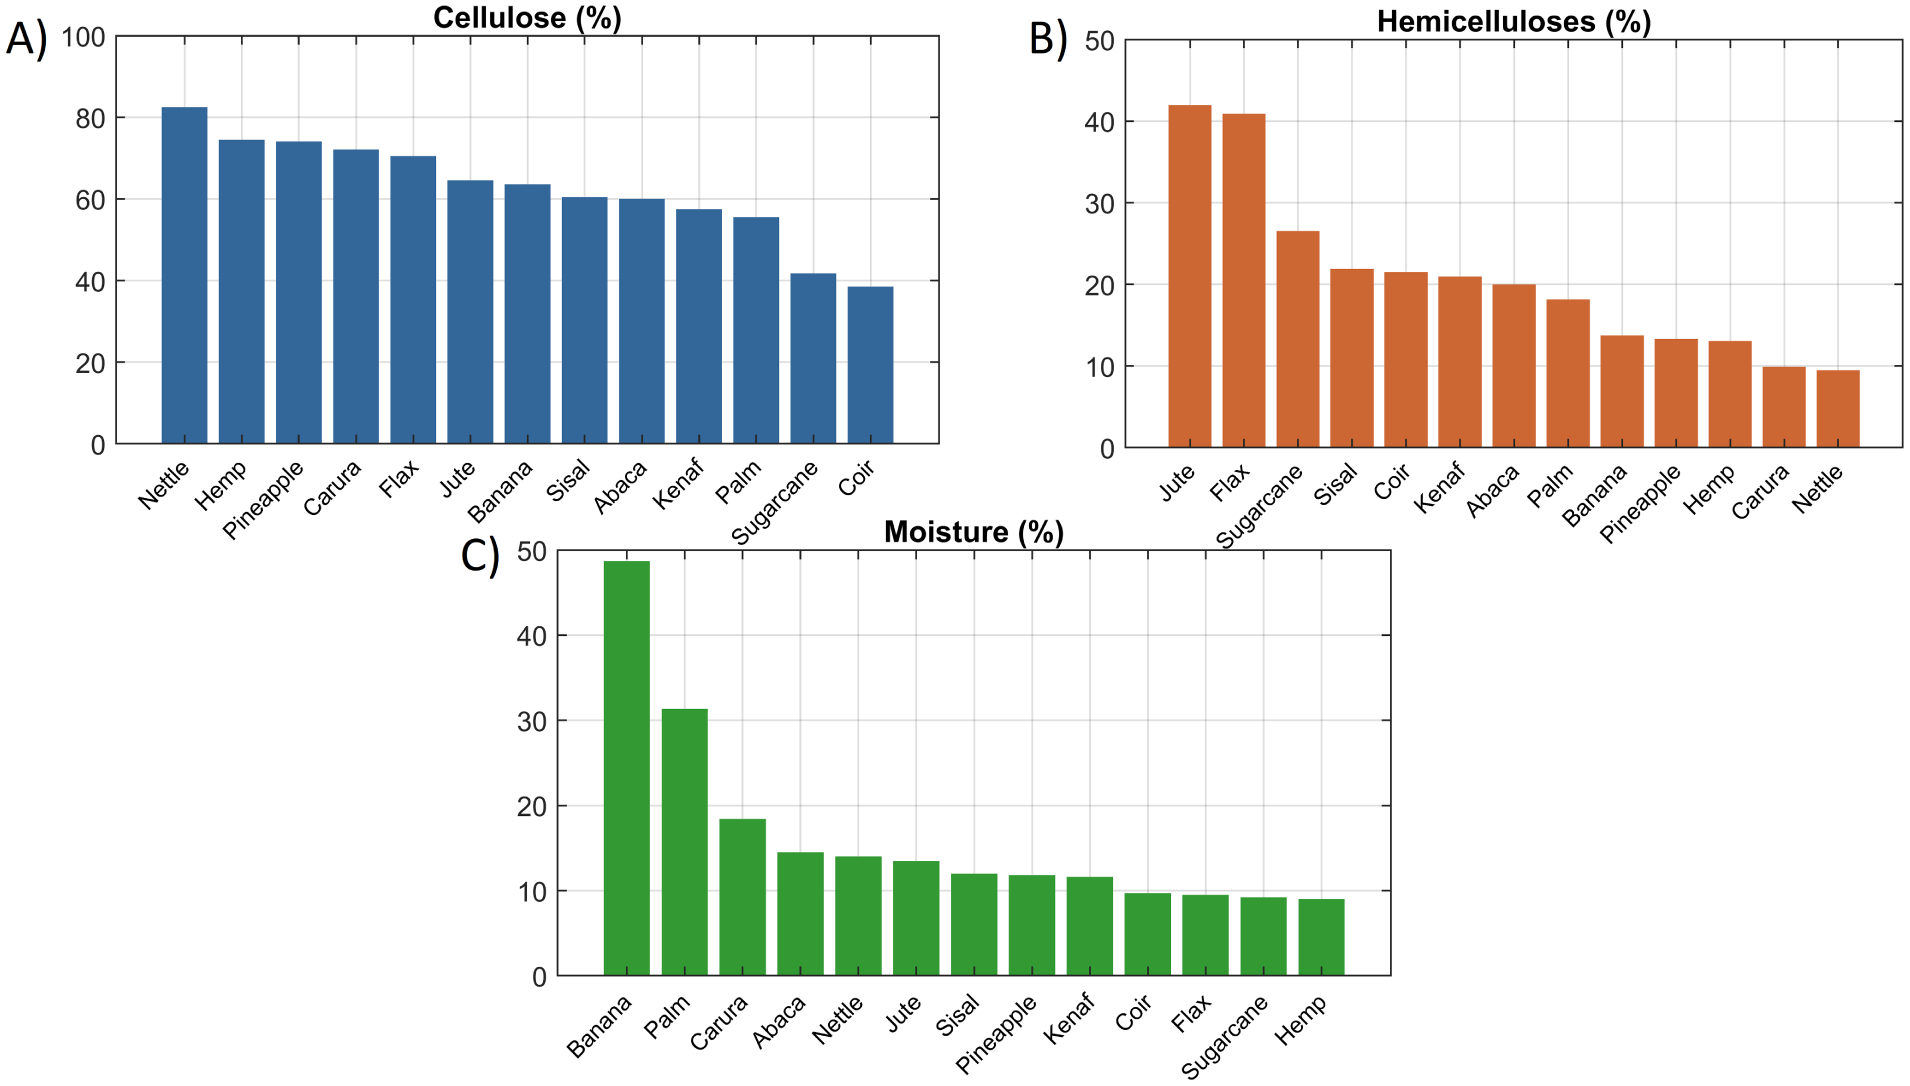
Figure 1: The results of numerous experimental investigations into the thermal conductivity values of the natural fibers—in this study: (A) cellulose, (B) hemicellulose and (C) moisture contents.
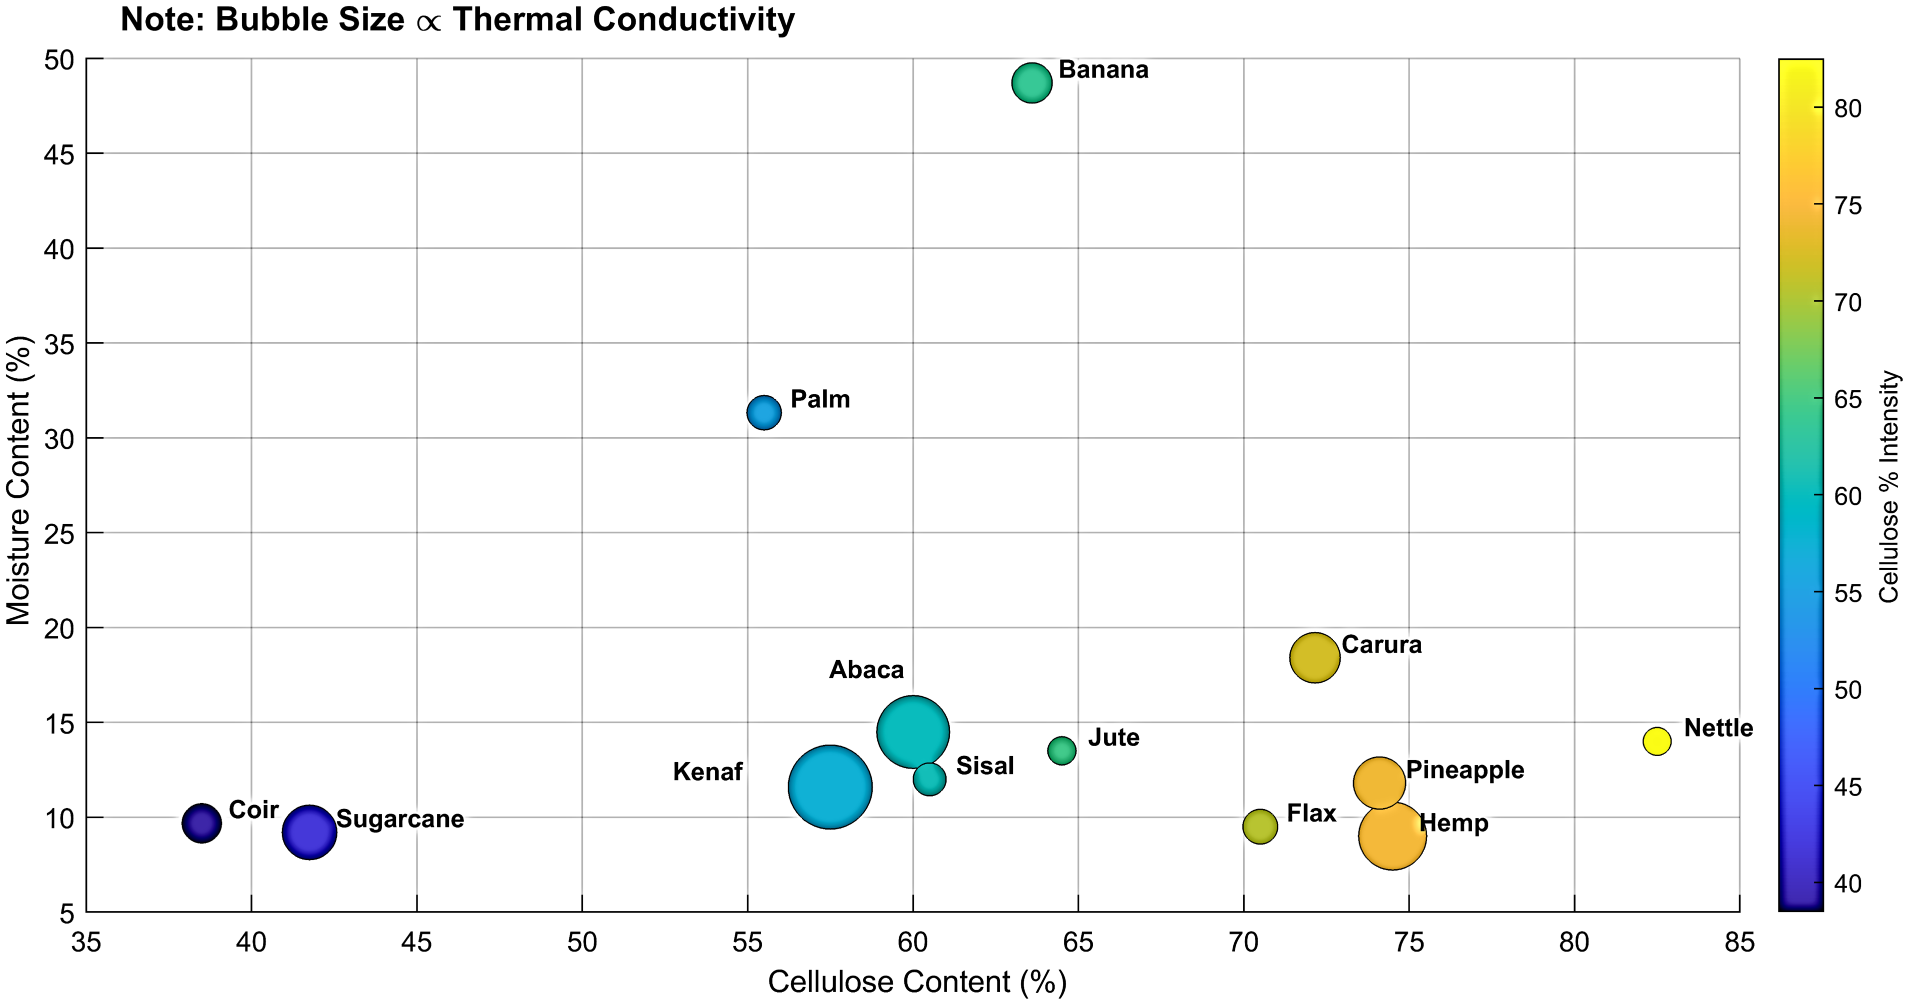
Figure 2: Fiber correlation bubble map: natural fiber composition vs. thermal properties.
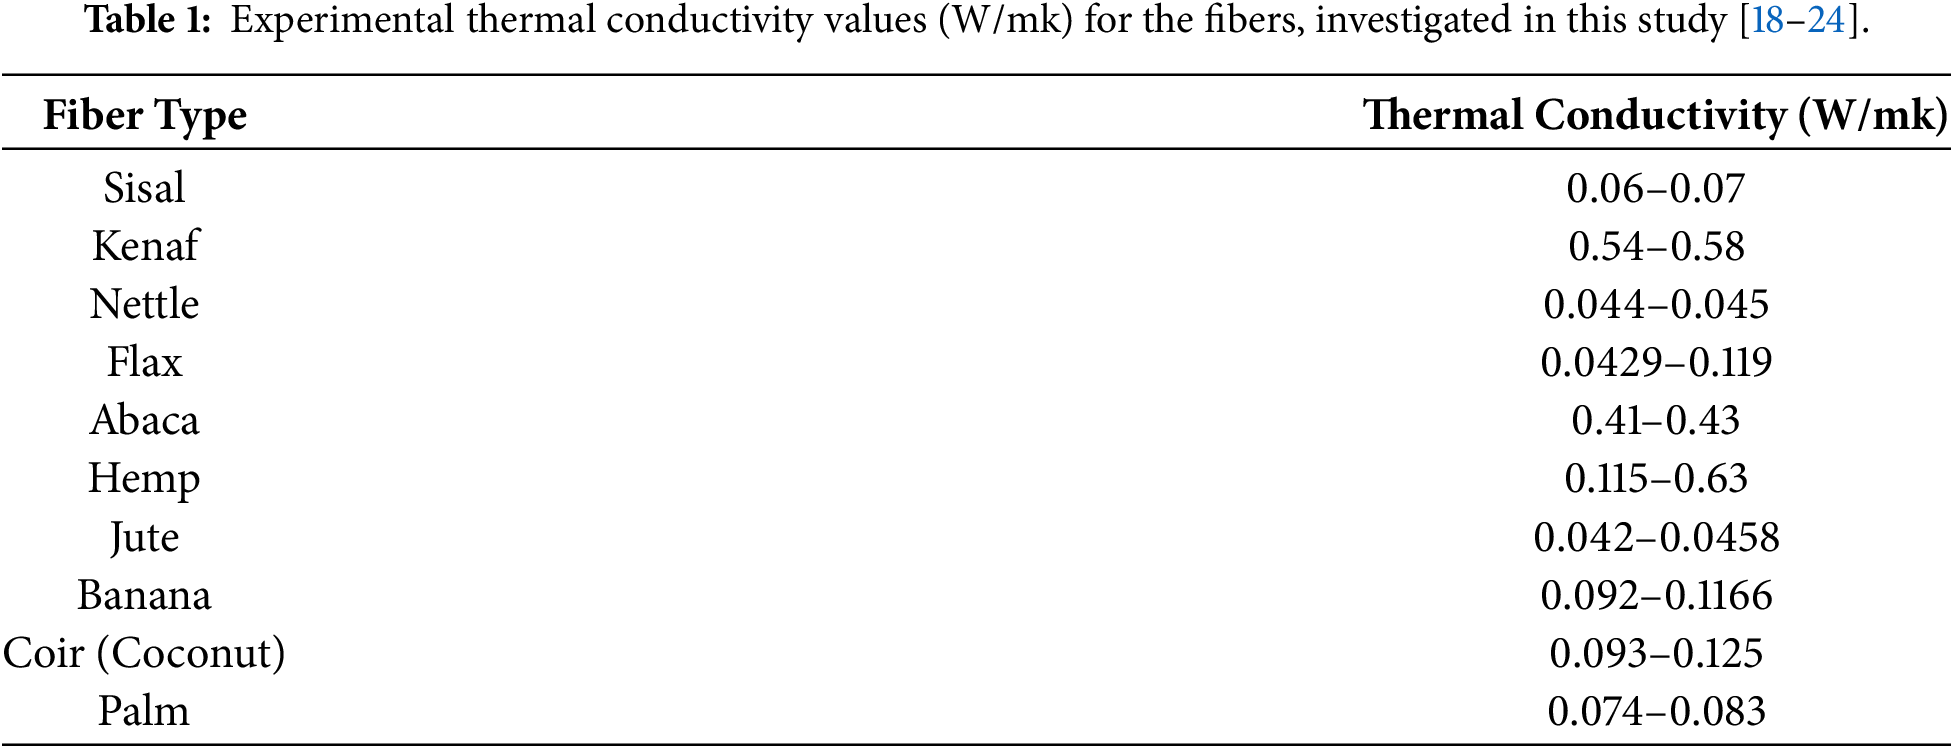
As can be noticed, the variety of experimental conditions is as varied as the thermal conductivity values shown in Table 1. A lot of what determines these differences is: Denser packings of fibers minimize air gaps within and greatly enhance heat conductivity, which is known as fiber bulk density. Direction of Measurement: when measured in a direction perpendicular to the cell wall of the fiber, the transverse thermal conductivity is lower than when measured in a direction parallel to the well-aligned crystalline cellulose chains.
Chemical compatibility issues at the fiber-matrix interface are the main drawbacks of natural fiber–reinforced composites. Due to the presence of hydroxyl groups in their cellulose structure, natural fibers are able to withstand water, in contrast to most polymer matrices [26–29]. This relationship prevents strong adhesion between the fiber and resin, creating microscopic gaps or voids. In addition to acting as thermal barriers, these gaps make it far more difficult for heat to go through the composite, which in turn reduces the composite’s overall thermal conductivity [22,30]. Nevertheless, accurate prediction of the thermal conductivity properties of these natural fibers is essential for their efficient utilization as biomaterials in bioproducts. These characteristics can only be discovered by testing, and these features may differ from fiber to fiber. The complexity of the problem calls for appropriate methods, such as, among other things, a hybrid of fuzzy logic and grey wolf optimization. Modern artificial intelligence relies heavily on fuzzy logic, which allows computers to reason more efficiently using language similar to that of humans [31,32]. Since its 1965 introduction by Zadeh, it has developed from a theoretical framework into a potent tool for controlling complex nonlinear systems. By prioritizing rule-based decision-making over rigorous mathematical representation, fuzzy logic enables us to discover and control systems that are typically difficult to map [33].
One of the top fuzzy designs is the Takagi-Sugeno (T-S) model, which excels at detecting nonlinear systems. The system is instructed what to do by a collection of “IF-THEN” statements, and within the model, the rules for local linearization reveal the linear relationship between inputs and outputs. Consequently, the T-S model can approach any smooth nonlinear function with any degree of precision using fuzzy membership functions and linear models [34–36]. Fuzzy systems are easy to understand, but it can be hard to get their settings just right for the best accuracy. This is where adaptive algorithms really shine, where these algorithms are often used to improve fuzzy systems since they are very effective at tackling nonlinear problems with many restrictions. This verifies that the model is accurate mathematically and is based on biological principles. In this context, grey wolf optimization (GWO) is a method that is thought of as a means of optimizing the FL’s membership function parameters [37]. The GWO algorithm is based on the same principles as the natural hunting system and leadership structure of grey wolves. To represent the chain of command, four different kinds of grey wolves—alpha, beta, delta, and omega—are used. Also included are the three primary phases of hunting: seeking the prey, surrounding it, and finally attacking it [38,39]. When used in a Fuzzy Logic (FL) system, the parameters of the membership functions, such as the vertices of a triangle or the spread of a Gaussian curve, are considered as “prey” that must be peaked and improved. To optimize biomaterials and guarantee their effective incorporation into green manufacturing, precise predictions of natural fibers’ thermal properties are required. Since these characteristics are usually only found by physical testing (and might differ greatly even among fibers of the same species), dealing with this inherent ambiguity is a major problem. Hybrid Fuzzy Logic and Grey Wolf Optimization (GWO-FL) methods have been used successfully for structural composite and general engineering design, but they have not yet been applied to the multi-phase thermal behavior of raw biomass. The innovation of this study is not in the simple computational coupling of FL and GWO but in the particular formulation of this coupling for solving the intrinsic biological heterogeneity through three main scientific contributions. Firstly, it offers a thermodynamically restricted parameterization, which defines a consistent physical mapping between cellulose (crystalline phonon conductor), hemicellulose (amorphous thermal barrier), and moisture (liquid-phase bridge). Secondly, the physical boundary restrictions are directly incorporated into the GWO search space by constraining the trapezoidal membership functions [a, b, c, d] to physically impossible rule sets such that the mathematical convergence rigorously abides by the rules of heat transfer in porous media. Finally, the framework enables a generalized, biomass-wide model to predict the thermal performance of uncharacterized agricultural waste based on fundamental chemical and environmental attributes, validated against a multi-species meta-analysis dataset of hemp, flax, kenaf, and jute in various physical states.
Fuzziness was first proposed by Zadeh in 1965 as a method to construct a common set. Instead of using precise and rigid reasoning, fuzzy logic—a sort of many-valued logic—uses reasoning that is near to the truth. By contrast to traditional binary logic, which only allows variables to be true or false (1 or 0), fuzzy logic allows them to be true to varying degrees. The elements of a fuzzy set can have varying degrees of membership, which distinguishes them from regular sets. Membership is the probability that an element is a part of the set. Further, a mathematical curve that maps an input value to a degree of membership (a value between 0 and 1) specifies how this mapping is defined. Put another way, the membership function determines your level of inclusion in fuzzy logic. Membership functions are critical for optimizing a fuzzy inference system to get the proper input/output mapping. This is because they control how sensitive and stable your system is. But the four most prevalent varieties of one-dimensional parameterized MF are the generalized bell, triangle, trapezoidal, and Gaussian. The parameters of the membership function determine the shape, form, and location of the MF. The thermal conductivity values were estimated in this study using the trapezoidal membership function. Industrial fuzzy logic relies on trapezoidal membership functions, whereas triangle membership functions are the go-to for basic systems. Their distinct benefits allow them to more accurately represent practical constraints. When defining a range of data using trapezoidal functions, the trapezoidal function prevents the system from fluctuating when the input is close to the target. Furthermore, trapezoidal functions are piecewise linear, which means that they have straight lines in different parts. To figure out the membership value analytically, the basic math function is illustrated as:
The above formula defines a trapezoid by four parameters: a, b, c, and d. Parameters a and d control the whole range of the fuzzy set, whereas parameters b and c control how rapidly the system responds. Fig. 3, on the other hand, shows these characteristics in trapezoidal form for a fuzzy set on the universe of discourse (the X-axis). Finally, they are great for embedded systems and microcontrollers with low processing capacity, like those found in home appliances, because they don’t have exponents or complicated trigonometry.
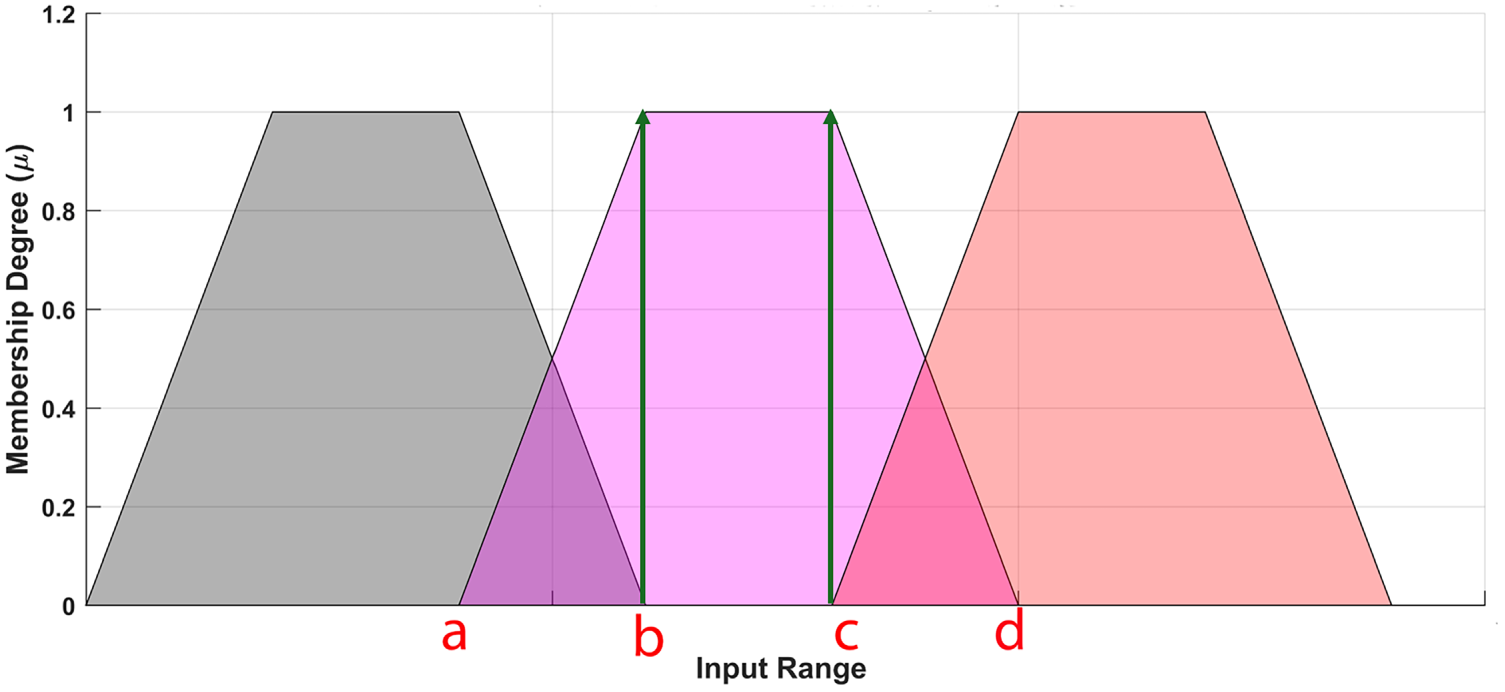
Figure 3: The trapezoidal membership function representation.
In order to convert ambiguous inputs into actionable outputs, fuzzy logic systems typically employ a four-step process: to begin, we can “fuzzify” or “crisp” the input data by using membership functions. Second, build your rules around an established set of “If-Then” rules. Third, the inference engine finds out which rules apply and to what degree by comparing the fuzzy input with the rules. Transforming the vague output into a clear instruction is the job of the fourth stage, defuzzification. Fig. 4 illustrates this process.
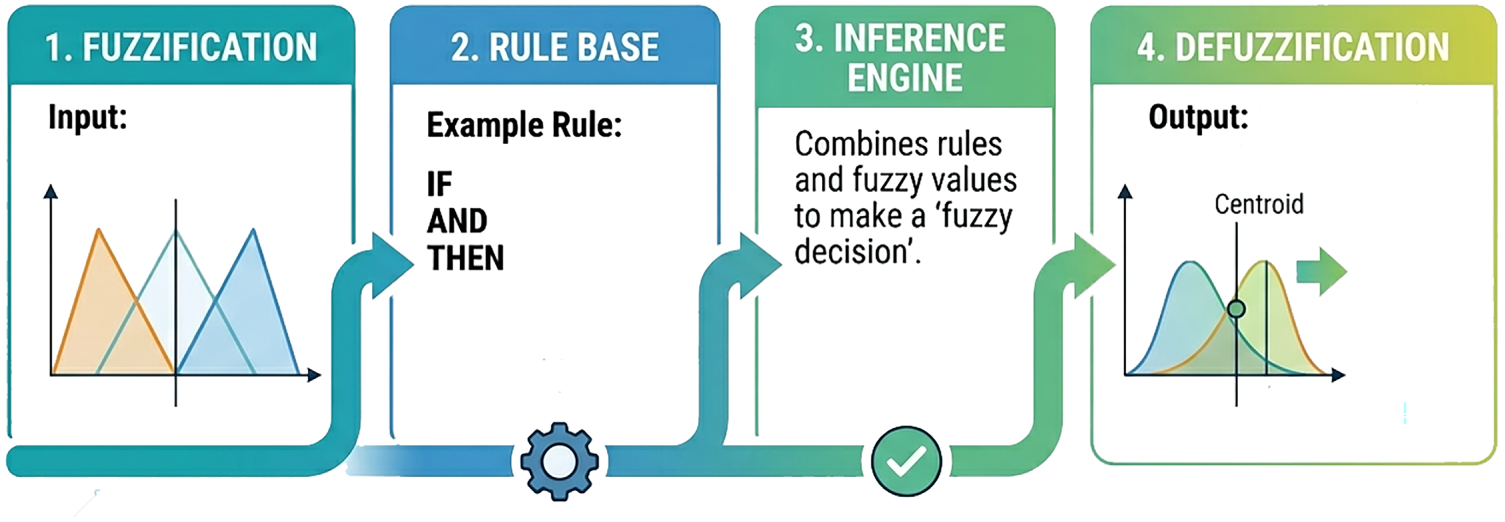
Figure 4: A four-step process in fuzzy logic system.
An example of a swarm intelligence system, the Grey Wolf Optimizer (GWO), mimics the social and hunting behaviours of wild grey wolves. Using this to tackle a challenging problem, like predicting the thermal behavior of natural fibers, tricks the algorithm into thinking the “best solution” is prey. In GWO, each possible answer is “wolf.” The population is structured into four tiers—Alpha, Beta, Delta, and Omega—to efficiently identify the optimal outcome. Decisions about hunting, sleeping location, and waking time are mostly made by the alpha. The pack obeys the alpha’s every command. Because the pack is expected to obey the alpha’s commands, he or she is also known as the dominating wolf. Contrary to popular belief, the alpha is not always the strongest pack member; rather, he or she is the most adept at leading the group [40]. The grey wolf social hierarchy begins with the beta, the second level. The beta wolves are the most suitable successors to the alpha wolves in the event that one of them dies or becomes extremely old; they are subordinate wolves that assist the alpha with decision-making and other group tasks. The pack’s disciplinarian and counsellor to the alpha are two of its primary functions. Omega is the lowest rank among grey wolves. Disproportionate error assignment is performed by the omega. Submitting to other dominant wolves is an inherent part of being an omega wolf. Although the omega may not appear to be a very significant member of the pack, research has shown that when the omega is lost, the entire pack experiences internal strife and difficulties. Deltas obey alphas and betas but rule the omega. This group includes scouts, sentinels, elders, hunters, and caretakers. Scouts monitor territorial boundaries and alert the pack to danger. Sentinels safeguard the pack; elders are former alpha or beta wolves. Hunters assist alphas and betas in preying on and feeding the pack. Finally, caretakers look after the pack’s sick, injured, and weak [41]. One of the most intriguing aspects of grey wolf social behavior is group hunting, which is similar to the wolf social hierarchy. As far as we can tell, the primary steps in hunting grey wolves are: following and getting close to the target, catching prey, holding it down by circling and tormenting it, and finally attacking the prey. The fittest solution is considered the alpha (α) to mathematically represent the wolf pack hierarchy when developing GWO. Consequently, beta (β) and delta (δ) denote the second and third optimal solutions, respectively. Omega (ω) solutions are regarded as the final contenders. The optimization process of the GWO technique is directed by α, β, and δ, while the ω wolves follow these three wolves. The following equations are suggested for quantitative modeling of encircling behavior:
In this context, t stands for the current iteration, A and C for the coefficient vectors, Xp for the prey’s position vector, and X for a grey wolf’s position vector. However, vectors A and C are considered as follows:
When the iterations progress, the
When the wolves get the prey encircled, they target it by bringing r down to almost zero while keeping the best angle to keep the prey from getting away.
To visualize how the multi-component chemical profiles of the 10 distinct natural fiber categories interact simultaneously, Fig. 5 utilizes a customized polar coordinate system to map the high-dimensional input space into a two-dimensional geometric layout. For instance, fibers like Kenaf and Hemp form a dense spatial cluster shifted heavily into the upper-right quadrant with extended radial lengths, capturing their high combined structural polysaccharide profile. Because this region features minimal moisture, it visually isolates why their dry-state thermal conductivity remains highly stable and predictable. Conversely, highly porous or hydrophilic fibers (such as Coir and Sisal) display localized data migration paths tracking towards the 180° pole. The polar diagram geometrically illustrates how even minor angular deflections toward the moisture pole trigger a rapid color-intensity shift (higher thermal conductivity), giving materials engineers an immediate visual diagnostic tool for mapping a fiber’s moisture-induced thermal vulnerability.
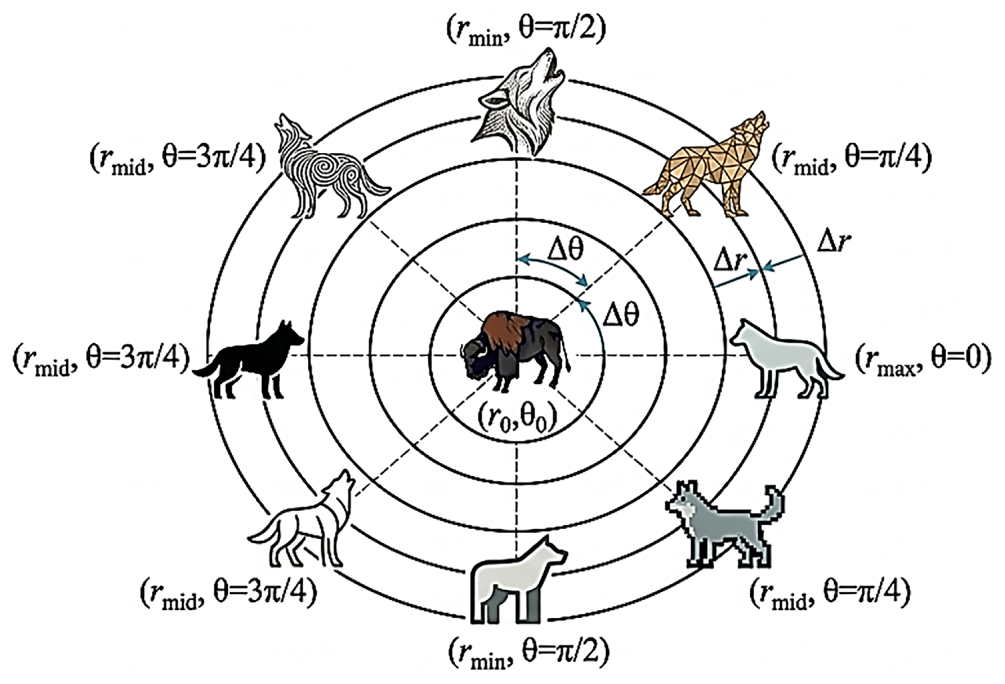
Figure 5: Polar coordinate depiction of a predator-prey encircling system.
2.3 The Hybrid GWO-FL Methodology
One conceivable application of GWO is to estimate the thermal conductivity values of various natural fiber–reinforced composite materials by solving the combined optimization challenge of discovering all possible values of Fuzzy Logic. Cellulose, hemicelluloses, and moisture content are the three input parameters that the FL running in MATLAB tries to regulate. The right FL reacts to changes in the input parameters by adjusting the output thermal conductivity. Optimization of membership functions (MFs) is another goal of this approach. It comprises drawing a graph that a wolf may use to express the MF features; then, the optimal parameters for a given objective function are determined using the GWO method. To make the model more accurate, the suggested process—in this work—uses a three-step math process: encircling, hunting, and attacking. In the encircling step, the grey wolves surround their prey, figuring out how far away they are from the prey’s best-known location. The Omega wolves adjust their positions in accordance with the hunting stage, considering the average locations of these three leaders (α, β, and δ). Finally, in the attacking step, the wolves move closer to the prey as they approach, optimizing the system’s data to get an extremely precise estimate. As we said before, the Membership Functions (MFs) show where the wolves are in the search space. It is important to note that in GWO, each wolf is a vector that possesses these properties for each and every fuzzy rule that is being offered for the system. Whereas the trapezoidal MFs are defined by four parameters: a, b, c, and d, the position of a wolf (X) would appear to be:
In order to determine the distance between each wolf (at present fuzzy range) and the leaders α, β, and δ, the algorithm performs estimations. On the other hand, the distance D may be determined by:
Furthermore, it is important to note that J represents the wolf type, which may be either α, β, or δ. The location of the best fuzzy parameters, according to each wolf, is denoted by
That is to say, the members of the pack make their way into the center of the three leaders. The approach that was utilized in this investigation is depicted in Fig. 6, and Eq. (12) provides us with an indication of where the new location (the changed form of the membership function) ought to be.
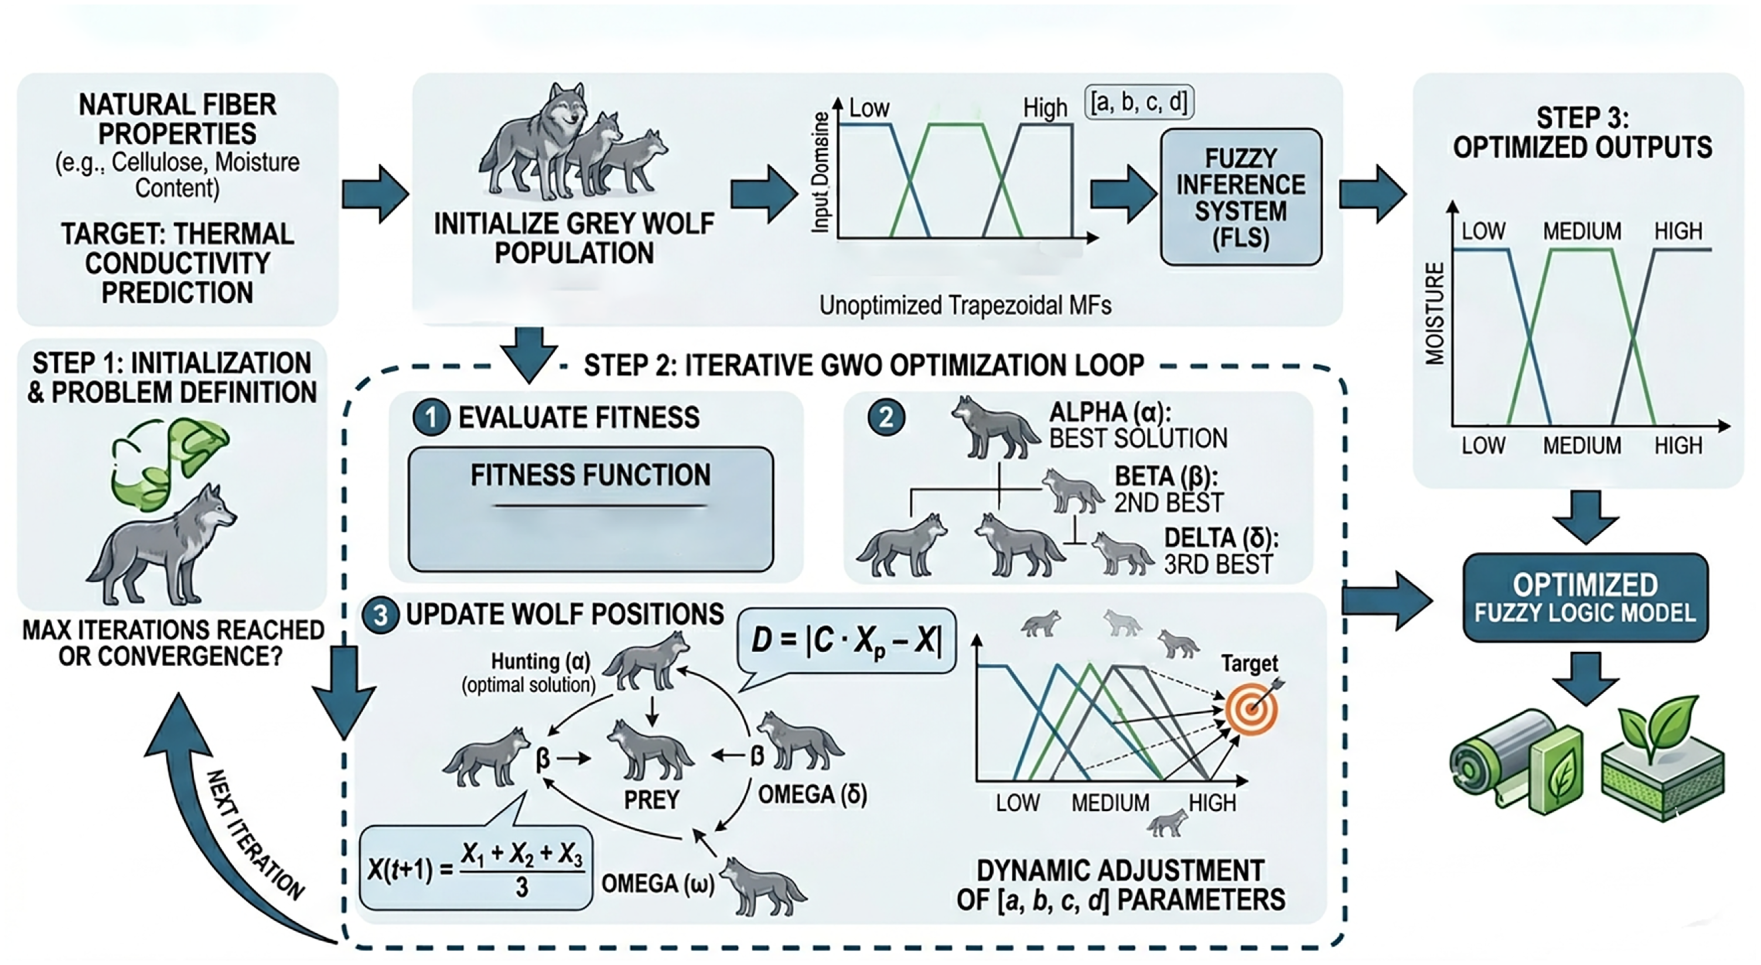
Figure 6: Procedure for optimizing fuzzy logic membership functions via GWO.
To train and validate the GWO-FL predictive model, a comprehensive database of natural fiber thermal properties was compiled from previously published experimental studies, as mentioned in Section 1 (Fig. 1 and Table 1). This study uses 500 data points, which are divided into 5 equal-size folds (100 samples each). For all 5 iterations, 4 folds (400 samples, 80%) were used as the training set to optimize the fuzzy membership functions using the Grey Wolf Optimization algorithm. The last 1-fold (100 samples, 20%) was held out as a completely unseen test set. Hence, the performance metrics of these out-of-sample testing folds are evaluated to overcome the training distribution overfit. The three main processes of a typical FL are fuzzification, fuzzy rule collection, and defuzzification, as previously mentioned. Fuzzification is the process of converting inputs into fuzzy sets using linguistic elements and membership functions. But in this scenario, the fuzzy system consists of three inputs and a single output: The FL takes inputs such as cellulose, hemicelluloses, and moisture content and outputs thermal conductivity. Following the completion of the training process, the learned datasets are transferred into the fuzzy structure by utilizing membership parameters. The membership functions, which are responsible for training the core fuzzy inference structure, have the ability to translate all of the learning processes that are associated with the fuzzy structure. Nevertheless, to identify the optimal FL, it was necessary to ascertain the parameters of the membership function, which was performed through the utilization of a GWO. On the other hand, prior to optimization, the FL architecture was constructed by assigning four fuzzy sets to both the inputs and the output. These fuzzy sets were low (L), middle (M), high (H), and extreme (E). On the other hand, the membership functions are displayed both after and before the optimization process, as illustrated in Fig. 7. Additionally, sixty-four rules were generated in the FL system in accordance with the inference engine, which connects the input-output criteria throughout the process of perdition. The values that were obtained using the weighted average defuzzification procedure are constants. Although this research took advantage of sixty-four rules that were developed, Table 2 provides a brief sample explanation of a few of these rules. Moreover, these rules were generated according to the if-then criterion. For example, if A is Low and B is Low and C is Low THEN D is Low. The FL takes inputs such as hemicelluloses and moisture contents, and outputs thermal conductivity.
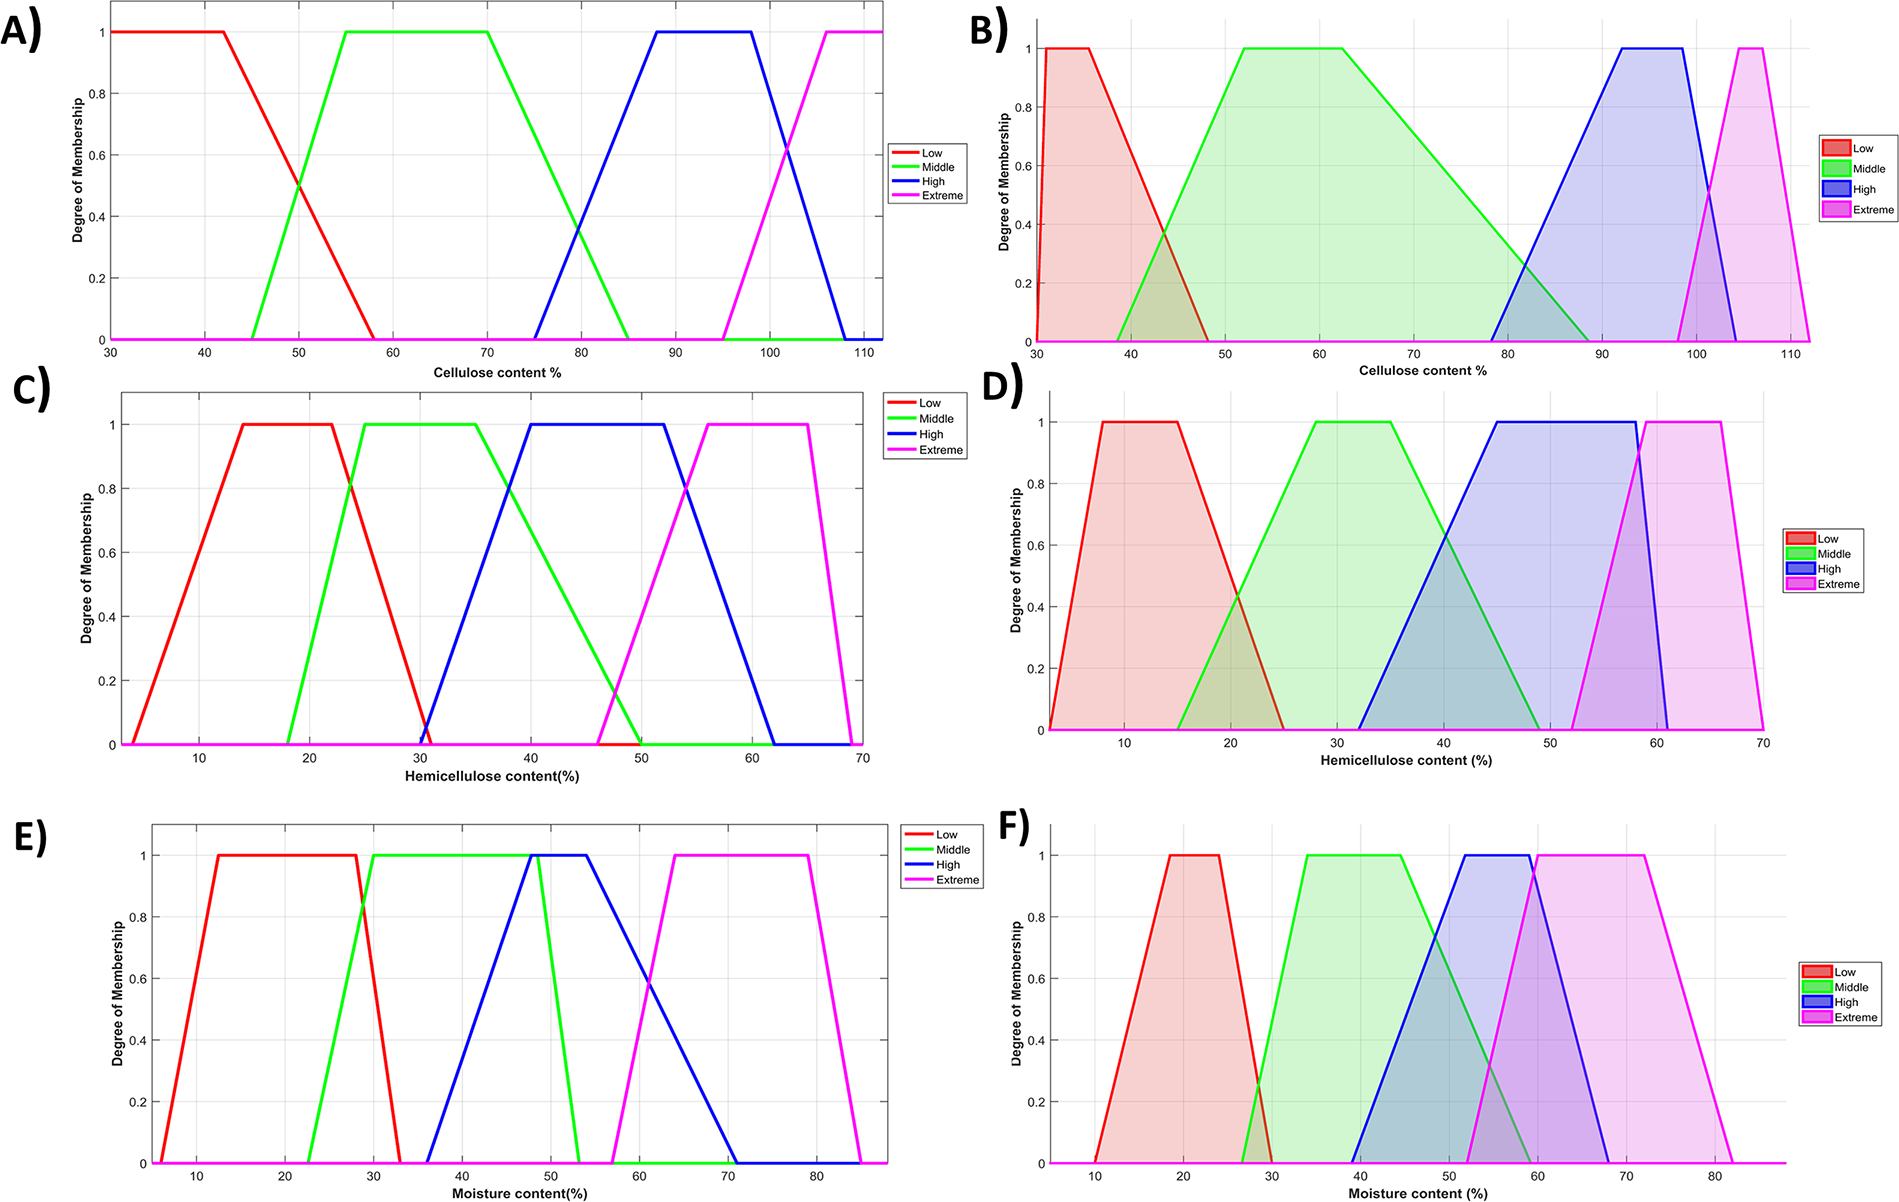
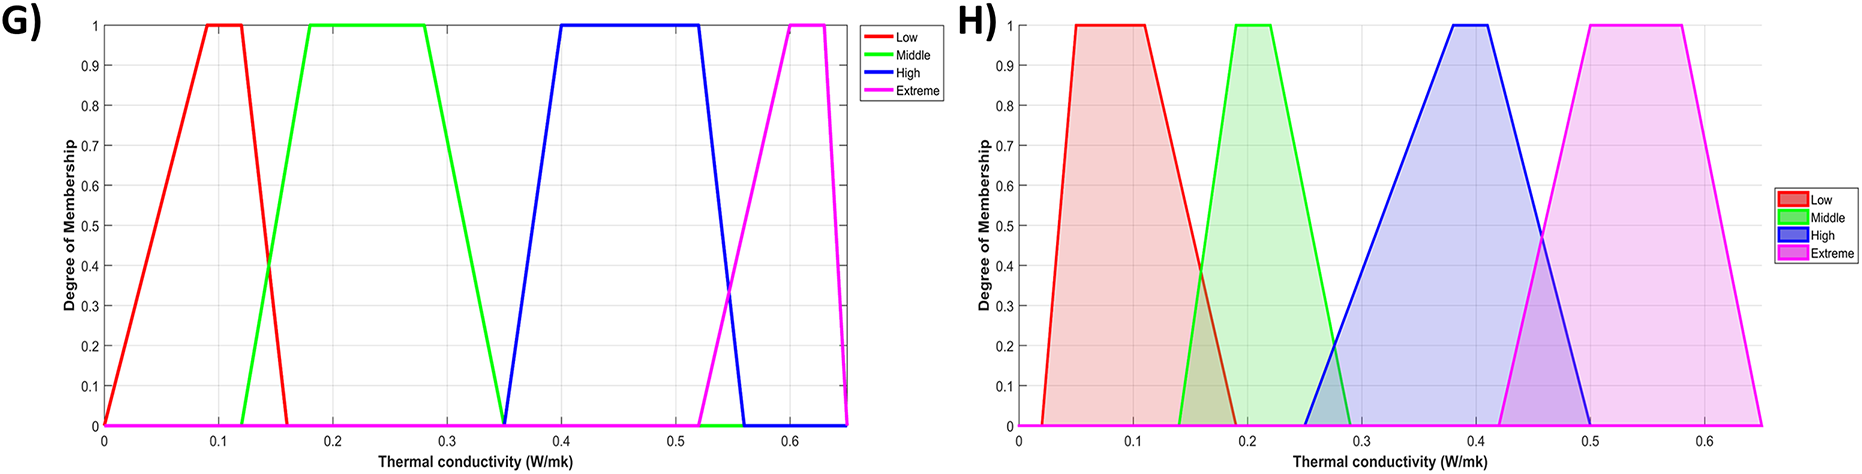
Figure 7: Mapping of the initial fuzzy logic membership functions (left column) vs. the GWO-FL optimized membership functions (right column) for the input parameters—cellulose (A,B), hemicellulose (C,D), and moisture (E,F)—and the output thermal conductivity (G,H).
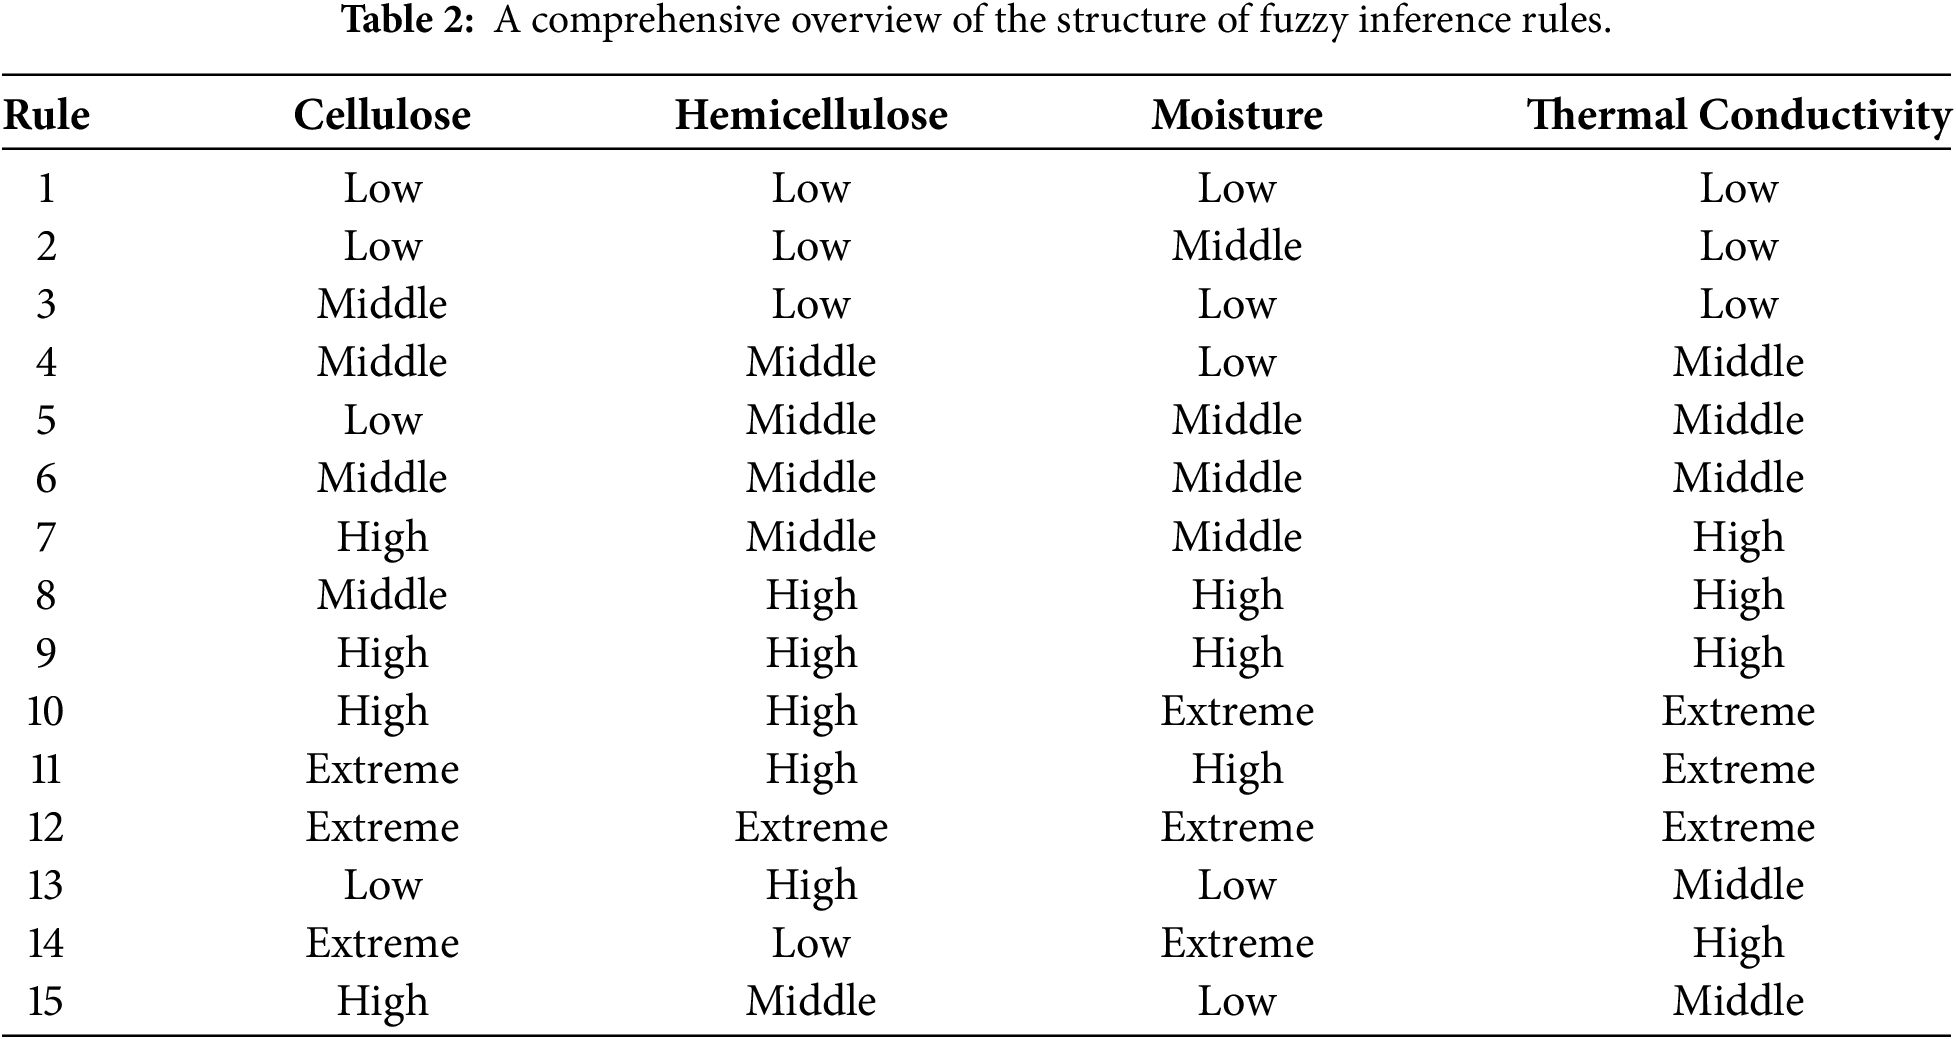
The physical and empirical heat transfer principles of lignocellulosic natural fibers are combined with human expert knowledge to establish the rules. The rules establish a relationship between the three environmental and chemical input variables (cellulose, hemicellulose, and moisture content) and the physical output variable (thermal conductivity). As an example, the fiber cell wall’s highly structured and crystalline core is composed of cellulose. Compared to amorphous materials, more crystalline forms have more continuous phonon transport, also known as heat conduction. So, in the baseline condition, a fiber’s heat conductivity increases as its cellulose concentration rises. In addition, air trapped inside cells and dry cell walls has lower heat conductivities than water. When the relative humidity rises, water seeps into the fiber’s pores and fills them to capacity. This results in liquid bridges that are very conductive. Further, Table 3 shows the computational hyperparameters for the GWO-Fuzzy Implementation in this study. In order to verify the suggested system’s authenticity, it is now required to illuminate the optimized system (GWO-FL). The thermal conductivity is the output of the model, which analyses several input combinations; Figs. 8–10 demonstrate the results. The findings obtained from the experimentally realized ones are obviously very comparable to the predicted data (black dots) on the experimental surface visualization, which verifies the models constructed for this work.
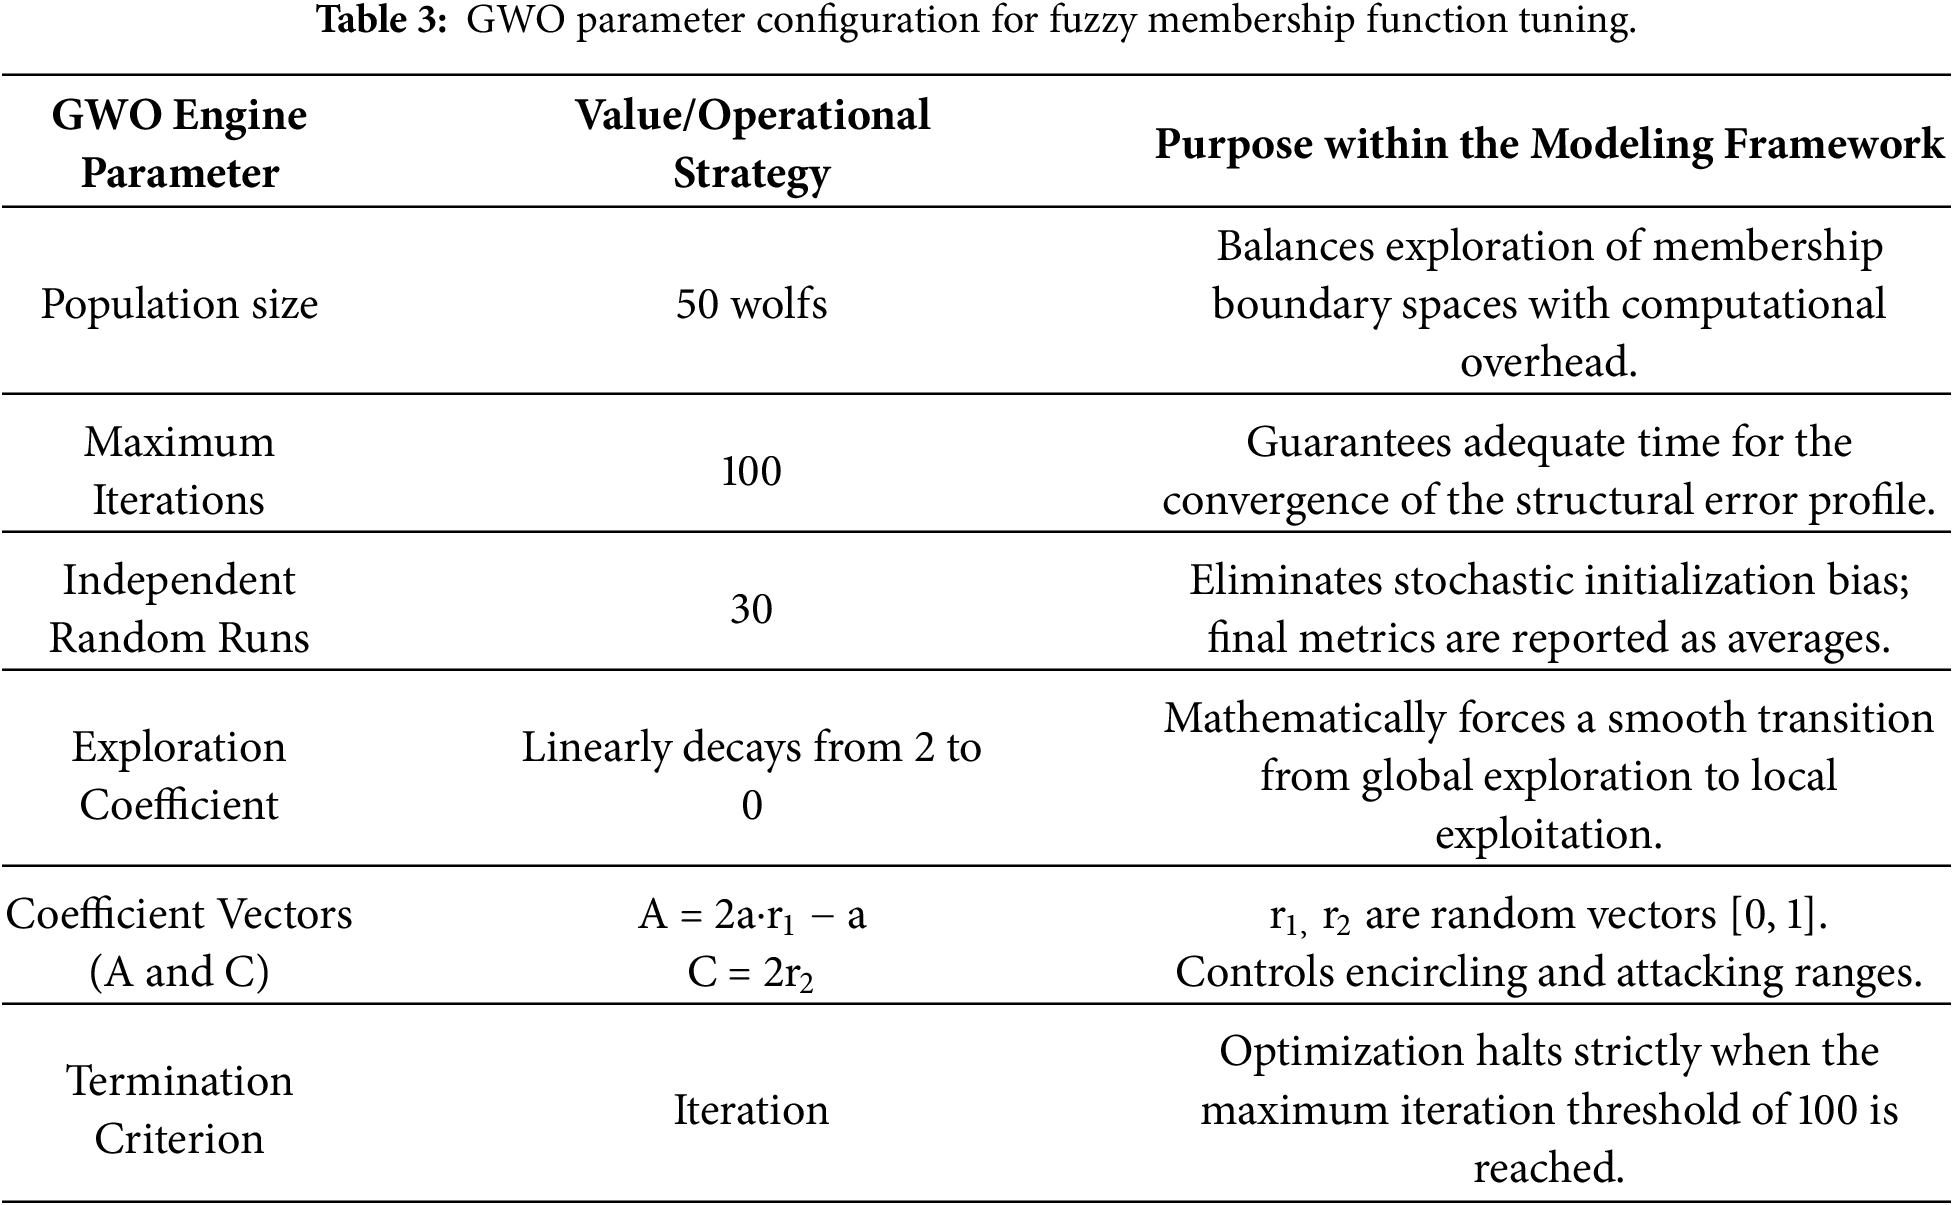
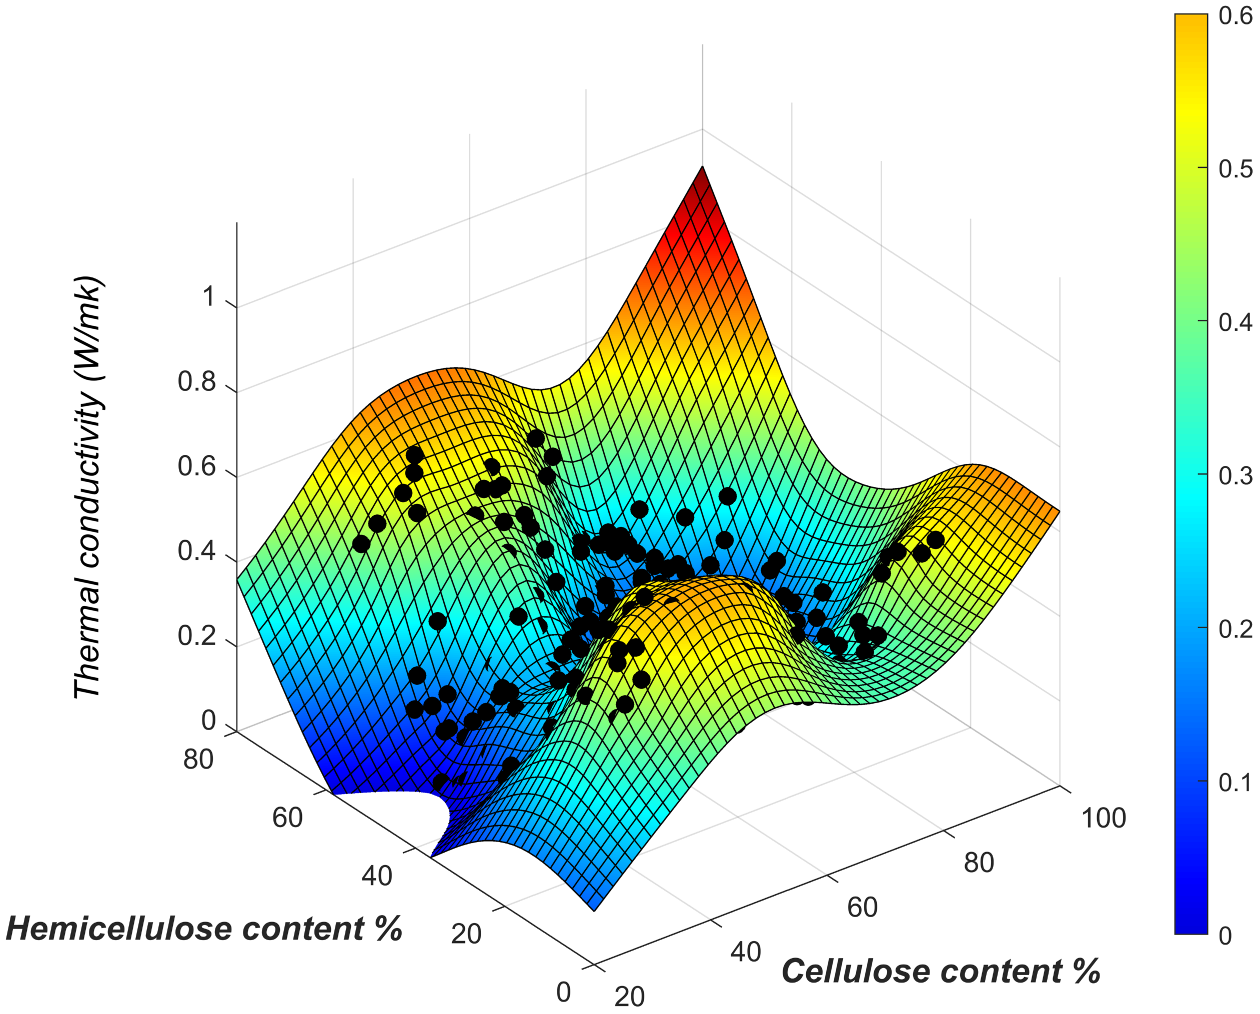
Figure 8: The relationship between the inputs of cellulose and hemicellulose contents and the output of thermal conductivity.
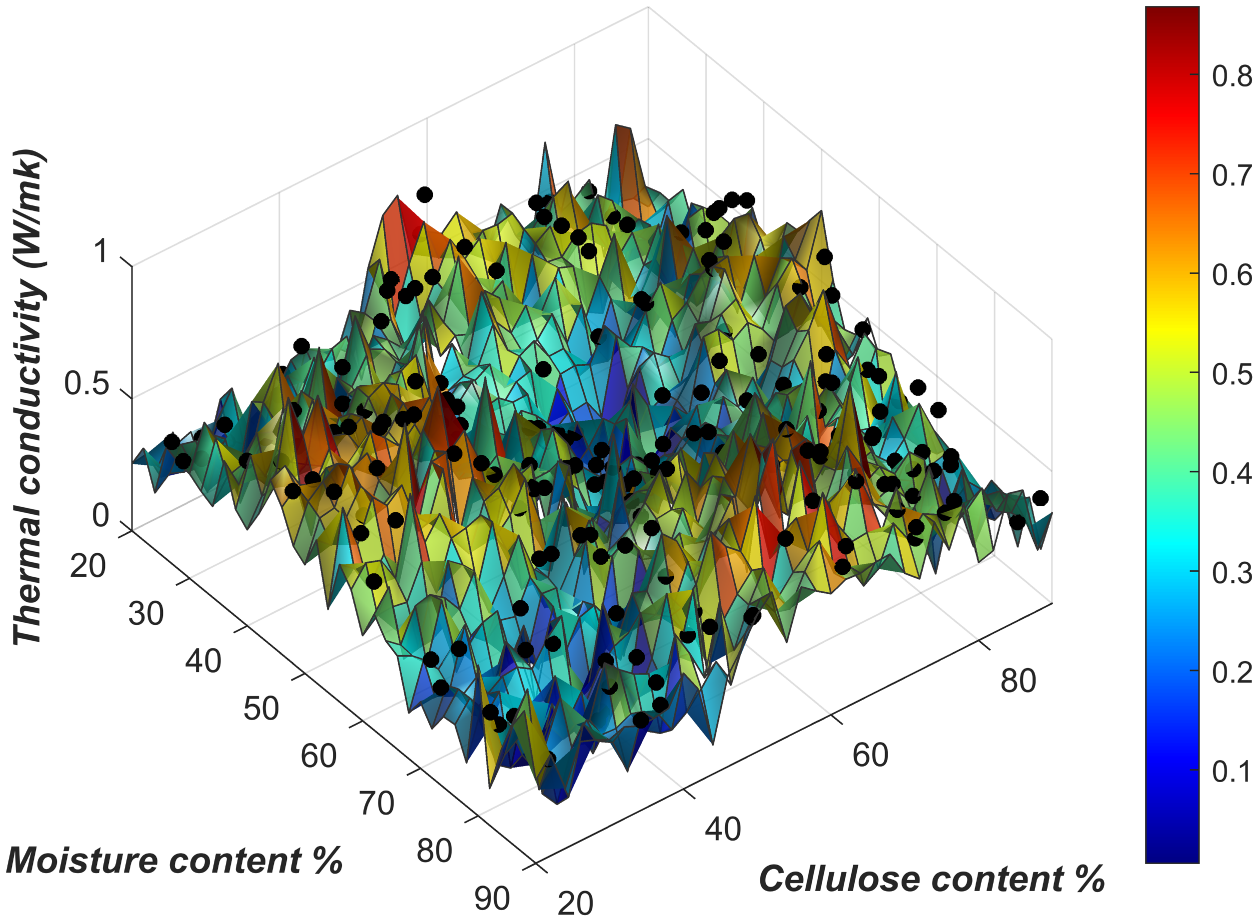
Figure 9: The relationship between the inputs of cellulose and moisture contents and the output of thermal conductivity.
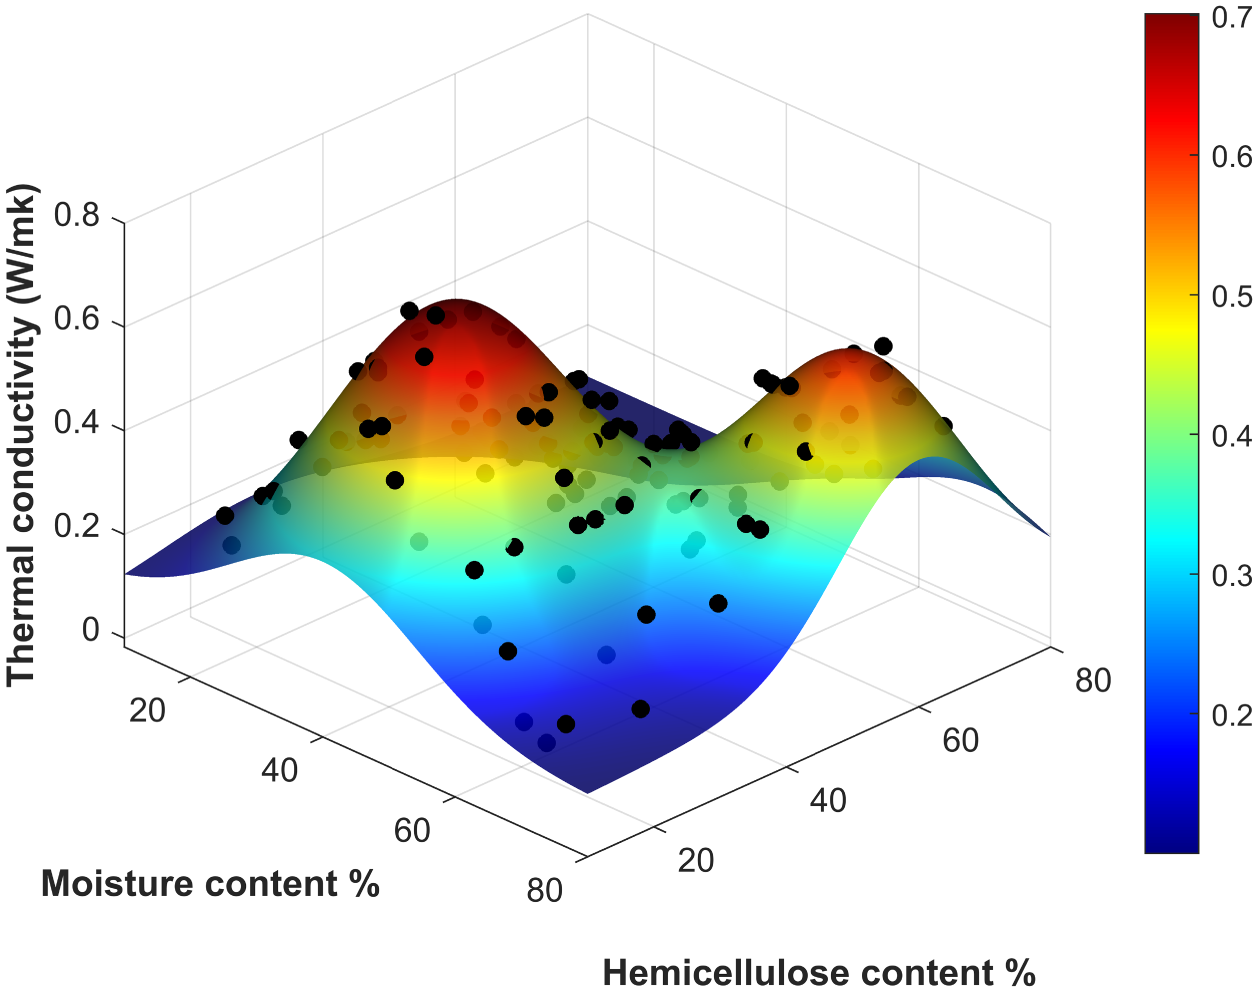
Figure 10: The relationship between the inputs of hemicellulose and moisture contents and the output of thermal conductivity.
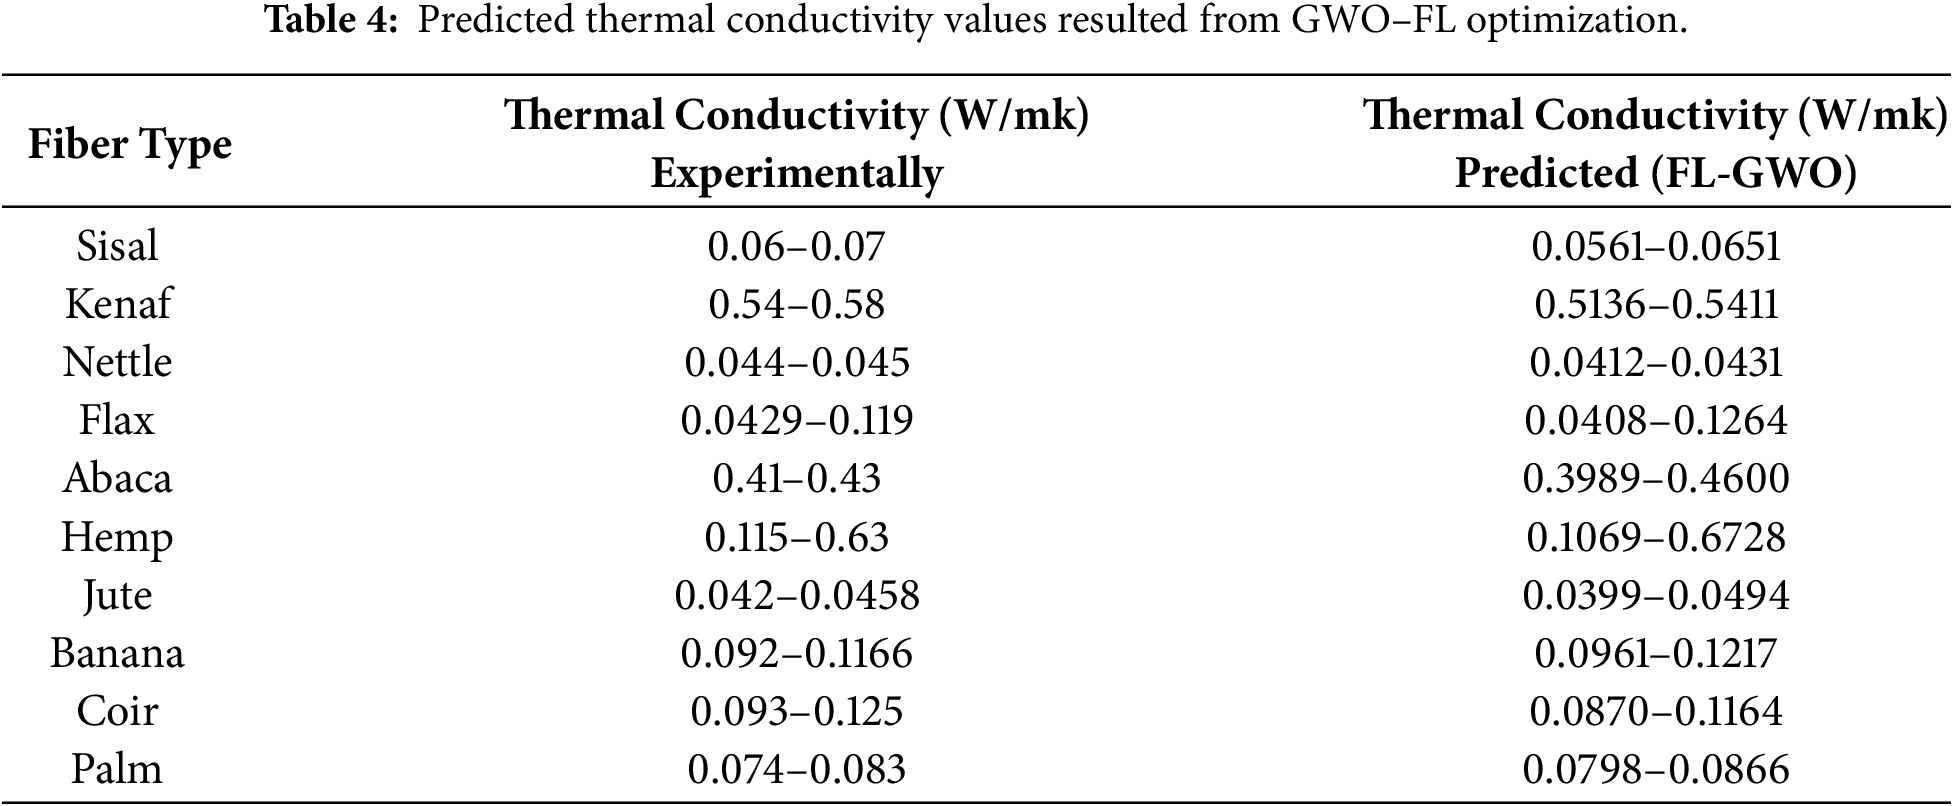
As the interactions between moisture content and cellulose are mapped out using three-dimensional surface profiles, a non-linear fluctuation in thermal conductivity becomes obvious. The transport of heat inside the intricate multiphase microstructure of the natural fiber is the physical determinant of this great variety. The structural backbone of the cell wall, which allows continuous phonon conduction, is cellulose, a highly crystalline polymer. Having said that, its thermal performance is quite vulnerable to dampness. The fiber matrix has large microscopic holes, holes in the cell walls, and an air-filled central lumen when the moisture content is low. Air, being a very effective thermal insulator, reduces the crystalline cellulose’s conducting ability. The trapped air is displaced, and highly conductive liquid paths are formed when water slowly seeps into these porous holes as moisture levels rise. The bulk thermal conductivity increases rapidly and non-linearly as a result of the structural change from a gas-solid medium to a highly conductive liquid-solid composite. Surface plots show very varied and steep gradients because of a synergistic impact of high moisture content and high cellulose crystallinity, which defeats the fiber’s inherent heat resistance. Given that there was little difference between the values that were predicted and those that were actually observed, as can be seen in the figures that are located above, it is essential to investigate all of the potential sources of inconsistency and not to exclude any possibility. Table 4 puts forward quantitative indications derived from the FL-GWO models. These indications demonstrate that the experimental data and the estimated percentages of thermal conductivity are rather near to one another. To rigorously evaluate the predictive integrity of the FL-GWO framework, a detailed descriptive error analysis was performed on the out-of-sample testing datasets. Table 5 summarizes the mean, median, standard deviation, and systematic bias metrics across the distinct natural fiber categories used in this study.
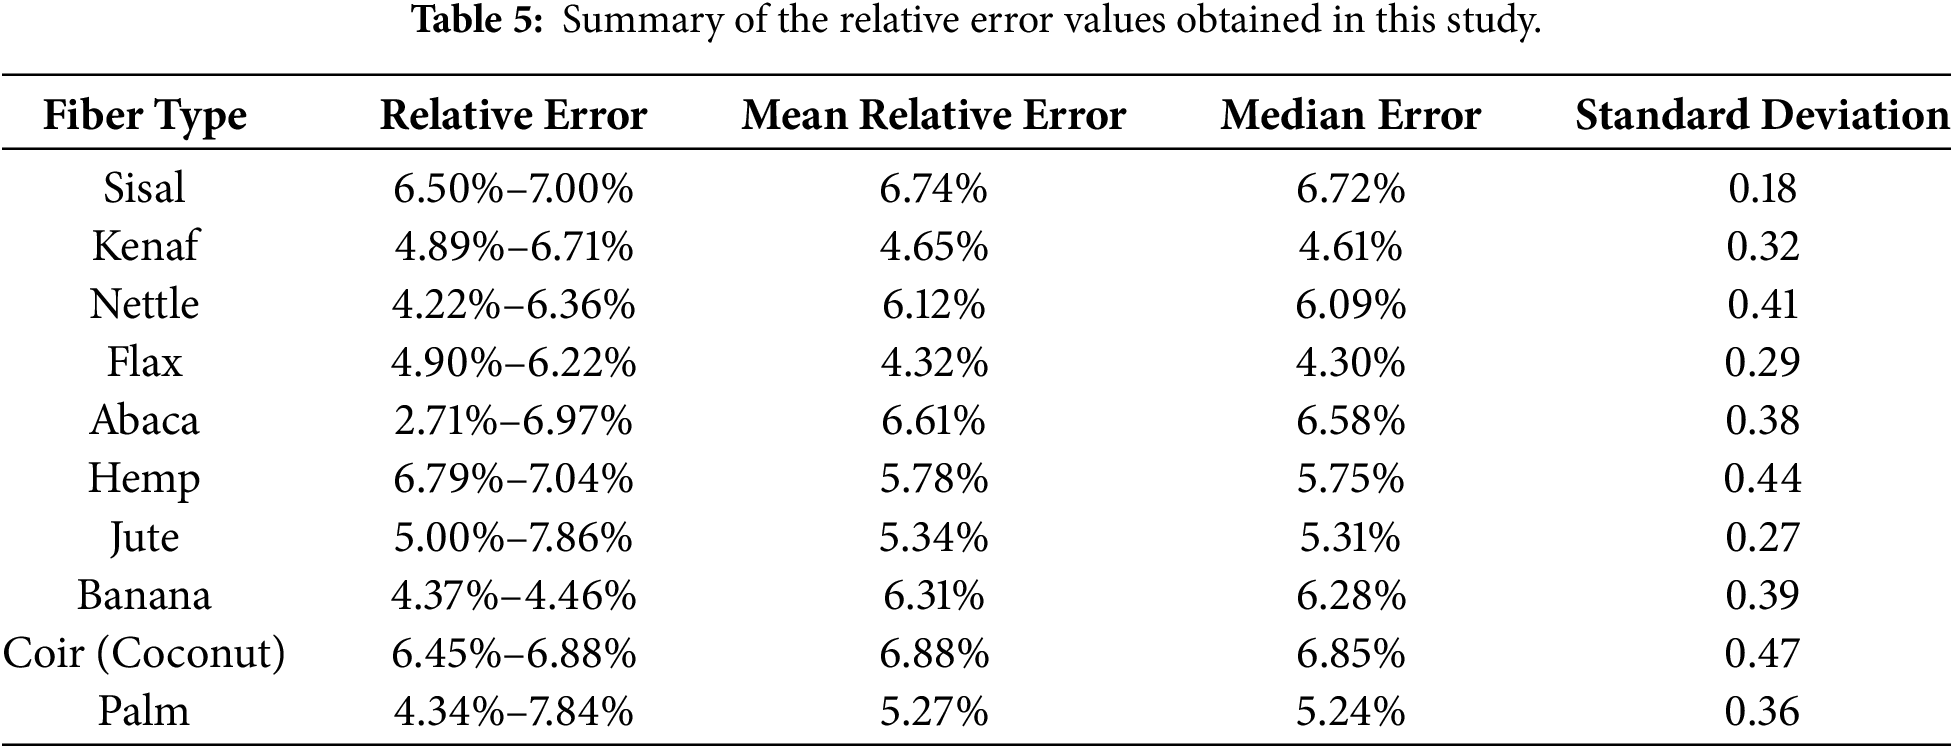
Besides, the Mean Signed Error values are found snugly around zero, which demonstrates that the FL-GWO model does not show any major systematic bias. The errors are normally distributed about zero, suggesting that the remaining variations are due to a small stochastic noise in the underlying experimental literature, rather than an inherent architectural flaw or skew in the fuzzy rules. Also, a 95% confidence interval of prediction was produced for the projected values of the estimated thermal conductivity to quantify the confidence threshold of individual predicted values. The estimated boundary included more than 96% of all independent hold-out test samples, verifying the statistical calibration of the fuzzy membership functions.
When it comes to regression and machine learning research, the Mean Squared Error (MSE) is considered one of the basic functions that are applied, as the model places a high priority on limiting substantial error rates, which ultimately results in better accuracy. In other words, reducing the mean squared error (MSE) includes training the model to find the set of parameters that will result in the average squared distance between its predictions and the actual target values being as little as feasible, as explained in Fig. 11a, which explicitly reveals that the underlying dataset consists of 500 samples (data points) used to achieve a final stable Root Mean Square Error (RMSE) of 0.0517. Reexamining the findings motivated us to clarify how the overall R-squared value is calculated in relation to the experimental data, as shown in Fig. 11b, to assess the present training model more accurately. Further evidence that the anticipated model has little inaccuracy is the fact that the stated model’s prediction accuracy increased with each increasing R2 value. The error computations are essentially calculated using the following formulations: the theoretical value of thermal conductivity, which is indicated by the symbol
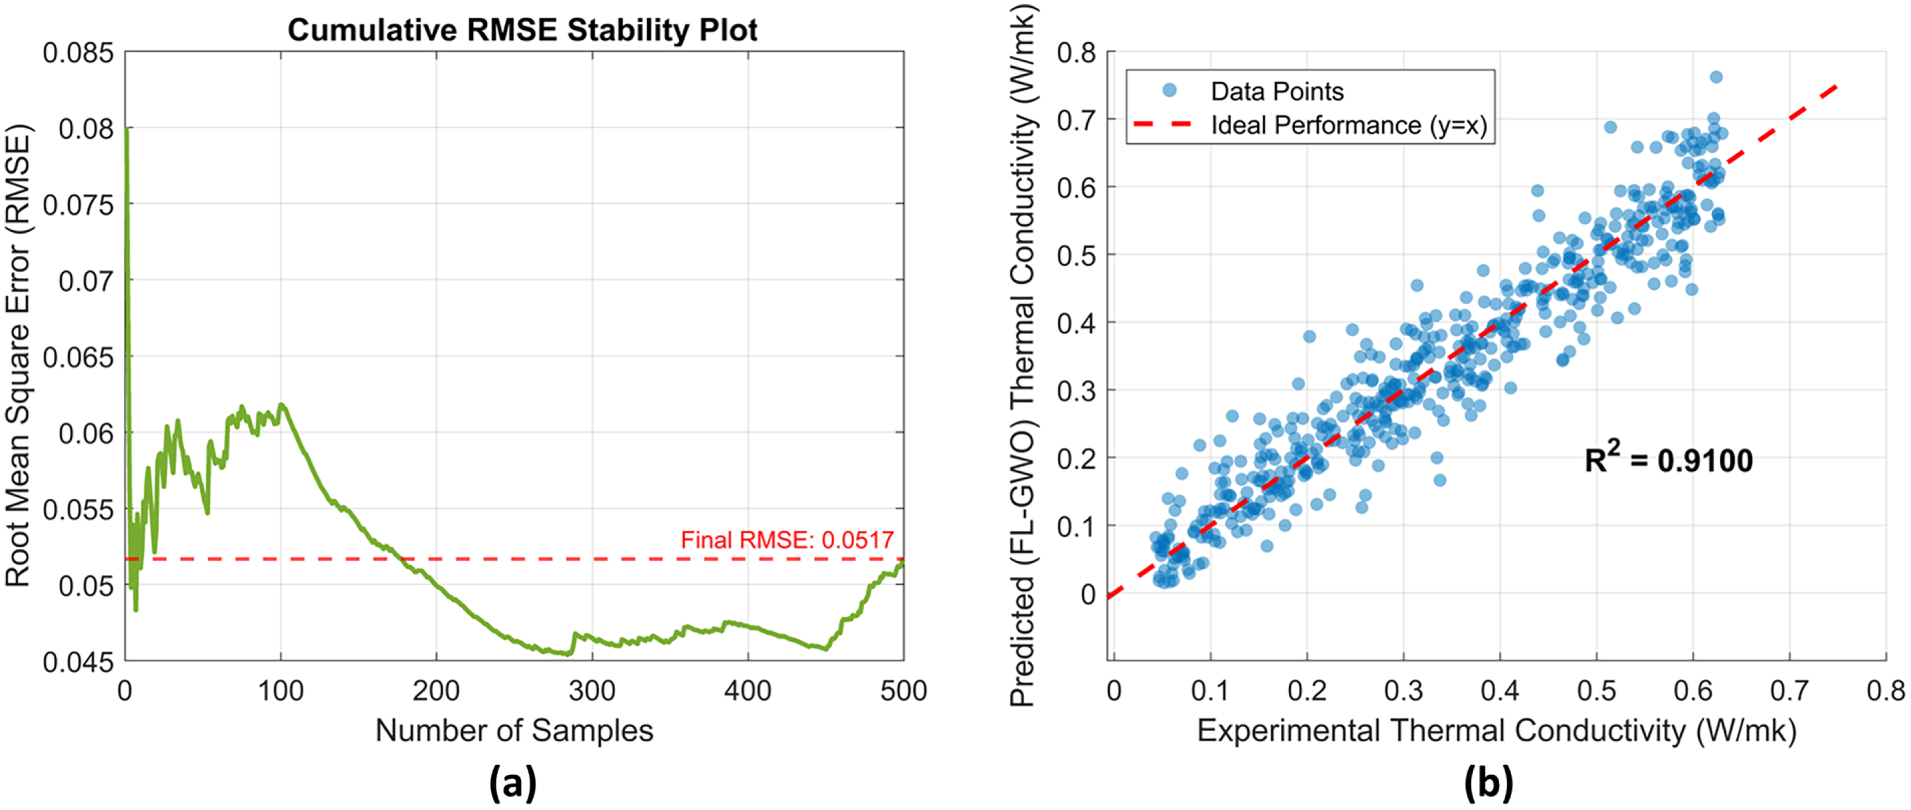
Figure 11: (a) The cumulative RMSE and (b) the R-squared value values in this study.
However,
It is clear from the summary statistics that the GWO-FL framework is capable of handling computations. Fig. 11a shows the RMSE over time. The hierarchical search process of the GWO, which is driven by Alpha, Beta, and Delta wolves, effectively fine-tunes the trapezoidal boundaries ([a, b, c, d]) of the fuzzy membership functions, as shown by the decrease in this error metric. The optimization avoids local optimization traps by methodically reducing the cumulative error, rather than accepting an imperfect intuitive calibration. At the same time, the strong correlation between our model’s predictions and the experimental benchmarks is quantified by the high R2 value shown in Fig. 11b. Results in this high range show that the interacting inputs of cellulose, hemicellulose, and moisture content fully explain more than 91% of the physical variability in fiber thermal conductivity. When it comes to designing environmentally friendly products, its statistical significance is quite useful. It should be highlighted that the observed measurements and the optimized fuzzy rules are in perfect agreement, proving that the GWO-FL method successfully accounts for non-linear transport physics without overfitting. Therefore, the model can be used as a reliable tool for composite manufacturers to select the optimal bio reinforcements (e.g., jute, flax, hemp) computationally, avoiding costly and time-consuming laboratory characterization protocols. Moreover, to confirm that the FL-GWO model possesses true predictive ability and not local overfitting, the metrics of the model calculated only on the independent test folds during cross-validation are presented in Fig. 11. The RMSE gradually decreases to a steady average of 0.0524 with the optimization of the trapezoidal membership function limits using the Grey Wolf Optimization method. Meanwhile, the test R2 goes up to 0.91. These are all out-of-sample-only measures; thus, this simultaneous improvement provides a mathematical proof of good generalization and a validation of the hyperparameter optimization framework.
Finally, a sensitivity analysis of the improved GWO-FL model was undertaken. It examined the influence of each input variable on the thermal conductivity. The effect of each parameter was studied individually with all other parameters held constant during the experimental range. The sensitivity analysis of the GWO-FL (Grey Wolf Optimizer-Fuzzy Logic) model is calculated based on the delta change ∆y of the fuzzy response surface. The following mathematical and procedure steps are used to calculate the sensitivity analysis of the GWO-FL model. Let the trained GWO-FL model be represented as a response surface function
4 Engineering Implications for Natural Fiber Utilization in Thermal Applications
The computational results and prediction rules optimized by the GWO-FL model have direct practical implications for the sustainable materials industry, especially for the development of thermal insulation panels, green building materials, and automotive interior parts. The usual way to select the right natural fiber for a thermal insulation board was to make experimental boards and then test their thermal properties, which was costly and time-consuming. The suggested GWO-FL model enables designers to utilize the raw chemical composition (cellulose and hemicellulose percentages) for any candidate fiber such as, coir, flax, hemp, jute, agricultural waste fibers, and forecast its bulk thermal performance immediately. For example, the model predicts that fibers with moderate hemicellulose and low cellulose are the most promising candidates for high thermal insulators due to their localized amorphous structural resistance to phonon transmission. Further, moisture concentration is a very dynamic environmental element that substantially impairs the insulating performance of natural fibers in real-world situations. The GWO-FL model quantitatively demonstrates the critical thresholds where moisture transitions from a minor impurity to the dominant thermal conductor. This offers material scientists specific design parameters for protective coatings, hydrophobic treatments, or polymer matrices needed to lock the fiber’s moisture below these crucial thresholds, assuring the long-term thermal stability of the composite. In addition to that, this model supports the circular economy by allowing researchers to quickly assess and exploit local agricultural waste streams (which have highly variable chemical compositions) as reliable thermal barriers by defining the exact physical relationships governing thermal conductivity. Consequently, this framework serves as a fast-track computational tool to accelerate the transition from synthetic insulation materials (like polyurethane and glass fibers) to fully biodegradable, high-performance natural fiber alternatives.
The shift to green composites is a significant evolution within materials science that has been largely influenced by the now-global imperative for a circular economy and sustainable practices in engineering. As this study has demonstrated, natural fibers—including flax, jute, and hemp—are no longer considered early-green fillers but rather fine biological reinforcements that can match conventional, synthetic alternatives. Yet, there are major challenges in designing thermal performance, as the chemical composition of these materials can significantly vary, and due to the complexity of the fiber-matrix interface, which is an important factor for successful processing into structural applications. This study overcomes these challenges by the fusion of experimental data with high-level computational intelligence, using a hybrid Fuzzy Logic (FL) and Grey Wolf Optimization (GWO) method. The fuzzy, nonlinear nature of biological materials may be effectively bridged with the precision required for industrial manufacturing using this method. The suggested FL-GWO model’s architectural advantage is due to its unique mix of language interpretability with mathematical optimization. Traditional regression and black-box machine learning methods (PR, SVR, ANN) do not have the structural capacity to accurately map the confusing localized thermal boundaries of natural fibers while keeping transparency or avoiding overfitting. Moreover, the GWO method has several mathematical benefits over other metaheuristics such as GA and PSO in the optimization of the fuzzy parameters. GA suffers from disruptive mutations, while PSO often gets stuck in premature local minima traps. GWO’s hierarchical hunting mechanism (via Alpha, Beta, and Delta parameters) ensures the ideal trade-off between global exploration and local exploitation. Such an algorithmic synergy allows FL-GWO to reach the lowest cross-validated error and the highest generalization capabilities among all examined frameworks. An effective alternative to the time-consuming and money-sucking procedure of conventional trial-and-error laboratory testing for predicting thermal conductivity is the FL-GWO model. It achieves this goal by paying close attention to important parameters, such as the moisture level and cellulose content. Finally, bio-products improved in reliability, weight, and stability at high temperatures can be achieved by the use of optimization methods led by artificial intelligence in biomaterial characterization. It will be imperative to accurately expand the knowledge of green composites’ thermal behavior, as this study paves the way for the development of future smart materials that draw inspiration from nature.
Acknowledgement: Not applicable.
Funding Statement: The authors received no specific funding for this study.
Author Contributions: The authors confirm contribution to the paper as follows: Conceptualization, Nashat Nawafleh and Faris M. Al-Oqla; methodology, Nashat Nawafleh; software, Nashat Nawafleh; validation, Nashat Nawafleh and Faris M. Al-Oqla; formal analysis, Nashat Nawafleh; investigation, Nashat Nawafleh; resources, Nashat Nawafleh and Faris M. Al-Oqla; data curation, Nashat Nawafleh; writing—original draft preparation, Nashat Nawafleh; writing—review and editing, Nashat Nawafleh and Faris M. Al-Oqla; visualization, Nashat Nawafleh; supervision, Nashat Nawafleh and Faris M. Al-Oqla; project administration, Nashat Nawafleh. All authors reviewed and approved the final version of the manuscript.
Availability of Data and Materials: Data available on request from the authors.
Ethics Approval: Not applicable.
Conflicts of Interest: The authors declare no conflicts of interest.
References
1. Zini E, Scandola M. Green composites: an overview. Polym Compos. 2011;32(12):1905–15. doi:10.1002/pc.21224. [Google Scholar] [CrossRef]
2. Rangappa SM, Siengchin S, Dhakal HN. Green-composites: ecofriendly and sustainability. Appl Sci Eng Prog. 2020;13(3):183–4. doi:10.14416/j.asep.2020.06.001. [Google Scholar] [CrossRef]
3. Shekar HSS, Ramachandra M. Green composites: a review. Mater Today Proc. 2018;5(1):2518–26. doi:10.1016/j.matpr.2017.11.034. [Google Scholar] [CrossRef]
4. Mann GS, Singh LP, Kumar P, Singh S. Green composites: a review of processing technologies and recent applications. J Thermoplast Compos Mater. 2020;33(8):1145–71. doi:10.1177/0892705718816354. [Google Scholar] [CrossRef]
5. Al-Oqla FM, Faris H, Habib M, Castillo PA. Evolving genetic programming tree models for predicting the mechanical properties of green fibers for better biocomposite materials. arXiv:2404.07213. 2024. [Google Scholar]
6. Al-Oqla FM, Hayajneh MT, Fares O. Investigating the mechanical thermal and polymer interfacial characteristics of Jordanian lignocellulosic fibers to demonstrate their capabilities for sustainable green materials. J Clean Prod. 2019;241:118256. doi:10.1016/j.jclepro.2019.118256. [Google Scholar] [CrossRef]
7. Al-Oqla FM, Sapuan SM, Ishak MR, Nuraini AA. Predicting the potential of agro waste fibers for sustainable automotive industry using a decision making model. Comput Electron Agric. 2015;113:116–27. doi:10.1016/j.compag.2015.01.011. [Google Scholar] [CrossRef]
8. Cao Y, Wu YQ. Evaluation of statistical strength of bamboo fiber and mechanical properties of fiber reinforced green composites. J Cent South Univ Technol. 2008;15(1):564–7. doi:10.1007/s11771-008-0422-z. [Google Scholar] [CrossRef]
9. Nam S, Netravali AN. Green composites. I. physical properties of ramie fibers for environment-friendly green composites. Fibres Polym. 2006;7(4):372–9. doi:10.1007/BF02875769. [Google Scholar] [CrossRef]
10. Mitra B. Environment friendly composite materials: biocomposites and green composites. Def Sci J. 2014;64(3):244–61. doi:10.14429/dsj.64.7323. [Google Scholar] [CrossRef]
11. Arao Y, Fujiura T, Itani S, Tanaka T. Strength improvement in injection-molded jute-fiber-reinforced polylactide green-composites. Compos Part B Eng. 2015;68:200–6. doi:10.1016/j.compositesb.2014.08.032. [Google Scholar] [CrossRef]
12. Abdur Rahman M, Haque S, Athikesavan MM, Kamaludeen MB. A review of environmental friendly green composites: production methods, current progresses, and challenges. Environ Sci Pollut Res Int. 2023;30(7):16905–29. doi:10.1007/s11356-022-24879-5. [Google Scholar] [CrossRef]
13. Islam MZ, Sarker ME, Rahman MM, Islam MR, Ahmed ATMF, Mahmud MS, et al. Green composites from natural fibers and biopolymers: a review on processing, properties, and applications. J Reinf Plast Compos. 2022;41(13–14):526–57. doi:10.1177/07316844211058708. [Google Scholar] [CrossRef]
14. Bismarck A, Mishra S, Lampke T. Plant fibers as reinforcement for green composites. In: Natural fibers, biopolymers, and biocomposites. Boca Raton, FL, USA: CRC Press; 2005. doi:10.1201/9780203508206.ch2. [Google Scholar] [CrossRef]
15. Hassan T, Jamshaid H, Mishra R, Khan MQ, Petru M, Novak J, et al. Acoustic, mechanical and thermal properties of green composites reinforced with natural fibers waste. Polymers. 2020;12(3):654. doi:10.3390/polym12030654. [Google Scholar] [CrossRef]
16. Takagi H, Kako S, Kusano K, Ousaka A. Thermal conductivity of PLA-bamboo fiber composites. Adv Compos Mater. 2007;16(4):377–84. doi:10.1163/156855107782325186. [Google Scholar] [CrossRef]
17. Osugi R, Takagi H, Liu K, Gennai Y. Thermal conductivity behavior of natural fiber-reinforced composites. In: Proceedings of the Asian Pacific Conference for Materials and Mechanics; 2009 Nov 13–16; Yokohama, Japan. [Google Scholar]
18. Ramful R. Thermal insulation performance of natural fibre-reinforced composites—a comprehensive review. J Renew Mater. 2026;14(1):1–10. doi:10.32604/jrm.2025.02025-0116. [Google Scholar] [CrossRef]
19. Mohammed L, Ansari MNM, Pua G, Jawaid M, Islam MS. A review on natural fiber reinforced polymer composite and its applications. Int J Polym Sci. 2015;2015(2):243947. doi:10.1155/2015/243947. [Google Scholar] [CrossRef]
20. Komuraiah A, Kumar NS, Prasad BD. Chemical composition of natural fibers and its influence on their mechanical properties. Mech Compos Mater. 2014;50(3):359–76. doi:10.1007/s11029-014-9422-2. [Google Scholar] [CrossRef]
21. Djafari Petroudy SR. Physical and mechanical properties of natural fibers. In: Advanced high strength natural fibre composites in construction. Amsterdam, The Netherlands: Elsevier; 2017. p. 59–83. doi:10.1016/b978-0-08-100411-1.00003-0. [Google Scholar] [CrossRef]
22. Li X, Tabil LG, Panigrahi S. Chemical treatments of natural fiber for use in natural fiber-reinforced composites: a review. J Polym Environ. 2007;15(1):25–33. doi:10.1007/s10924-006-0042-3. [Google Scholar] [CrossRef]
23. Elfaleh I, Abbassi F, Habibi M, Ahmad F, Guedri M, Nasri M, et al. A comprehensive review of natural fibers and their composites: an eco-friendly alternative to conventional materials. Results Eng. 2023;19(3):101271. doi:10.1016/j.rineng.2023.101271. [Google Scholar] [CrossRef]
24. Bakar N, Chin SC, Siregar JP, Ngien SK. A review on physical, mechanical, thermal properties and chemical composition of plant fibers. IOP Conf Ser Mater Sci Eng. 2020;736(5):052017. doi:10.1088/1757-899x/736/5/052017. [Google Scholar] [CrossRef]
25. Costa CSMF, Fonseca AC, Serra AC, Coelho JFJ. Dynamic mechanical thermal analysis of polymer composites reinforced with natural fibers. Polym Rev. 2016;56(2):362–83. doi:10.1080/15583724.2015.1108334. [Google Scholar] [CrossRef]
26. Ramachandran A, Mavinkere Rangappa S, Kushvaha V, Khan A, Seingchin S, Dhakal HN. Modification of fibers and matrices in natural fiber reinforced polymer composites: a comprehensive review. Macromol Rapid Commun. 2022;43(17):2100862. doi:10.1002/marc.202100862. [Google Scholar] [CrossRef]
27. Mohammed M, Rasidi M, Mohammed A, Rahman R, Osman A, Adam T, et al. Interfacial bonding mechanisms of natural fibre-matrix composites: an overview. BioResources. 2022;17(4):7031. doi:10.15376/biores.17.4.mohammed. [Google Scholar] [CrossRef]
28. George J, Sreekala MS, Thomas S. A review on interface modification and characterization of natural fiber reinforced plastic composites. Polym Eng Sci. 2001;41(9):1471–85. doi:10.1002/pen.10846. [Google Scholar] [CrossRef]
29. John MJ, Anandjiwala RD. Recent developments in chemical modification and characterization of natural fiber-reinforced composites. Polym Compos. 2008;29(2):187–207. doi:10.1002/pc.20461. [Google Scholar] [CrossRef]
30. Karthi N, Kumaresan K, Sathish S, Gokulkumar S, Prabhu L, Vigneshkumar N. An overview: natural fiber reinforced hybrid composites, chemical treatments and application areas. Mater Today Proc. 2020;27(2015):2828–34. doi:10.1016/j.matpr.2020.01.011. [Google Scholar] [CrossRef]
31. Kickert WJM, Mamdani EH. Analysis of a fuzzy logic controller. In: Readings in fuzzy sets for intelligent systems. Amsterdam, The Netherlands: Elsevier; 1993. p. 290–7. doi:10.1016/b978-1-4832-1450-4.50033-x. [Google Scholar] [CrossRef]
32. Bai Y, Wang D. Fundamentals of fuzzy logic control—fuzzy sets, fuzzy rules and defuzzifications. In: Advanced fuzzy logic technologies in industrial applications. London, UK: Springer; 2006. p. 17–36. doi:10.1007/978-1-84628-469-4_2. [Google Scholar] [CrossRef]
33. Guo S, Peters L, Surmann H. Design and application of an analog fuzzy logic controller. IEEE Trans Fuzzy Syst. 1996;4(4):429–38. doi:10.1109/91.544303. [Google Scholar] [CrossRef]
34. Johansen TA, Shorten R, Murray-Smith R. On the interpretation and identification of dynamic Takagi-Sugeno fuzzy models. IEEE Trans Fuzzy Syst. 2000;8(3):297–313. doi:10.1109/91.855918. [Google Scholar] [CrossRef]
35. Tabakov M, Chlopowiec AB, Chlopowiec AR. A novel classification method using the Takagi–Sugeno model and a type-2 fuzzy rule induction approach. Appl Sci. 2023;13(9):5279. doi:10.3390/app13095279. [Google Scholar] [CrossRef]
36. Zhang Y, Wang G, Zhou T, Huang X, Lam S, Sheng J, et al. Takagi-Sugeno-Kang fuzzy system fusion: a survey at hierarchical, wide and stacked levels. Inf Fusion. 2024;101(3):101977. doi:10.1016/j.inffus.2023.101977. [Google Scholar] [CrossRef]
37. Faris H, Aljarah I, Al-Betar MA, Mirjalili S. Grey wolf optimizer: a review of recent variants and applications. Neural Comput Appl. 2018;30(2):413–35. doi:10.1007/s00521-017-3272-5. [Google Scholar] [CrossRef]
38. Almufti SM, Ahmad HB, Marqas RB, Asaad RR. Grey wolf optimizer: overview, modifications and applications. Int Res J Sci Technol Educ Manag. 2021;1(1):44–56. [Google Scholar]
39. Saremi S, Mirjalili SZ, Mirjalili SM. Evolutionary population dynamics and grey wolf optimizer. Neural Comput Appl. 2015;26(5):1257–63. doi:10.1007/s00521-014-1806-7. [Google Scholar] [CrossRef]
40. David Mech L. Alpha status, dominance, and division of labor in wolf packs. Can J Zool. 1999;77(8):1196–203. doi:10.1139/z99-099. [Google Scholar] [CrossRef]
41. Muro C, Escobedo R, Spector L, Coppinger RP. Wolf-pack (Canis lupus) hunting strategies emerge from simple rules in computational simulations. Behav Processes. 2011;88(3):192–7. doi:10.1016/j.beproc.2011.09.006. [Google Scholar] [CrossRef]
Cite This Article
 Copyright © 2026 The Author(s). Published by Tech Science Press.
This work is licensed under a Creative Commons Attribution 4.0 International License , which permits unrestricted use, distribution, and reproduction in any medium, provided the original work is properly cited.
 Downloads
 Citation Tools
