
 Submit a Paper
 Propose a Special lssue
 Open Access
ARTICLE

Efficiency Performances of LVDC Supplies for Residential Building
Department of Electrical Engineering, College of Engineering and Islamic Architecture, Umm Al Qura University, Makkah, KSA
* Corresponding Author: Anis Ammous. Email:
Computer Systems Science and Engineering 2023, 45(2), 2171-2186. https://doi.org/10.32604/csse.2023.029389
Received 03 March 2022; Accepted 20 April 2022; Issue published 03 November 2022
 View Full Text
 Download PDF
Abstract
The Low Voltage Direct Current (LVDC) architecture gives higher benefits over the classic low-voltage alternating current (LVAC) supply concept. LVDC has fewer energy conversion stages, is compatible with renewable energy sources, and is easier to integrate with accumulators. In this paper, an LVDC supply concept is proposed and compared with currently used conventional photovoltaic (PV) systems in terms of efficiency. The new LVDC photovoltaic system behavior is validated using LTspice modeling tool. The findings of this work prove that the concept of LVDC supply is highly attractive when the electricity produced by the photovoltaic is used onsite in the daytime. To carry out an efficient system, the PV power mounted in the houses should be precisely rated with respect to the magnitude of the load energy consumption. We proposed three house examples to verify the superiority of our proposed system in comparison with the traditional LVDC PV chain. An annual analysis of the energy saved by the studied systems was carried out. The main benefit of the suggested LVDC supply is the short way taken by the energy generated by the photovoltaic system to supply DC loads within daytime hours. The registered increase in system efficiency reached more than 20% for the proposed LVDC system.Keywords
The solar PV system is used in many power applications, such as clocks, computers, and several devices. It may effectively feed many DC consumers. In the last few years, on-grid PV systems have turned more and more important for power production. In this work, the energy-saving of the suggested LVDC PV chain is confronted with a classical LVDC architecture and the usual (LVAC) PV chain that feeds AC devices. The investigated PV supplies are grid-tied and aimed to feed households and offices.
In the latest years, each academia and industry have grown to be extra interested in LVDC systems. Low-voltage DC structures have numerous advantages over conventional AC structures, such as higher power performance and easier insertion of sustainable supplies. Multiple aspects affecting power quality and reliability enable the use of DC supplies as a replacement for alternating power systems (AC). Exploiting DC rather than AC could put off many energy conversion losses by using auto-consumption of the power generated locally and decreasing power fed by the utility. DC loads including the ones in houses and offices, cooling/heating systems, and large equipment systems including drives have adopted DC electromechanical machines. Because DC circuits don’t have the skin effect or power factor issue, they're more highly efficient than AC circuits [1–5].
Subsequently, Lasseter [6] provided the DC microgrid concept as a Low Voltage distribution system. The concept was envisaged as the destiny of LV distribution network incurring drastic change due to the development of autonomous manufacturing and deregulation of the marketplace. The basic idea is to include small electricity resources and appliances into a single entity that can answer rapidly to the needs of the distribution network.
LVDC circuit was set up for many years for particular intentions along with aerospace, automobile and marine [7–9]. Consistent with the literature look at, LVDC structures for commercial programs have received giant recognition within the closing a long time, especially in the telecommunication zone, on ships and in homes. In statistics centres, the usage of DC improves performance, reduces capital expenses, will increase reliability and improves electricity properties [10]. LVDC concepts had been appreciably researched in computing centres. Numerous leading projects were conducted within the United States, Europe, Asia and Oceania. In keeping with these projects, the advantages of DC in computing centres involve a range of 10%–30% reduction in power need, a 15% decrease in capital price, a less difficult conception, a potential increase in reliability, lower volumes, a reduced influence of the environment, and decreased heat sink requirements [11]. The most important undertaking for DC network systems is the deficiency of norms, coding, commercialized equipment, and guidelines [12].
Monte Carlo simulation evaluated DC structures’ technical and monetary feasibility for household use in Texas, dedicated for numerous grid topologies. The network architectures were examined in different cases: one including and another exempt from the storage system. The results show that the use of DC current in the residence can save between 9 and 20% of electricity. Including batteries to store the surplus of solar PV electricity can save 14 to 25% of the energy. Furthermore, DC cooling condensing systems can save energy in the range of 7% and 16% [13]. Moreover, in [14], the authors demonstrate that the LVDC network system is more effective than the AC network. The total performance of LVAC and LVDC networks is 78.24% and 84.6%, respectively. The above evaluation includes only the power conversion losses.
Through the previous work [7,15–20], it has been revealed that local DC networks are an interesting option for tying sustainable DC power supplies such as solar panels with DC requirements such as the lighting in households and data centers. Furthermore, according to the research in [21], DC networks are a practical option for classical AC networks, especially for the integration of renewable forms of energy. For instance, the DC network enables a 25% decrease in power consumption when households are fed from the grid and PV panels.
This paper compares, in terms of energy, the efficiency of the suggested LVDC PV supply with a traditional LVDC architecture and the usual (LVAC) PV chain that feeds AC loads. The paper is structured as follows: within the first part, diverse PV chains are provided. In this section, the benefits of the use of the LVDC supply are depicted. In the second part, the equivalent models of the used semiconductor components are described. These models are used to determine the efficiency of the considered power circuits in the PV systems. The PV panels model, as well as the MPPT technique implementation, are provided in part three of this work; in this section, the computation results of the suggested new PV nanogrid are presented. In the last part of this work, the energy performance of the suggested LVDC supply concept is discussed in comparison with the conventional LVDC architecture. For this purpose, household power demand profiles are studied and the Jeddah site in Saudi Arabia was selected for this analysis.
2 The Investigated PV Nanogrids
The conventional LVAC architecture (System 1) associated with a low-voltage grid is presented in Fig. 1. The MPPT technique governs the DC/DC converter (η1). The converter (η2) transfers the current generated by the PV system and injected it into the AC network, in addition, it ensures that the input voltage of the inverter is adjusted to (400 V). This voltage level is widely applied in on-grid PV chains as it provides accurate transformation to the level 230 V AC [22].
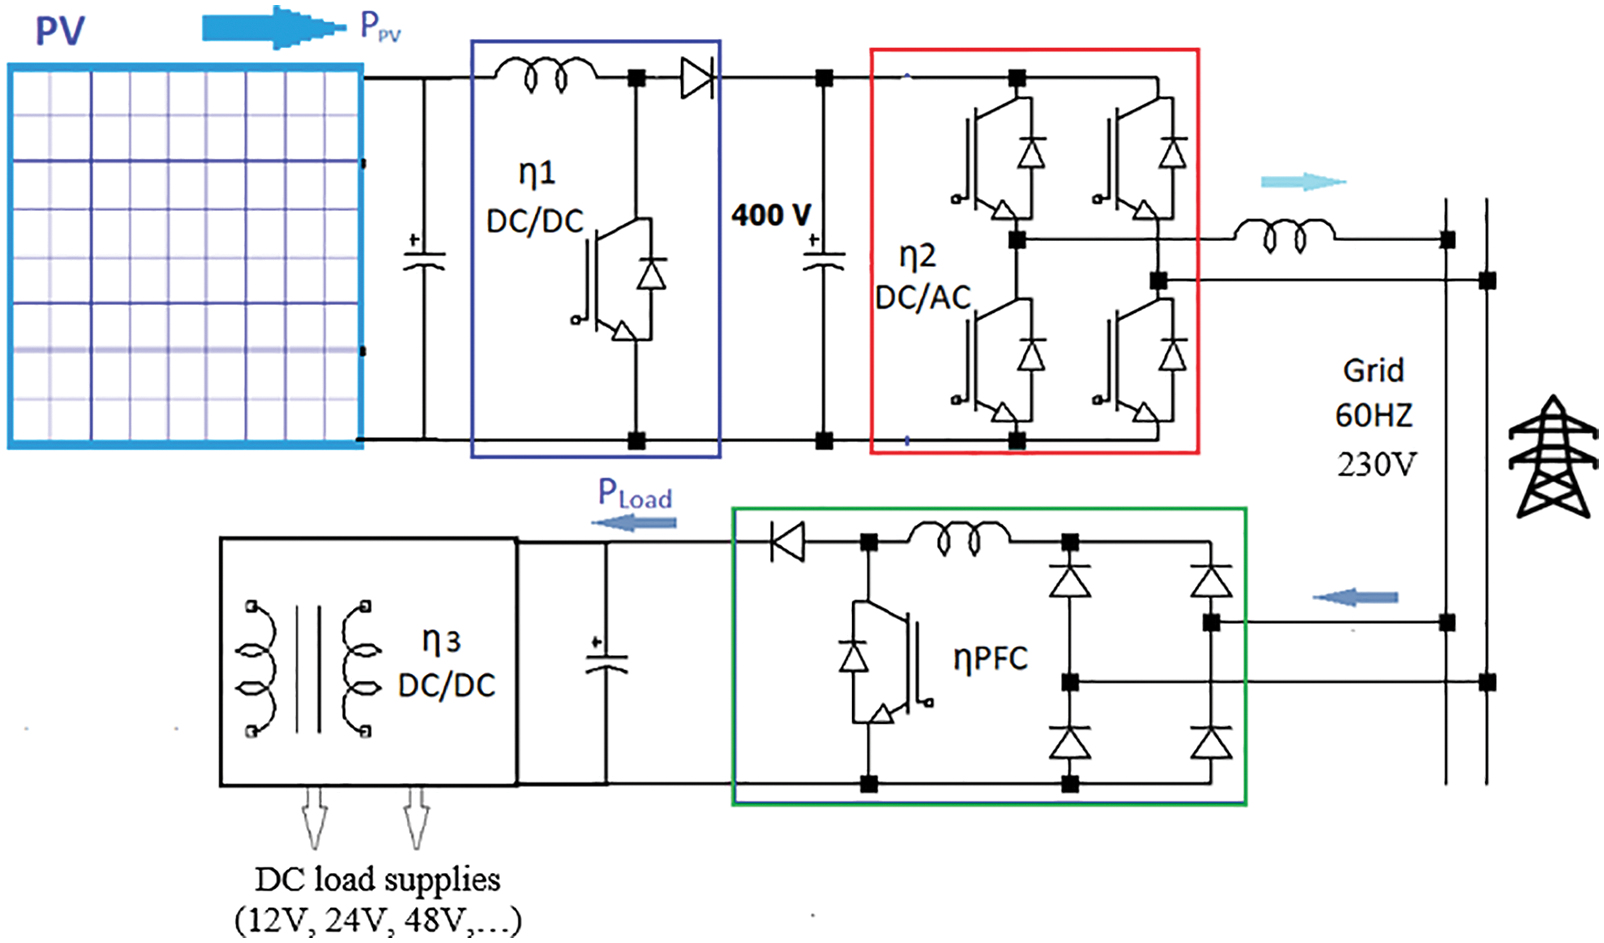
Figure 1: Traditional LVAC PV system (system 1)
Another frequently exploited LVDC nanogrid (system 2) is shown in Fig. 2. This PV chain uses a DC power conversion to feed DC-type equipment and devices. This is achieved through the 400 V DC bus and a DC /DC converter (η3), adapting DC low voltage level to the load.
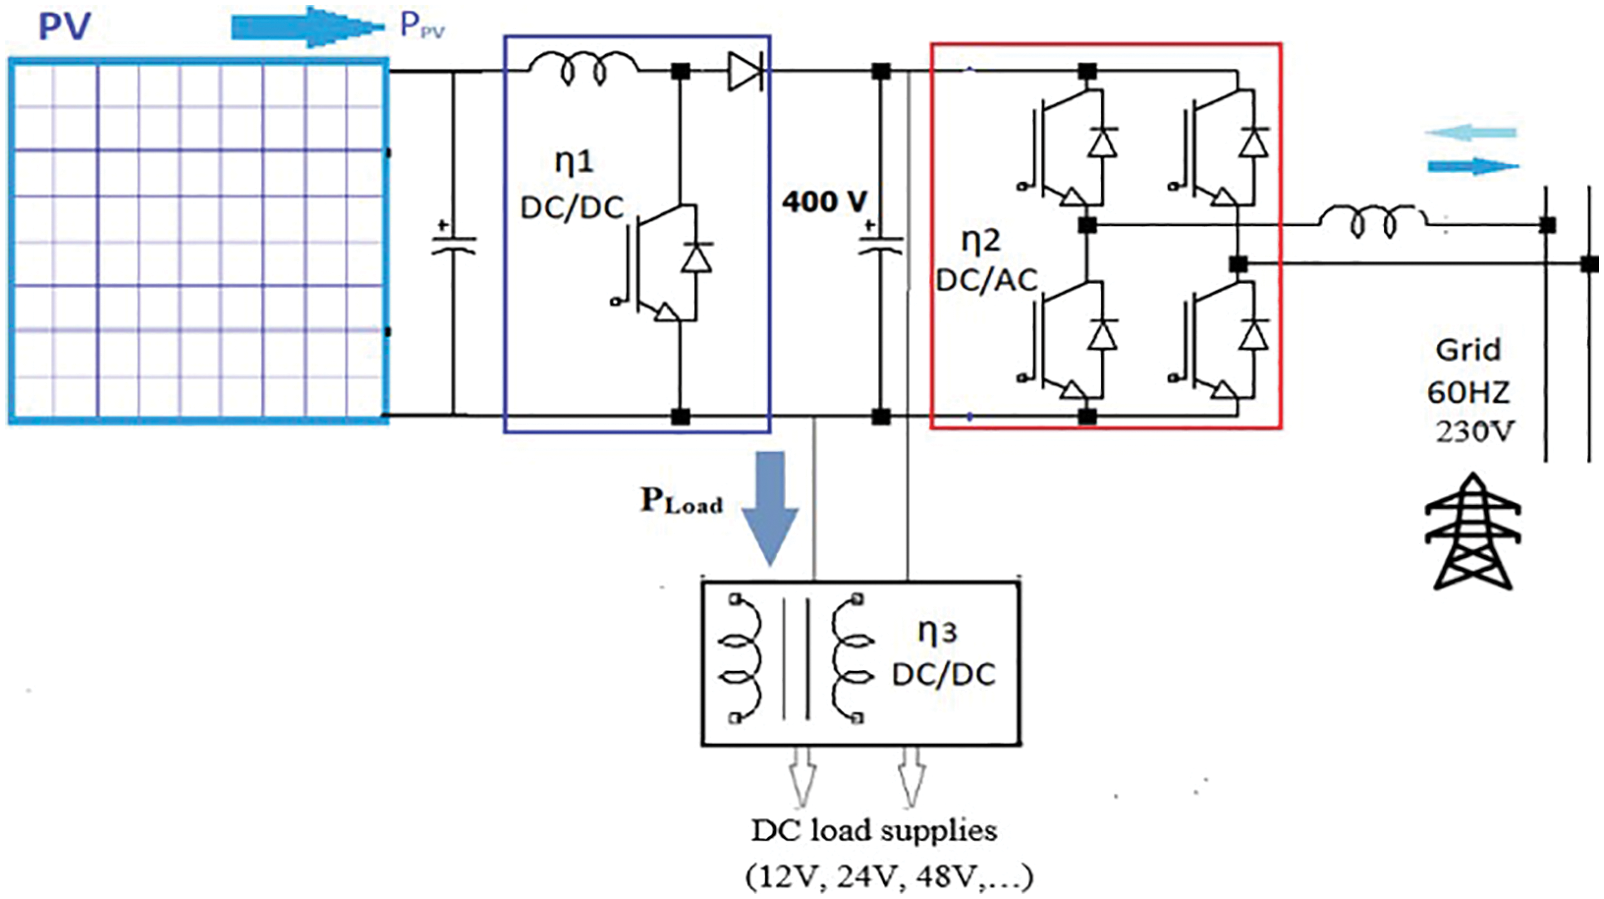
Figure 2: Conventional LVDC system (system 2)
The novel LVDC architecture (system 3) exploits the terminal voltage across the PV panels. This DC voltage is variable within a given range depending on the associations (series/parallel) of the PV panels and the no-load voltage at every panel. The structure of the novel PV architecture is shown in Fig. 3.
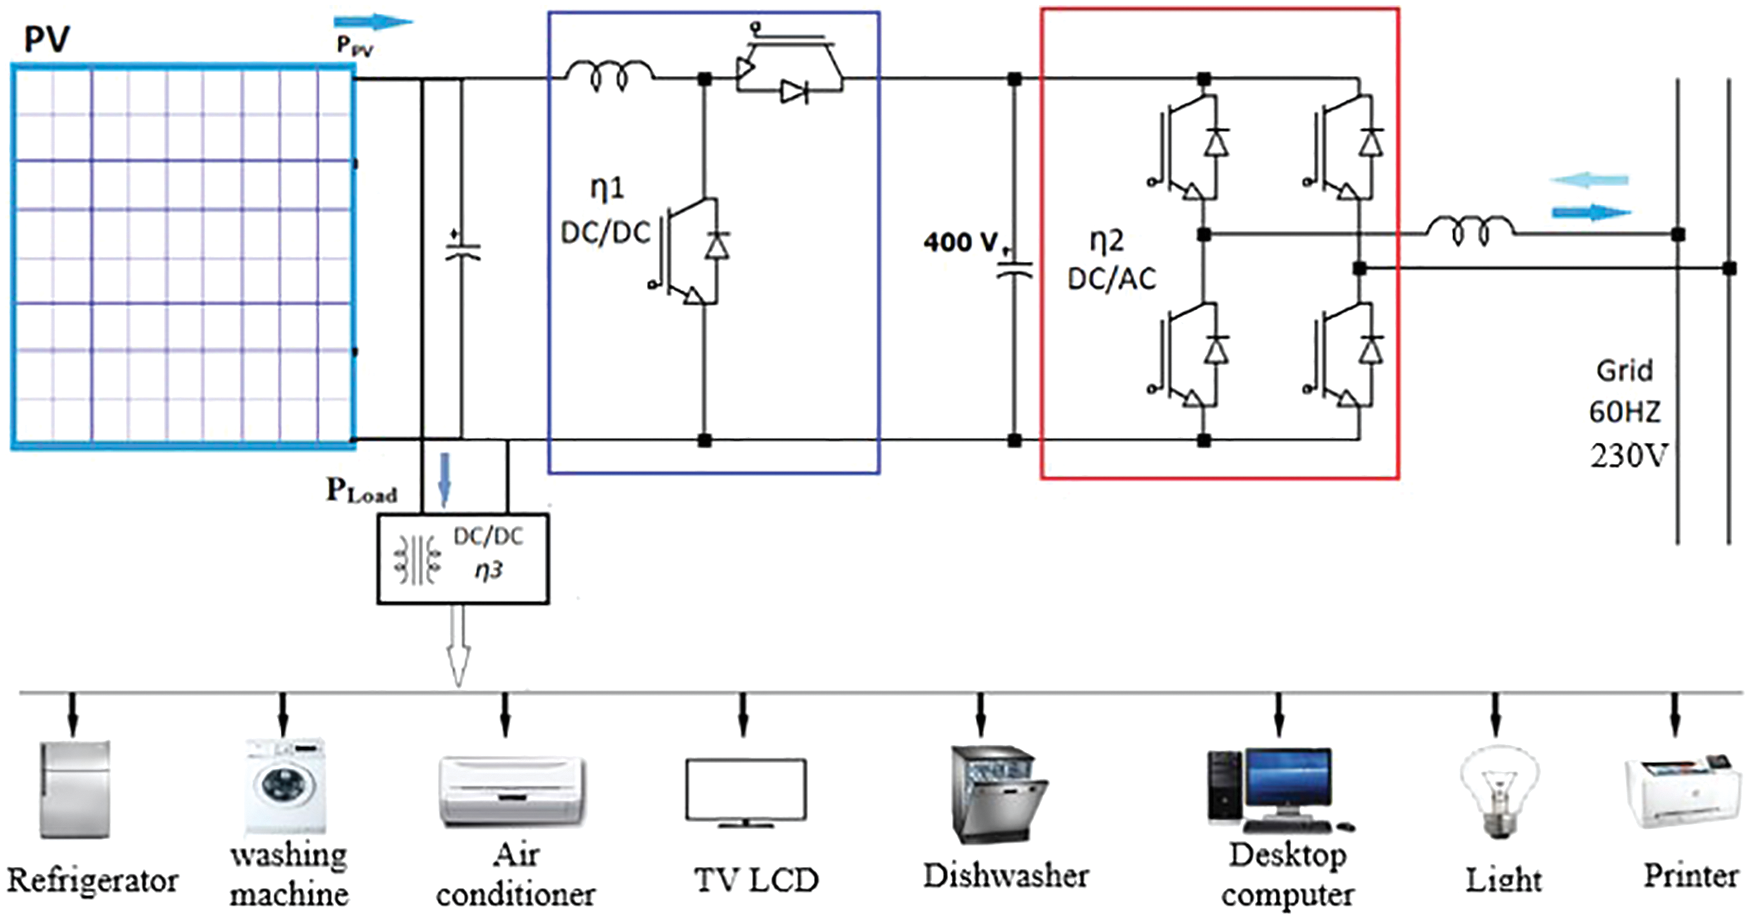
Figure 3: Proposed LVDC architecture for house applications (system 3)
The DC/DC chopper (η3), commonly a buck one, controls the DC voltage levels feeding the loads. The DC /DC chopper (η1) is a reversible step-up-down one. This dc/dc chopper enables energy to be transmitted from the PV panels to the converter (η2) once the used energy by the load is much less than the electricity generated by the PV. Inversely, when the power absorbed by the load exceeds the one generated through the PV, this reversible DC chopper serves as a buck circuit and transmits power from the inverter (η2) which is drawn from the grid.
System 2 and system 3 use an identical number of converters. The benefit of the novel LVDC nanogrid is that the distance taken by the current from the PV terminals to the DC appliances is smaller during day hours corresponding to PV power availability. Nevertheless, in the absence of PV energy, the electrical way from the grid to the appliances will become higher. To assess the studied PV systems performances, computations are carried out during a representative day (24 h/day) in every season. Subsequently, economized energy is assessed for a complete year (365 days).
3 Power Electronics Converters Modeling
The transistors used in the different converters are the N-channel Insulated-Gate Bipolar Transistor IKW30N60T including antiparallel diodes from Infineon [23]. A machine learning technique is used to calibrate the device’s model variables using the manufacturer datasheets. The used model is based on a behavioral representation of the device’s electrical characteristics.
The corresponding circuit of the diode behaviour model is presented in Fig. 4a. The model consists of a Simulation Program with Integrated Circuit Emphasis (SPICE) built-in diode model, a series resistor R1, and a current source in parallel [24]. The following equation gives the variable resistance R1:
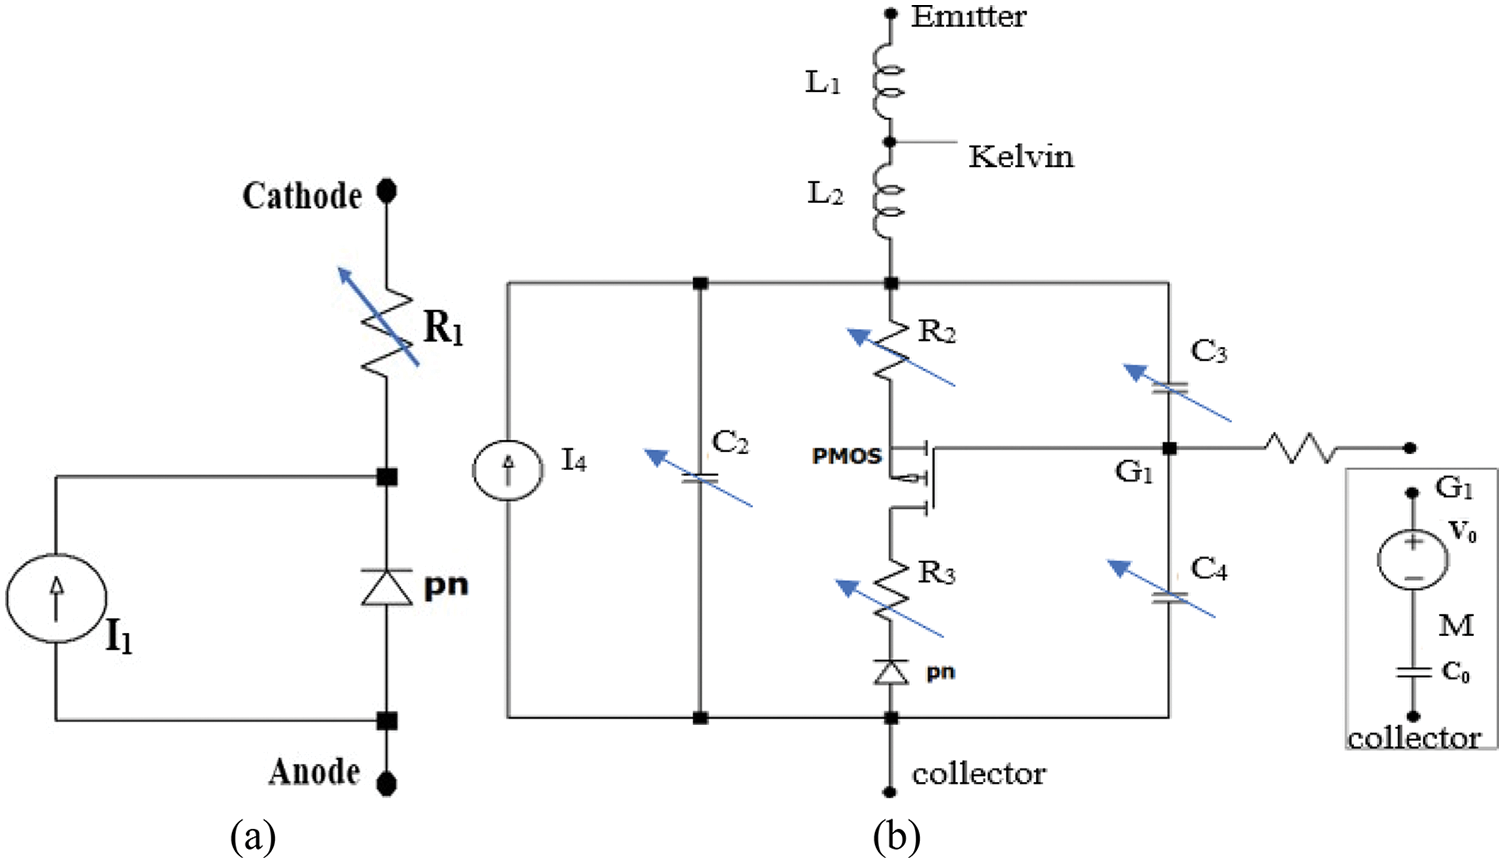
Figure 4: (a) Equivalent circuit of the power diode, (b) The Equivalent circuit of the used IGBT [24]
The parameters a, b, and c are fitting parameters used to adjust different parts of the forward characteristics of the diode.
The simulated circuit of the IGBT behavior is presented in Fig. 4b. The circuit contains a SPICE model of a p-channel MOSFET and diode, current source, two supplementary adjustable resistances R2 and R3. These resistances adjust specific electrical characteristics, and the capacitances C2, C3, and C4 are voltage-dependent. The method used to implement the behavioral model is defined as a series connection of a capacitor C0 scaled by a controlled voltage source V0; as an example of C4, the voltage dependence of V0 is defined by the following equation:
The inductance L1 and L2 are parasitic inductances due to the semiconductors bonding, and the resistor R4 is the internal gate resistance [24].
The I(V) characteristics of the transistor and the diode obtained by simulation and datasheet [25] are shown in Fig. 5.
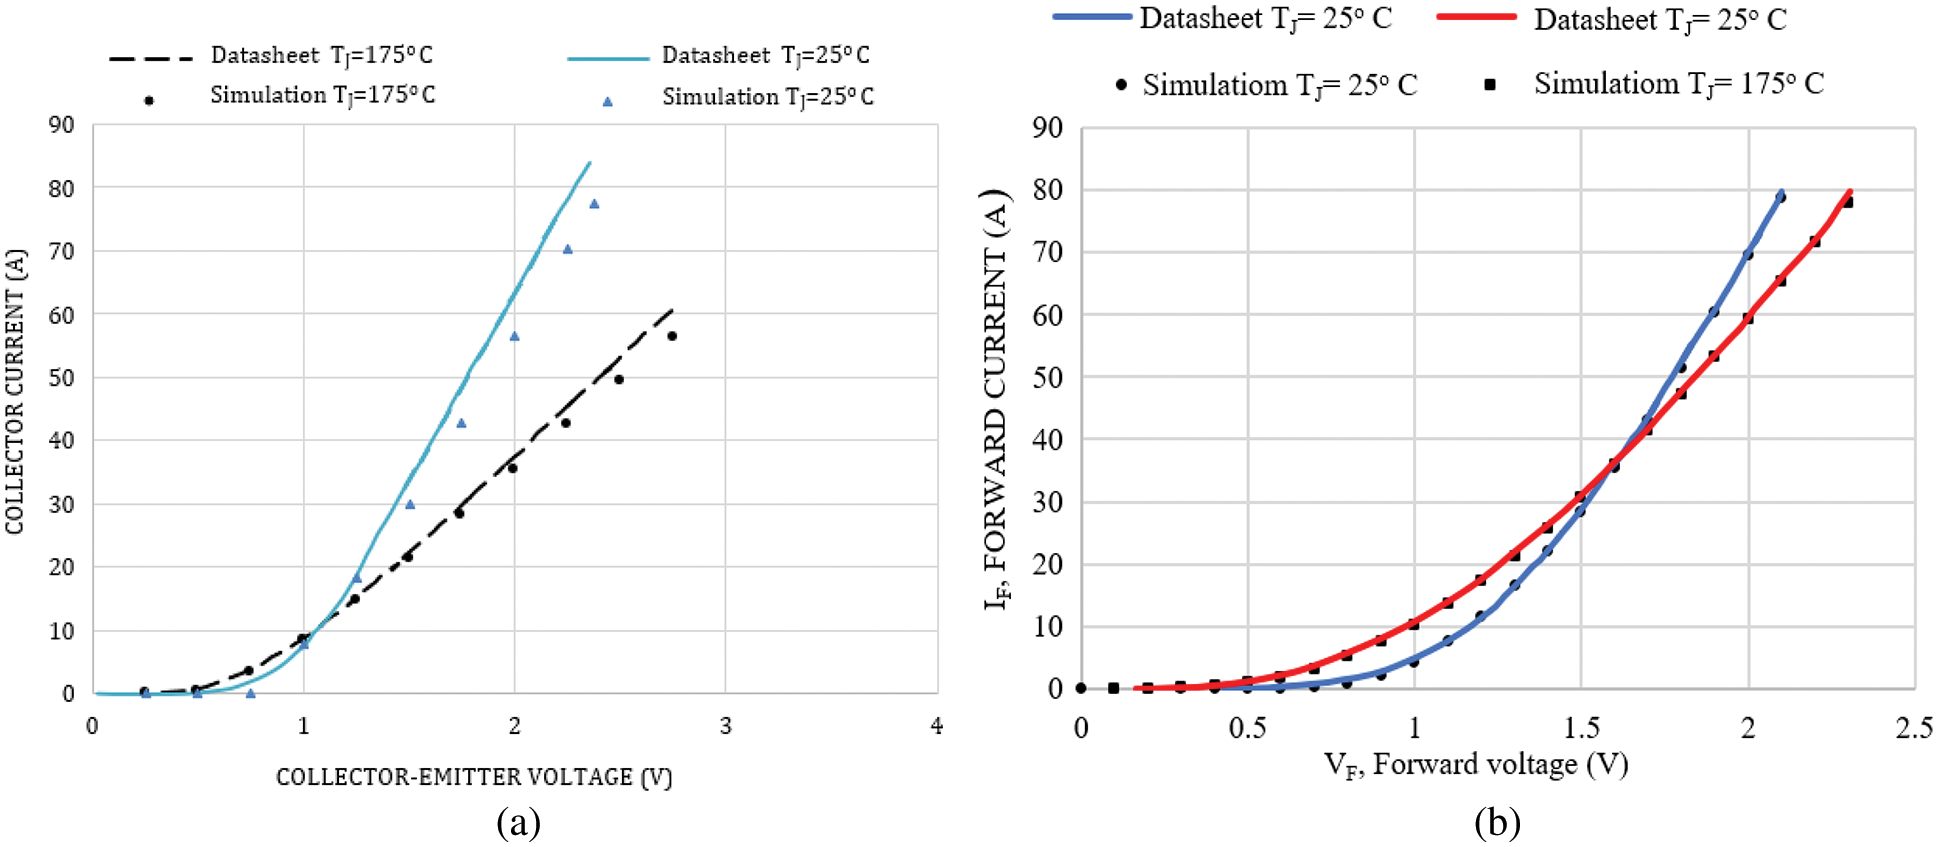
Figure 5: (a) I(V) static characteristics of the IGBT (IKW30N60T) @ Tj = 175°C, 25°C. (b) I(V) static characteristics in the body diode of the IGBT
The switching losses of the transistor/diode elementary cell are shown in Fig. 6a. (Est) are the total switching losses when the controlled power device is switched on and off. The efficiency of the different converters determined by simulations according to the transmitted power is shown in Fig. 6b.
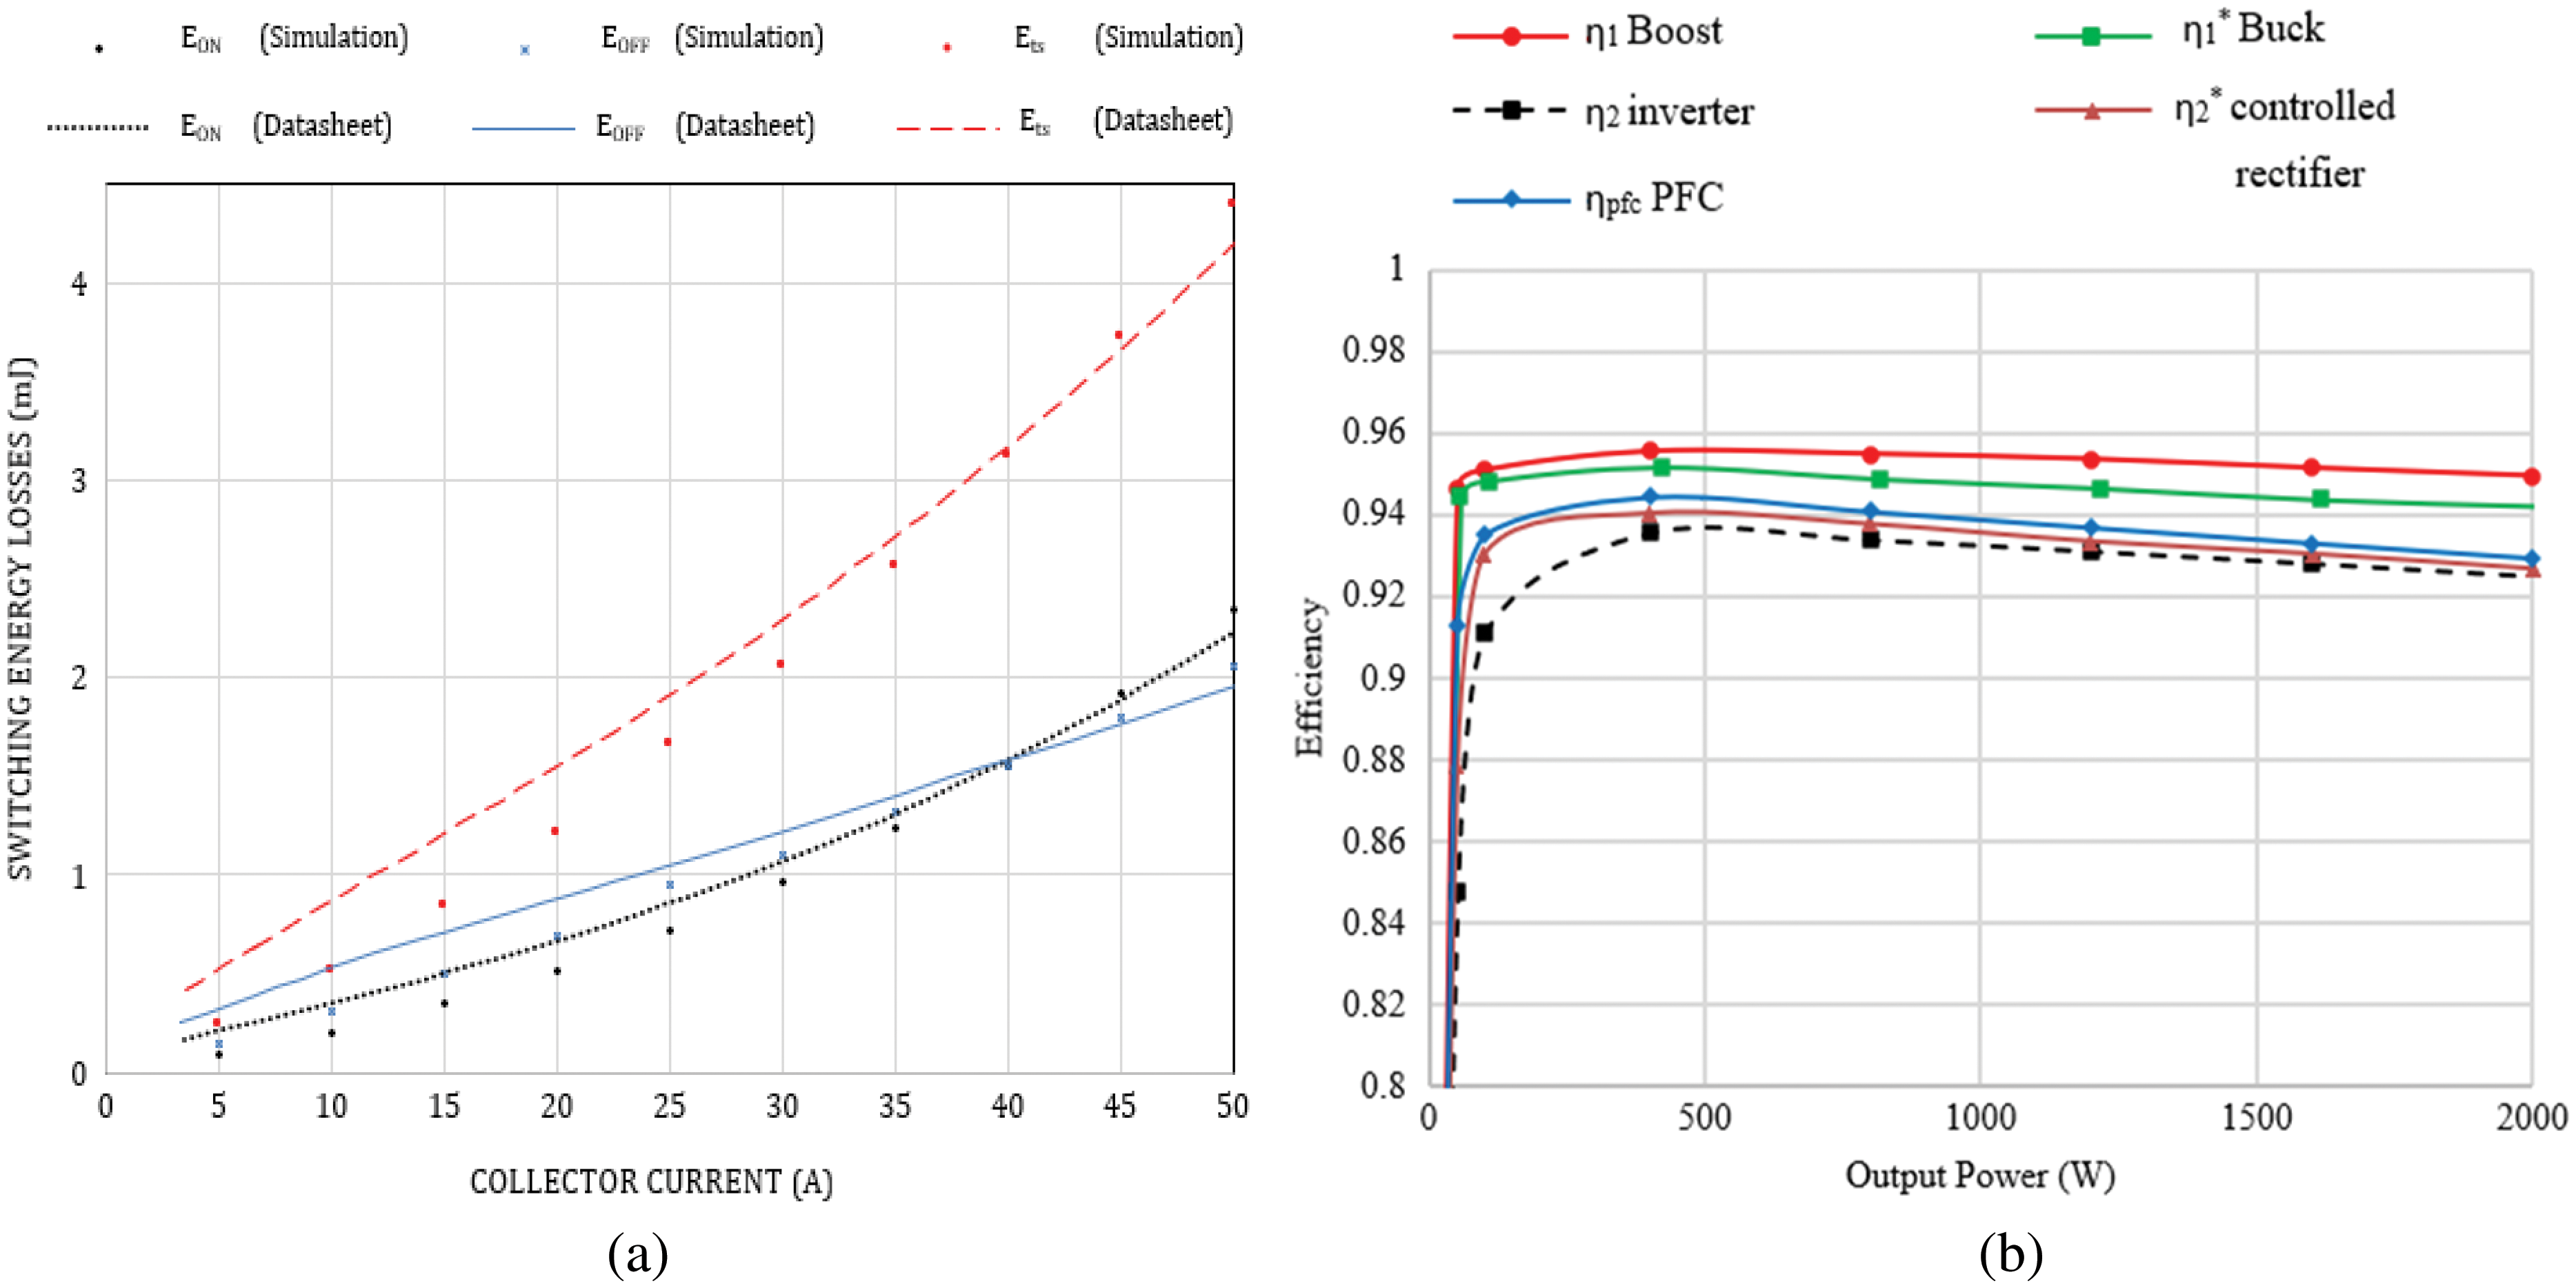
Figure 6: (a) switching energy losses (Tj = 175°C, VCE = 400 V, RG = 10 Ω, VGE = 0/15 V). (b) The efficiency evolutions, of the used converters, according to output power in each converter
4 The Proposed LVDC System Implementation in LTspice
The equivalent circuit of the PV panel used to compute the novel LVDC architecture (system 3) consists of a generator of current with a parallel resistor, a series resistor as given in Fig. 7a. The generator and diode currents are modeled by an ideal current generator determined by the below equation [26]:
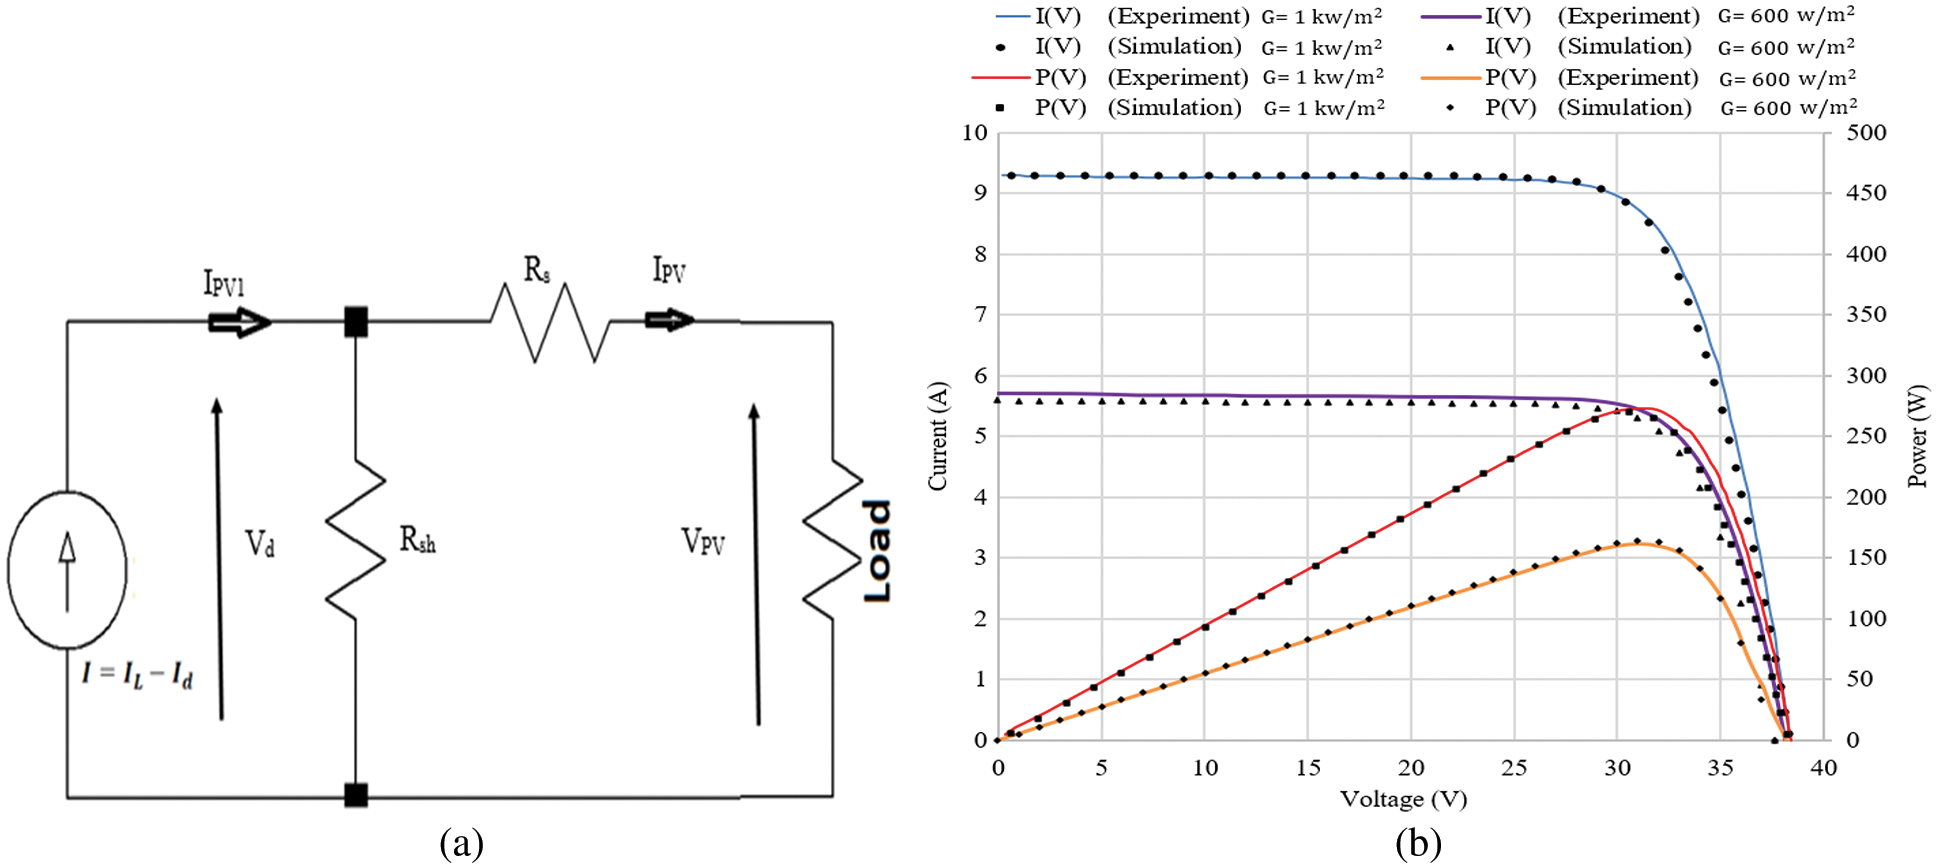
Figure 7: (a) The equivalent circuit of the PV model, (b) I(V) and P(V) curves of the PV panel
where,
IL is the sunlight current (A). Io is the diode inverse saturation current (A). Qd is the diode ideality factor, ns is the number of cells in series. Vd is the voltage at the diode terminals. VT is the thermal voltage (V).
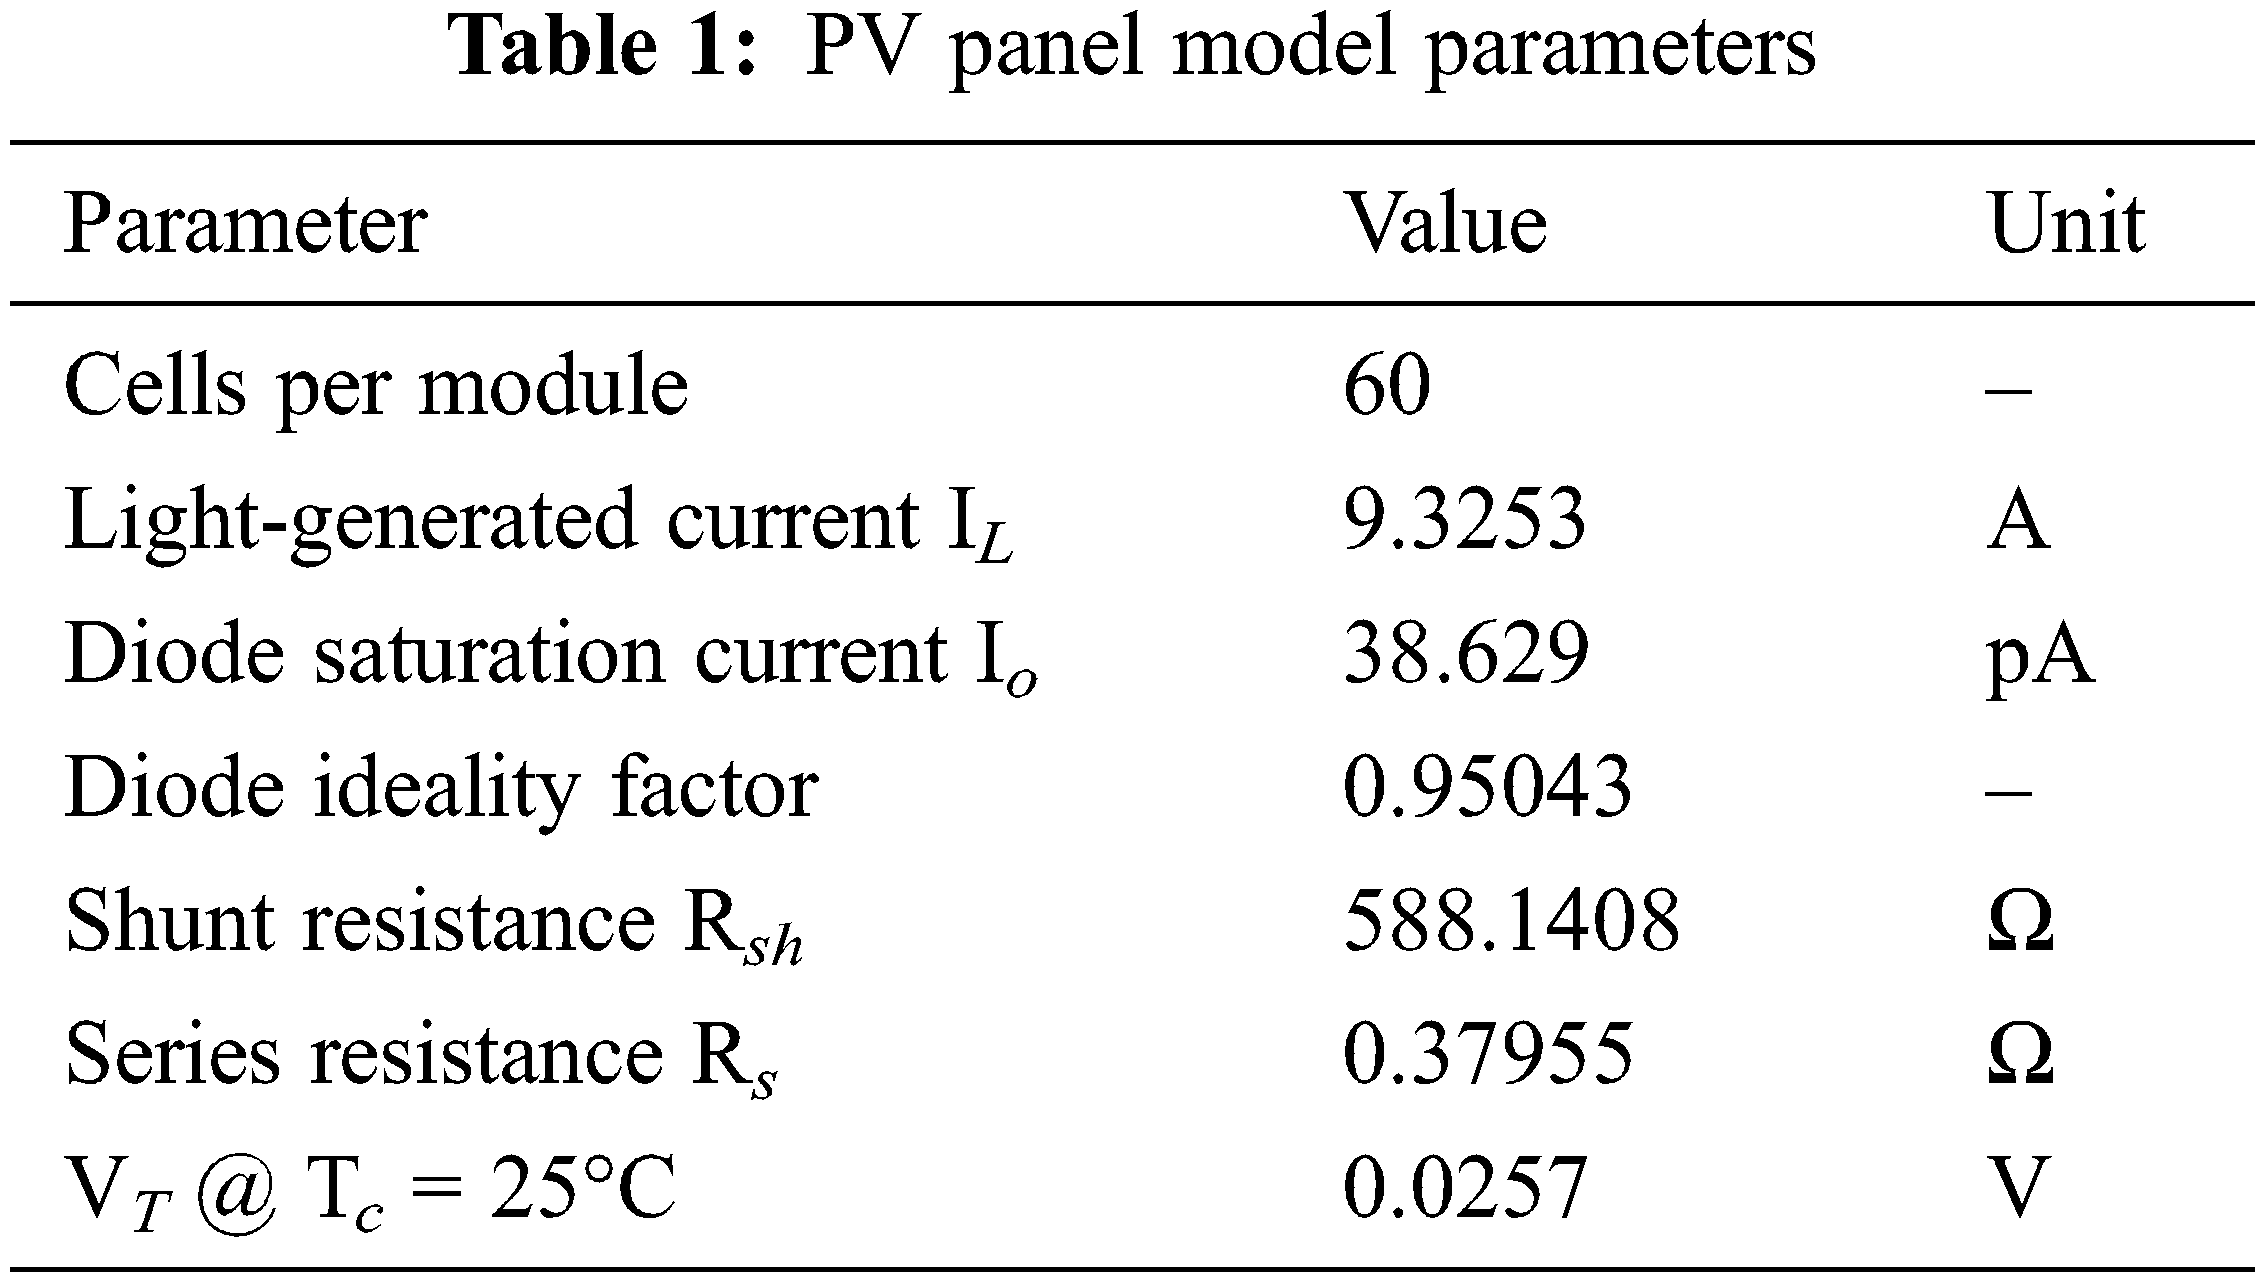
The values of the PV panel equivalent circuit devices are provided in Tab. 1. The static curves I(V) and P(V) of the chosen PV panels (JAM6(k)-60/250-270) under the usual test conditions were determined by models computations and experimentations at G = 1 kW/m2 and 600 W/m2 are given in (Fig. 7b).
The entire circuit of the new LVDC architecture (system 3) is presented in Fig. 8. The PV panels are organized as two in a parallel chain of four series panels (2 kW) in this part.
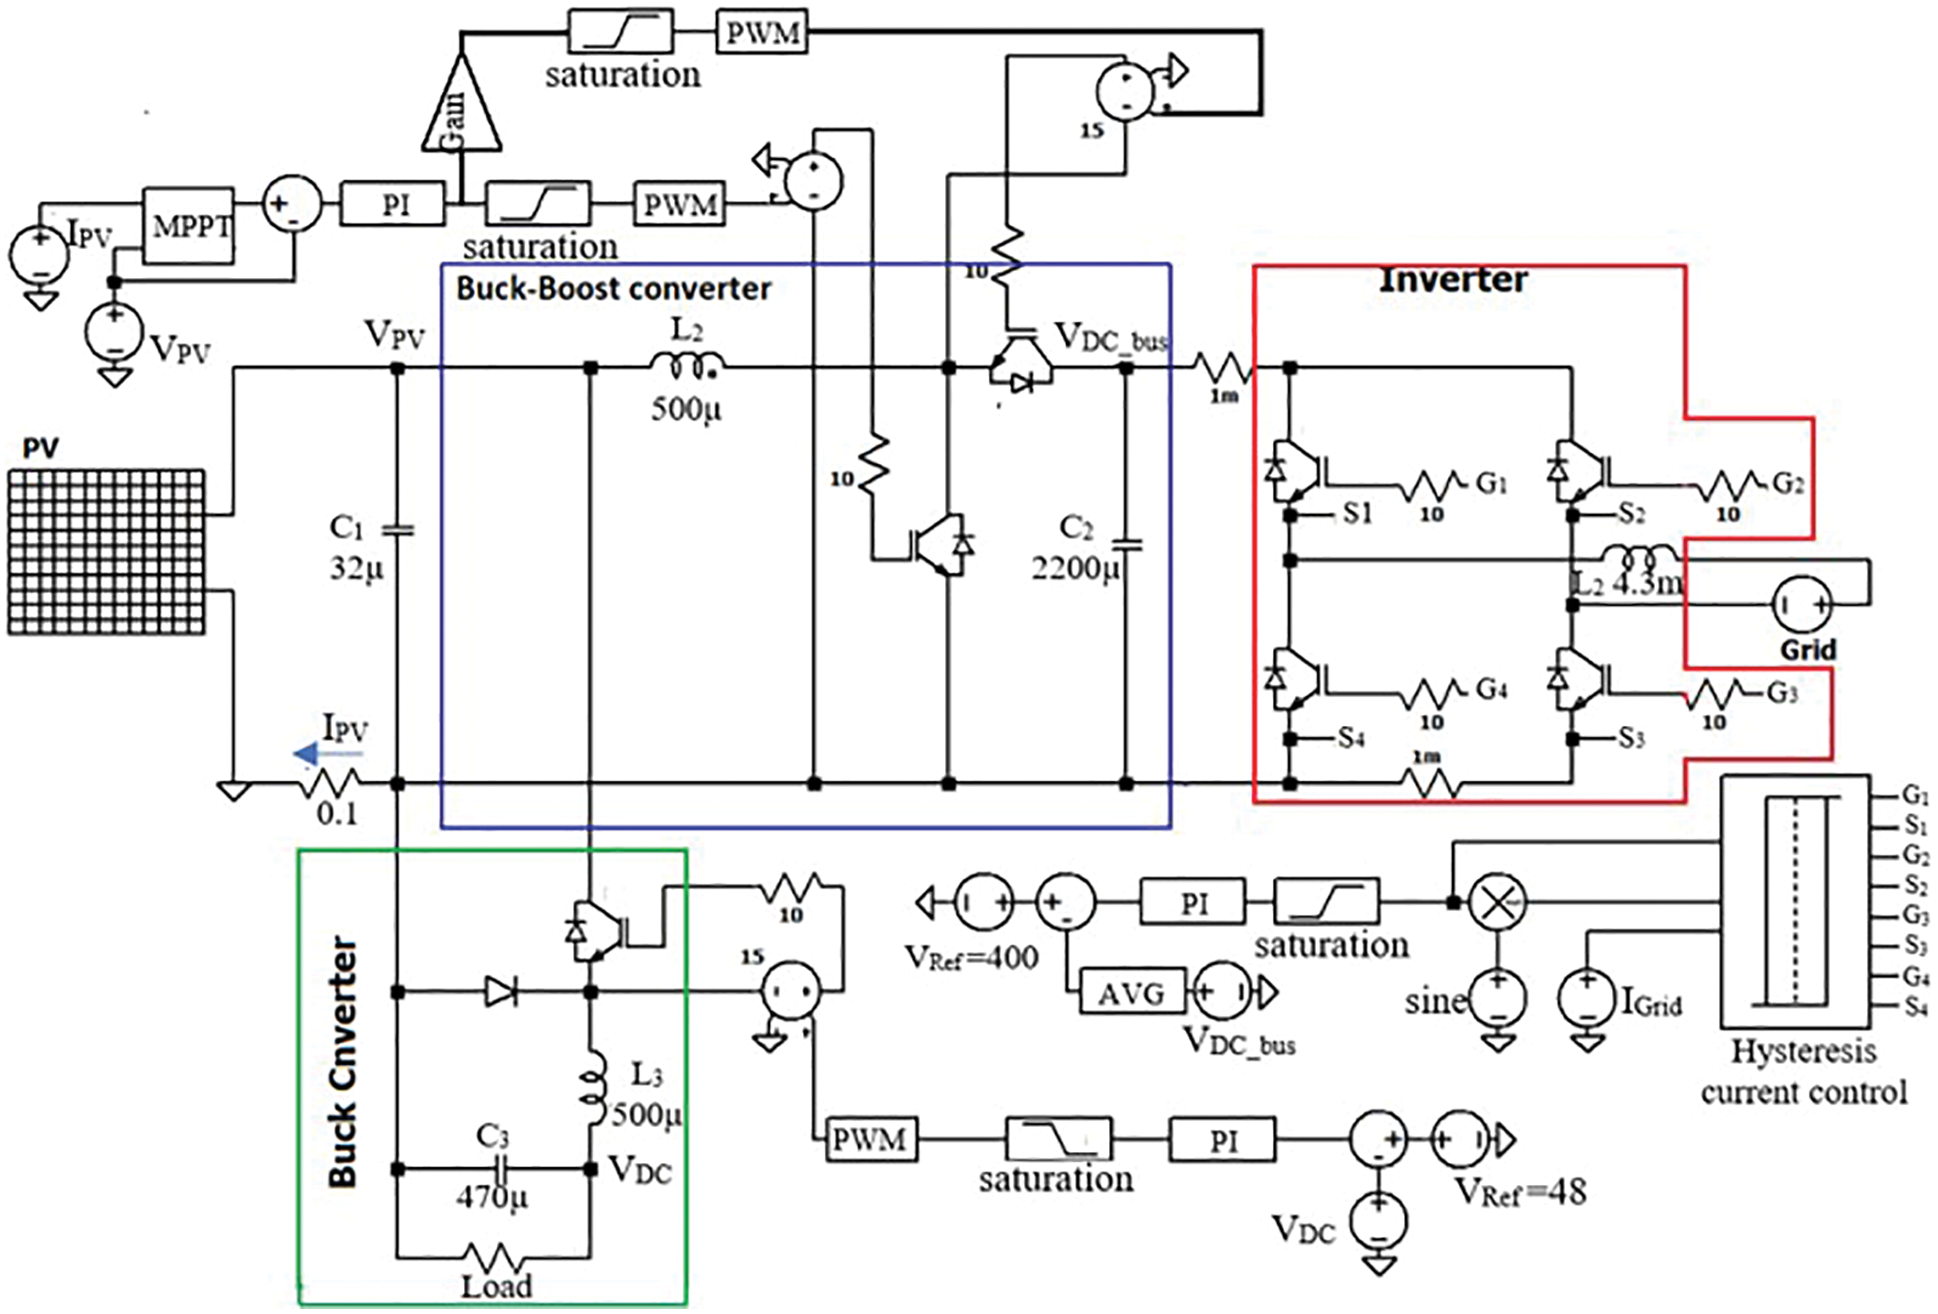
Figure 8: The proposed LVDC new concept supply
The Perturb and Observe (P&O) MPPT technique is applied for the modeled 2 kW PV system to detect the point of optimum power. The diagram of the P&O technique is presented in Fig. 9a. By applying this MPPT algorithm, the electric waveforms related to the PV modules are displayed in Fig. 9b.
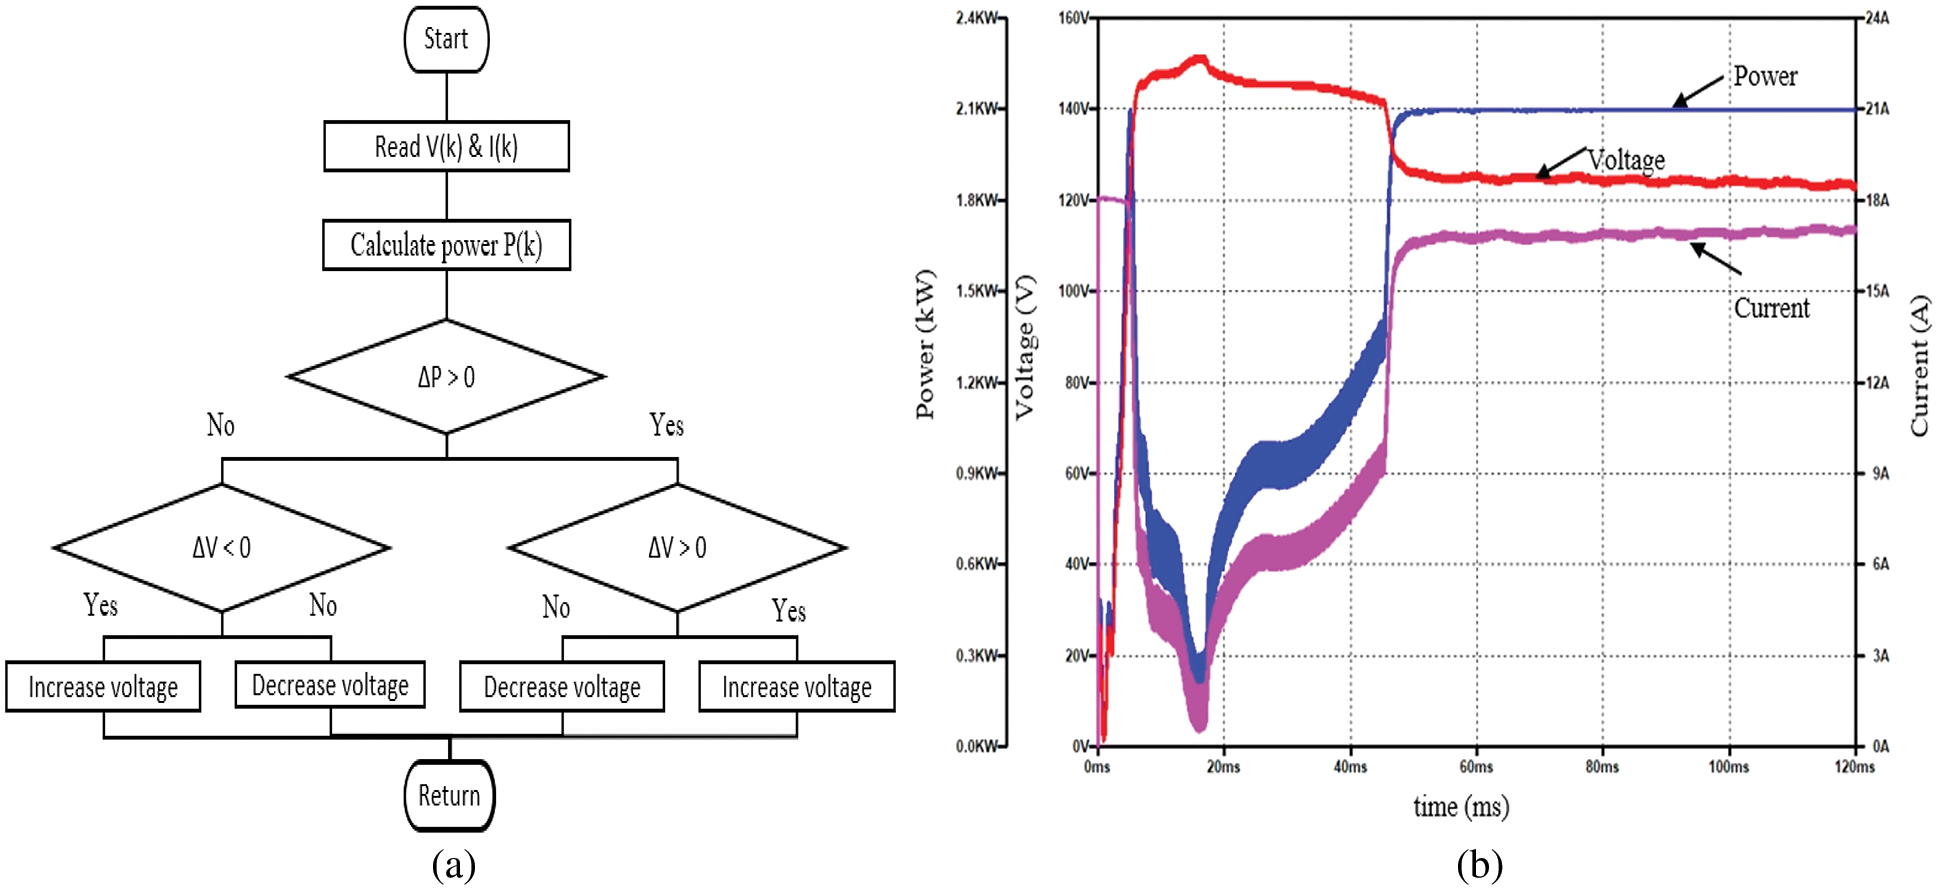
Figure 9: (a) Flow chart of MPPT algorithm. (b) Transient waveforms of PV current, voltage, and power during MPPT
The simulation of the new LVDC PV architecture is conducted in two distinct situations. The first one is when the power generated by the PV panels (2.1 kW) is larger than the appliance’s absorbed power (0.94 kW). In this case, the PV’s surplus power is transferred to the grid via the inverter (Fig. 10a). In the second situation, the PV’s produced power (1.05 kW) is less than the power absorbed by the load (1.6 kW). In this situation, additional power is transferred from the utility to the load via the controlled rectifier and the step-down converter to meet the load's demand (Fig. 10b).
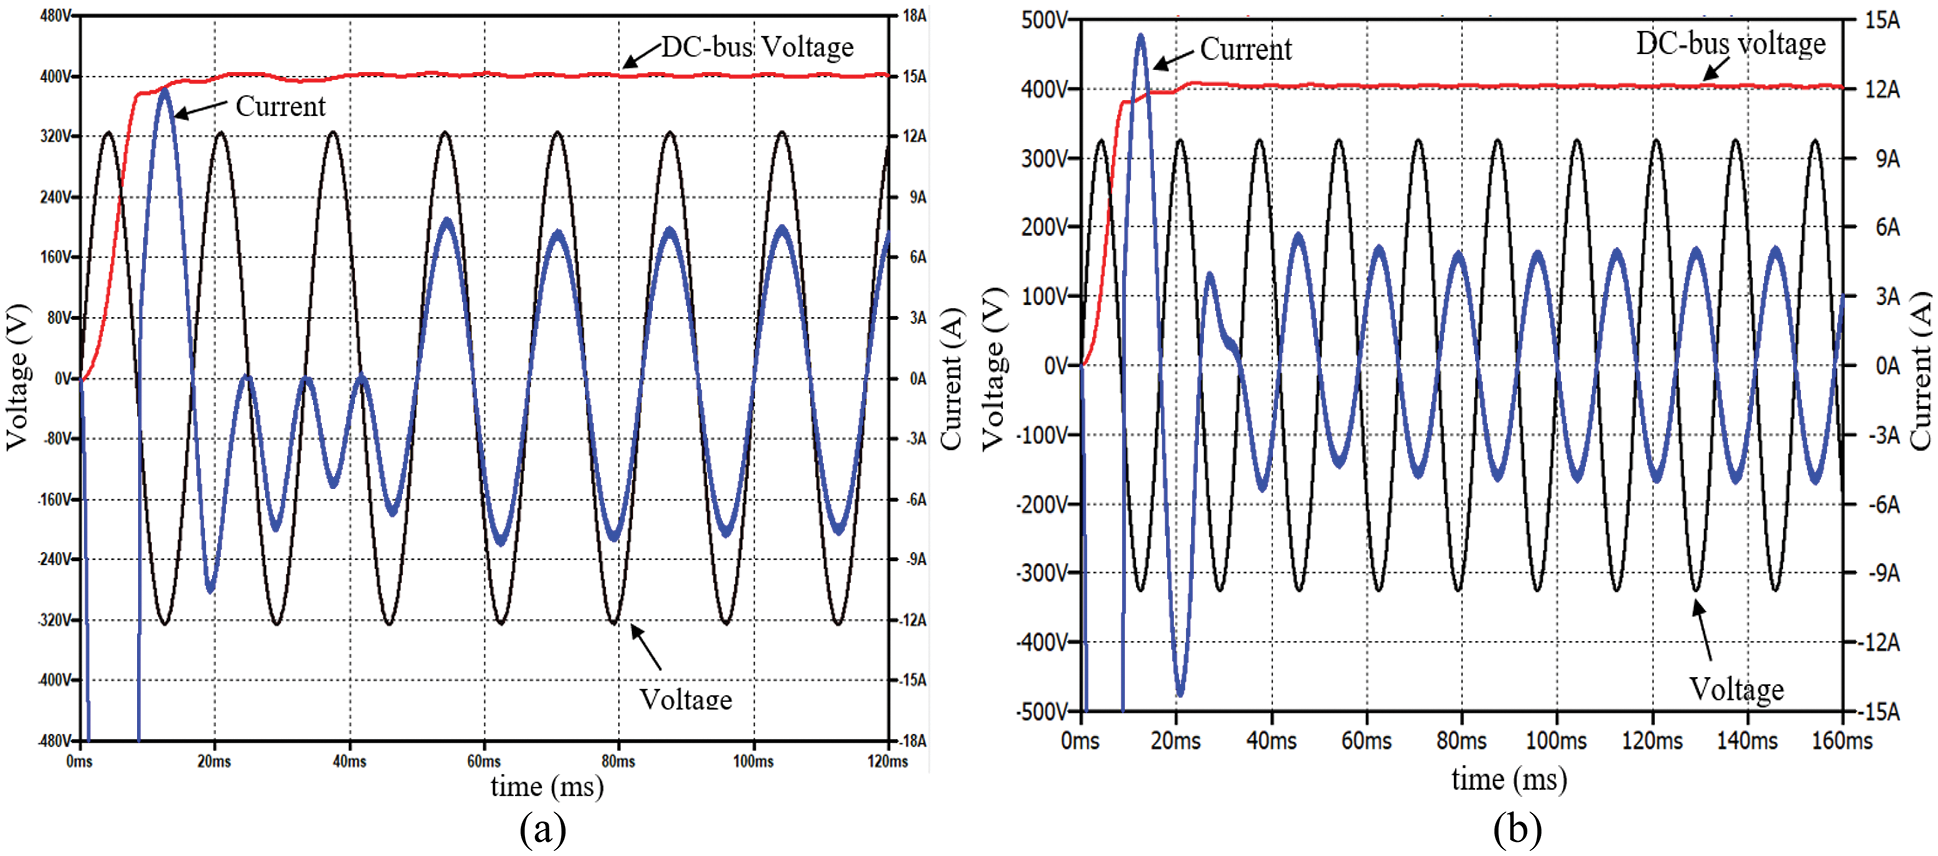
Figure 10: (a) Panels generated power (blue), PV voltage (red) and PV current (purple), (b) High Voltage bus voltage (red), grid voltage (black) and injected current (blue),
5 Study of the LVDC Supplies Performances
Jeddah location in Saudi Arabia (21° 32′ 34 ″N, 39° 10′ 22 ″E) was chosen to investigate the energy performance of the different PV architectures. According to the Koppen climate categorization, Jeddah has a dry climate with tropic weather. In addition, Jeddah has a pleasant winter climate with temperatures varying from 15°C (59 F) to 28°C (82 F) in the afternoon. Temperatures in summer, however, are particularly large in the afternoon, often surpassing 48°C (118 F), while dropping to 35°C (95 F) after sunset.
Annual interchanged energy between every PV system and the AC utility is referred to as Wj (j = 1,2 or 3). This is the surplus energy that is fed into the AC network once the household power demand has been met. The energy Wj is the integral of the balanced power Pj swapped with the AC utility by the systems (j). For each studied PV architecture, the power Pj is determined by the next expressions:
For usual LVAC (system 1):
where,
η1 and η2 are the efficiencies of the boost converter and inverter respectively.
Ppv and Pload are the generated power from PV and consumed by load respectively.
For conventional LVDC (system 2):
where,
For the new LVDC (system 3):
where,
The DC/DC chopper (η3) is the same for the 3 studied converters and placed simply before the load, and its effect is no longer taken into consideration in the study.
Ammous et al. in [27] defined the relative saved energy (RSE j %) of the LVDC supply (system j) with comparison with the traditional PV system (system 1) as the ratio of the extra saved energy of the considered LVDC supply (W2 or W3) compared to the traditional PV chain (W1) by the PV energy WPV produced annually.
Wj and W1 are obtained by the time integral of the exchanged power between the grid and the PV chain.
If the specified RSE is negative, the traditional LVAC grid-tie PV system (system 1) with AC appliances is more interesting (relating to power savings) than the LVDC supplies. On the other hand, if the variable RSE is positive, the LVDC structure is considered extra effective than the LVAC architecture.
We will examine the efficiency of the three structures for household loads. Three household demand profiles are taken into consideration. The household load consists of a garment dryer, a computer laptop, a dishwasher, a laser printer, a lamp, a microwave oven, a fridge, a tv liquid crystal display, a washing machine and an air conditioner [28,29].
The first case in this analysis is carried out for the energy consumption of a small household, whose load profiles are given in Fig. 11a. It’s far assumed It is assumed that the washing machine and tumble dryer are in operation within a certain time period (twelve days monthly) and that the absorbed energy by the other loads is identical during every year days. The yearly energy consumption of the house is 2.67 MWh. The total appliances power demand waveform is given in Fig. 11b.
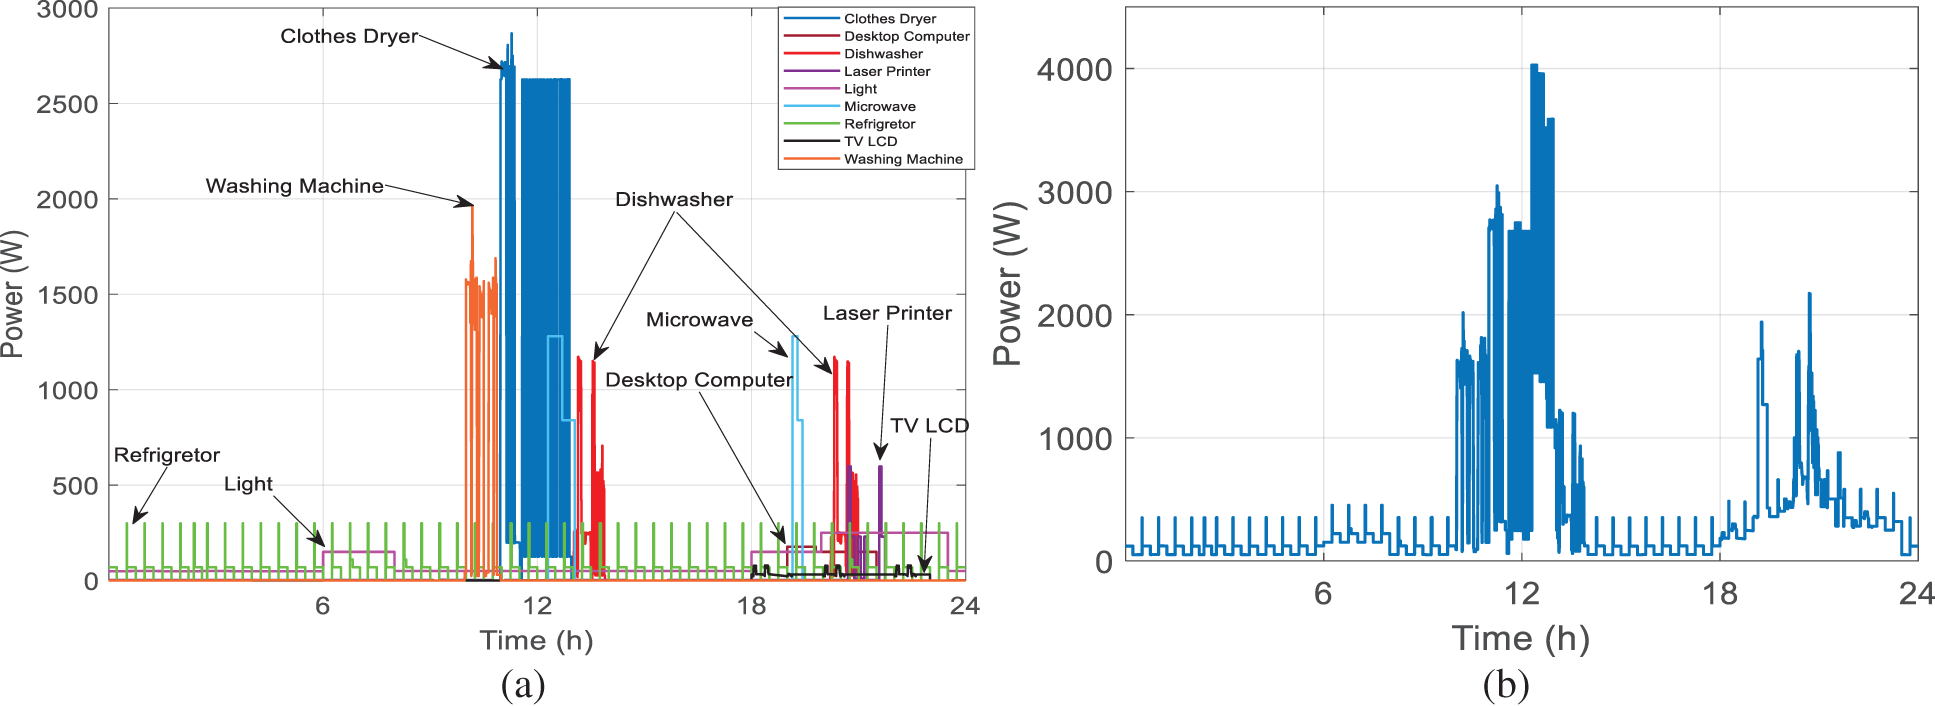
Figure 11: (a) Power Consumption by each load, (b) Daily load profile. (Case 1)
The monthly RSE for each LVDC supply is presented in Fig. 12a in the case where the yearly produced energy by PV’s is 3 MWh (taking into account a peak power of 1.59 kW produced by the PV’s) for the mentioned
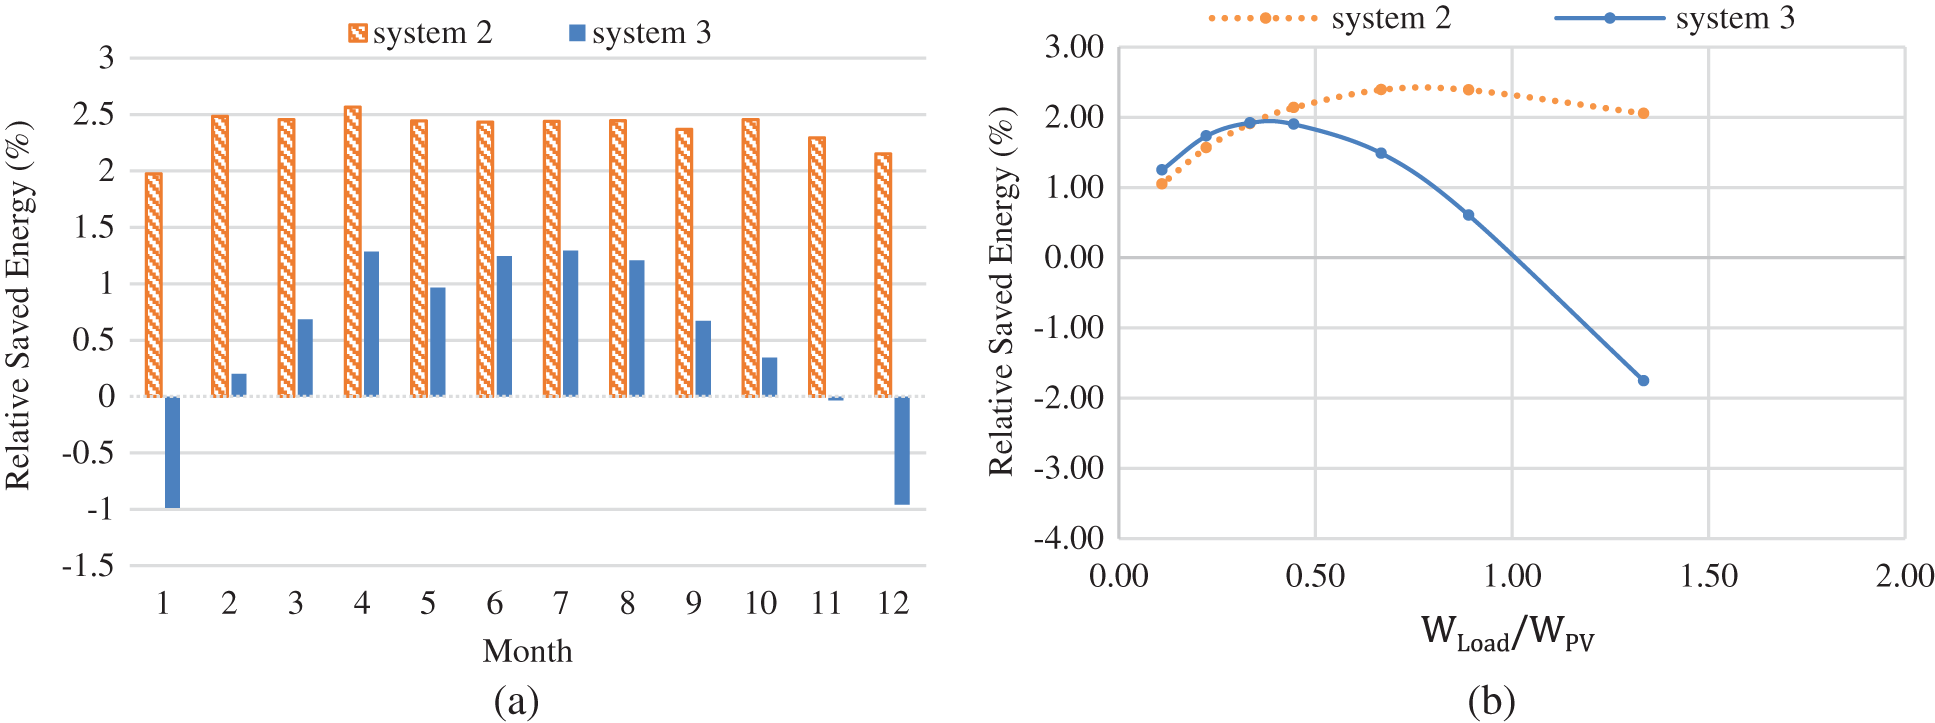
Figure 12: (a) The monthly RSE of systems 2 and system 3 for
The curves showing the RSE’s of the two LVDC supplies according to
The recorded LVDC chains RSEs for the first household are not enough significant. These weak performances are due to the fact that the home load demand within day hours is not important and the main of the PV produced power is fed into the AC utility. The household power consumption at night significantly lowers the efficiency of the LVDC architectures. Consequently, we deduce that the use of system 3 is unattractive for homes low self-consumption within daytime hours. The usual LVDC (system 2) is more attractive and records a higher efficiency increase of 2.4% compared to the classic LVAC system 1.
In the second case, a bigger house consuming about 5.23 MWh per year. The consumption profiles of the house loads are presented in Figs. 13a and 13b. An air conditioner was included with the households and the power consumption of the other loads were also raised. The yearly consumption of the house, in this case, becomes 5.23 MWh.
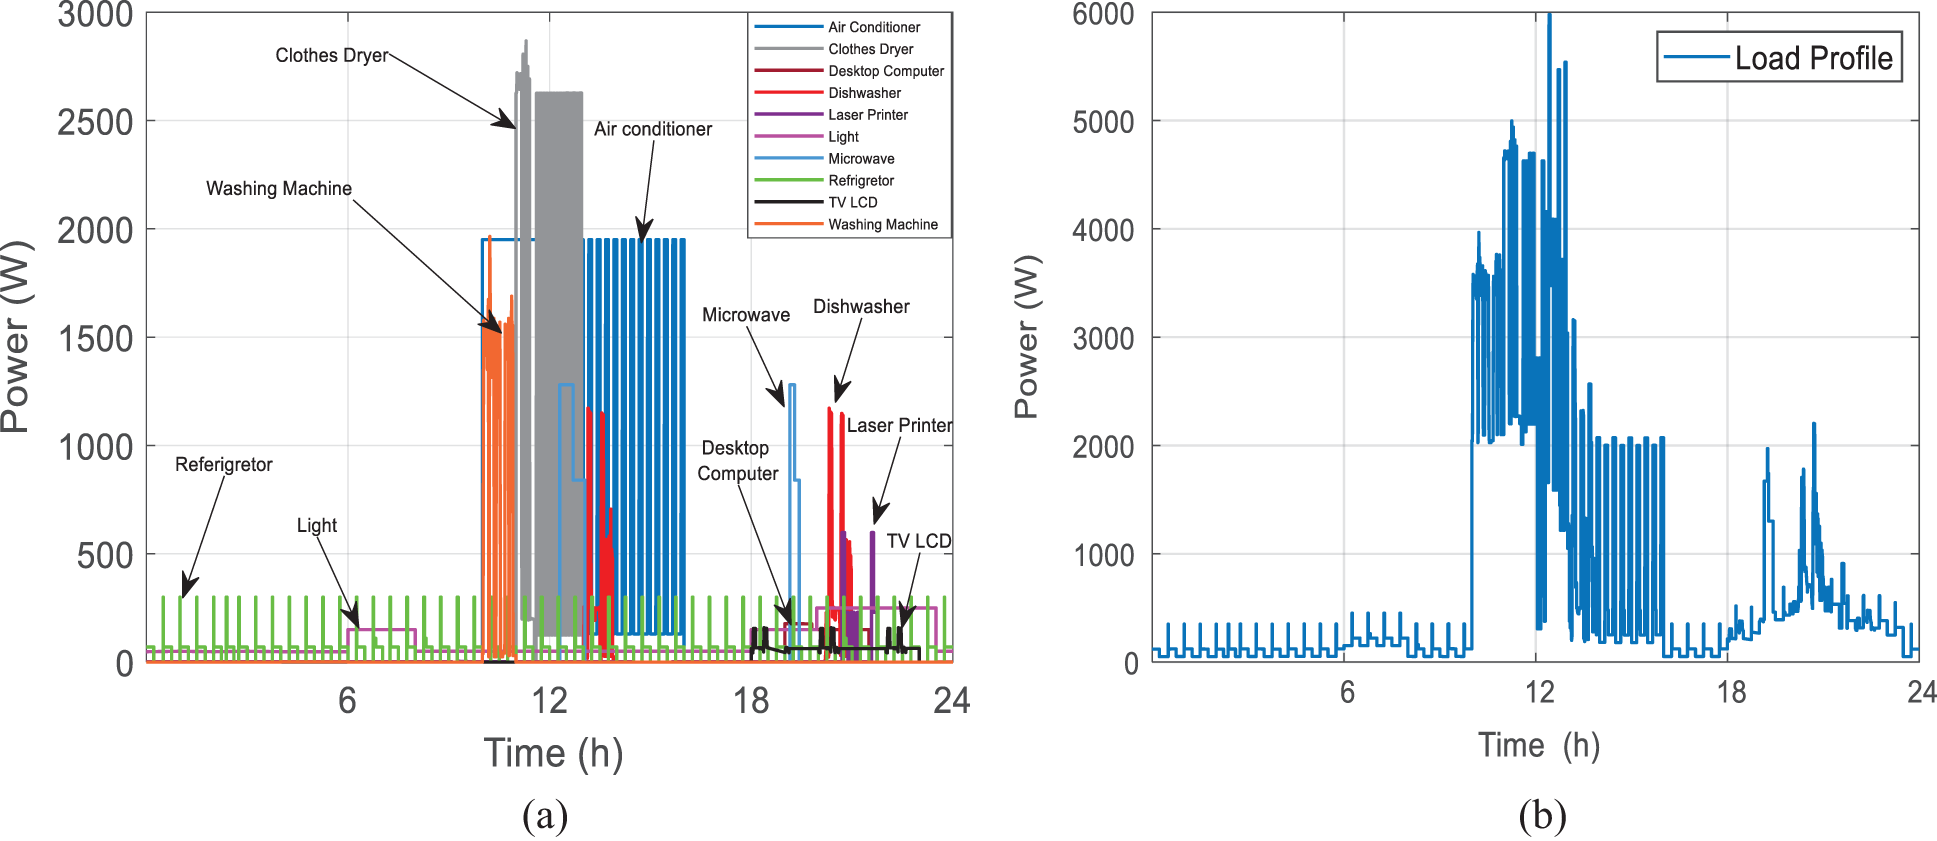
Figure 13: (a) Power Consumption by each load, (b) Daily load profile. (Case 2)
The annual RSE value for the new LVDC system 3 is now more important as depicted in Fig. 14a. The Relative Saved Energy rate is greater than 5% every month when the yearly produced energy by the PV panels is 6 MWh (when we consider a peak of 3.18 kW of the PV’s produced power).
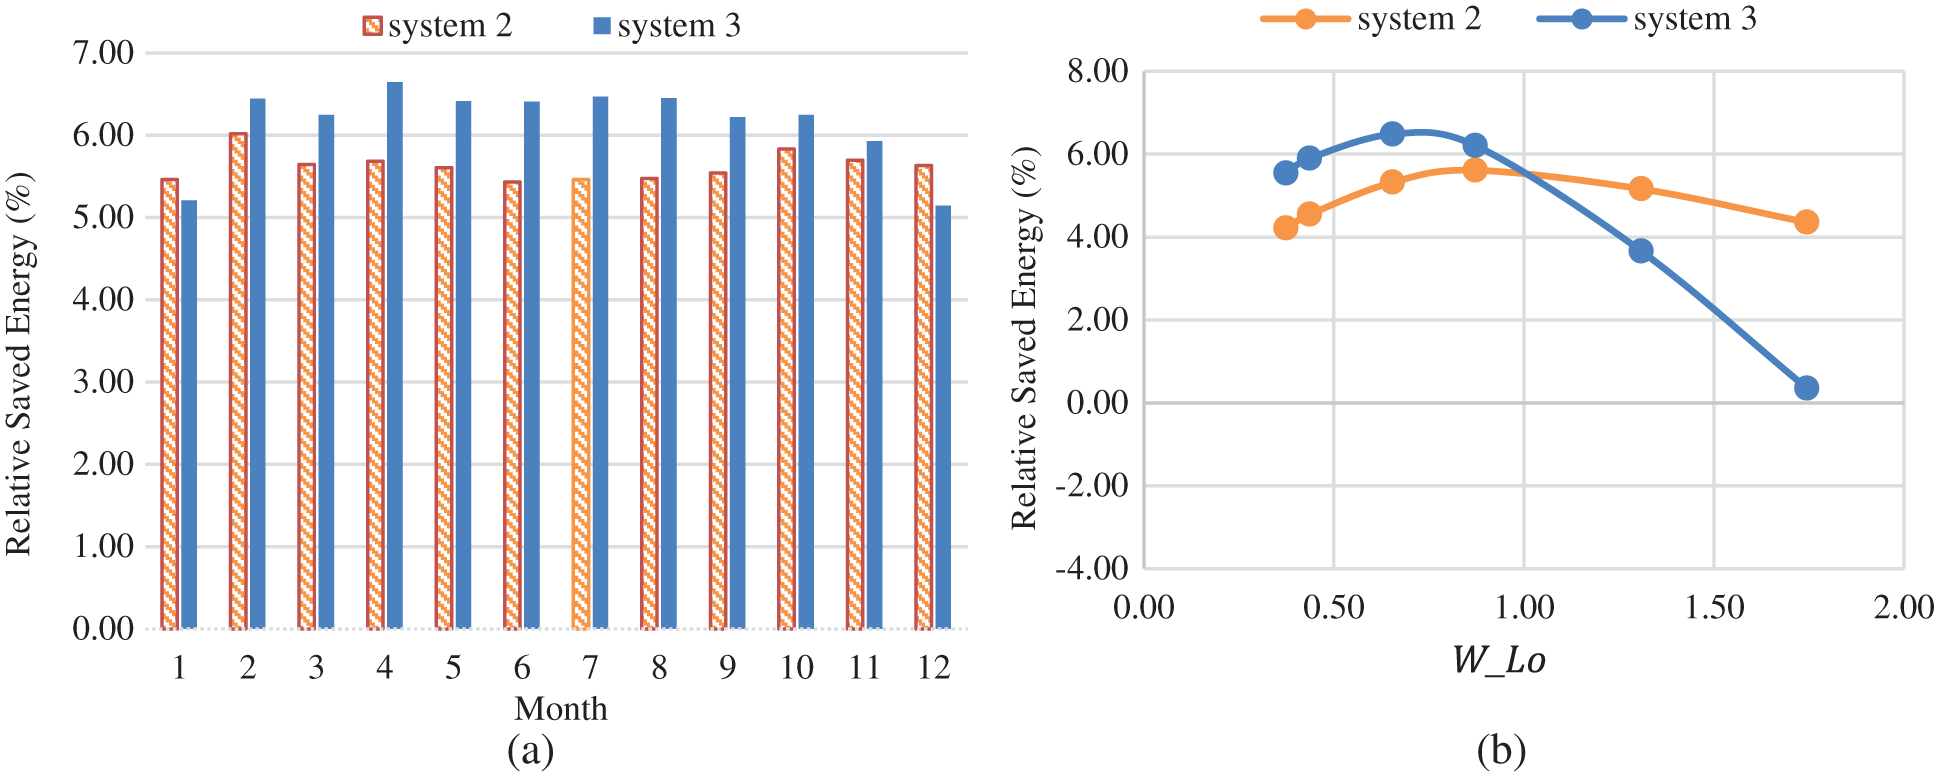
Figure 14: (a) The monthly RSE of systems 2 and 3 for
Fig. 14b shows the RSE values for the studied LVDC supplies at different PV produced energy. The highest RSE value for the proposed LVDC system is around 6.5%. We can observe that the optimal values of RSE for system 2 and system 3 are not the same as registered in Fig. 12b. The annual RSE peak of system 3 happens when the PV’s produced energy WPV is close (1.5 WLoad).
In case three, we run the computations for the same case 1 and case 2, but we assume that all the electricity produced by the PV panels is consumed locally by house loads. The momentary surplus of electricity generated by the PV panels during daytime hours is used to feed optional loads rather than sending the electricity to the AC network. This type of configuration is assumed to be the better one for residences including solar PV as a substitute electricity source. Fig. 15 shows the total house consumption profiles. These households consumption profiles were registered with 3 MWh yearly PV’s energy (when we consider a PV panel maximum power equal to 1.59 kW at 1000 W/m2 and 25°C for Jeddah location).
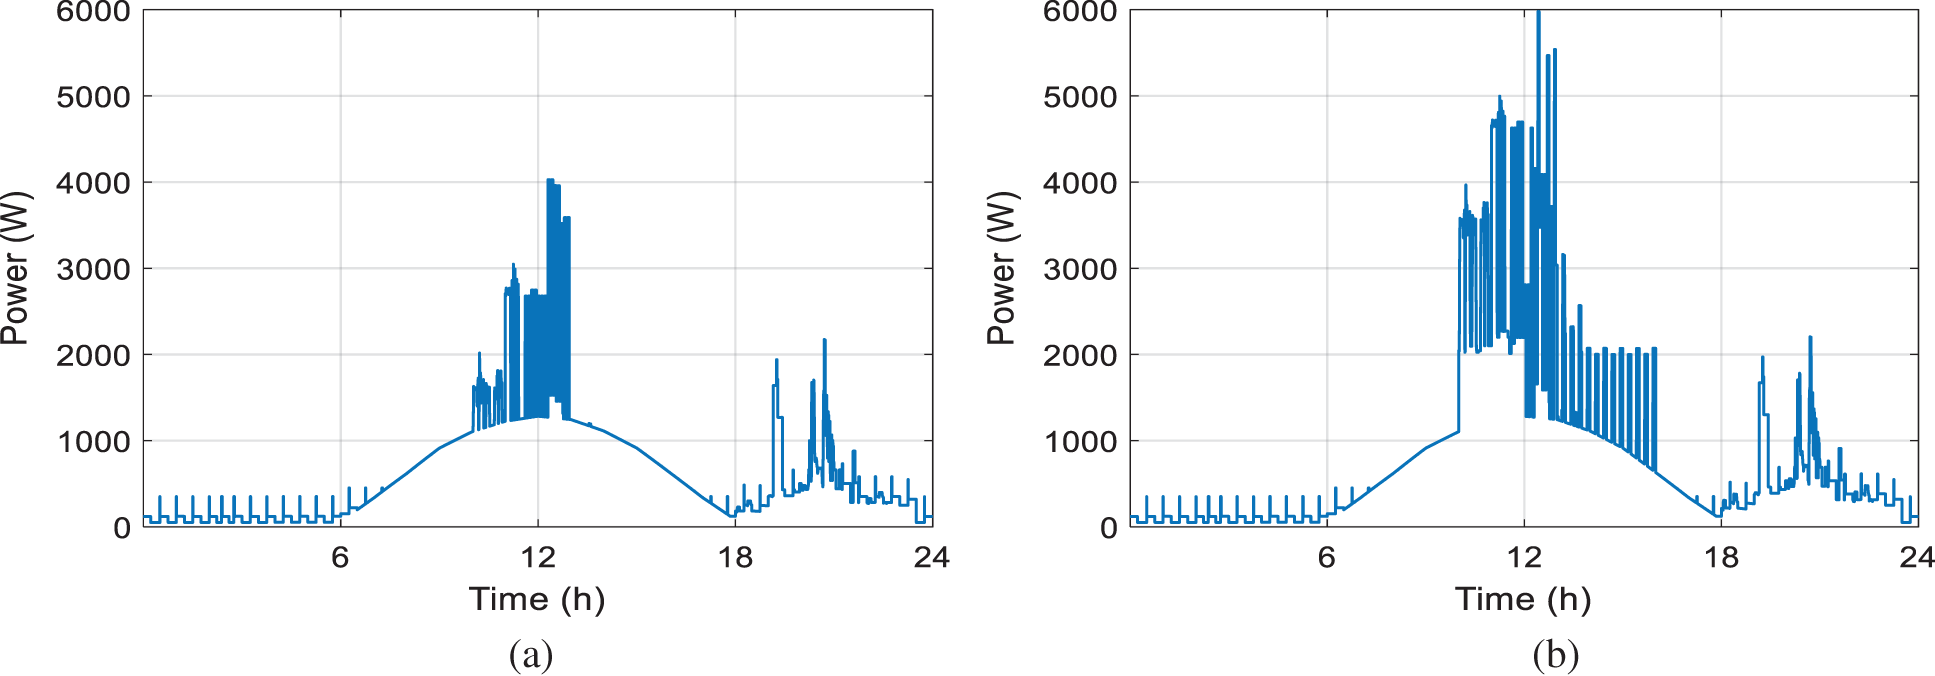
Figure 15: The daily load consumption (case 3), (a) for low power demand house, and (b) for high power demand house
The Relative Saved Energy of the new LVDC supply (system 3) is more important than the ones registered in the last two cases. The RSE in each month exceeds 18% when the household energy consumption is low, as presented in Fig. 16, with a yearly produced energy from PV panels equal to 16 MWh (when we consider a PVs maximum power equal to 8.48 kW).
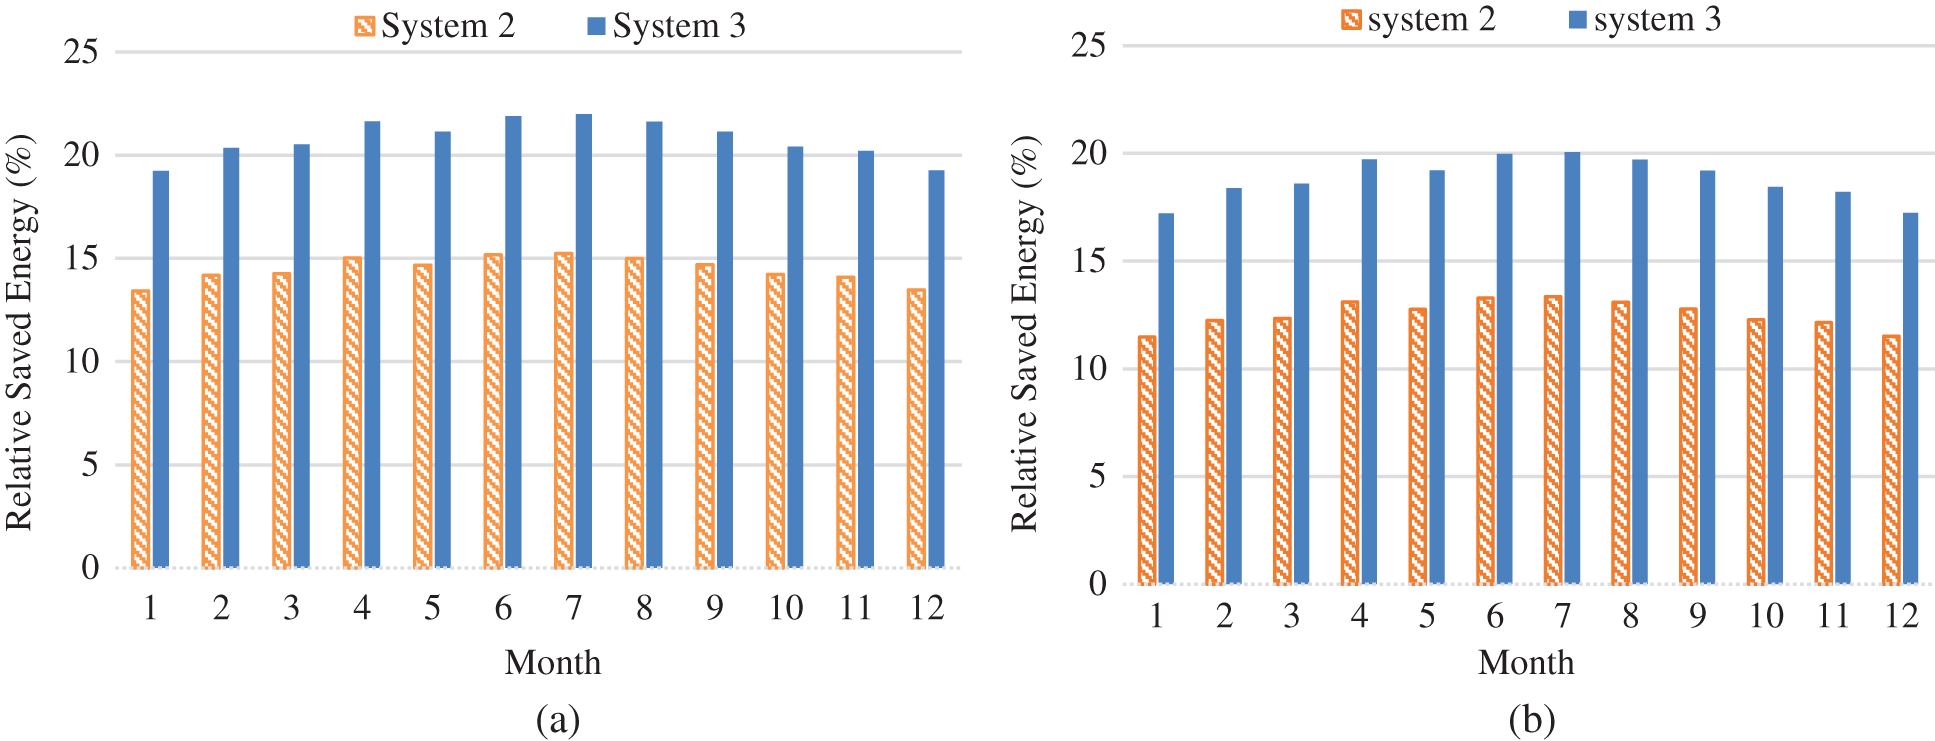
Figure 16: The monthly RSE of systems 2 and 3 for
Fig. 17 shows the effect of the ratio
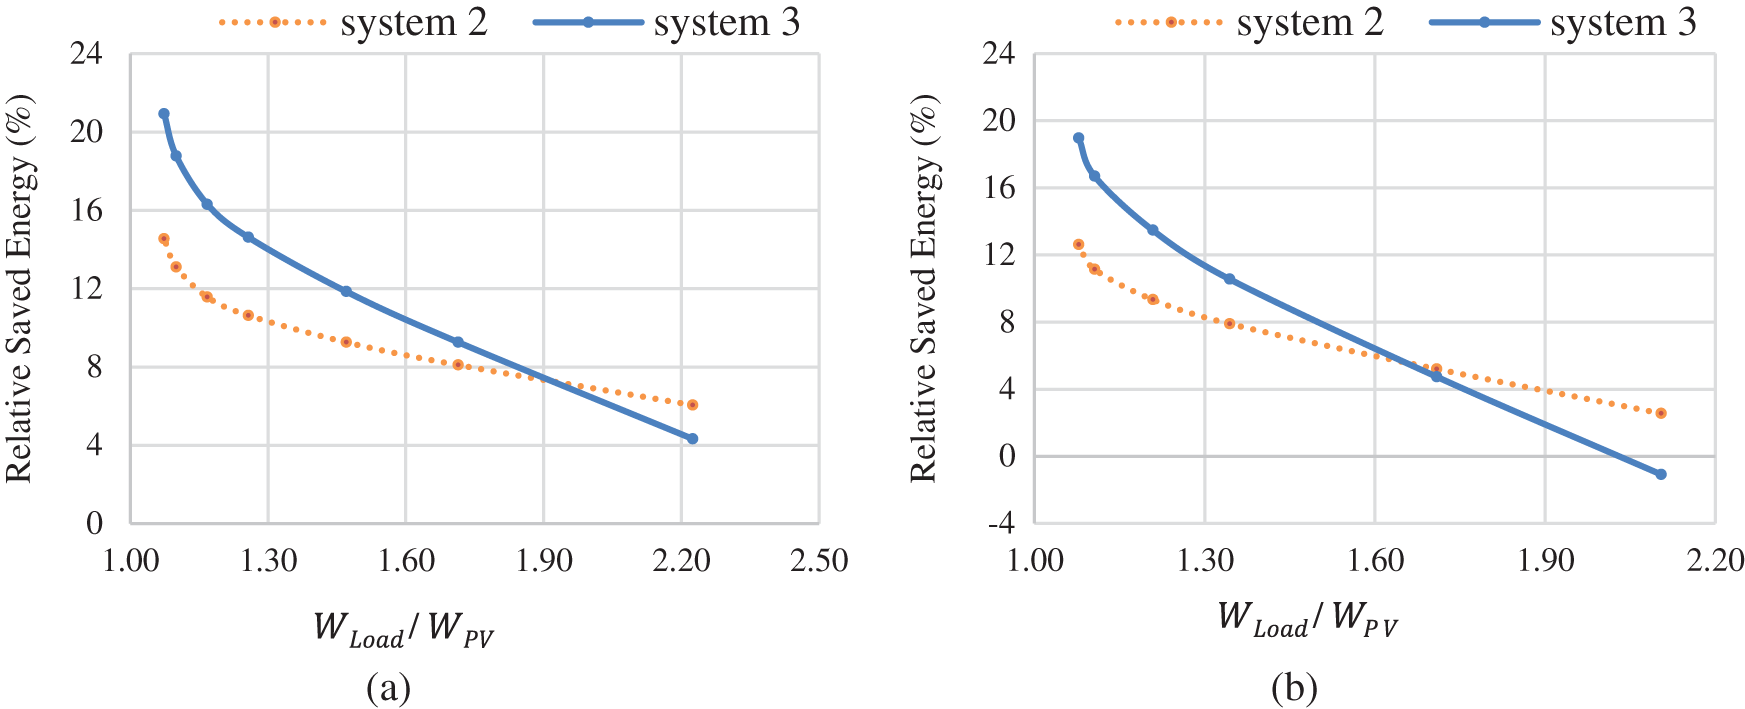
Figure 17: Yearly RSE of the two LVDC supplies (case 3), (a) for low consumed energy house, and (b) for high consumed energy house
The investigations conducted in the third case demonstrates and consolidates the fact that the use of LVDC supplies including solar PVs is more advantageous when the load consumptions occur within day hours and when it is close to the energy generated by the PV panels. With the new LVDC supply, the efficiency has been significantly improved in comparison with the usual LVDC supply. This increase is registered through a certain range of
In this paper, a more efficient structure of an LVDC supply idea is suggested. The new grid-tie PV architecture destinated for DC household uses allows to replace the classical on-grid PV chains using AC outlets to fed AC equipment. The performance evaluation of the proposed PV structures became possible by using accurate models of an IGBT and diode from Infineon. The proposed devices behavioural models give rapid calculation times and the precision is good enough. In addition, the concept of relative energy saving notion was proposed to confront the efficiencies rates of LVDC supplies for DC loads with classic PV chains feeding AC loads. The monthly and annual relative energy savings are presented in different residences under climatic conditions of the Jeddah site. The effects of solar radiation, ambient temperature and wind speed are considered for this location. Three houses demand profiles are considered to analyze the three investigated PV architectures. The registered results show that LVDC supplies concepts are more efficient than usual LVAC architectures, especially when the electricity is used on-site during day hours. Nevertheless, the performances of LVDC supplies repose mainly on
Acknowledgement: The authors would like to thank the Deanship of Scientific Research at Umm Al-Qura University for supporting this work by Grant Code: (22UQU4340526DSR01).
Funding Statement: Project funded by the deanship of scientific research at Umm Al Qura University in Saudi Arabia by grand code: 22UQU4340526DSR01.
Conflicts of Interest: The authors declare that they have no conflicts of interest to report regarding the present study.
Data availability: Data available on request from the authors.
References
1. L. Trigueiro, M. Sechilariu and F. Locment, “Optimized load shedding approach for grid-connected dc microgrid systems under realistic constraints,” Buildings, vol. 6, no. 4, pp. 50, 2016. [Google Scholar]
2. International Electrotechnical Commission (IEC“Report on LVDC electricity for the 21st century,” 2017. [Google Scholar]
3. D. Kumar, F. Zare and A. Ghosh, “DC microgrid technology: System architectures, ac grid interfaces, grounding schemes, power quality, communication networks, applications, and standardizations aspects,” IEEE Access, vol. 5, pp. 12230–12256, 2017. [Google Scholar]
4. G. Yoon, K. Sugiyama, S. Yoshioka and S. Sakai, “Energy efficiency and cost performance of direct-current power supply systems in residential buildings by, 2030s, and 2050s,” E3S Web of Conferences, vol. 111, pp. 1–5, 2019. [Google Scholar]
5. C. Rajeev, G. Francisco, R. Bharat and S. Nivas, DC microgrid in residential buildings, DC distribution systems and microgrids, institution of engineering and technology, Chap. 15. 15367–388, 2018. DOI10.1049/PBPO115E_ch15, https://digital-library.theiet.org/content/books/10.1049/pbpo115e_ch15. [Google Scholar]
6. R. H. Lasseter, “MicroGrids,” IEEE Power Engineering Society Winter Meeting, vol. 1, pp. 305–308, 2002. [Google Scholar]
7. A. Ghareeb, A. Mohamed and O. Mohammed, “DC microgrids and distribution systems: An overview,” in IEEE Power & Energy Society General Meeting, Vancouver, BC, Canada, pp. 1–5, 2013. [Google Scholar]
8. E. Ahmed, M. Ahmed and M. Osama, “DC microgrids and distribution systems: An overview,” Electric Power Systems Research, vol. 119, pp. 407–414, 2015. [Google Scholar]
9. J. Du, T. Zheng, Y. Yan, H. Zhao, Y. Zeng et al., “Insulation monitoring method for dc systems with ground capacitance in electric vehicles,” Applied Sciences, vol. 9, no. 13, pp. 2607, 2019. [Google Scholar]
10. G. AlLee and W. Tschudi, “Edison redux: 380 vdc brings reliability and efficiency to sustainable data centers,” IEEE Power and Energy Magazine, vol. 10, no. 6, pp. 50–59, 2012. [Google Scholar]
11. A. Pratt, P. Kumar and T. V. Aldridge, “Evaluation of 400V DC distribution in telco and data centers to improve energy efficiency,” in INTELEC 07-29th Int. Telecommunications Energy Conf., Rome, Italy, pp. 32–39, 2007. [Google Scholar]
12. E. Rodriguez-Diaz, F. Chen, J. C. Vasquez, J. M. Guerrero, R. Burgos et al., “Voltage-level selection of future two-level lvdc distribution grids: A compromise between grid compatibiliy, safety, and efficiency,” IEEE Electrification Magazine, vol. 4, no. 2, pp. 20–28, 2016. [Google Scholar]
13. B. Glasgo, I. Azevedo and C. Hendrickson, “How much electricity can we save by using direct current circuits in homes? Understanding the potential for electricity savings and assessing feasibility of a transition towards DC powered buildings,” Applied Energy, vol. 180, pp. 66–75, 2016. [Google Scholar]
14. U. Manandhar, A. Ukil and T. Jonathan, “Efficiency comparison of DC and AC microgrid,” in IEEE Innovative Smart Grid Technologies - Asia (ISGT ASIA), Bangkok, Thailand, pp. 1–6, 2015. [Google Scholar]
15. C. Rajeev, P. Chitaranjan, S. Bharat, G. L. Francisco and S. Sn, “Demand-side management system for autonomous dc microgrid for building,” Technology and Economics of Smart Grids and Sustainable Energy, vol. 2, pp. 1–11, 2017. [Google Scholar]
16. W. Sebastian and A. Sauer, “DC micro grid for energy efficient and flexible production,” Procedia Manufacturing, vol. 39, no. 11, pp. 655–664, 2019. [Google Scholar]
17. T. Ma, H. Yahoui, V. Vu, N. Siauve and H. Morel, “A control strategy of dc building microgrid connected to the neighborhood and ac power network,” Buildings, vol. 7, no. 4, pp. 42, 2017. [Google Scholar]
18. B. T. Patterson, “DC microgrids and the birth of the enernet,” IEEE Power and Energy Magazine, vol. 10, no. 6, pp. 60–69, 2012. [Google Scholar]
19. K. Siraj and H. A. Khan, “DC distribution for residential power networks—a framework to analyze the impact of voltage levels on energy efficiency,” Energy Reports, vol. 6, pp. 944–951, 2020. [Google Scholar]
20. F. Ahmad, F. Dastgeer, H. E. Gelani, S. Khan and M. Nasir, “Comparative analyses of residential building efficiency for AC and DC distribution networks,” Bulletin of the Polish Academy of Sciences: Technical Sciences, vol. 69, no. 2, pp. 1–9, 2021. [Google Scholar]
21. A. Ammous and H. Morel, “LVDC: An efficient energy solution for on-grid photovoltaic applications,” Smart Grid and Renewable Energy, vol. 5, no. 4, pp. 63–76, 2014. [Google Scholar]
22. T. Wu, C. Kuo, L. Lin and Y. Chen, “C-bus voltage regulation for a dc distribution system with a single-phase bidirectional inverter,” IEEE Journal of Emerging and Selected Topics in Power Electronics, vol. 4, no. 1, pp. 210–220, 2016. [Google Scholar]
23. Infineon, (n.d.“IKW30N60T, IKW30N60T-Infineon Technologies,” 2022. Available: https://www.infineon.com/cms/en/product/power/igbt/igbt-discretes/ikw30n60t/. [Google Scholar]
24. D. Ludwig, G. Alia, A. Biswas and M. Cotorogea, “Behavioral compact models of IGBTs and Si-diodes for data sheet simulations using a machine learning based calibration strategy,” in PCIM Europe digital days 2020; Int. Exhibition and Conf. for Power Electronics, Intelligent Motion, Renewable Energy and Energy Management, Germany, pp. 1–8, 2020. [Google Scholar]
25. Infineon Technologies, “Data sheet IKW30N60T TRENCHSTOPTM Series, Rev. 2.6,” 2015. [Google Scholar]
26. L Umanand, “Design of photovoltaic system,” NPTEL. Available: https://nptel.ac.in/courses/117/108/117108141/. [Google Scholar]
27. A. Ammous, A. Assaedi, A. Al Ahdal, K. Ammous, “Energy efficiency of a novel low voltage direct current supply for the future building,” International Journal of Energy Research, vol. 45, no. 10, pp. 15360–15371, 2021. [Google Scholar]
28. M. Pipattanasomporn, M. Kuzlu, S. Rahman and Y. Teklu, “Load profiles of selected major household appliances and their demand response opportunities,” IEEE Transactions on Smart Grid, vol. 5, no. 2, pp. 742–750, 2014. [Google Scholar]
29. F. Issi and O. Kaplan, “The determination of load profiles and power consumptions of home appliances,” Energies, vol. 11, no. 3, pp. 607, 2018. [Google Scholar]
Cite This Article
 Copyright © 2023 The Author(s). Published by Tech Science Press.
This work is licensed under a Creative Commons Attribution 4.0 International License , which permits unrestricted use, distribution, and reproduction in any medium, provided the original work is properly cited.
 Downloads
 Citation Tools