
 Submit a Paper
 Propose a Special lssue
 Open Access
ARTICLE

A Multi-Module Machine Learning Approach to Detect Tax Fraud
King Saud University, Riyadh, 11451, Saudi Arabia
* Corresponding Author: N. Alsadhan. Email:
Computer Systems Science and Engineering 2023, 46(1), 241-253. https://doi.org/10.32604/csse.2023.033375
Received 15 June 2022; Accepted 11 October 2022; Issue published 20 January 2023
 View Full Text
 Download PDF
Abstract
Tax fraud is one of the substantial issues affecting governments around the world. It is defined as the intentional alteration of information provided on a tax return to reduce someone’s tax liability. This is done by either reducing sales or increasing purchases. According to recent studies, governments lose over $500 billion annually due to tax fraud. A loss of this magnitude motivates tax authorities worldwide to implement efficient fraud detection strategies. Most of the work done in tax fraud using machine learning is centered on supervised models. A significant drawback of this approach is that it requires tax returns that have been previously audited, which constitutes a small percentage of the data. Other strategies focus on using unsupervised models that utilize the whole data when they search for patterns, though ignore whether the tax returns are fraudulent or not. Therefore, unsupervised models are limited in their usefulness if they are used independently to detect tax fraud. The work done in this paper focuses on addressing such limitations by proposing a fraud detection framework that utilizes supervised and unsupervised models to exploit the entire set of tax returns. The framework consists of four modules: A supervised module, which utilizes a tree-based model to extract knowledge from the data; an unsupervised module, which calculates anomaly scores; a behavioral module, which assigns a compliance score for each taxpayer; and a prediction module, which utilizes the output of the previous modules to output a probability of fraud for each tax return. We demonstrate the effectiveness of our framework by testing it on existent tax returns provided by the Saudi tax authority.Keywords
Tax fraud is among the most significant issues affecting government revenue throughout the world. Tax fraud is the intentional act of altering the information provided in a tax return to lower someone’s tax liability. This is done by either decreasing sales or increasing purchases. Recent studies estimate that governments lose approximately 500 billion dollars annually due to tax fraud [1,2]. A loss of this magnitude motivates tax authorities worldwide to implement efficient fraud detection strategies. The main goal of these strategies is to minimize the false positives, which are tax returns flagged as fraudulent, though after inspection turns out to be compliant. The goal behind this is not to waste the auditor’s time, which is a limited resource.
There are two main strategies implemented by tax authorities [3]: auditor’s experience and rule-based systems. The first strategy consists of the auditor examining the tax returns manually and choosing to audit what seems suspicious to them based on their experience. The second strategy focuses on building systematic rules or conditions, usually in the form of if/else statements that each tax return passes through. A tax return is considered suspicious if it violates a certain amount of rules. The issue with the first strategy is that an auditor’s experience is subjective, and it has to be done manually. The second strategy requires a significant amount of time to build, update, and maintain. In addition, rule-based models could become obsolete after a certain time if the rules fail to keep up with new fraud strategies.
A more recent approach adopted by tax authorities includes Machine Learning (ML) models. ML models can produce knowledge from a significant amount of data that the two strategies mentioned above fail to achieve. ML models allow the detection of new fraud strategies with little manual work, which improves the use of tax authorities’ resources [3].
Most of the work done in tax fraud using ML models is centered on supervised models [4]. Supervised models can only utilize the data in tax returns that have been previously audited. Such models search for patterns between the tax return features and fraud. While supervised models give good results, a significant drawback of this approach is that it requires tax returns that have been previously audited, which constitutes a small percentage of the data. Moreover, this limits the amount of data utilized in the model, which restricts what the model can potentially learn. Other strategies focus on using unsupervised models, which utilize the complete data when they search for patterns, regardless if the tax returns are fraudulent or not. For that reason, unsupervised models are limited in their usefulness if they are used independently to detect tax fraud.
The limitations discussed above of both supervised and unsupervised approaches are significant problems for tax authorities, which motivates the work found in this paper. A tax fraud detection framework that takes advantage of both approaches to enhance the effectiveness of detecting tax fraud. The contribution of this paper is a novel framework that exploits supervised, unsupervised, and ensemble learning paradigms. In addition, newly engineered features have been designed and integrated with the proposed framework. The framework contains four modules: A supervised module, which extracts knowledge from data using a tree-based model; an unsupervised module, which computes an anomaly score for each feature; a behavioral module, which assigns each taxpayer a compliance score; And a prediction module, which uses the output of the previous modules to calculate the likelihood of fraud for each tax return.
The rest of the paper is ordered as follows: In Section 2, we detail previous work in the context of tax fraud and data mining. In Section 3, we describe our proposed approach. In Section 4, we discuss the dataset and experimental setup and report the results and most important findings. Finally, in Section 5, we present the conclusion and future work.
Machine learning approaches in Value-Added Tax (VAT) fraud in the literature are divided into supervised and unsupervised techniques. The choice of technique is based on the availability of tax return labels (fraud or compliant) at each tax authority. Such limitations, coupled with a low rate of tax return labels, restrict the usefulness of supervised techniques [3].
Although supervised classification algorithms have proven beneficial in various fraud detection applications, such as tax and credit card fraud [4], labeled data only accounts for a small percentage of the entire population in the field of VAT fraud detection. As a result, the labeled data is not representative of the entire population, leading to sample selection bias in the supervised model. Furthermore, since the process of auditing requires time, the information learned from the audit outcome may already be out of date as a result of new fraud strategies. Therefore, the classifiers are limited to known fraud types, and the changing nature of fraud schemes may make audits based on supervised models problematic in the long run [5]. Another issue with using supervised techniques is that VAT tax fraud varies according to business size and sector. This would reduce the number of labeled samples even further.
One study [6] used the tax returns from the Indian tax authority to detect VAT fraud. They used various supervised methods such as classification trees, logistic regression, discriminant function analysis, and a hybrid approach, which outperformed the rest. A second study [7] used the personal income tax returns filed in Spain, using Multi-Layer Perceptron neural network (MLP) models. In addition, they utilize a broad range of personal income return features. A third study [8] used Indian VAT tax returns and random forests to detect bogus firms (bill traders or shell companies). They estimate the revenue-saving potential of their model by testing it on historical data unseen by their model and estimate US$40 million in recovered revenue.
Unsupervised models, such as anomaly detection (AD) techniques, have a high potential for tax fraud detection [9–11]. They discover outliers with features that differ considerably from the rest of the population. AD techniques can use the total population instead of a small and typically biased labeled population. They enable the detection of novel fraud methods that display behavior that is distinct from that which is legitimate. All AD approaches rely on assumptions to differentiate outliers from regular data. Each set of AD techniques requires a different set of assumptions; therefore, the effectiveness of any AD technique depends on whether these assumptions hold for the data under consideration. Two fundamental presumptions are often needed for AD approaches to operate correctly [12]: The first assumption is that the number of anomalies is much lower than the number of normal occurrences. In the case of tax fraud, this assumption is true. The second assumption is that anomalies, by definition, exhibit behavior in terms of feature representation that distinguishes them from normal instances. Although certain fraud tactics may seek to conceal their conduct and mirror lawful sorts of action, this appears to be satisfied in the tax fraud domain.
AD methods have been used in electricity consumption fraud, where one researcher [13] examined the data from electricity consumption meters, which contain reading errors and data manipulated by the consumer. Their study’s objective is to notify utility providers of any unusual usage trends that may be checked out more thoroughly with on-site inspections. In order to determine variations in time-series data streams, they employ two anomaly models: a Spectral Residual-Convolutional Neural Network (SR-CNN) and an anomaly-trained model based on martingales. Another research [14] used the Mahalanobis distance to calculate the distance between each data point and the distribution’s centroid to determine the extent of the anomaly in the financial statements of Vietnamese companies. A study in the medical field [15] quantified the disease–drug relationship into a relationship score and applied an anomaly detection method to this relationship score and other features. They propose a fully connected neural network with sparse convolution. To adapt to the imbalance in their data, they introduce a focal-loss function. To assess the model’s performance, they devise a relative probability score.
In the field of VAT fraud detection, AD methods have rarely been used [4]. The work done in [4] uses Belgian VAT declarations as their data. Their strategy begins with sector profiling, followed by applying two AD methods: Local Outlier Factor (LOC) and Fixed-Width Anomaly Detection (FWAD). Another study [16] used a statistical outlier detection strategy that outperformed the Kazakhstani tax administration’s supervised model.
The authors in [17] utilize taxpayer-specific features to detect tax fraud. They study the effect of the taxpayer’s network data in fraud detection. They utilize the data provided by the Armenian tax authority and conclude that the network between suppliers and buyers might help with fraud prediction. The researchers in [18] predict the taxpayer compliance level by measuring multiple indicators using Support Vector Machines (SVM).
Although the research in the literature mentioned above yields positive findings in terms of fraud detection, when utilizing supervised algorithms, they are still vulnerable to overfitting and generalization. Unsupervised methods are also unable to utilize the audit outcome, which reduces their utility. Ensemble methods can improve the performance of tax fraud detection by minimizing the limitations found in supervised and unsupervised approaches.
To address the limitations of the state-of-the-art depicted in Section 2, we propose a novel framework that exploits supervised, unsupervised, and ensemble learning paradigms. Additionally, newly engineered features have been designed and integrated with the proposed framework. Our approach consists of four modules that are shown in Fig. 1. The supervised module consists of assigning each tax return to a set of groups using a tree-based model. The unsupervised module searches for anomaly features within each tax return and assigns an anomaly score for each feature. The behavioural module calculates a score that reflects the compliance of each taxpayer over time. The prediction module uses the output of the previous modules as input for a predictive model that estimates the likelihood of fraud for each tax return.
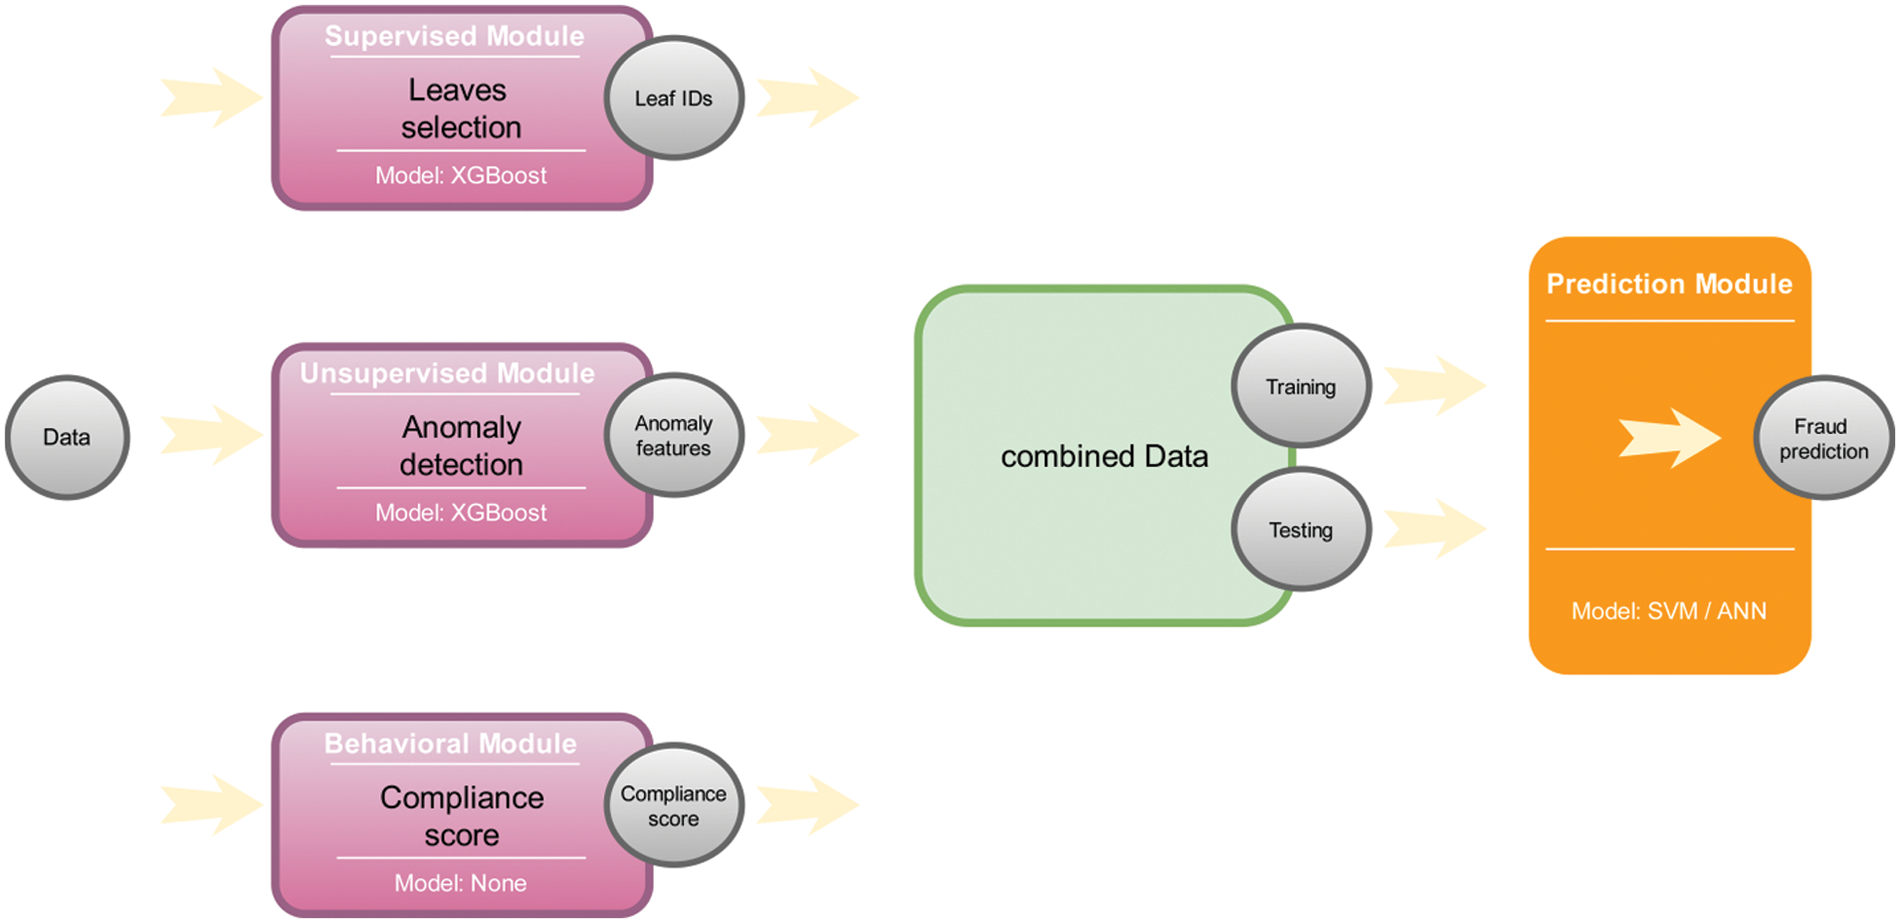
Figure 1: Proposed framework
In this part of our framework, we train an EXtreme Gradient Boosting (XGBoost) model on our original data. XGBoost [19] is a predictive model that is based on the construction of n trees to determine the class to which each document belongs. To do this, each tax return is assigned to a leaf node in each tree according to the criteria that each tree has developed. In addition, each leaf node assigns a probability of fraud for each tax return. Instead of using it as a predictive model in our problem, we use it as a way to assign each tax return to a set of leaf nodes.
Since each document will go through n trees within XGBoost, each document will belong to n leaf nodes (one leaf node per tree). We create a unique number for each leaf node in every tree before we assign it to each tax return. Fig. 2 illustrates the process. The result will be a matrix of size
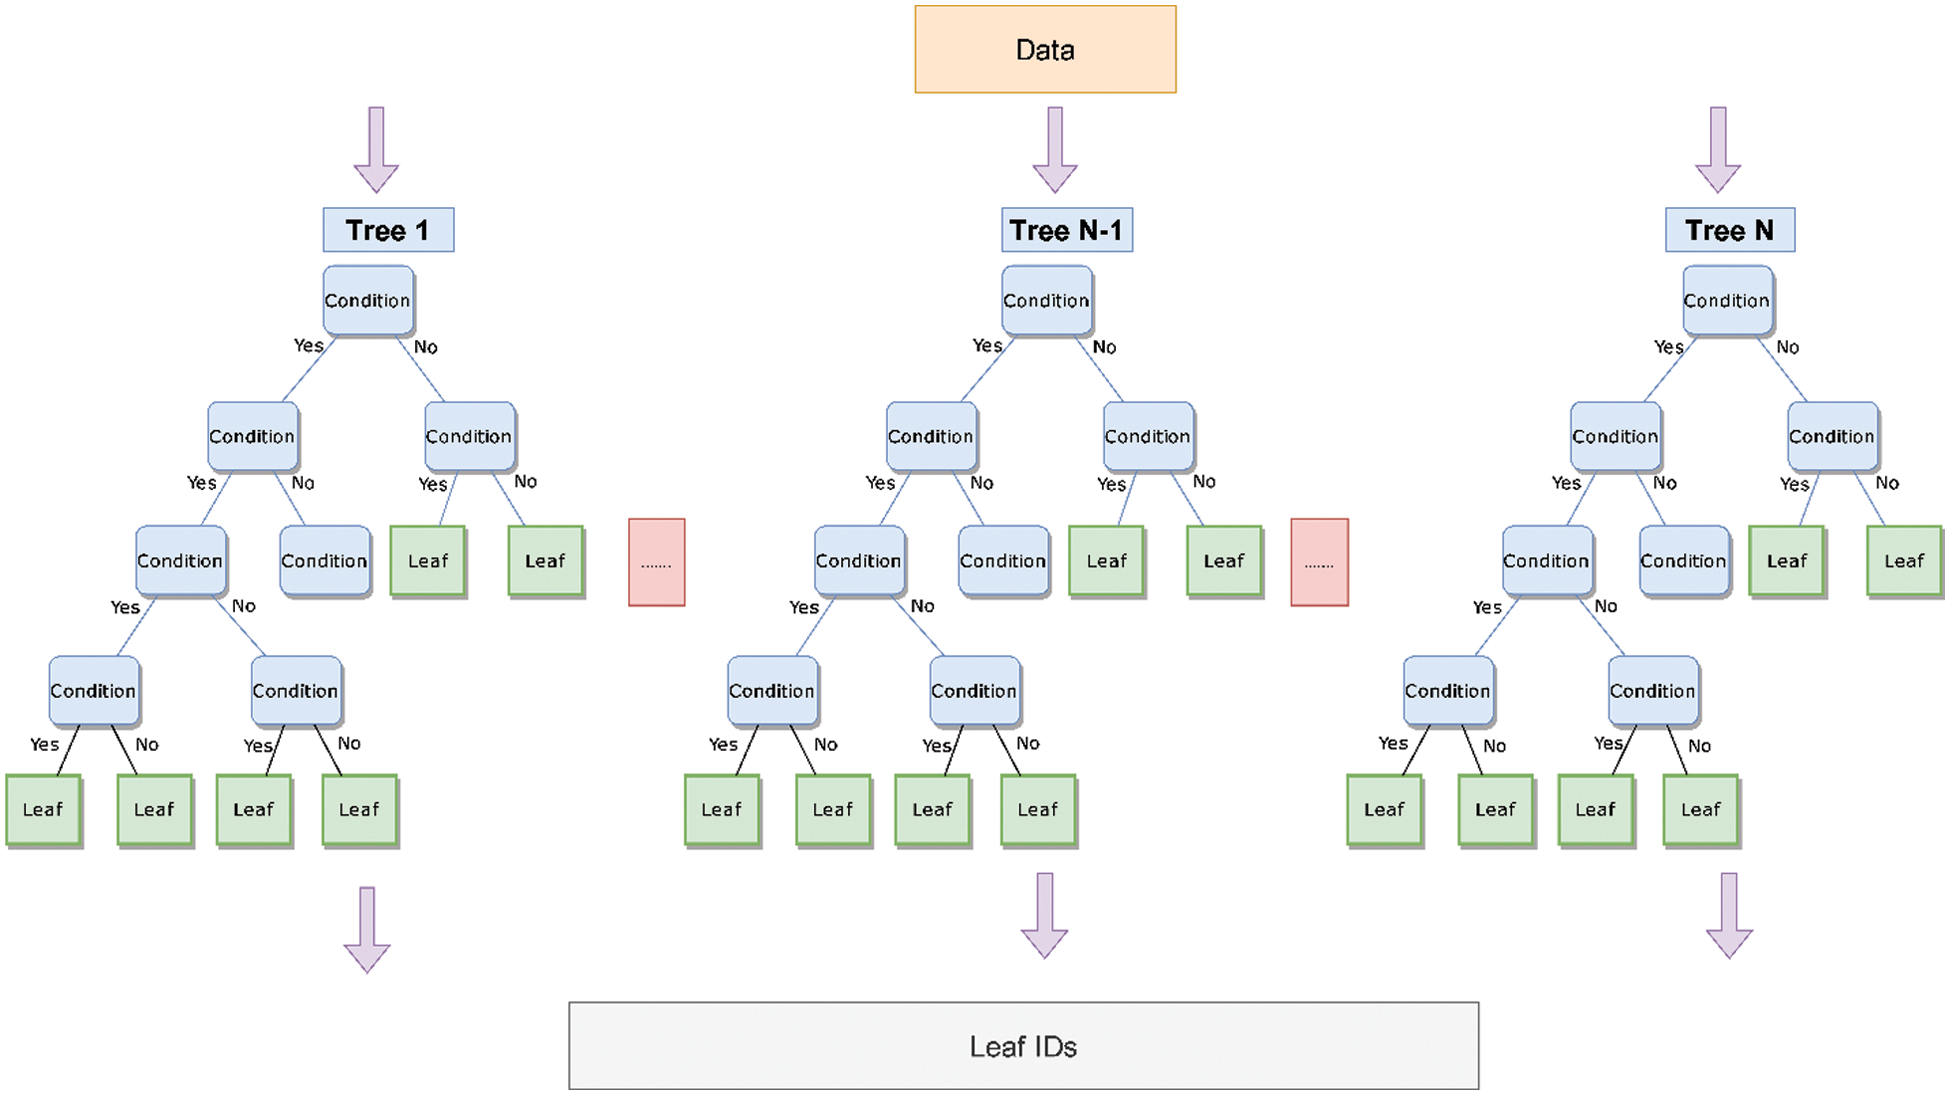
Figure 2: Leaf ID assignment
We use autoencoders [20] on our original data to search for anomaly features. An autoencoder is an artificial neural network where the objective is to encode the input data to a lower number of dimensions and attempt to regenerate the input data from the encoding. If the autoencoder can regenerate the input data from the encoding, then it effectively learns a more compact representation of the data. In other words, an autoencoder can be used as a dimensionality reduction technique [21]. Fig. 3 gives an example of an autoencoder. Where x is the input data,
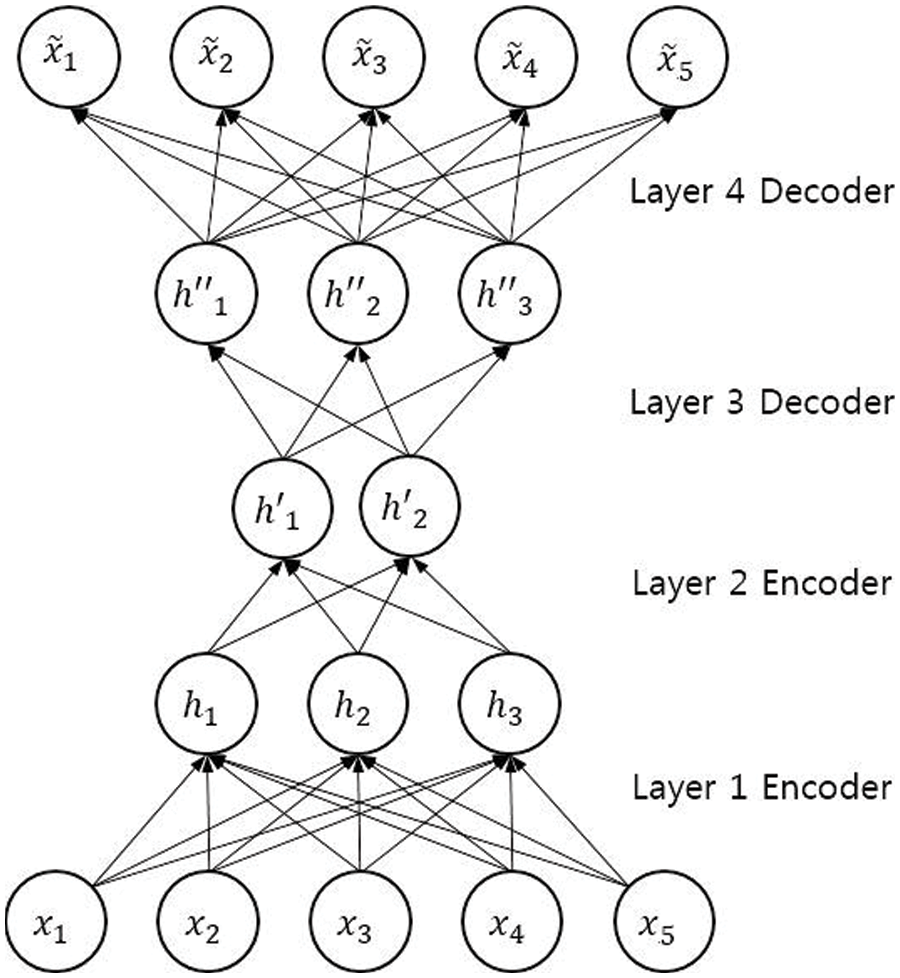
Figure 3: An example of an autoencoder
Although autoencoders as a dimensionality reduction technique are not of relevance to us in our system, we nevertheless use the same method to extract anomalous features. The basic idea behind this is that the autoencoder will struggle to regenerate an encoding to its original input if the input is an anomaly. The cause of this is that the autoencoder weights are not sufficiently trained to encode an anomalous input correctly, resulting in faulty encoding, which, in turn, results in inaccurate regenerated data when it is compared to the input data.
We can leverage this inaccuracy in two ways. First, calculate the Mean Squared Error (MSE) between the input data and the autoencoder’s generated data. The error is calculated as the difference between each feature in the input data and regenerated data. Each tax return receives an anomaly score based on this. Second, determine the proportion that each feature contributed to the overall MSE. Each tax return receives an anomaly score as a result, along with the percentage each attribute contributed to that score.
For this approach to work there is an assumption that needs to be satisfied first. The data analyzed needs to be homogeneous for the most part; otherwise, any anomaly detection technique would fail. To achieve this, we segment the data into different groups based on three factors: the business size of the taxpayer, the business category of the taxpayer, and the taxpayers themselves. This kind of segmentation is used to calculate two anomaly scores: one based on the differences between tax returns that belong to the same business size/category, and another based on the differences between tax returns that belong to the same taxpayer.
The first step to achieve this is to process the data in two ways: process the group of tax returns that belong to the same business size/category, and process the group of tax returns that belong to the same taxpayer. As a result, each tax return is examined twice: first in relation to the group of businesses with similar sizes and categories, and again in relation to the taxpayers’ tax returns. To achieve this, we individually calculate the modified z-score values for the two groups. In contrast to the traditional z-score, the modified z-score uses the median instead of the mean, and the median absolute deviation instead of the standard deviation. Such a modification takes into account anomalies when calculating the z-score. This ensures that anomalies do not affect the z-score calculation while still giving anomalies a value far away from
The step above creates two matrices: one that has the modified z-score values of tax returns belonging to the same business size/category, and one that has the modified z-score values of the tax returns belonging to the same taxpayer. Each matrix is of size
In our application, not every anomaly is considered risky. As an example, a tax return that has unusually high sales compared to its group is not considered risky from the point of view of the tax administration. In contrast, a tax return that has unusually high purchases, is considered risky. What is considered risky depends on the feature being analyzed. For sales, what is considered risky is a modified z-score value that is below most of the group, which is a score that must be below
After processing the data through the autoencoder, each tax return will have an anomaly score and
This part of our framework measures a behavioral feature for each taxpayer. It is helpful to describe the feature before detailing how it is calculated. The feature is a score between
The score takes into account time as well. To illustrate this, consider two taxpayers, A and B, who each has eight tax returns that all have been audited. Taxpayer A had an action on the first half of their tax returns and no action on the second half. Taxpayer B had no action on the first half of their tax returns and an action on the second half. Taxpayer A score is
The compliance score algorithm is given in Eq. (2).
To ensure that the model is not learning something about the outcome of the tax return it is trying to predict, each tax return has a different compliance score. For example, the compliance score of the tax return of Jan ‘22 would only consider tax returns happening before Jan ‘22 into the calculation. The output of this step is a list of scores of size n, where n is the number of tax returns a taxpayer has. This list is used as input to the prediction module of our framework.
This is the final step in our framework, which consists of using all the engineered features above to predict tax fraud. The input to this step is a matrix of size
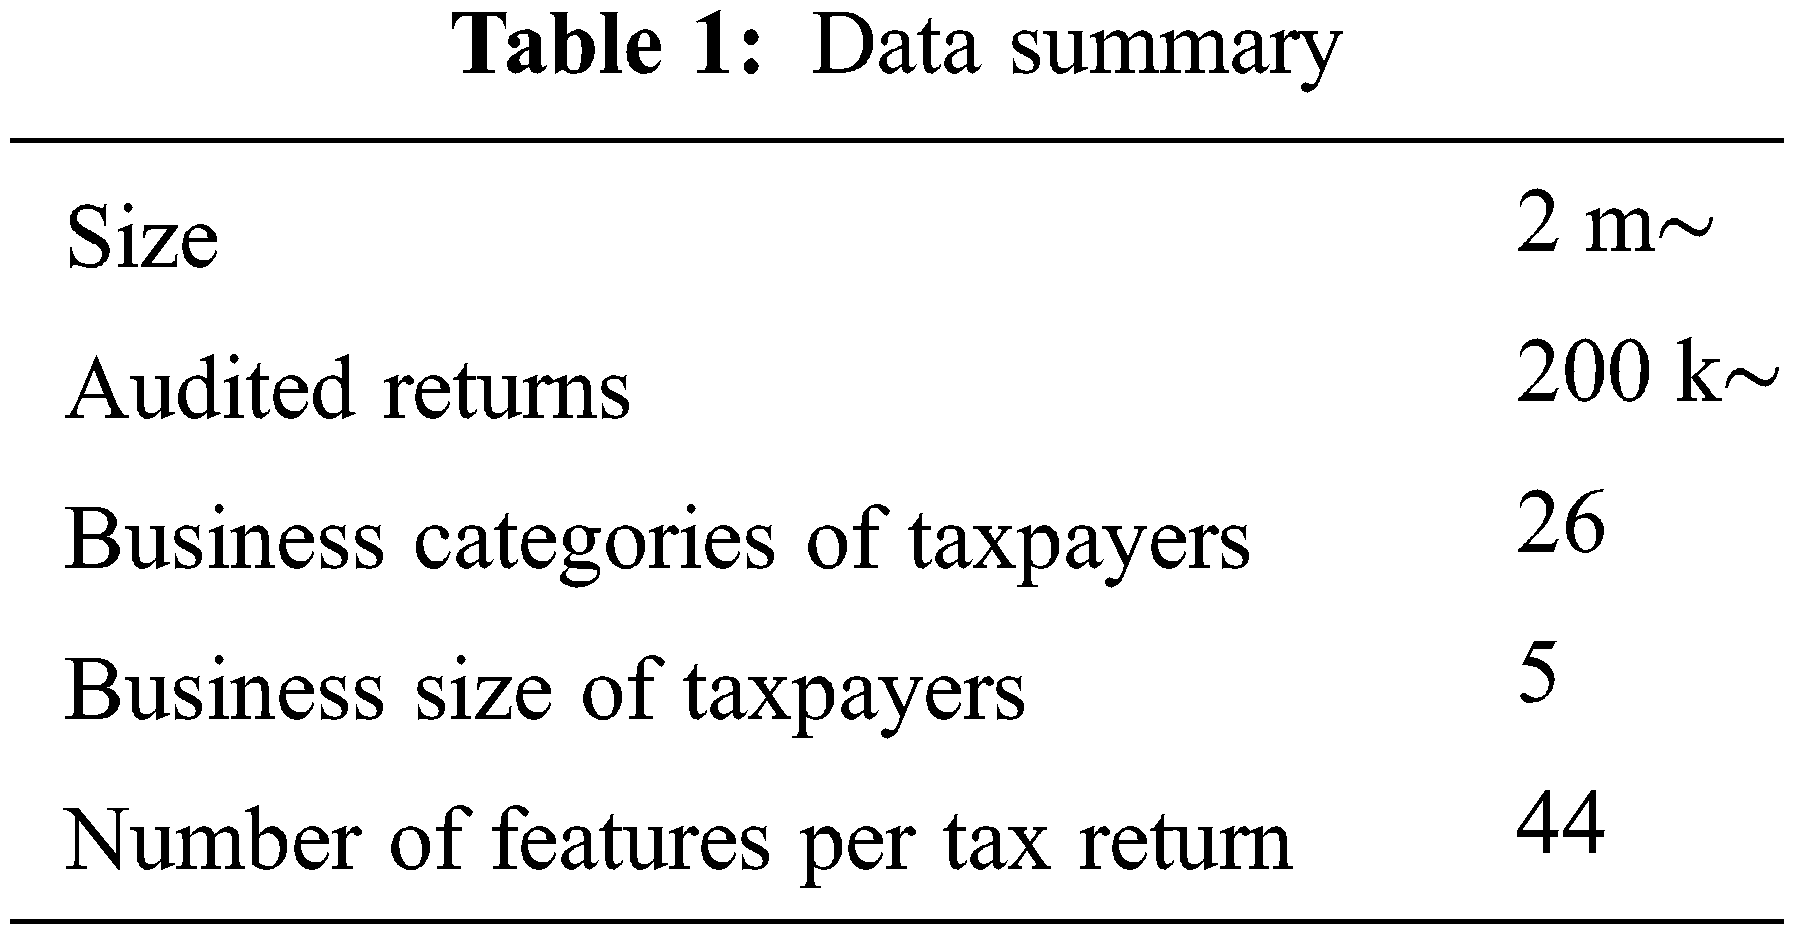
The Saudi ZAkat, Tax, and Customs Authority (ZATCA) were willing to share their tax return filings with us under the constraint that only a limited amount of information is released about the data and conclusions derived from this research. The reason behind this is not to inform fraudulent taxpayers of the strategy or features used to capture them, as this will render the strategy ineffective.
The data used consists of VAT filings submitted between January 2018 and April 2022. A high-level description of the data is shown in Table 1. The features included in the data consist of tax return fields and financially derived features.
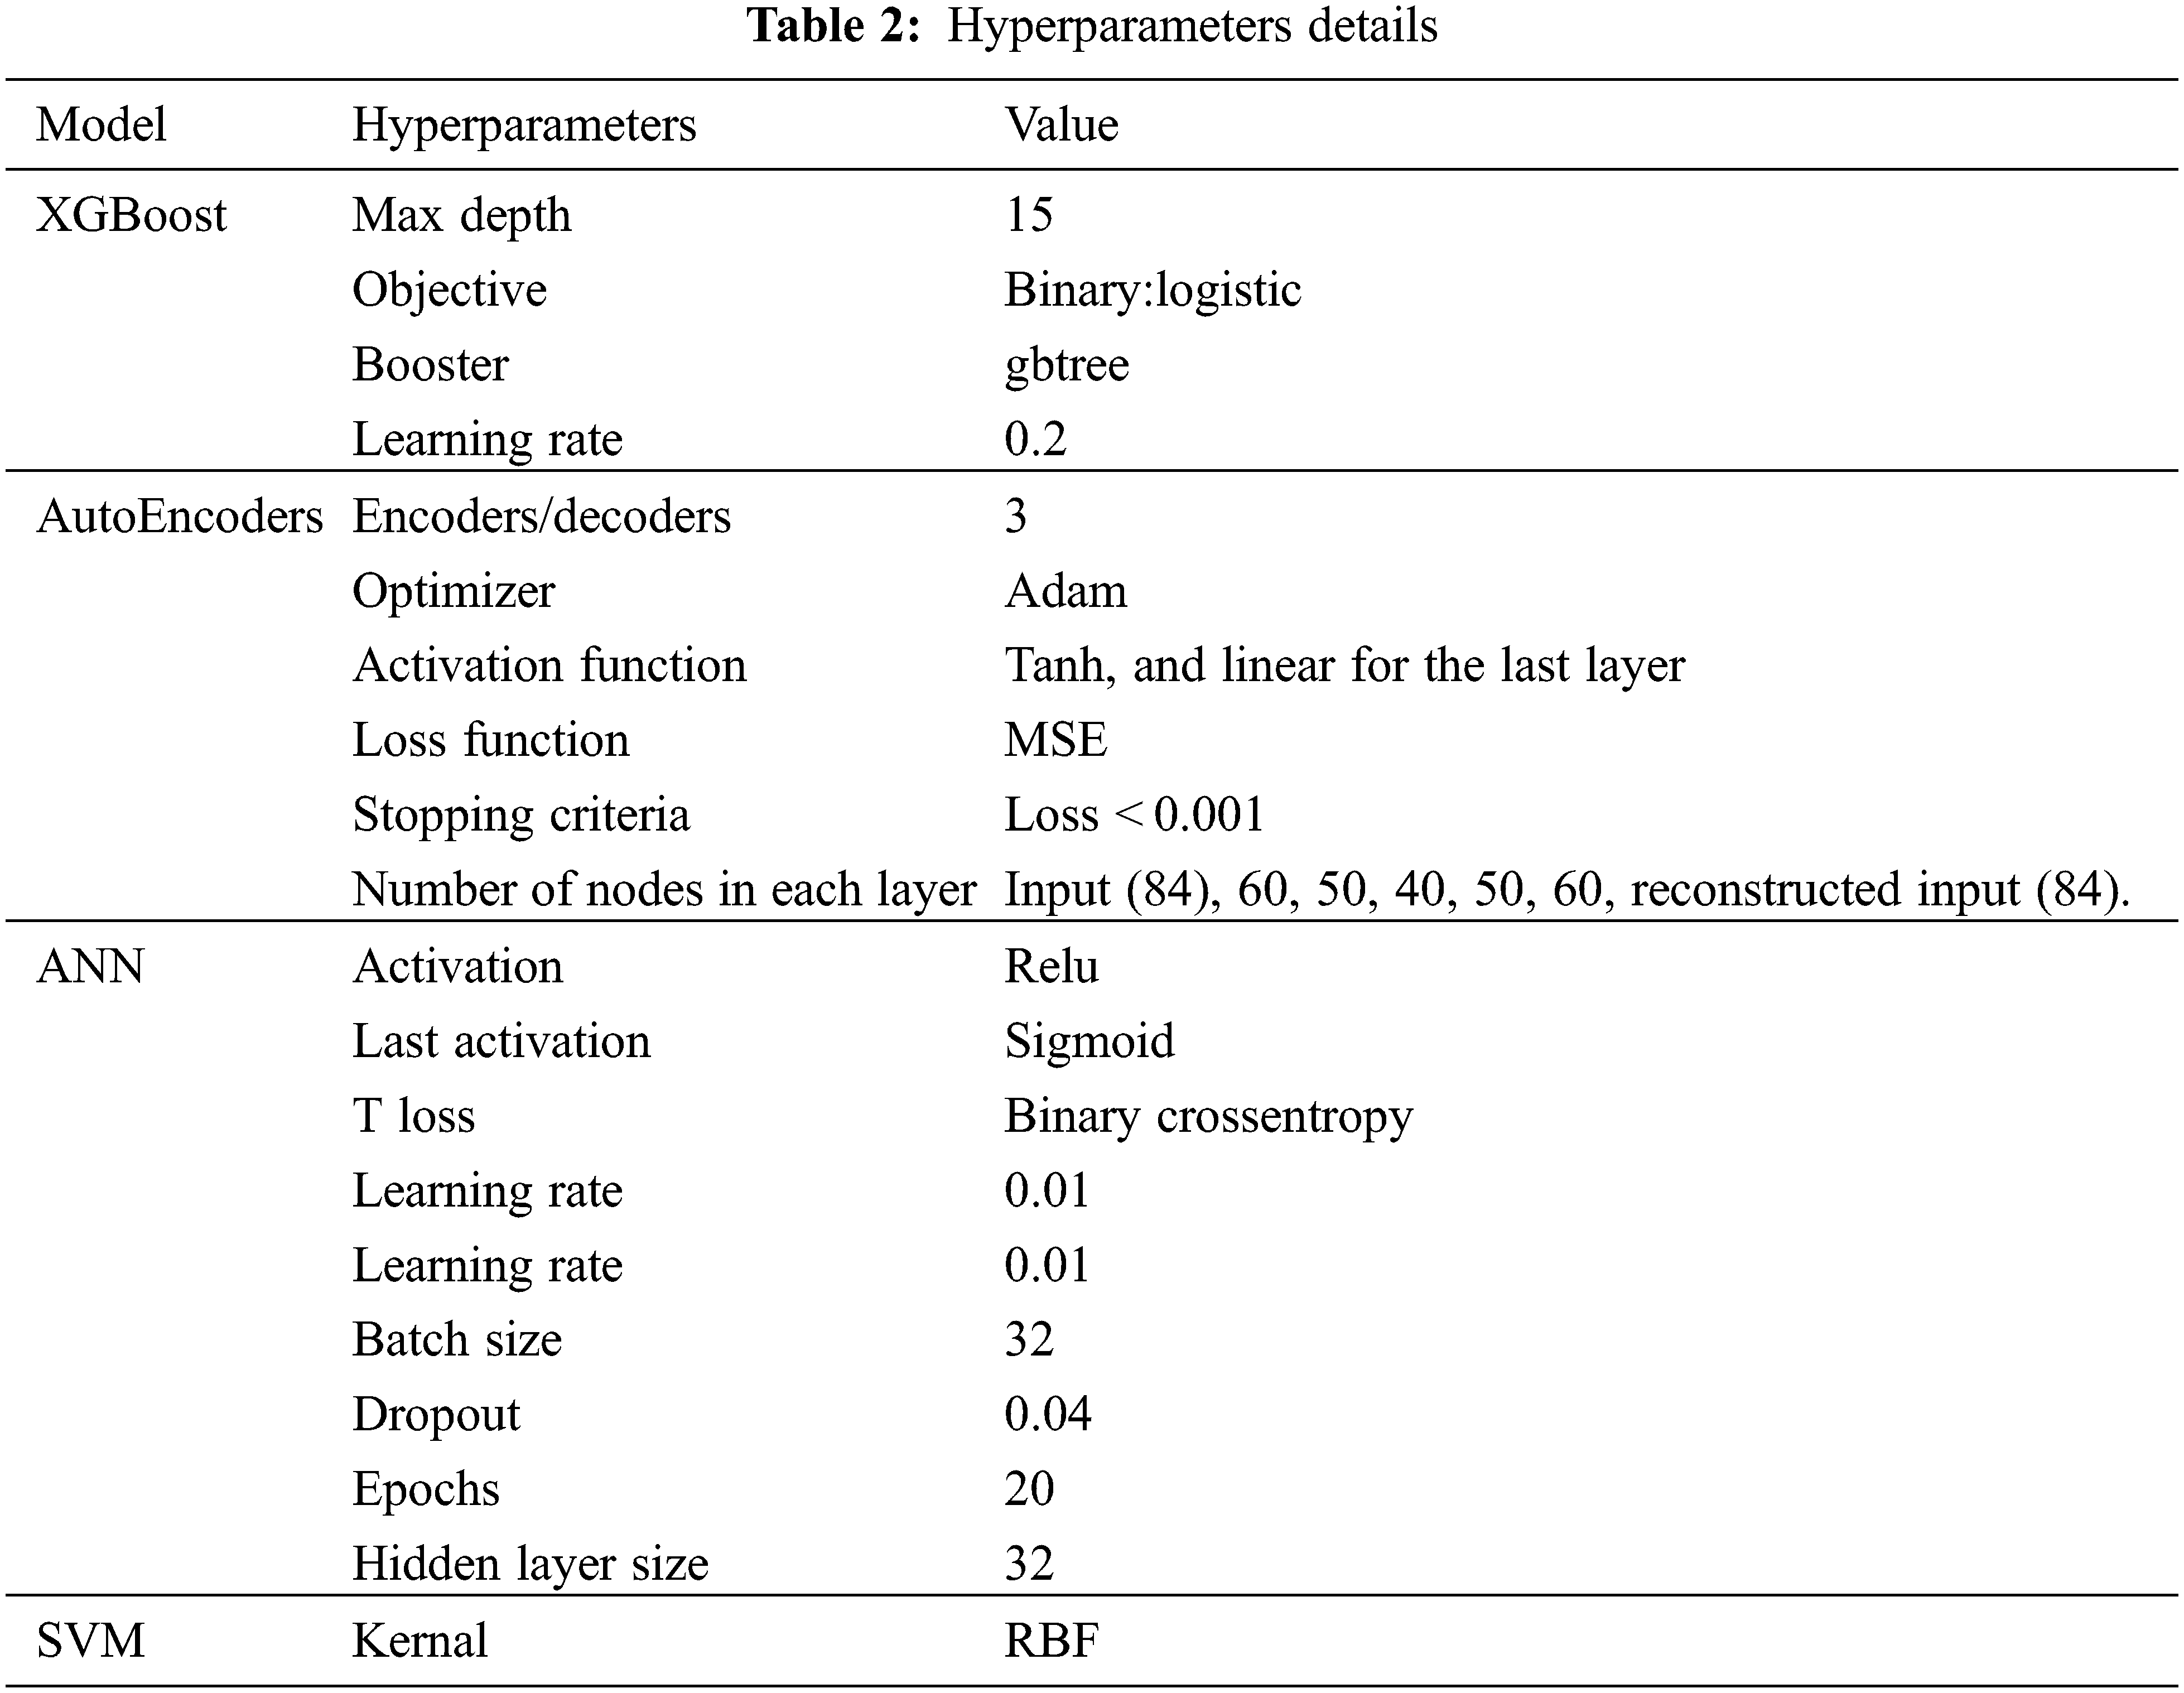
Our study employs four algorithms: XGBoost in the supervised module, autoencoders in the unsupervised module, as well as ANN and SVM in the prediction module of our system. Table 2 summarizes the hyperparameters changed for each algorithm from the default values after experimenting with different values for each hyperparameter.
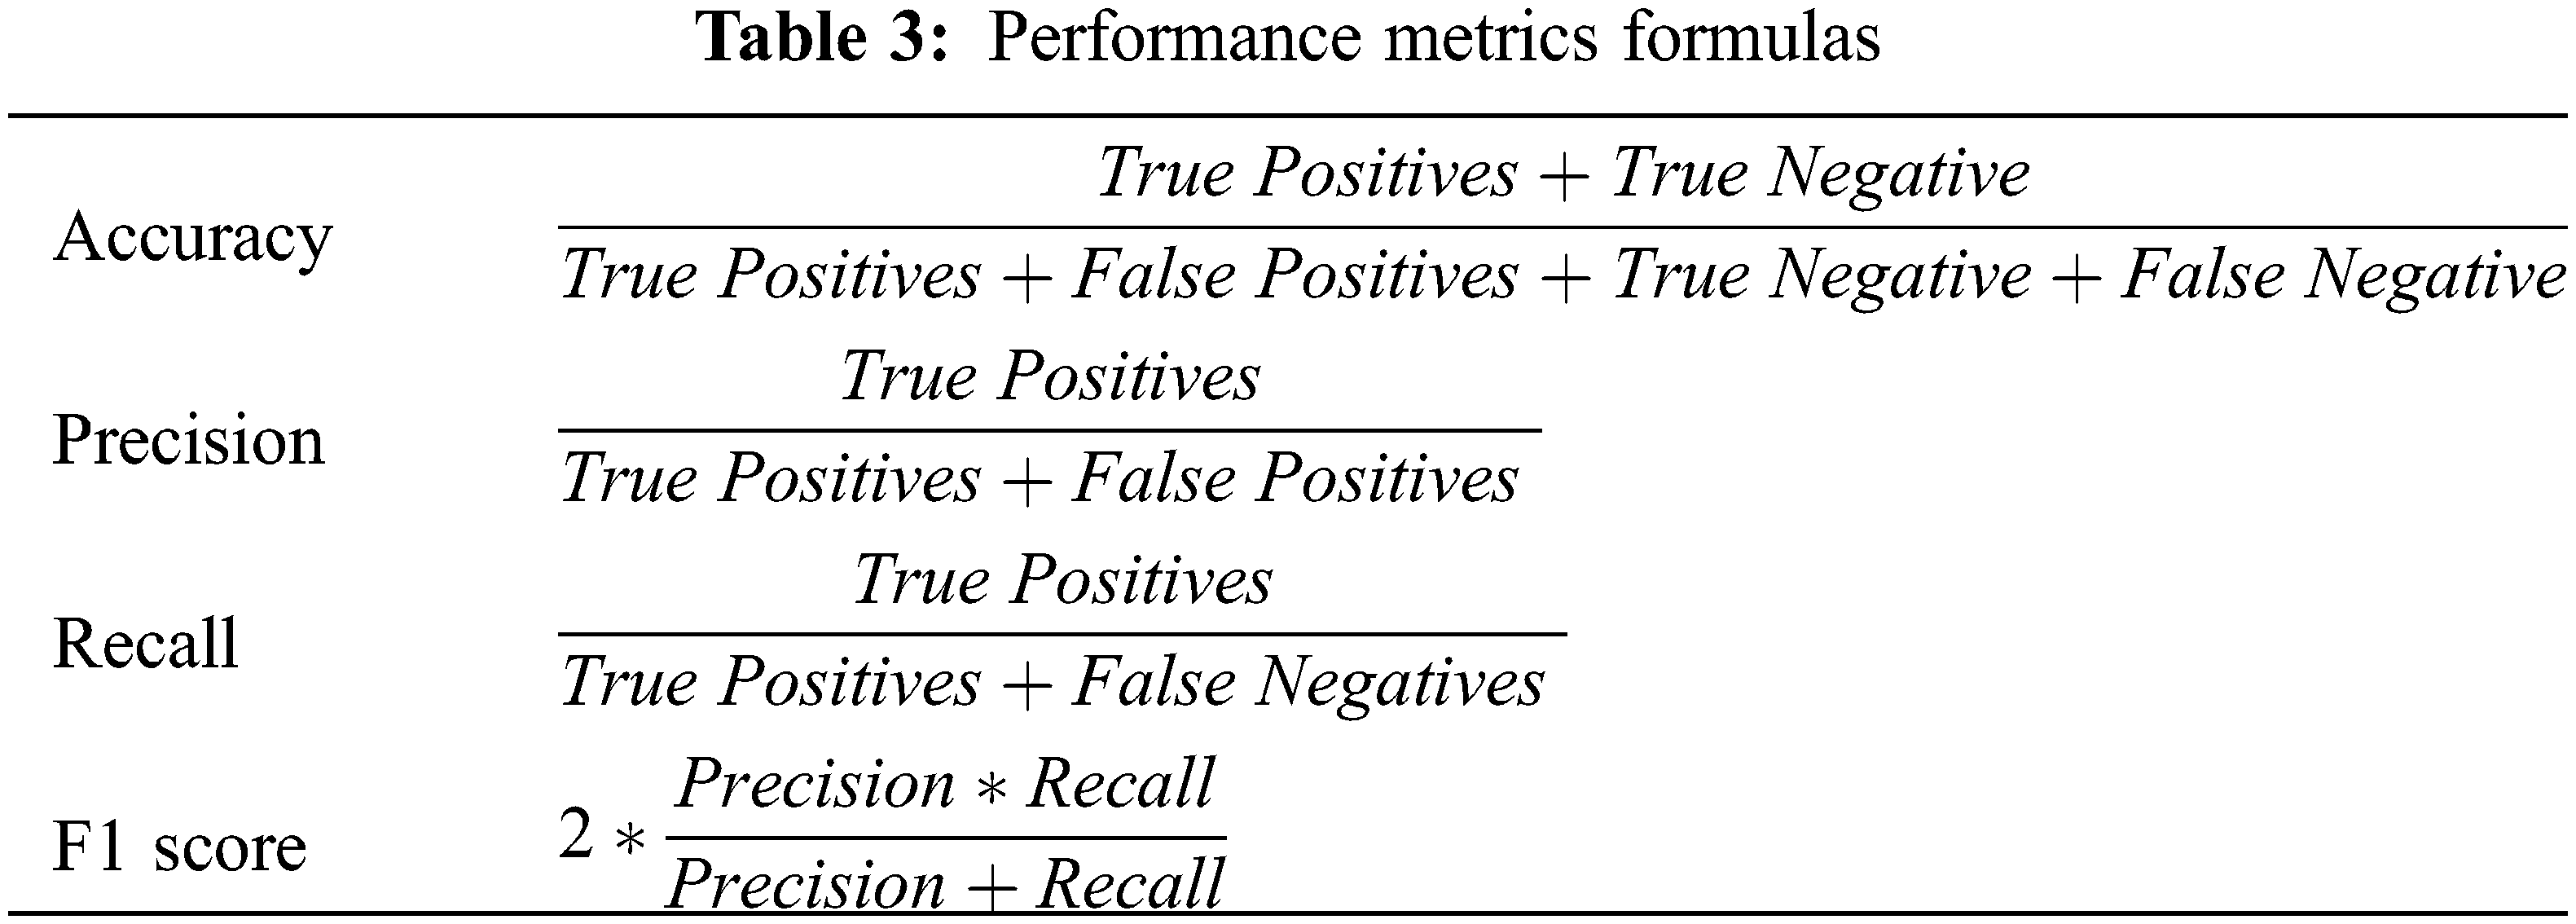
We use precision as our primary performance metric, but we report the recall, f1 score, and accuracy as well. The reason behind choosing precision is that the auditor has a finite amount of time to audit tax returns. Therefore, we want to minimize wasted time caused by false positives predicted by our model by ensuring a high precision rate. The performance metrics formulas are given in Table 3. Where a positive hit denotes a fraudulent tax return, whereas a negative hit denotes a compliant tax return.
To test our proposed approach, we compare our framework of engineered features to using just the original features as an input to XGBoost, ANN, and SVM. The results are given in Table 4. After experimenting with different hyperparameters on both SVM and ANN on all features, we noticed that ANN is slightly better at predicting the “fraud” class compared to SVM. At the same time, SVM was better at predicting “not fraud” and has a higher recall for “fraud”. Given the nature of the problem, our main objective is a high precision for the “fraud” class. As a result, we conclude that ANN marginally beats SVM and select it as our best model. Our framework outperforms all models using the original data except for recall on the “fraud” class using SVM and an equal value for precision for the “not fraud” class. In addition, we notice that all models struggle with recall for the “not fraud” class, especially when using the original data. Furthermore, we investigated the output of our framework to test if it is biased toward taxpayers with a low compliance score. The framework was able to detect fraud cases even when the compliance score for the taxpayer is high. Table 5 shows the results of several different hyperparameters we experimented with in ANN and SVM. The results are relatively worse than our best-performing model.
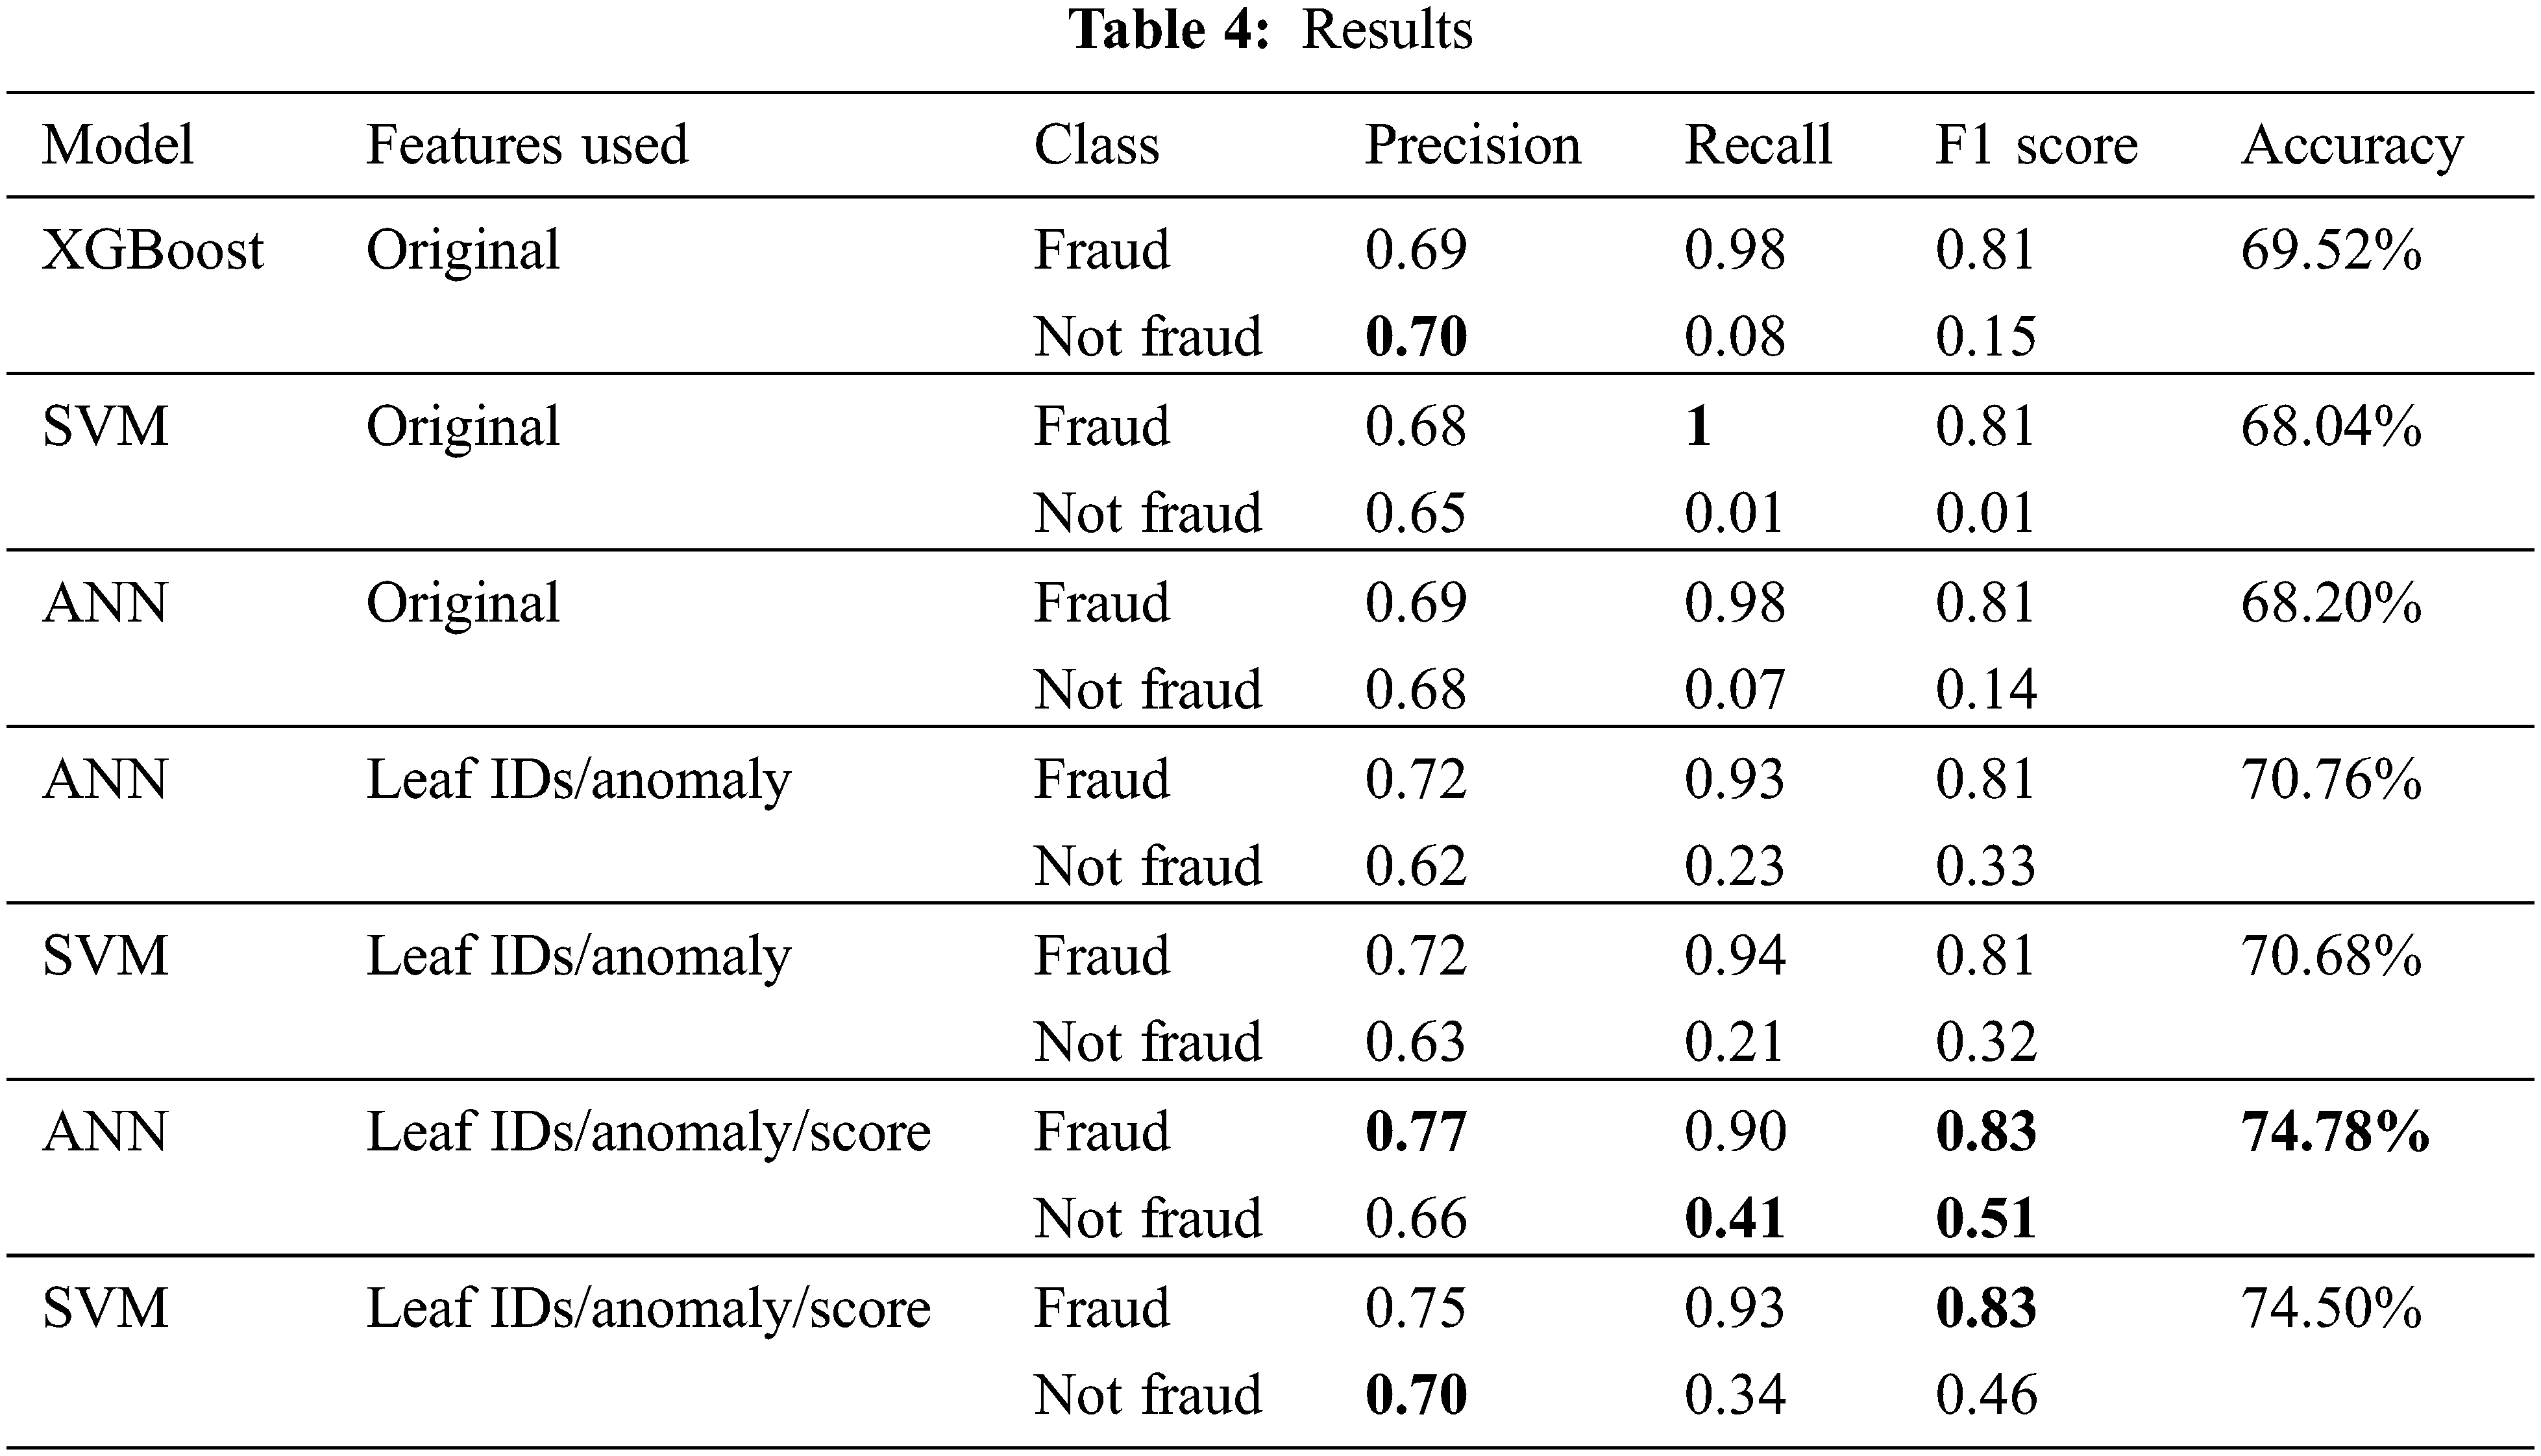
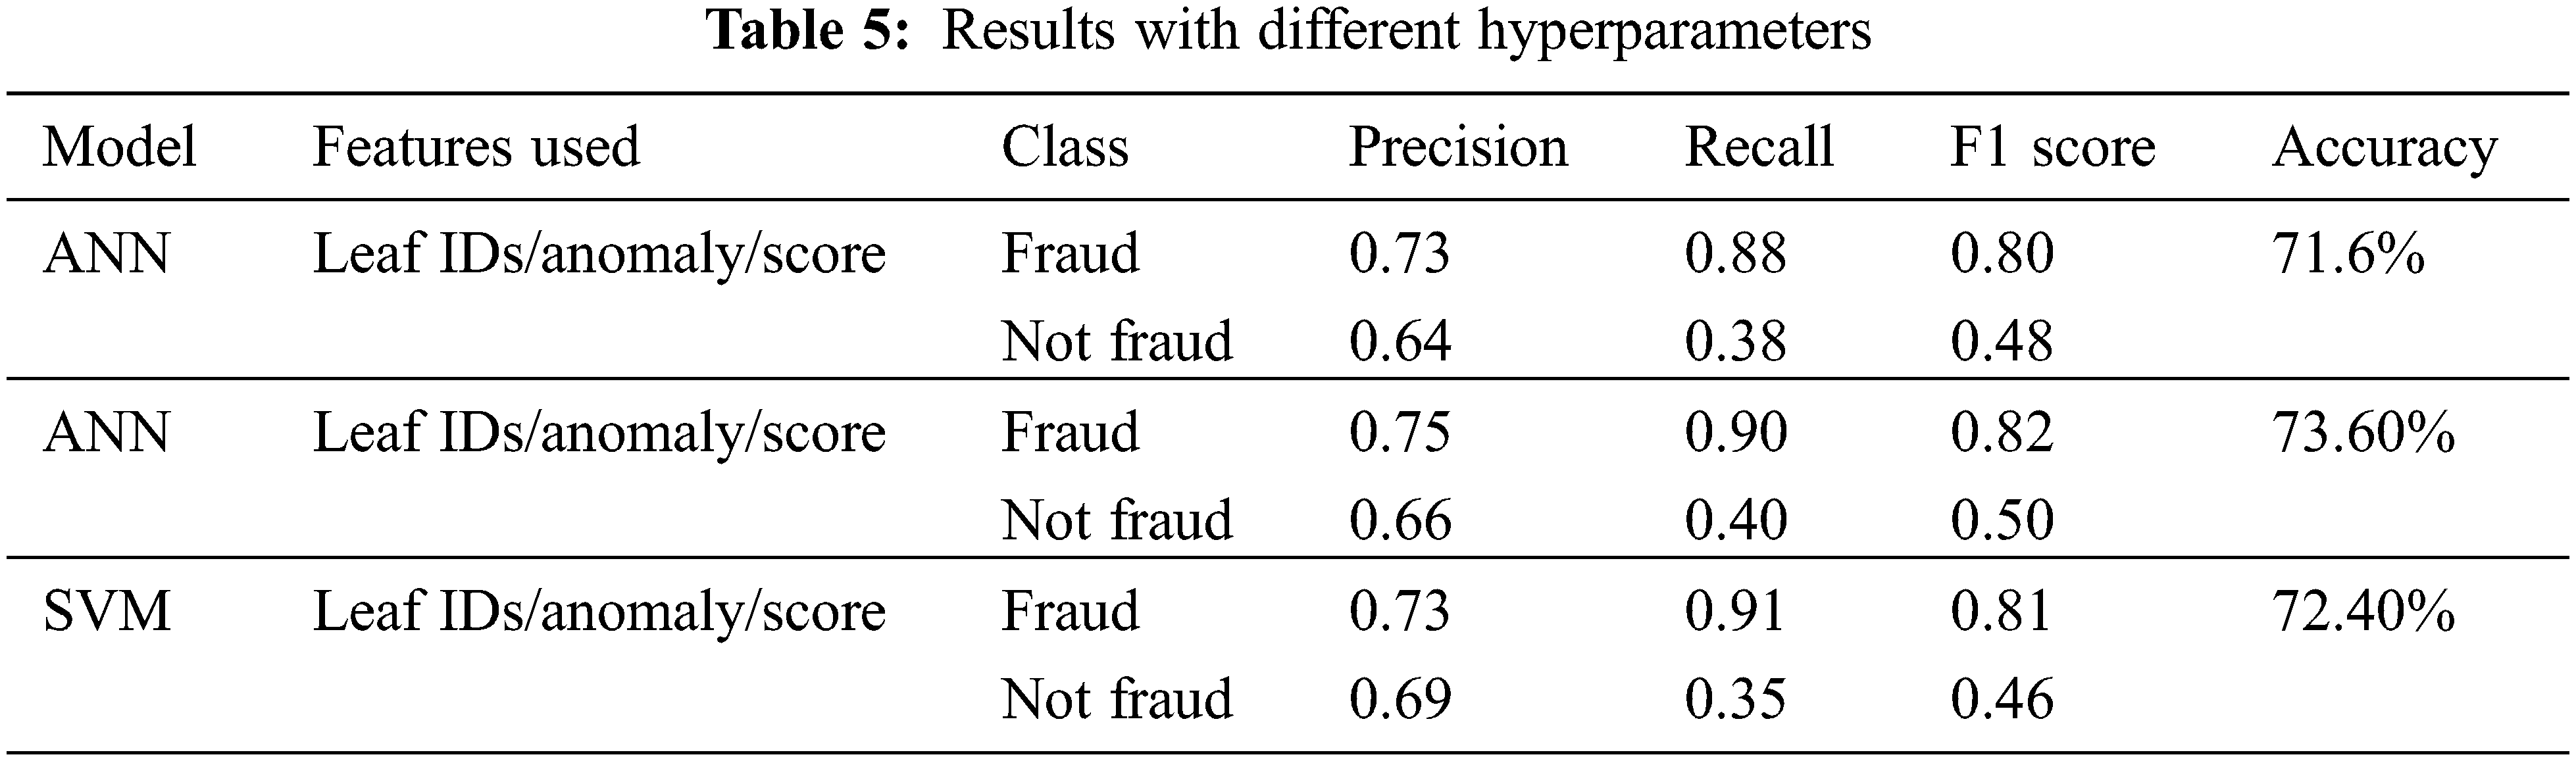
Fig. 4 shows the overall compliance score of taxpayers. The score shown here takes into consideration all the tax returns submitted by the taxpayer since it is not being used in the framework. This information is used in two ways: First, to assess the coverage of taxpayers in current auditing strategies. This is helpful as some taxpayers might never be flagged, and as a result, their compliance score will remain 0. Second, to implement an audit selection strategy that reduces the number of taxpayers with a compliance score close to 0. This step ensures that the tax authority is not just focusing its efforts on auditing fraudulent taxpayers.
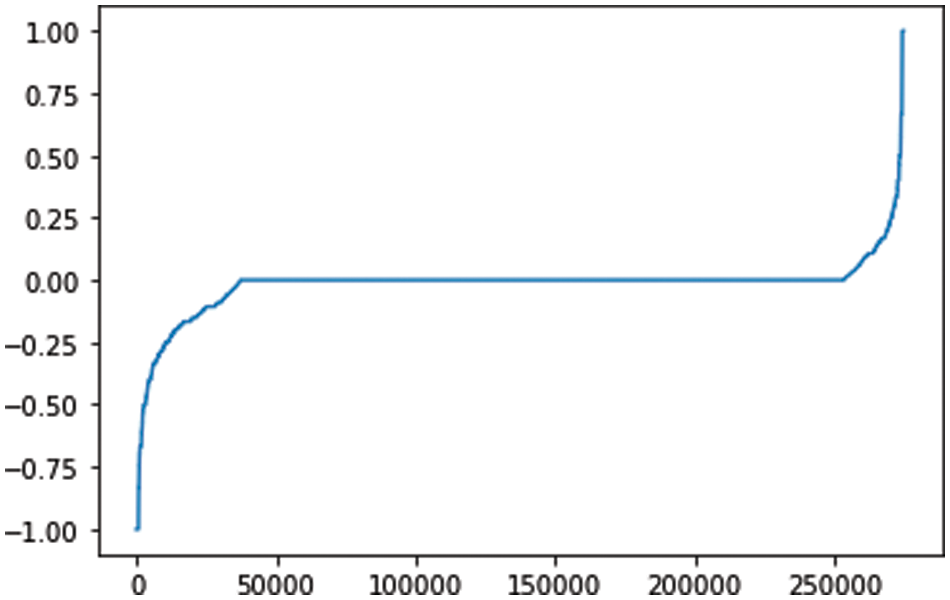
Figure 4: Compliance score (sorted). X-axis: number of taxpayers. Y-axis: score
In this paper, we introduced a novel framework that utilizes supervised and unsupervised models, as well as a compliance score for each taxpayer. This allows our framework to use the data in its totality, allowing it to detect new patterns of fraud, which is a difficulty that tax authorities have when utilizing purely supervised models.
Despite the promising results of our framework, two limitations exist. The first limitation lies in the anomaly detection part of our framework, which assumes that the behavior of the sector/business size under observation is homogeneous. The second limitation is that the compliance score of many taxpayers is close to zero since they have not been adequately audited. This limits the amount of information derived from it. However, the auditing strategy of tax authorities can prioritize taxpayers with a compliance score close to
Extensions to the current framework include the integration of other data sources, additional taxpayer behavioral markers, and financial features; ideally spanning several years to include growth features in the model. Furthermore, assessing the homogeneity of each sector/business size will increase the performance of the unsupervised module when that knowledge is integrated into the anomaly score calculation.
Acknowledgement: This work was supported by ZATCA. The author is grateful for the help provided by the risk and intelligence department as well as the continued support of the governor for advancing the field of AI and machine learning in government entities.
Funding Statement: The author received no specific funding for this study.
Conflicts of Interest: The author declares that he has no conflicts of interest to report regarding the present study.
References
1. A. Cobham and P. Jansky, “Global distribution of revenue loss from corporate tax avoidance: Re-estimation and country results,” Journal of International Development, vol. 30, no. 2, pp. 206–232, 2018. [Google Scholar]
2. E. Crivelli, R. A. De Mooij and M. Keen, “Base erosion, profit shifting and developing countries,” FinanzArchiv/Public Finance Analysis, vol. 72, no. 3, pp. 268–301, 2016. [Google Scholar]
3. P. Castellon Gonzalez and J. D. Velasquez, “Characterization and detection of taxpayers with false invoices using data mining techniques,” Expert Systems with Applications, vol. 40, no. 5, pp. 1427–1436, 2013. [Google Scholar]
4. J. Vanhoeyveld, D. Martens and B. Peeters, “Value-added tax fraud detection with scalable anomaly detection techniques,” Applied Soft Computing, vol. 86, no. 1, pp. 105895, 2020. [Google Scholar]
5. R. J. Bolton and D. J. Hand, “Statistical fraud detection: A review,” Statistical Science, vol. 17, no. 3, pp. 235–255, 2002. [Google Scholar]
6. M. Gupta and V. Nagadevara, “Audit selection strategy for improving tax compliance: Application of data mining techniques,” in Proc. e-Governance, Hyderabad, Telangana, India, pp. 28–30, 2007. [Google Scholar]
7. C. Pérez López, M. Delgado Rodríguez and S. de Lucas Santos, “Tax fraud detection through neural networks: An application using a sample of personal income taxpayers,” Future Internet, vol. 11, no. 4, pp. 86, 2019. [Google Scholar]
8. S. Mittal, O. Reich and A. Mahajan, “Who is bogus? using one-sided labels to identify fraudulent firms from tax returns,” in Proc. SIGCAS, San Francisco, CA, USA, pp. 1–11, 2018. [Google Scholar]
9. M. Agyemang, K. Barker and R. Alhajj, “A comprehensive survey of numeric and symbolic outlier mining techniques,” Intelligent Data Analysis, vol. 10, no. 6, pp. 521–538, 2006. [Google Scholar]
10. D. Xu, Y. Wang, Y. Meng and Z. Zhang, “An improved data anomaly detection method based on isolation forest,” in Proc. ISCID, Hangzhou, Zhejiana, China, pp. 287–291, 2017. [Google Scholar]
11. Z. Cheng, C. Zou and J. Dong, “Outlier detection using isolation forest and local outlier factor,” in Proc. RACS, Chongqing, Shapingba, China, pp. 161–168, 2019. [Google Scholar]
12. V. Chandola, A. Banerjee and V. Kumar, “Anomaly detection: A survey,” ACM Computing Surveys, vol. 41, no. 3, pp. 1–58, 2009. [Google Scholar]
13. S., Oprea, A. Bara, F. C. Puican and I. C. Radu, “Anomaly detection with machine learning algorithms and big data in electricity consumption,” Sustainability, vol. 13, no. 19, pp. 10963, 2021. [Google Scholar]
14. M. Lokanan, V. Tran and N. Hoai Vuong, “Detecting anomalies in financial statements using machine learning algorithm: The case of Vietnamese listed firms,” Asian Journal of Accounting Research, vol. 4, no. 2, pp. 181–201, 2019. [Google Scholar]
15. C. Zhang, X. Xiao and C. Wu, “Medical fraud and abuse detection system based on machine learning,” International Journal of Environmental Research and Public Health, vol. 17, no. 19, pp. 7265, 2020. [Google Scholar]
16. Z. Assylbekov, I. Melnykov, R. Bekishev, A. Baltabayeva, D. Bissengaliyeva et al., “Detecting value-added tax evasion by business entities of Kazakhstan,” in Proc. KES-IDT, York, North Yorkshire, UK, pp. 37–49, 2016. [Google Scholar]
17. V. Baghdasaryan, H. Davtyan, A. Sarikyan and Z. Navasardyan, “Improving tax audit efficiency using machine learning: The role of taxpayer’s network data in fraud detection,” Applied Artificial Intelligence, vol. 36, no. 1, pp. 1–23, 2021. [Google Scholar]
18. J. Hunegnaw ejigu, “Prediction of taxpayers’ compliance level using machine learning techniques,” M.S. Dissertation, Bahir dar University Ethiopia, 2021. [Google Scholar]
19. T. Chen and C. Guestrin, “Xgboost: A scalable tree boosting system,” in Proc. SIGKDD, San Francisco, CA, USA, pp. 785–794, 2016. [Google Scholar]
20. N. Alsadhan and D. B. Skillicorn, “Comparing svd and sdae for analysis of islamist forum postings,” in Proc. ICDM, Atlantic City, NJ, USA, pp. 948–953, 2015. [Google Scholar]
21. G. E. Hinton and R. R. Salakhutdinov, “Reducing the dimensionality of data with neural networks,” Science, vol. 313, no. 5786, pp. 504–507, 2006. [Google Scholar]
Cite This Article
 Copyright © 2023 The Author(s). Published by Tech Science Press.
This work is licensed under a Creative Commons Attribution 4.0 International License , which permits unrestricted use, distribution, and reproduction in any medium, provided the original work is properly cited.
 Downloads
 Citation Tools