
 Submit a Paper
 Propose a Special lssue
 Open Access
ARTICLE

Coot Optimization with Deep Learning-Based False Data Injection Attack Recognition
1 Department of Information Technology, Chaitanya Bharathi Institute of Technology, Hyderabad, Telangana, India
2 Department of Computer Science and Engineering, Aditya Engineering College, Surampalem, Andhra Pradesh, India
3 Department of Electrical Engineering, College of Engineering, Jouf University, Saudi Arabia
4 Department of Computer Science and Engineering, Vignan’s Institute of Information Technology, Visakhapatnam, 530049, India
5 School of Electrical and Electronic Engineering, Universiti Sains Malaysia, Nibong Tebal, 14300, Malaysia
* Corresponding Author: Mohamad Khairi Ishak. Email:
Computer Systems Science and Engineering 2023, 46(1), 255-271. https://doi.org/10.32604/csse.2023.034193
Received 08 July 2022; Accepted 11 October 2022; Issue published 20 January 2023
 View Full Text
 Download PDF
Abstract
The recent developments in smart cities pose major security issues for the Internet of Things (IoT) devices. These security issues directly result from inappropriate security management protocols and their implementation by IoT gadget developers. Cyber-attackers take advantage of such gadgets’ vulnerabilities through various attacks such as injection and Distributed Denial of Service (DDoS) attacks. In this background, Intrusion Detection (ID) is the only way to identify the attacks and mitigate their damage. The recent advancements in Machine Learning (ML) and Deep Learning (DL) models are useful in effectively classifying cyber-attacks. The current research paper introduces a new Coot Optimization Algorithm with a Deep Learning-based False Data Injection Attack Recognition (COADL-FDIAR) model for the IoT environment. The presented COADL-FDIAR technique aims to identify false data injection attacks in the IoT environment. To accomplish this, the COADL-FDIAR model initially pre-processes the input data and selects the features with the help of the Chi-square test. To detect and classify false data injection attacks, the Stacked Long Short-Term Memory (SLSTM) model is exploited in this study. Finally, the COA algorithm effectively adjusts the SLTSM model’s hyperparameters effectively and accomplishes a superior recognition efficiency. The proposed COADL-FDIAR model was experimentally validated using a standard dataset, and the outcomes were scrutinized under distinct aspects. The comparative analysis results assured the superior performance of the proposed COADL-FDIAR model over other recent approaches with a maximum accuracy of 98.84%.Keywords
The Internet of Things (IoT) networking paradigm is rapidly developing and has turned out to be a fully-realized technology. The development of IoT systems denotes that billions of several smart devices can be connected to a network around the community and can collect, store and process the information collected through sensors [1]. The IoT network is considered a significant aspect of future advancements, and its applications are expanding across a wide range of businesses [2]. IoT plays an important role in enhancing performance outcomes in several fields: entertainment, manufacturing, healthcare, environmental protection, public security, agriculture, accommodation, industrial monitoring, traditional metering system and intelligent transportation [3]. However, little attention has been paid to adopting high-quality security measures in IoT gadgets. In such cases, insecure communication and the lack of authentication remain the foremost issues in several IoT gadgets [4]. The insiders bring several challenges due to the heavy growth of IoT gadgets.
Privacy and security issues have substantially increased in recent years, especially after the extensive application of technology in the execution of different activities in organizations [5]. Amongst the issues, insider attacks are considered the most hazardous and expensive. An insider attack can be defined as a type of malicious activity executed by users who have authorized access to the information mechanism of an organization [6]. Since authorization issues are prevalent in insider attacks, it is challenging to identify intruders. Organizations tend to lose their goodwill and business objectives if the issues are not overcome within the earliest possible time. A false Data Injection Attack (FDIA) can be defined as the insertion of commands or data at the source or the time of communication. Data injection manipulates the value produced by actuators, sensors and other gadgets.
On the other hand, the command ‘injection’ denotes different types of server-issued instructions [7]. FDIA is one of the common attacks launched at any type of critical infrastructure. It is executed by interrupting the interaction sessions among various gadgets.
FDIAs can damage external elements, incur a heavy economic loss, and produce serious scenarios [8]. Thus, it is important to detect and prevent FDIAs in critical infrastructures. But, the prevailing solutions are merely theoretical or adopted from the cyber ecosystem, such as Intrusion Prevention Systems (IPS) and Intrusion Detection Systems (IDS), which are generally utilized in the protection of conventional computer networks [9]. The existing methods lack specific security needs and critical infrastructures. At the same time, there is a need to have a robust method with a high rate of events, real-time communication and identification, proactive defence and complicated physical and cyber interfaces [10]. Thus, the current study attempts to overcome such constraints by implementing Machine Learning (ML) methods in detecting injection attacks.
The current study introduces a new Coot Optimization Algorithm with a Deep Learning-based False Data Injection Attack Recognition (COADL-FDIAR) model for the IoT environment. The presented COADL-FDIAR technique pre-processes the input data and selects the features with the help of the Chi-square test. To detect and classify false data injection attacks, the Stacked Long Short Term Memory (SLSTM) model is exploited in this study. Finally, the COA algorithm adjusts the hyperparameters of the SLTSM model effectually and accomplishes a superior recognition efficiency. The proposed COADL-FDIAR model was experimentally validated using a standard dataset, and the results were inspected under distinct aspects.
The rest of the paper is organized as follows. Section 2 provides the information on the literature review; Section 3 introduces the proposed model. Section 4 validates the results, and Section 5 concludes the study.
In literature [11], a simplified Neural Network (NN) was proposed to detect the False Data Injection (FDI) assaults that target the communication line overflows. When the proposed method was compared against the existing techniques, it was found that it not only concentrated on stealthy attacks bypassing the state estimation (SE) but also helped in the de-congestion of the communication lines in smart grids. Hu et al. [12] modelled a Cyber-Physical Moving Target Defense (CPMTD) approach focused on detection and attack prevention methods to mitigate static vulnerabilities. This method amalgamated the defence policies for power mechanisms. The proposed CPMTD method was designed to prevent attacks that mislead and disturb the attack preparation methods through the randomization of data acquisition processes. The proposed method controlled the change-over of multiple system dimensions based on the network programmability of Protocol Oblivious Forwarding (POF). A physical-MTD strategy was devised for attack detection. It enhanced the detection probability of the FDIA by occasionally varying the dimension matrices of the SE related to the gadgets’ capabilities in terms of disturbing the communication line.
Dehghani et al. [13] devised a new cyber-attack detection method for the detection of FDIAs related to the Fast Fourier Transform (FFT) along with the Singular Value Decomposition (SVD) method. Since the concentration of the proposed method was to detect the FDIAs, it considered the effect of renewable energy resources. When malicious data was included in system-state vectors, the vectors’ temporal data and the spatial data relationship drifted from the usual functioning circumstances. Srinivasan et al. [14] proposed a Deep Learning (DL)-related location detection method to identify the FDIA regions continuously. This study used False Data Detector (FDD) and a Convolutional Neural Network (CNN). The FDD can be installed to capture the fake data. As a multi-label classifier, the CNN method was used to evaluate co-occurrence dependency, irrespective of the power flow computations that occur due to possible attacks.
Kumar et al. [15] examined the efficiency of ML techniques in identifying the FDIC. Specifically, the authors focused on two commonly-employed critical infrastructures, the water treatment plants and the power systems. This research work emphasized dealing with two key technical problems, such as identifying optimal features set in a hybrid of methods and resolving class imbalance perplexity using the oversampling techniques. In the study conducted earlier [16], a new false data detection and prevention pattern was modelled for the dimension infrastructure in smart grids. In this study, two methods were projected for the management of cyber-attacks: the variable dummy value method and a fixed dummy value method. The limits of the fixed dummy value method are recognized and sorted out in the variable dummy value method.
This study developed a new COADL-FDIAR algorithm to recognise false data injection attacks in the IoT environment. To accomplish this, the proposed COADL-FDIAR model pre-processes the input data and selects the features with the help of the Chi-square test. At last, the COA is exploited with the SLSTM model in this study. Fig. 1 showcases the overall processes of the proposed COADL-FDIAR approach.
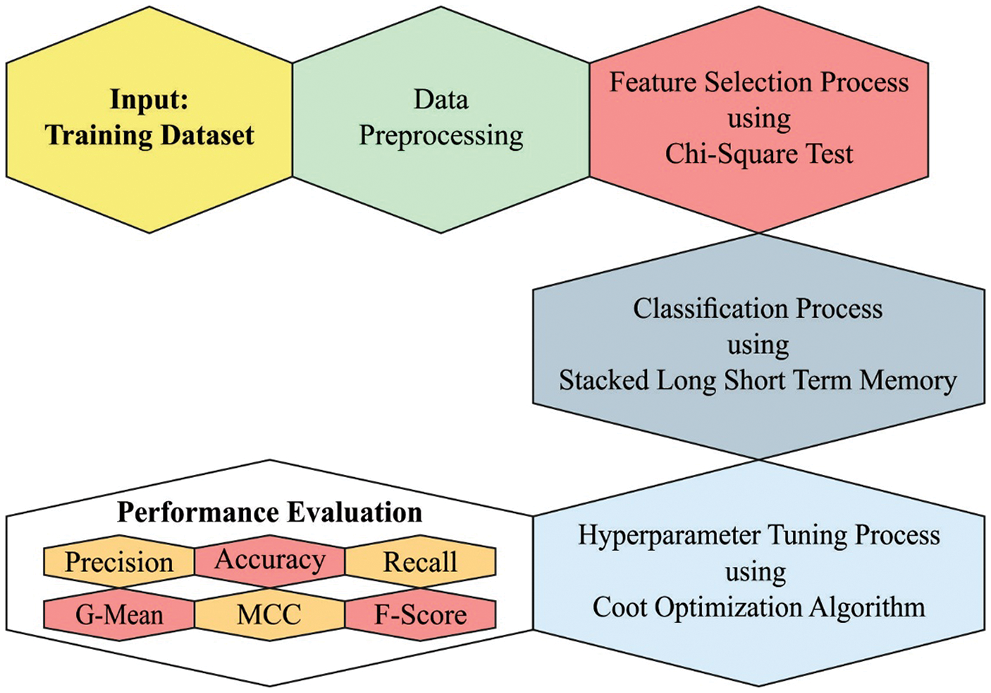
Figure 1: Overall process of the COADL-FDIAR approach
The proposed COADL-FDIAR technique is applied at the initial level to pre-process the input IoT data. Initially, the missing values in the dataset are filled with null values. Then, a type casting set is executed in which the non-integer values are cast with numbers. The symbolic values (like the receiver, transmitter and destination) are mapped with the integers that are scaled to a value between 1 and max. Here, max denotes the quantity of the symbolic features. The hexadecimal values (i.e., values of the WEP initialization vector and integrity check) are mapped into the integers.
3.2 Chi-Square Feature Selection
To reduce the high dimensionality of the features, the Chi-square test is utilized in this study. Chi-square is a numerical test that measures the deviations in the predictable distribution, assuming that the feature event is independent of the class values [17]. The chi-square value is determined for the subsequent metrics such as the false positives (FP), false negatives (fn), true positives (tp), true negatives (TN), probability of the number of positive cases
Here,
Here, r refers to the amount of one categorical variable level, and c signifies the count of levels to the rest of the categorical variables. The test statistic is determined as follows
whereas
3.3 SLTSM Based Classification
This study exploits the SLSTM model to recognize the false data injection attacks. Long Short-Term Memory (LSTM) is a modified Recurrent Neural Network (RNN) architecture that controls the memory of a time-sequence dataset with the addition of memory cells into the hidden state [18]. The data is passed between the cells in the hidden layer through a sequence of programmable gates such as the forget gate, input gate and output gate. The LSTM method maintains the cell state via gate mechanisms that can resolve short- and long-term memory dependence issues. This scenario helps in the prevention of explosions and the gradient vanishing problems. The input gate function monitors the current data in the memory cell; the output gate controls the distribution of the present data all over the network. The forget gate defines whether the data must be removed according to the status of the previous layer. Eqs. (4)–(11) explain the processes to update and implement the LSTM cell state and calculate the output of the LSTM.
In these expressions,
The presented DL-hybrid SLSTM mechanism acts as a prototype for the sequence-to-sequence (seq2seq) paradigm [19]. Fig. 2 depicts the infrastructure of the SLSTM technique. Recently, the Seq2seq model has been widely applied in machine translation and is composed of encoder and decoder entities. When the information is received through the encoder, it compresses the data into a single vector, and the vector is known as the context vector. Then, the decoder makes use of it to generate the output sequence. Either LSTM or RNN is utilized as the encoder to transform the input data into a hidden layer.
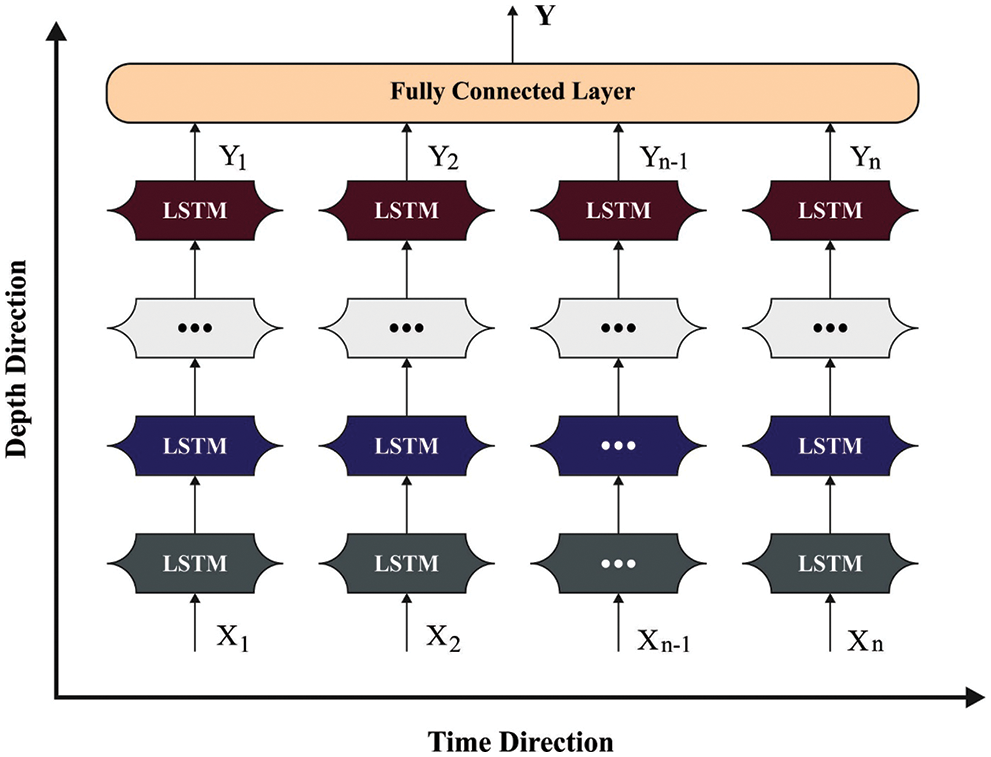
Figure 2: Architecture of the SLSTM approach
Accurately, an encoder
This study applies the decoder and encoder systems of the LSTM seq2seq paradigm are applied. The LSTM layer is stacked on the decoder and encoder systems. By stacking the LSTM, it is possible to enhance the prediction ability of the model to understand the complex representation of the time-sequence datasets in hidden layers by gathering data at different levels. Furthermore, x and
Every encoder LSTM estimates a c context vector, and it is replicated and transferred to every decoder element.
In this study, the COA algorithm productively adjusts the SLTSM model’s hyperparameters. The COA is a novel optimization technique developed based on coot bird behaviour [20]. The COA approach tries to mimic the collective behaviour of the coot birds. They are directed by some coots on the surface of the water. The four distinct behaviours observed amongst the coot birds include chain movement, random movement, adjusting the position based on the group leader and leading the group towards an optimum region. This behaviour must be mathematically modelled. Initially, a random population of the coot is produced. Consider a multi-dimension problem that should be resolved at the D dimension. The population of the N coots is produced by Eq. (16).
Here, the location of the coots in a multi-dimension space is arbitrarily produced. The Upper Bound (UB) and Lower Bound (LB) layers are defined for every dimension. Therefore, the coots are prevented from going above or below the threshold. Also, an initial random population is estimated based on the Fitness Function (FF) given below.
To model the random movement of the coots, an arbitrary location is generated at first based on the following equation.
Here, RN2 represents a random value between 0 and 1. Here, A and B are defined as follows:
Here,
Also, a coot chooses a leader coot and follows it as given below.
Now,
Now, R3 and R4 refers to the random numbers within [0, 1],
The COA approach derives the FF to achieve enhanced classification outcomes. It sets a positive value to denote a superior outcome of the candidate solution. Here, the classification error rate reduction is assumed as the FF as offered below in Eq. (24).
The performance of the proposed COADL-FDIAR model was experimentally validated using a dataset with four classes. The dataset holds a total of 80,000 samples with 20,000 samples under each class as depicted in Table 1. The parameter settings are as follows: learning rate: 0.01, dropout: 0.5, batch size: 5, epoch count: 50 and activation: rectified linear unit (ReLU).
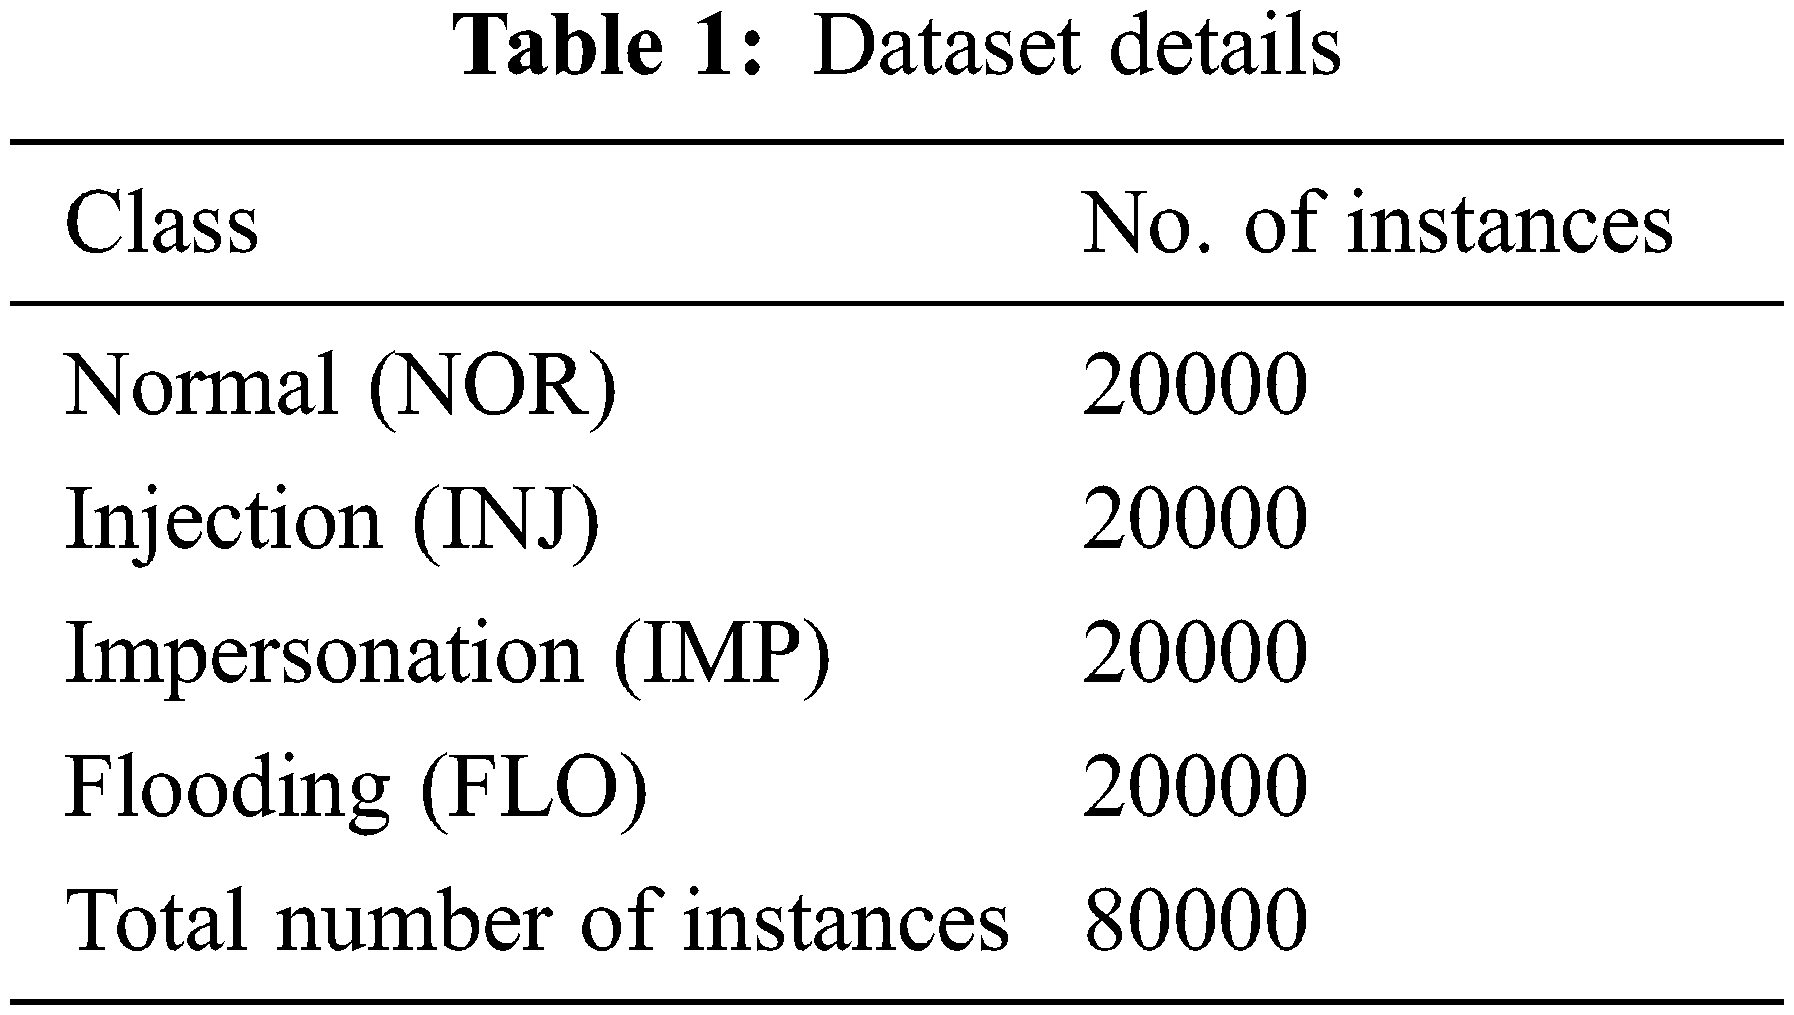
Fig. 3 illustrates the confusion matrices generated by the proposed COADL-FDIAR model. The figure implies that the proposed COADL-FDIAR model proficiently recognized all the classes. For instance, on the entire dataset, the COADL-FDIAR model recognized 19,815, 19,460, 19,245 and 19,571 samples as NOR, INJ, IMP and FLO classes, respectively. Moreover, on 70% of the training (TR) dataset, the COADL-FDIAR technique categorized 13,927, 13,653, 13,313, and 13,755 samples under NOR, INJ, IMP and FLO classes correspondingly. At the same time, on 30% of the testing (TS) data, the proposed COADL-FDIAR model classified 5,888, 5,807, 5,932, and 5,816 samples under NOR, INJ, IMP, and FLO classes correspondingly.
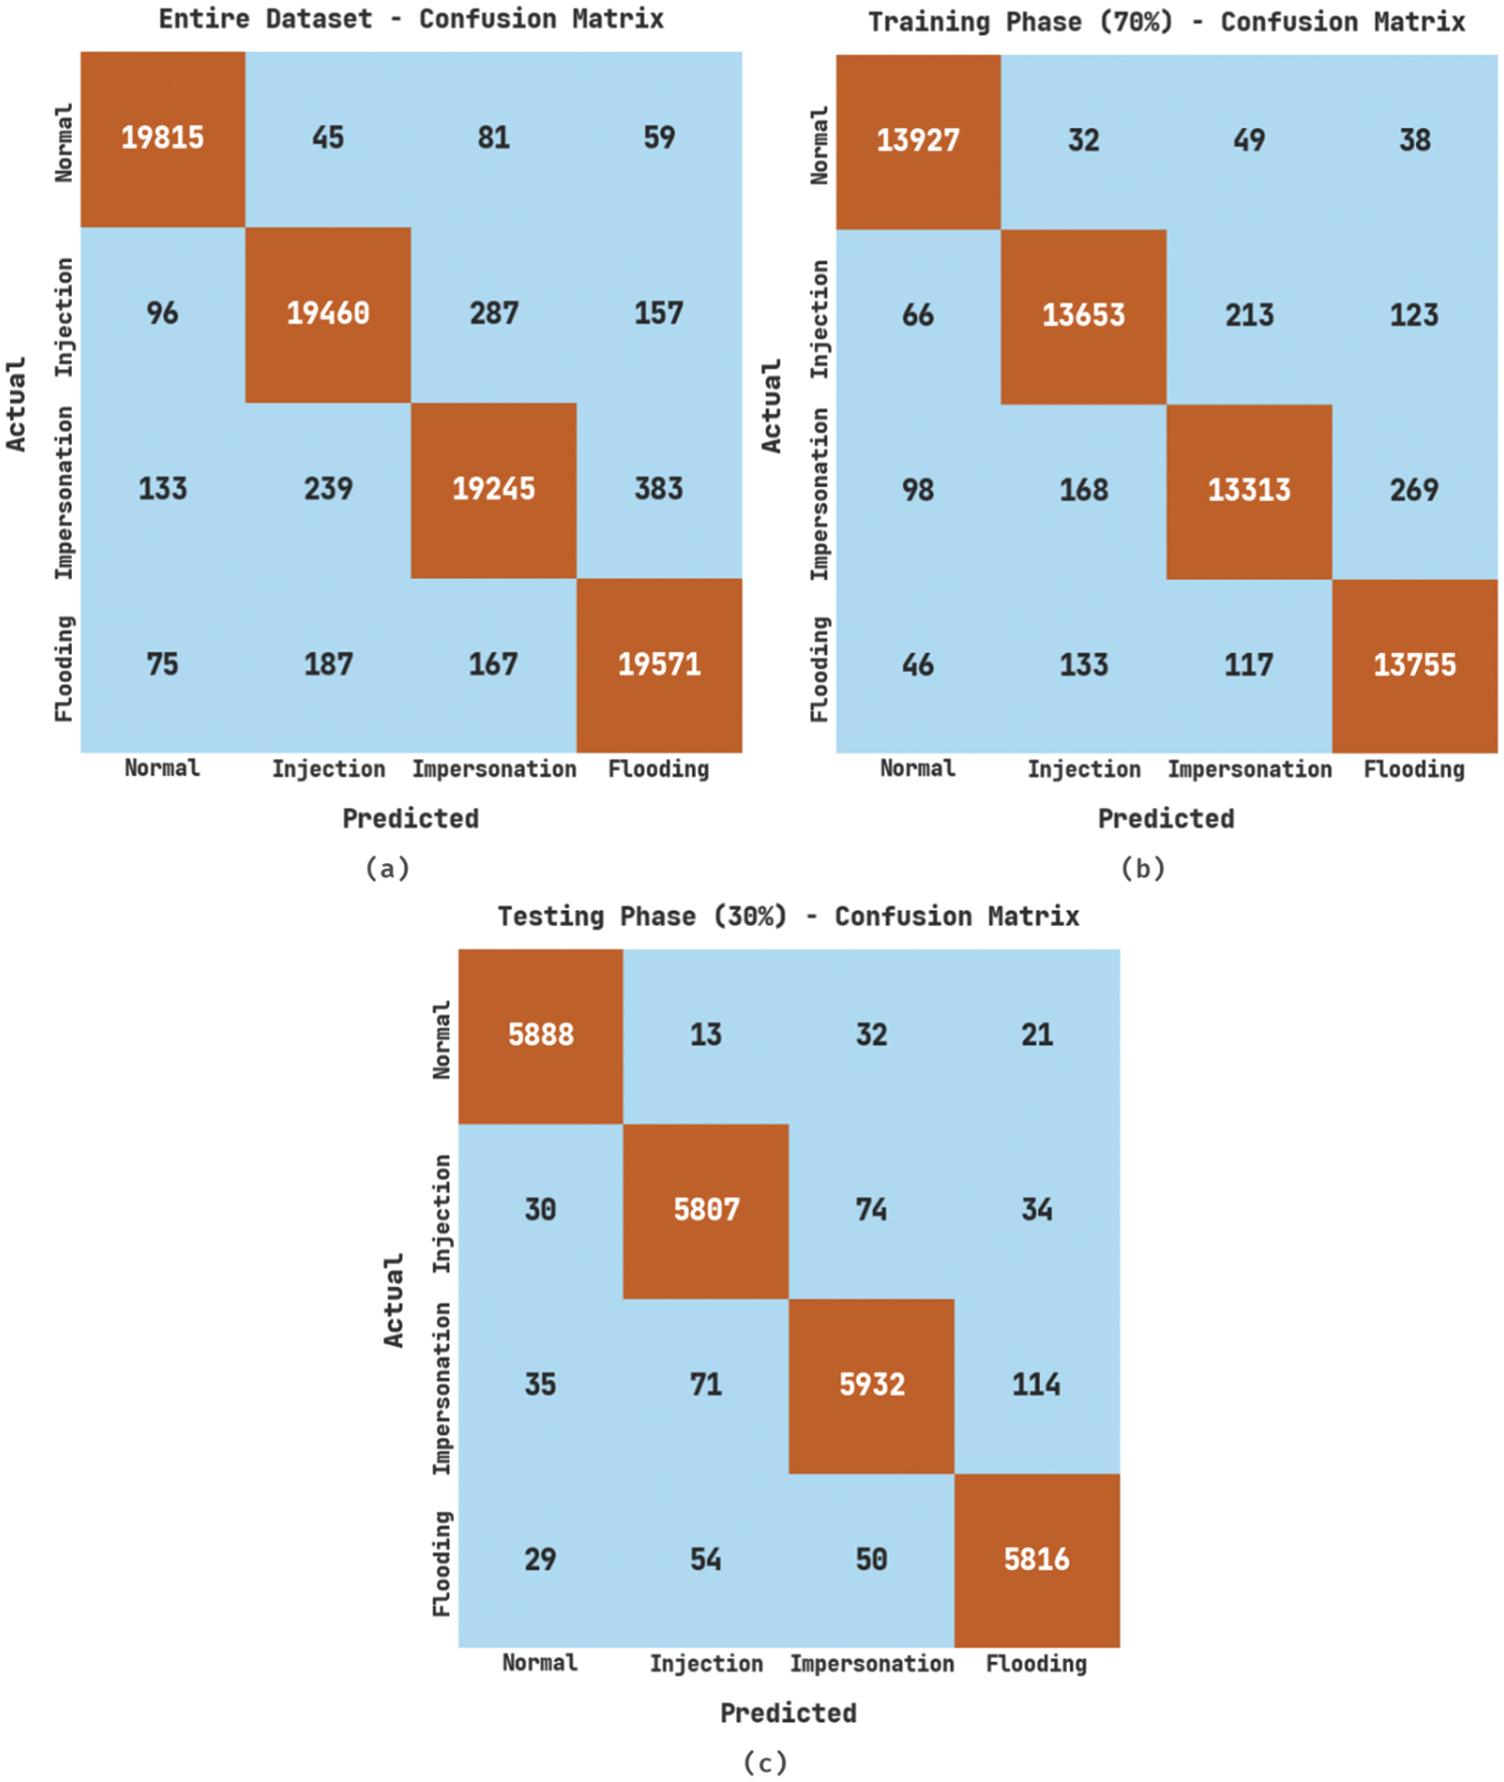
Figure 3: Confusion matrices of the COADL-FDIAR approach (a) Entire dataset, (b) 70% of TR data, and (c) 30% of TS data
The overall analytical results of the proposed COADL-FDIAR model under distinct aspects are shown in Table 2.
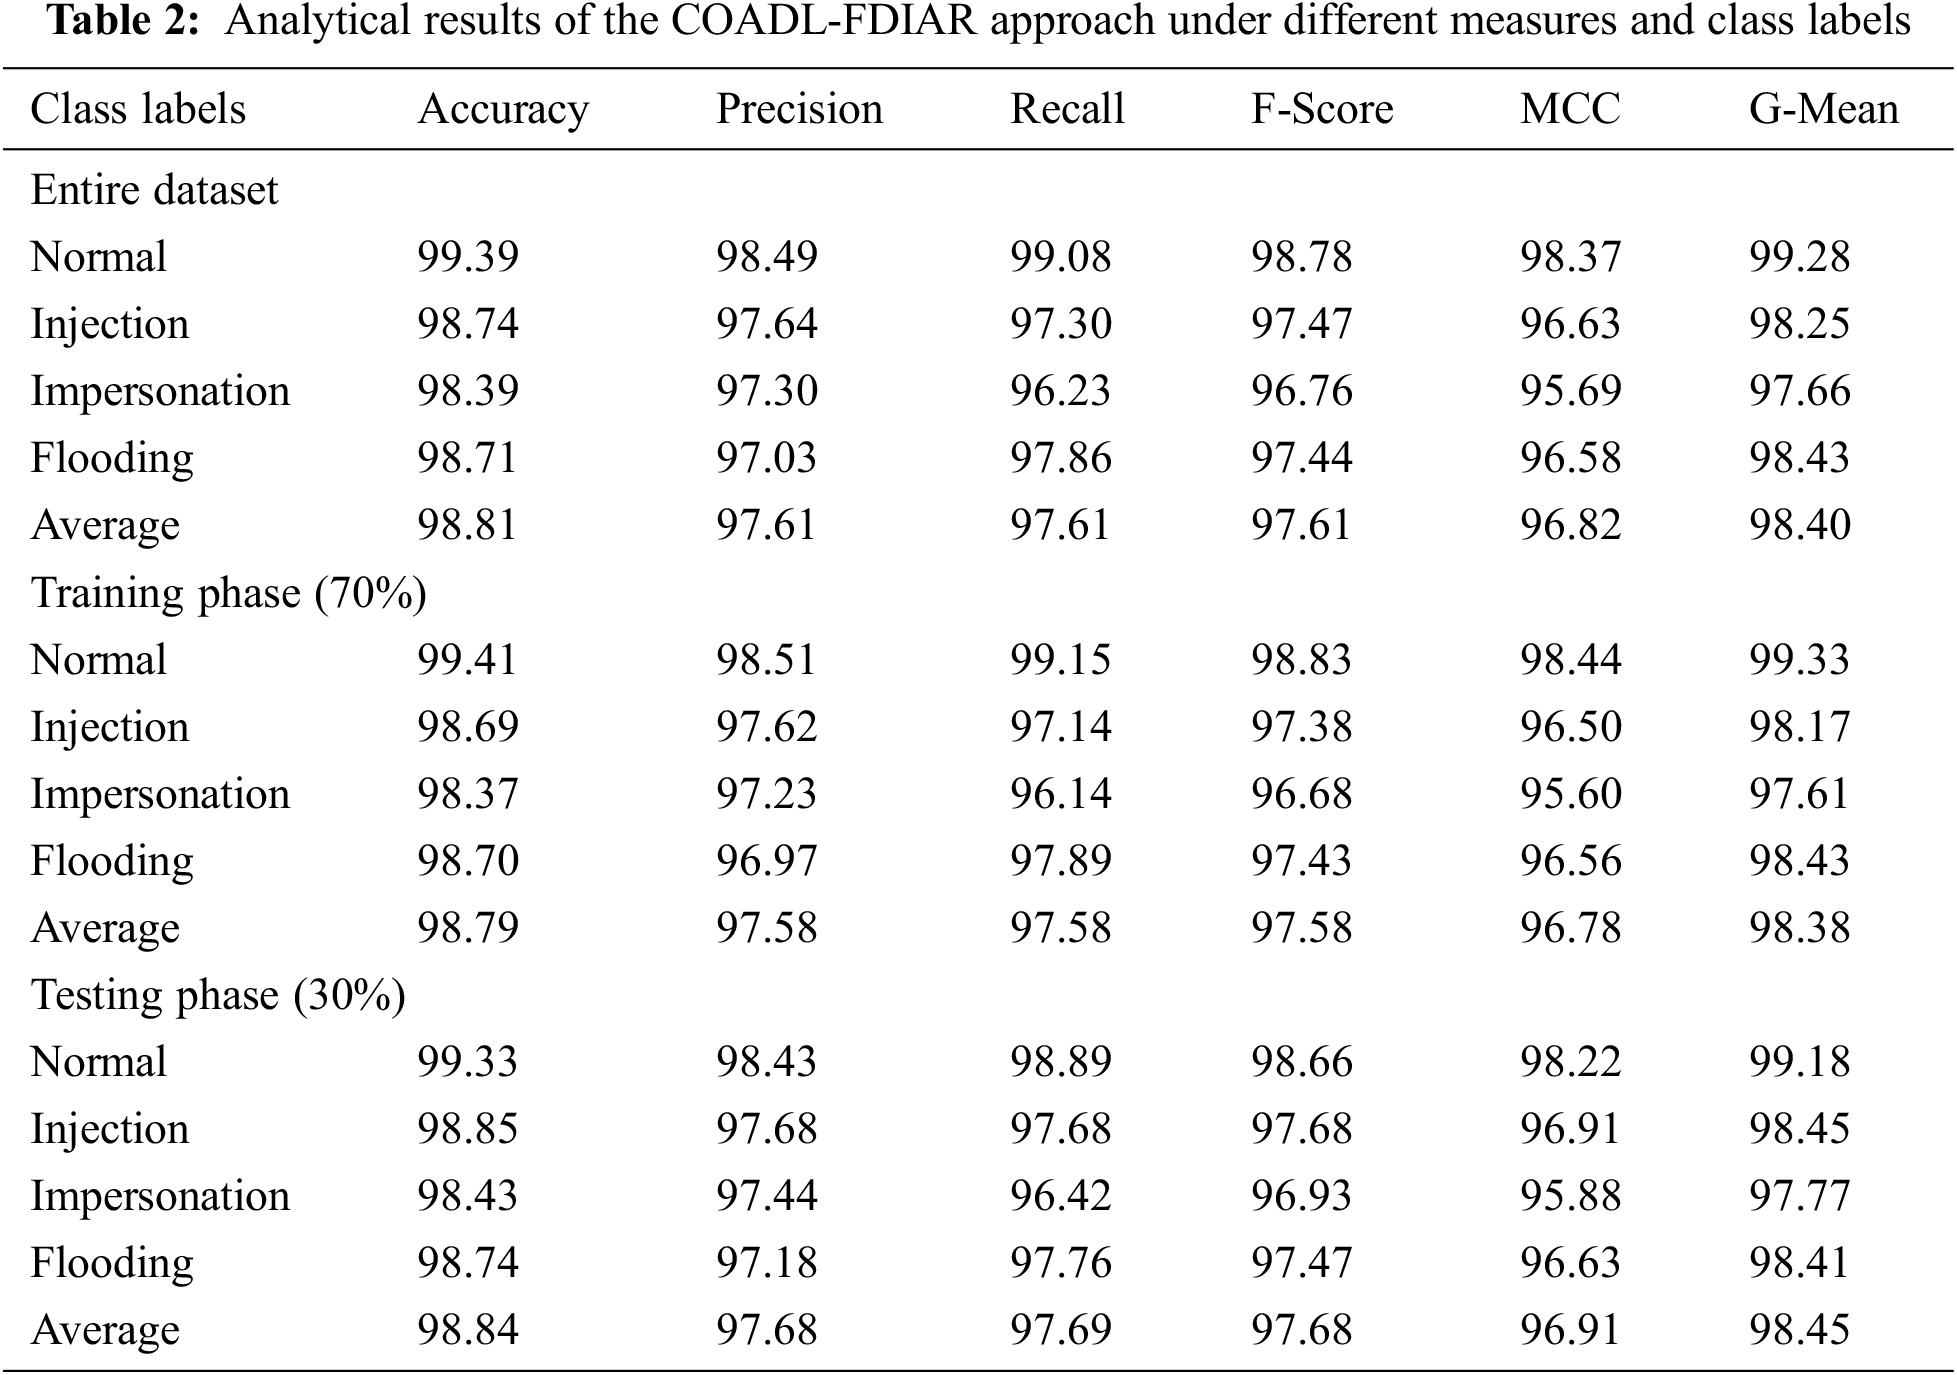
Fig. 4 shows the detailed classification results of the proposed COADL-FDIAR model on the entire dataset. The proposed COADL-FDIAR model identified the samples under normal (NOR) class with an

Figure 4: Analytical results of the COADL-FDIAR approach on entire dataset
Fig. 5 depicts the detailed classification results of the proposed COADL-FDIAR model on 70% of the TR data. The COADL-FDIAR model identified the samples under NOR class with an

Figure 5: Analytical results of the COADL-FDIAR approach on 70% of the TR dataset
Fig. 6 demonstrates the detailed classification results of the proposed COADL-FDIAR model under 30% of the TS data. The proposed COADL-FDIAR model identified the samples under NOR class with an

Figure 6: Analytical results of the COADL-FDIAR approach on 30% of the TS data
Both Training Accuracy (TA) and Validation Accuracy (VA) values attained by the proposed COADL-FDIAR method on the test dataset are shown in Fig. 7. The experimental outcomes imply that the proposed COADL-FDIAR technique achieved the maximal TA and VA values, whereas the VA values were higher than the TA values.

Figure 7: TA and VA analyses results of the COADL-FDIAR approach
Both Training Loss (TL) and Validation Loss (VL) values, acquired by the proposed COADL-FDIAR approach on test dataset, are displayed in Fig. 8. The experimental outcomes denote that the proposed COADL-FDIAR algorithm accomplished the least TL and VL values. In contrast, the VL values were lower than the TL values.

Figure 8: TL and VL analyses results of the COADL-FDIAR approach
A clear precision-recall analysis was conducted on the COADL-FDIAR method using the test dataset. The results are exhibited in Fig. 9. The figure denotes that the proposed COADL-FDIAR method produced enhanced precision-recall values under all the classes.

Figure 9: Precision-recall analysis results of the COADL-FDIAR approach
A brief Receiver Operating Characteristic (ROC) curve analysis was conducted on the proposed COADL-FDIAR technique using the test dataset. The results are shown in Fig. 10. The results denote that the proposed COADL-FDIAR approach established its ability to categorize the test dataset under distinct classes.

Figure 10: ROC analysis results of the COADL-FDIAR approach
Table 3 displays the overall results of the proposed COADL-FDIAR model and other existing models under several measures [21].
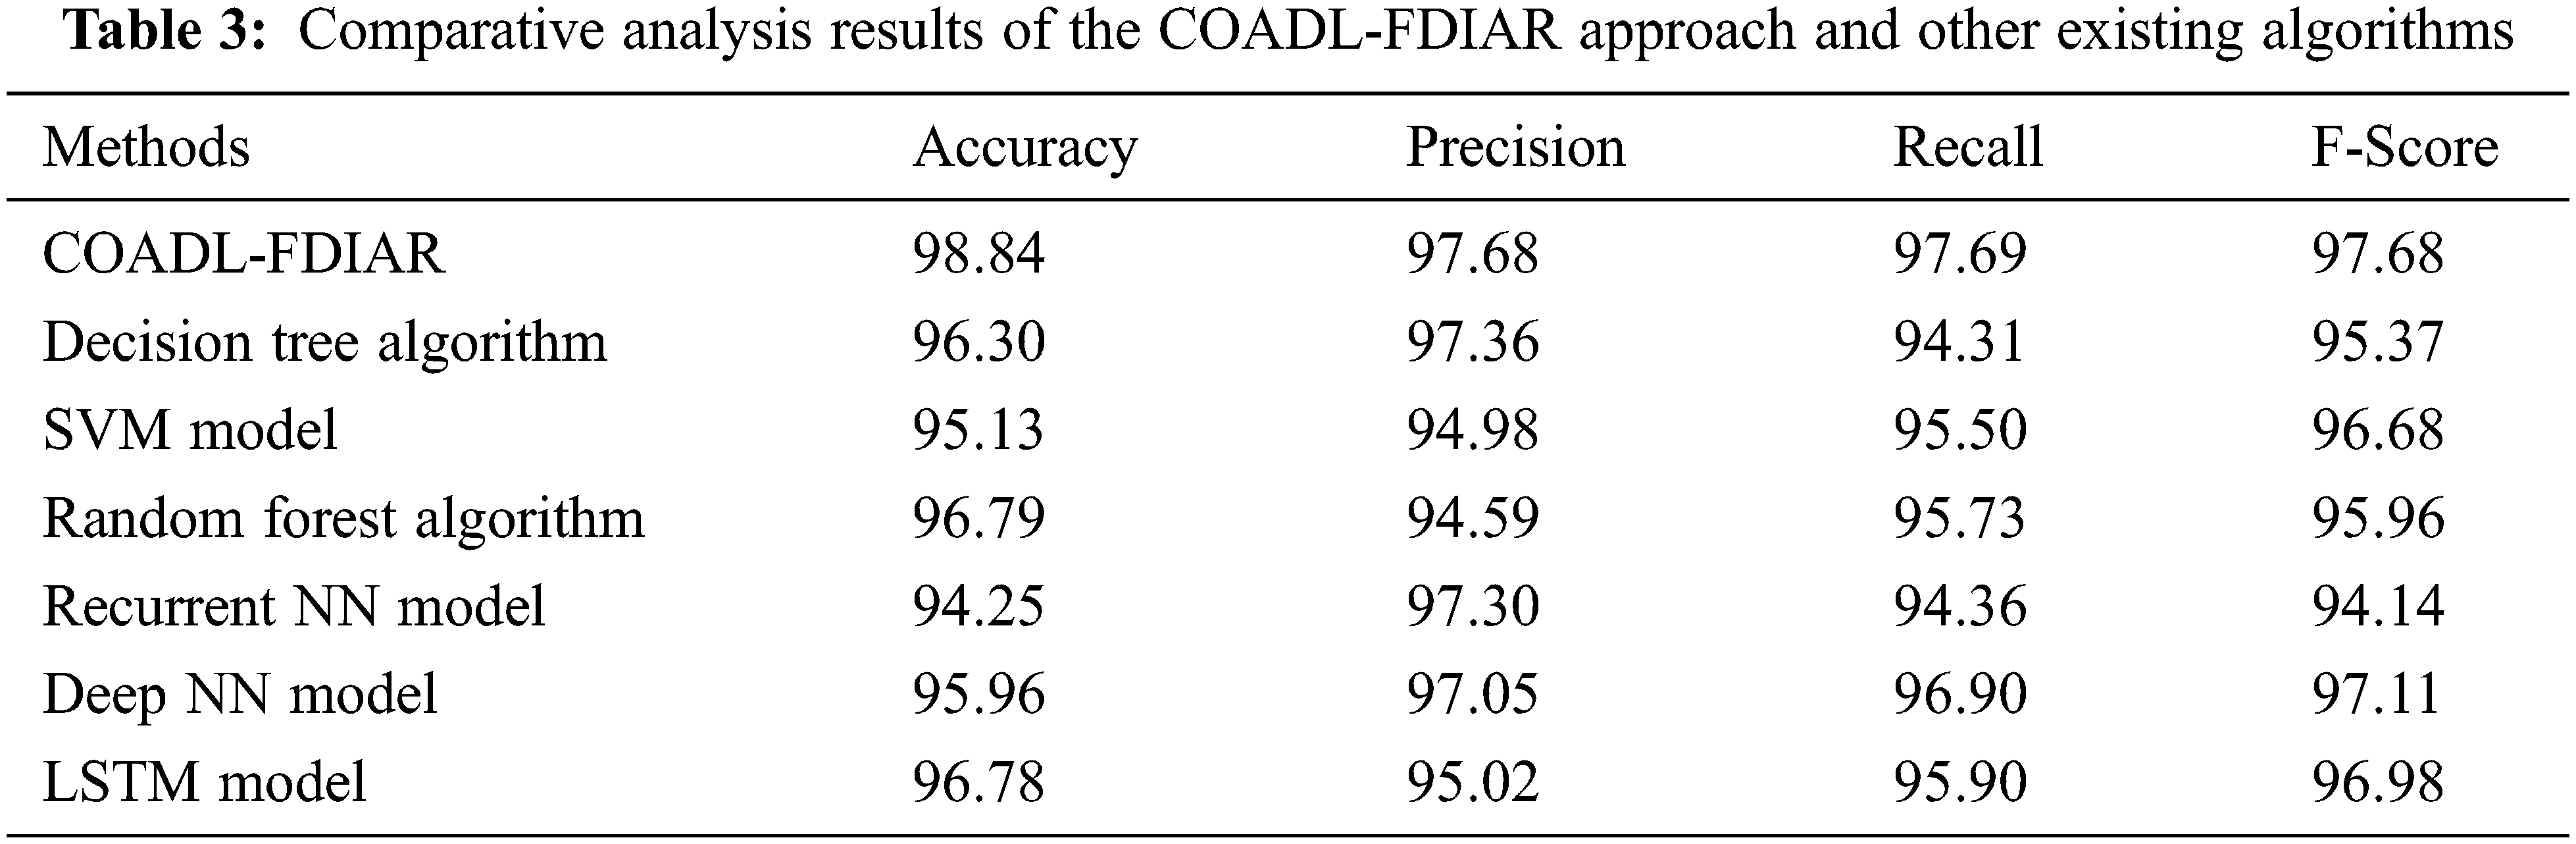
Fig. 11 reports the brief

Figure 11:
Fig. 12 demonstrates the detailed
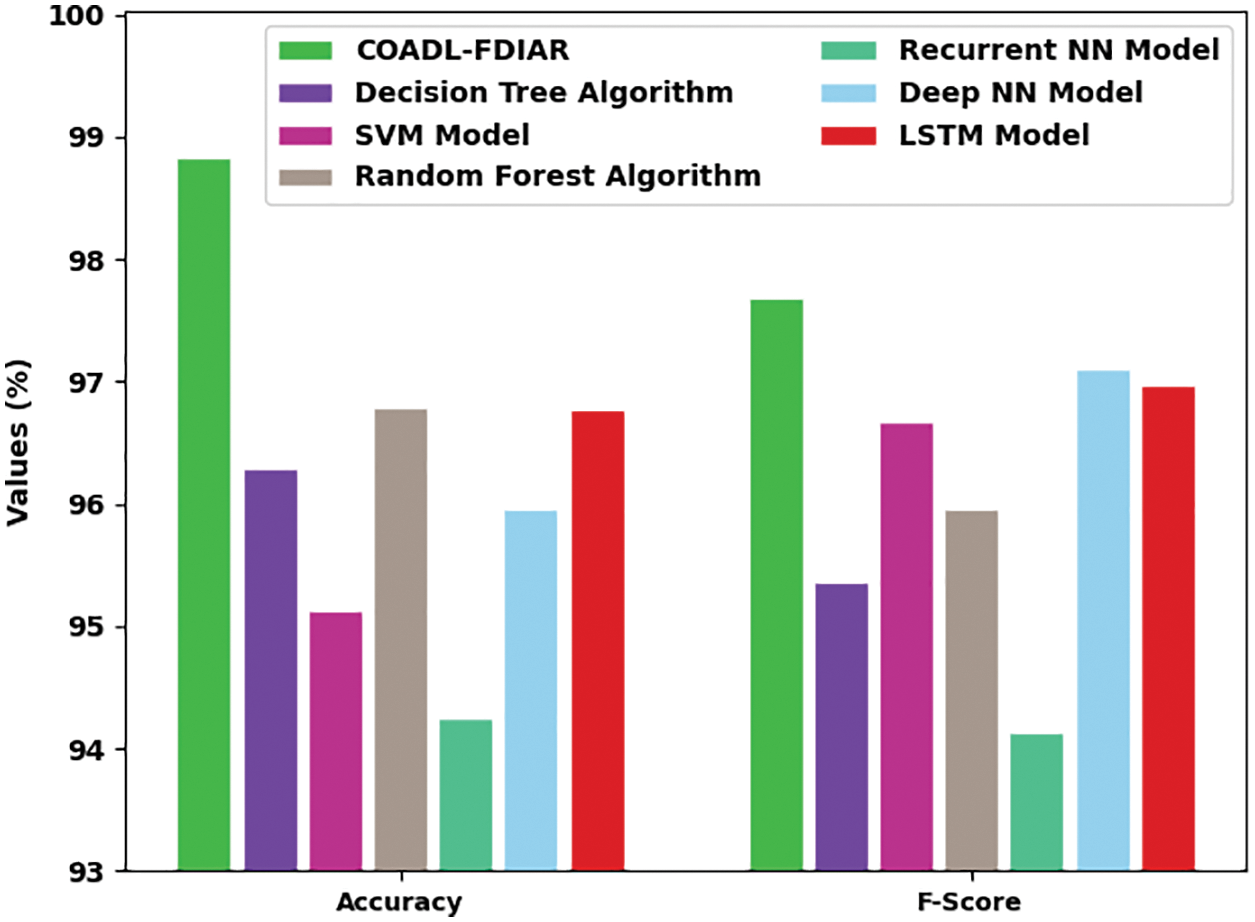
Figure 12:
Moreover, in terms of
In this study, a new COADL-FDIAR algorithm has been developed to recognise false data injection attacks in the IoT environment. To accomplish this, the COADL-FDIAR model initially pre-processes the input data and selects the features using Chi-square test. For recognition and the classification of false data injection attacks, the SLSTM model is exploited in this study. Finally, the COA algorithm effectually adjusts the hyperparameters of the SLTSM model and accomplishes a superior recognition efficiency. The proposed COADL-FDIAR model was experimentally validated using a standard dataset and the outcomes were scrutinized under distinct aspects. The comparative analysis results confirmed the superior performance of the COADL-FDIAR model over other recent approaches with a maximum accuracy of 98.84%. In the future, the projected model can be tested on a large-scale real-time database.
Acknowledgement: The authors would like to thank Universiti Sains Malaysia (USM) and the Ministry of Higher Education Malaysia for providing the research grant, Fundamental Research GrantScheme (FRGS-Grant No: FRGS/1/2020/TK0/USM/02/1) that helped to carry out this research.
Funding Statement: This research was supported by the Universiti Sains Malaysia (USM) and the ministry of Higher Education Malaysia through Fundamental Research GrantScheme (FRGS-Grant No: FRGS/1/2020/TK0/USM/02/1).
Conflicts of Interest: The authors declare that they have no conflicts of interest to report regarding the present study.
References
1. N. Kharlamova, S. Hashemi and C. Traholt, “The cyber security of battery energy storage systems and adoption of data-driven methods,” in 2020 IEEE Third Int. Conf. on Artificial Intelligence and Knowledge Engineering (AIKE), Laguna Hills, CA, USA, pp. 188–192, 2020. [Google Scholar]
2. B. Bostami, M. Ahmed and S. Choudhury, “False data injection attacks in internet of things,” in Performability in Internet of Things, EAI/Springer Innovations in Communication and Computing Book Series (EAISICC), Budapest, Hungary, pp. 47–58, 2018. [Google Scholar]
3. H. T. Reda, A. Anwar, A. N. Mahmood and Z. Tari, “A taxonomy of cyber defence strategies against false data attacks in smart grid,” arXiv preprint arXiv:2103.16085, 2021. https://doi.org/10.48550/arXiv.2103.16085. [Google Scholar]
4. H. T. Reda, A. Anwar and A. Mahmood, “Comprehensive survey and taxonomies of false data injection attacks in smart grids: Attack models, targets, and impacts,” Renewable and Sustainable Energy Reviews, vol. 163, pp. 112423, 2022. [Google Scholar]
5. S. R. Mugunthan and T. Vijayakumar, “Review on IoT based smart grid architecture implementations,” Journal of Electrical Engineering and Automation, vol. 1, no. 1, pp. 12–20, 2019. [Google Scholar]
6. K. N. Qureshi, S. S. Rana, A. Ahmed and G. Jeon, “A novel and secure attacks detection framework for smart cities industrial internet of things,” Sustainable Cities and Society, vol. 61, pp. 102343, 2020. [Google Scholar]
7. Z. Qu, Y. Dong, N. Qu, H. Li, M. Cui et al., “False data injection attack detection in power systems based on cyber-physical attack genes,” Frontiers in Energy Research, vol. 9, pp. 644489, 2021. [Google Scholar]
8. P. A. Giglou and S. N. Ravadanegh, “Defending against false data injection attack on demand response program: A bi-level strategy,” Sustainable Energy, Grids and Networks, vol. 27, pp. 100506, 2021. [Google Scholar]
9. C. Dunn, N. Moustafa and B. Turnbull, “Robustness evaluations of sustainable machine learning models against data poisoning attacks in the internet of things,” Sustainability, vol. 12, no. 16, pp. 6434, 2020. [Google Scholar]
10. M. Briland and F. Bouquet, “A language for modelling false data injection attacks in internet of things,” in 2021 IEEE/ACM 3rd Int. Workshop on Software Engineering Research and Practices for the IoT (SERP4IoT), Madrid, Spain, pp. 1–8, 2021. [Google Scholar]
11. Z. He, J. Khazaei, F. Moazeni and J. D. Freihaut, “Detection of false data injection attacks leading to line congestions using neural networks,” Sustainable Cities and Society, vol. 82, pp. 103861, 2022. [Google Scholar]
12. Y. Hu, P. Zhu, P. Xun, B. Liu, W. Kang et al., “CPMTD: Cyber-physical moving target defense for hardening the security of power system against false data injected attack,” Computers & Security, vol. 111, pp. 102465, 2021. [Google Scholar]
13. M. Dehghani, T. Niknam, M. Ghiasi, P. Siano, H. H. Alhelou et al., “Fourier singular values-based false data injection attack detection in ac smart-grids,” Applied Sciences, vol. 11, no. 12, pp. 5706, 2021. [Google Scholar]
14. V. P. Srinivasan, K. Balasubadra, K. Saravanan, V. S. Arjun and S. Malarkodi, “Multi label deep learning classification approach for false data injection attacks in smart grid,” KSII Transactions on Internet and Information Systems, vol. 15, no. 6, pp. 2168–2187, 2021. [Google Scholar]
15. A. Kumar, N. Saxena, S. Jung and B. J. Choi, “Improving detection of false data injection attacks using machine learning with feature selection and oversampling,” Energies, vol. 15, no. 1, pp. 212, 2021. [Google Scholar]
16. M. A. Shahid, F. Ahmad, F. R. Albogamy, G. Hafeez and Z. Ullah, “Detection and prevention of false data injection attacks in the measurement infrastructure of smart grids,” Sustainability, vol. 14, no. 11, pp. 6407, 2022. [Google Scholar]
17. I. S. Thaseen and C. A. Kumar, “Intrusion detection model using fusion of chi-square feature selection and multi-class SVM,” Journal of King Saud University—Computer and Information Sciences, vol. 29, no. 4, pp. 462–472, 2017. [Google Scholar]
18. A. Guo, A. Jiang, J. Lin and X. Li, “Data mining algorithms for bridge health monitoring: Kohonen clustering and LSTM prediction approaches,” The Journal of Supercomputing, vol. 76, no. 2, pp. 932–947, 2020. [Google Scholar]
19. F. Shahid, A. Zameer and M. J. Iqbal, “Intelligent forecast engine for short-term wind speed prediction based on stacked long short-term memory,” Neural Computing and Applications, vol. 33, no. 20, pp. 13767–13783, 2021. [Google Scholar]
20. A. S. Alqahtani, P. Saravanan, M. Maheswari and S. Alshmrany, “An automatic query expansion based on hybrid CMO-COOT algorithm for optimized information retrieval,” The Journal of Supercomputing, vol. 78, no. 6, pp. 8625–8643, 2022. [Google Scholar]
21. T. Gaber, A. E. Ghamry and A. Hassanien, “Injection attack detection using machine learning for smart IoT applications,” Physical Communication, vol. 52, pp. 101685, 2022. [Google Scholar]
Cite This Article
 Copyright © 2023 The Author(s). Published by Tech Science Press.
This work is licensed under a Creative Commons Attribution 4.0 International License , which permits unrestricted use, distribution, and reproduction in any medium, provided the original work is properly cited.
 Downloads
 Citation Tools