
 Submit a Paper
 Propose a Special lssue
 Open Access
ARTICLE

Short-Term Mosques Load Forecast Using Machine Learning and Meteorological Data
Department of Electrical Engineering, College of Engineering, Qassim University, Buraidah, Saudi Arabia
* Corresponding Author: Musaed Alrashidi. Email:
Computer Systems Science and Engineering 2023, 46(1), 371-387. https://doi.org/10.32604/csse.2023.034739
Received 26 July 2022; Accepted 24 October 2022; Issue published 20 January 2023
 View Full Text
 Download PDF
Abstract
The tendency toward achieving more sustainable and green buildings turned several passive buildings into more dynamic ones. Mosques are the type of buildings that have a unique energy usage pattern. Nevertheless, these types of buildings have minimal consideration in the ongoing energy efficiency applications. This is due to the unpredictability in the electrical consumption of the mosques affecting the stability of the distribution networks. Therefore, this study addresses this issue by developing a framework for a short-term electricity load forecast for a mosque load located in Riyadh, Saudi Arabia. In this study, and by harvesting the load consumption of the mosque and meteorological datasets, the performance of four forecasting algorithms is investigated, namely Artificial Neural Network and Support Vector Regression (SVR) based on three kernel functions: Radial Basis (RB), Polynomial, and Linear. In addition, this research work examines the impact of 13 different combinations of input attributes since selecting the optimal features has a major influence on yielding precise forecasting outcomes. For the mosque load, the (SVR-RB) with eleven features appeared to be the best forecasting model with the lowest forecasting errors metrics giving RMSE, nRMSE, MAE, and nMAE values of 4.207 kW, 2.522%, 2.938 kW, and 1.761%, respectivelyKeywords
The development in data sources, such as online technology, social media platforms, and data sensors, has caused the volume of data to grow at a rapid rate. This enormous volume of data is referred to as Big Data (BD) [1]. By applying learning algorithms and data processing approaches, BD needs to be managed properly. However, because of the complexity of the data, it can be challenging to determine the best BD analysis tool for a certain need. Automated Machine Learning has been insufficient to handle such BD due to the worldwide rise in data. However, several applications have taken advantage of contemporary Machine Learning (ML) techniques to harvest the BD. ML algorithms have been exploited by different felid, including healthcare, transportation [2], e-business [3], banking supervision [4], financial services [5], and electrical power systems [6].
ML algorithms have been applied to a variety of tasks in electrical power systems, such as forecasting load, market prices, photovoltaic power, and fault detection [7]. Among the above-mentioned tasks, the electrical load forecast is of very high importance for distribution system operators as a variety of services can be acquired. They can anticipate the future values of electrical load. Hence, the balance between supply and demand can be met with a minimum loss of energy. However, the key factor affecting the load forecast is that there are various electrical load types, each of which has a unique load profile. In other words, the load profile of a commercial building is different from a residential load profile. Hence, predicting the load is extremely important and valuable. In this study, forecasting the electrical load is of focus while the mosques are the type of buildings considered here.
Mosques are a type of Islamic building that is dedicated to worship. In Islamic law, there are five times for prayer. The first prayer is called Fajr prayer which is at dawn. The second and the third prayers are the two prayers in the daytime and are called Dhuhr and Asr and are performed at noon and afternoon, respectively. The Maghrib prayer is done at sunset while at night a prayer called Isha is performed. Mosques come in a wide range of sizes, from modest structures that hold up to 100 worshippers to enormous structures that hold tens of thousands. There are reported to be 3.5 million mosques in the world [8,9]. In Saudi Arabia, for instance, the number of mosques is increased by 78% associated with the growth in the population, increasing from, 55,266 mosques in 2008 to greater than 98,356 in 2017 [10,11].
For electrical energy consumption, up to 76 percent of all the electricity used in Saudi Arabia in 2018 was consumed by buildings, including mosques [12]. In mosques, the major electrical consumption is by the heating and cooling systems which are provided from either unit systems or centralized air conditioning systems while the lighting and fans are placed on the ceiling. The size and occupation behavior of these buildings leads to create five operating times making the electrical load profile for mosques have five peaks daily. This distinguishes the shape of the electrical load of the mosque from other forms of electrical loads and more challenges to predict. Therefore, it is crucial to forecast mosques load buildings to supply these kinds of structures with renewable energy while also capturing the stochastic behavior of the load. Therefore, the primary objective of this study is to forecast a mosque load located in Riyadh city, Saudi Arabia.
Accurate electrical load forecasting of any type of building needs three essential requirements, namely deep data processing, an optimal input features selection, and a precise perdition algorithm. Firstly, deep data processing organizes the data that are usually obtained from different data sources. The processing includes removing any missing data and uniquely presenting the data. Secondly and after constructing the data and creating the features that are related to the forecasting objective, it comes the obstacle of determining the most relevant input features to the forecasting outcome. This step reduces the computational time for building the forecasting model. In the literature, meteorological data, such as temperature and humidity, have a major influence on the electrical load profile [13]. Moreover, the lag observations of electrical load can be beneficial in predicting future values due to the periodic behavior of the load [14]. Thirdly, identifying the best machine learning algorithm is very challenging on which the overall prediction process depends. The machine learning algorithm is responsible to provide accurate load forecasting results, which is of very high importance. These three requirements are followed and constructed in this research work.
Load forecast is allocated into three different types based on the forecasting horizon: short-term load forecasting, which refers to forecasts up to one week in the future; medium-term load forecasting, which covers the period from one week to one year; and long-term load forecasting, which forecasts load profiles one year and beyond. Another approach to classifying load forecasts is by the type of load to be predicted. Several forecasting models have been built in the literature to predict different types of buildings, such as hospitals, industrial, residential, and university campuses. In addition, it is shown that the type of weather conditions has a major influence on the load forecast [15]. Therefore, selecting the most accurate weather variables is essential to generate an accurate forecasting model.
In terms of forecasting methodologies, load forecasting can make use of physical, statistical, and deep learning prediction models. Statistical techniques make use of previous data to estimate future behavior without knowledge of the current state of the system, while physical approaches are mathematical models that use weather forecast data obtained via numerical weather prediction [16]. The statistical approaches are allocated into time series models and machine learning methods. The study in [15], for instance, develops a short-term electrical load to predict the load of the Memorial University campus in Canada using 19 regression algorithms. These algorithms belong to five main algorithms, namely, Linear Regression (LR), regression trees, Support Vector Regression (SVR), Gaussian Process Regression (GPR), and the ensemble of trees. The electrical load datasets are obtained hourly from the university’s energy meter while the weather datasets are collected from the Newfoundland and Government of Canada. For weather data, the dry bulb temperature, humidity, Percipition, wind chill, wind direction, wind speed, and visibility, are used. The study results reveal that the best algorithm in terms of prediction is the GPR algorithm with a Root Mean Square Error (RMSE) value of 301.76 kW and correlation value, R2, of 0.97. However, this study lack the consideration of the optimal set of features.
In [17], SVR, Artificial Neural Networks (ANN), and GPR are used to predict the short-term electrical load for great Britain power system for 30 min and 24 h ahead. The
In [19], the N-BEATS neural network algorithm is applied to predict medium-term electrical load. This model is then compared with a hybrid model combining the Nadaraya–Watson estimator for pattern forecasting and ETS (N-WE + ETS). The data considered in this study is monthly electricity demand of 35 European countries. The study concludes that the N-BEATS neural network algorithm is superior to the other algorithms in the literature with a
Deep learning has experienced recent growth due to the quick development of information technology in hardware and software. Models concerning load forecasts have been developed using deep learning algorithms. In [21], for example, the researchers used the Long Short-Term Memory Recurrent Neural Network (LSTM-RNN), Shallow-ANN, SVR, and LR algorithm to predict the short-term electrical load. The electrical load is predicted for 30 min and 24 h ahead for two commercial buildings in Virginia. The study includes data for 4 different months of the year 2019, including January, April, July, and October, while the prediction is implemented for one week of each month. After comparing the algorithms, the study finds that the LSTM-RNN algorithm provides the best prediction compared to other algorithms used, where the MAPE of 4.9% for 30 min ahead electrical load forecast, while MAPE is 11.6% for the 24 h prediction horizon. In addition, the study in [22] investigates the performance of nine deep learning algorithms in predicting the electrical load of five commercial buildings of different types located in different countries. Results reveal that deep learning algorithms exhibited a 20%–45% improvement in load forecasting as a comparison to the conventional models used in the literature. However, the main drawback of using deep learning techniques is the requirement for a massive volume of data to train the forecasting model.
1.3 Motivation and Contributions
From the above discussion, several forecasting techniques have been showing a good forecasting performance. ML algorithms have demonstrated their efficacy in achieving a variety of forecasting goals due to their ability to handle nonlinearity in predicting problems. The statistical approaches benefit from the ability to handle large amounts of data [23]. On the other hand, the SVR performs better in forecasting with small data samples [24], while ANN may carry out any non-linear mapping [25]. This makes using SVR and ANN advantageous. Nevertheless, the SVR and ANN performance is sensitive to specific parameters. In addition, different forecasting models are developed for a variety of buildings. In the literature, there is a dearth of mosque-specific forecasting models. Therefore, the main objective of this study is to provide a framework to build a short-term (24 h in 1-h intervals) mosque load forecast based on a data-driven model using machine learning algorithms. A mosque building located in Riyadh, Saudi Arabia, is utilized to investigate the effectiveness of the proposed model. Hence, the main contributions of this study are as follows:
1. To develop a short-term data-driven forecasting model for a mosque load located in Riyadh, Saudi Arabia. The performance of SVR and ANN is compared in this study to exploit the underlying patterns in big data and to forecast future values of the mosque load. For SVR, three Kernel functions are investigated, namely Radial Basis (RB), Polynomial (Poly), and Linear (linear).
2. To reduce the computational time and complexity that may be present in the input variables, this study examines the impact of historical load and meteorological data on the mosque load forecast by creating different independent combinations of input features. Hence, the appropriate variables that produce the best results for mosque load forecasting can be acquired. These variables include time, weather, and historical information on mosque load.
3. To create a framework for mosque load forecasting that would be useful for other researchers. Hence, despite the goal of this research work being to predict the mosque load in Riyadh, Saudi Arabia, the proposed approach can be generalized to find the most effective forecasting models of any mosque in any location.
The rest of the paper is organized as follows: Section 2 contains a details discerption of the study framework along with the main data preprocessing techniques used to prepare the data. The mosque load and meteorological data used in this study are presented in Section 3. Section 4 contains the features used in this study and the correlation between each variable. The main results are presented and discussed in Section 5 while the main conclusions of this study are summarized in Section 6.
The methodologies used in this paper are thoroughly detailed in this section. The problem description and the framework of the proposed forecasting model are initially explained. After that, the data preprocessing techniques are discussed along with the fundamental of ANN and SVR and the prediction models’ sensitivity measurements.
The main objective of this study is by presenting a framework for mosque load forecast based on data-driven models. The proposed forecasting model evaluates the performance of SVR and ANN in capturing the hidden patterns in the meteorological datasets. The proposed model is shown to be accurate, reliable, simple to implement, and robust to the outliers.
To improve the forecasting precision, 52 prediction models are developed for short-term load forecasts of a mosque load located in Riyadh, Saudi Arabia. The forecasting models are as follows:
• SVR based on RB function with 13 feature sets (Fi)-(SVR-RB-Fi)
• SVR based on Poly function with 13 feature sets (SVR-Poly-Fi).
• SVR based on Linear function with 13 feature sets (SVR-Linear-Fi).
• ANN with 13 feature sets (ANN-Fi).
Where Fi is the feature set and i is the number of variables in each set, see Sections 3 and 4.
They are four forecasting methods in which their performance is evaluated with 13 different sets of features. The overall framework of this study to forecast the mosque load is presented in Fig. 1. In addition, Fig. 2 depicts the data preprocessing procedure followed in this research work. The main framework steps are as follows:

Figure 1: The flowchart of the study framework

Figure 2: Data processing procedure
Step 1: The data are gathered and sorted. The datasets comprise both the meteorological datasets and the mosque load.
Step 2: The data are prepared using data preparation techniques. These processes involve data gathering, cleansing, monitoring, and standardization. The details of the data pre-processing methods are covered in Subsection 2.3.
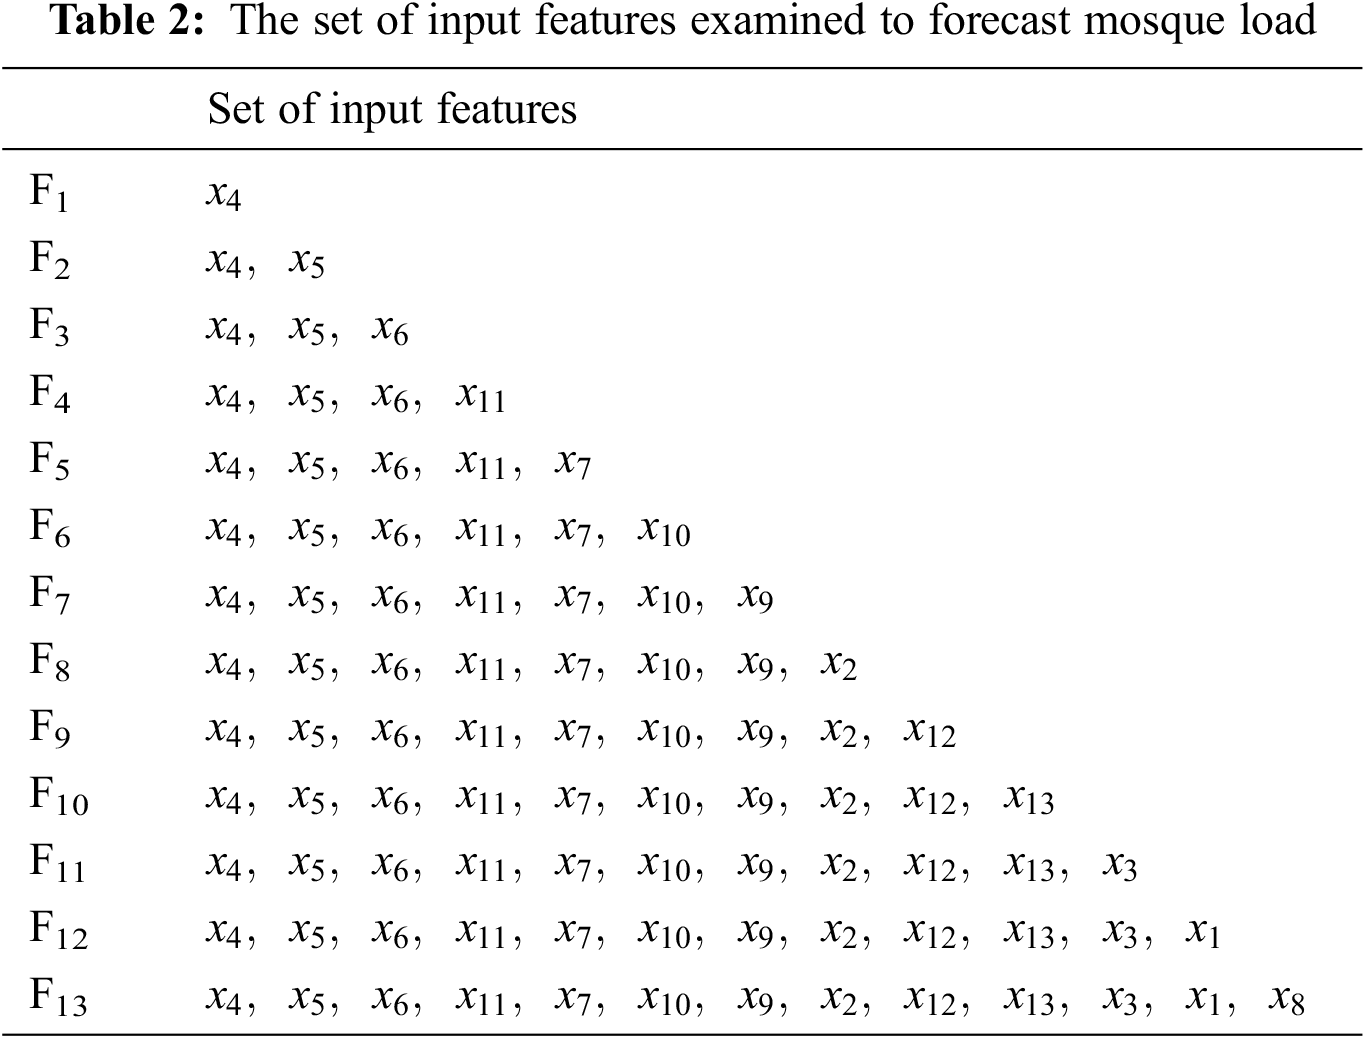
Step 3: Create 13 sets of features based on the Pearson Correlation Coefficient values using various sets of features. The 13 sets of features employed in this investigation are listed in Table 2.
Step 4: The data are split into two sets, one for training and the other for testing. The test dataset is used to evaluate the predictive model accuracy, while the training data are used to train the machine learning algorithms.
Step 5: Using the developed set of feature schemes, SVR and ANN are used to create forecasting models for each forecasting aim. The same set of data is presented to all training models.
Step 6: The best forecasting model is chosen after each prediction model has been evaluated using the test dataset from Step 4. The uncertainty of the developed forecasting models is validated using—RMSE, normalized RMSE (nRMSE), Mean Absolute Error (MAE), and normalized MAE (nMAE).
Detail description of each of the forecasting steps is explained in the following subsections.
The forecast of the electrical demand of a mosque in the city of Riyadh is of focus in this study. The inputs are a set of features determined based on Pearson Coloration. In this study, the ANN and SVR algorithms are applied. For SVR, three kernel functions are examined, namely RB, Poly, and Linear. In addition, six main steps are required to prepare the data from which the desired knowledge will be obtained. These steps are: loading the data, preprocessing the data, deriving the input features, building the forecasting models, identifying the best forecasting model, and integrating the developed model into the management system. These steps must be conducted sequentially and in order.
In this step, the data are collected and organized. In this study, the data are gathered from two different sources, namely King Abdullah City for Renewable Atomic Energy and the Saudi Electricity Company. Each of the data has a format which makes the process of organizing them somewhat challenging. To accomplish this step, the data are required to be preprocessed as explained in Step Two.
This step is crucial in the whole forecasting process as the data are visualized and any flaw in the data needs to be detected. This step usually takes more time as we are dealing directly with the data and going deep with each attribute. In this step, seven main stages are required to be conducted. Initially and after loading the data, the data are required to be extracted. Secondly, the data transformation step is essential to make the data organized and in a consistent fashion as the format of the data in hand comes in different formats. Thirdly, the data are integrated by merging them into one Excel sheet based on the timestamp “YYYY-MM-DD-HH”. Fourthly, the data are then analyzed. One advantage of this stage is to understand the data more. Fifthly, the data are cleaned by checking any missing data with which we need to deal either by filling or deleting them from the data file. Sixthly, the data are divided into two subsets, namely the training dataset, which represents 80% of the data, and the testing dataset, which accounts for the remaining 20%. Finally, these subsets are then normalized to make the data have similar numerical scales and avoid any complexity during the training phase.
The most crucial aspect of this research is the process called “derive features”. This step is utilized to boost model performance for high-dimensional data sets, improve model interpretability, and avoid overfitting. To measure the relationship between the input features and the mosque load, the Person Correlation Coefficient is utilized. This is explained in Section 4.
2.3.4 Building the Forecasting Models
In this research, the ANN algorithm and SVR algorithm based on three kernels RB, Poly, and Linear is examined to predict the electrical load of the mosque. ANN and SVR used in this study are introduced in the following sections:
– Artificial Neural Network
The ANN is software that imitates the biological neuron of the human brain, and it was developed by Warren McCulloch and Walter Pitts to learn to identify trends in sets of data [26]. Multiple interconnected processing components form an ANN, and these components can alter their dynamic states according to outside inputs.
To build the ANN models,
where m and n are the number of nodes at the input and hidden layers, respectively. The logistic function in this study, f, is a sigmoid transfer function.
– Support Vector Regression
The support vector machine method was first presented for classification purposes, and it was then extended to regression problems employing a different loss function [27]. The fundamental idea behind the SVR is to transfer the original data x nonlinearly into a higher dimensional space. Therefore, having training data with N observations, such that
where
where parameter C is a pre-determined constant while
In this study, the SVR algorithm is applied based on three kernels (RB, Poly, and Linear) to anticipate the electrical load of the mosque. For each kernel, 13 different models are investigated. The
2.3.5 Identify the Best Forecasting Model
To evaluate the performance of the considered forecasting models, four statistical indicators are utilized to compare and assess the algorithms and models employed in this study, namely, RMSE, nRMSE, MAE, and nMAE. The following are expressions of these statistical indicators [28]:
where n is the number of the data samples in the testing data.
2.3.6 Integrate the Forecasting Model into the Management System
The developed forecasting model is required to be implemented in real-world applications. The building management operators can benefit from such a model to operate the mosque effectively and facilitate the integration of rooftop photovoltaic systems and battery energy systems [16].
The electrical load of buildings, including the mosque, is related to several meteorological variables. In this study, the impact of 13 different variables is investigated. These variables are time, meteorological, and historical observation of mosque load. Table 1 lists all the input features considered in this study. The data of the mosque load and the meteorological data are collected hourly from January 2016 to December 2016 and are provided by the Saudi Electricity Company and King Abdullah City for Renewable Atomic Energy, respectively. Fig. 3 depicts the variation in mosque load and temperature for one week from August 15, 2016, to August 21, 2016, while Fig. 4 shows the geographic location of Riyadh city.
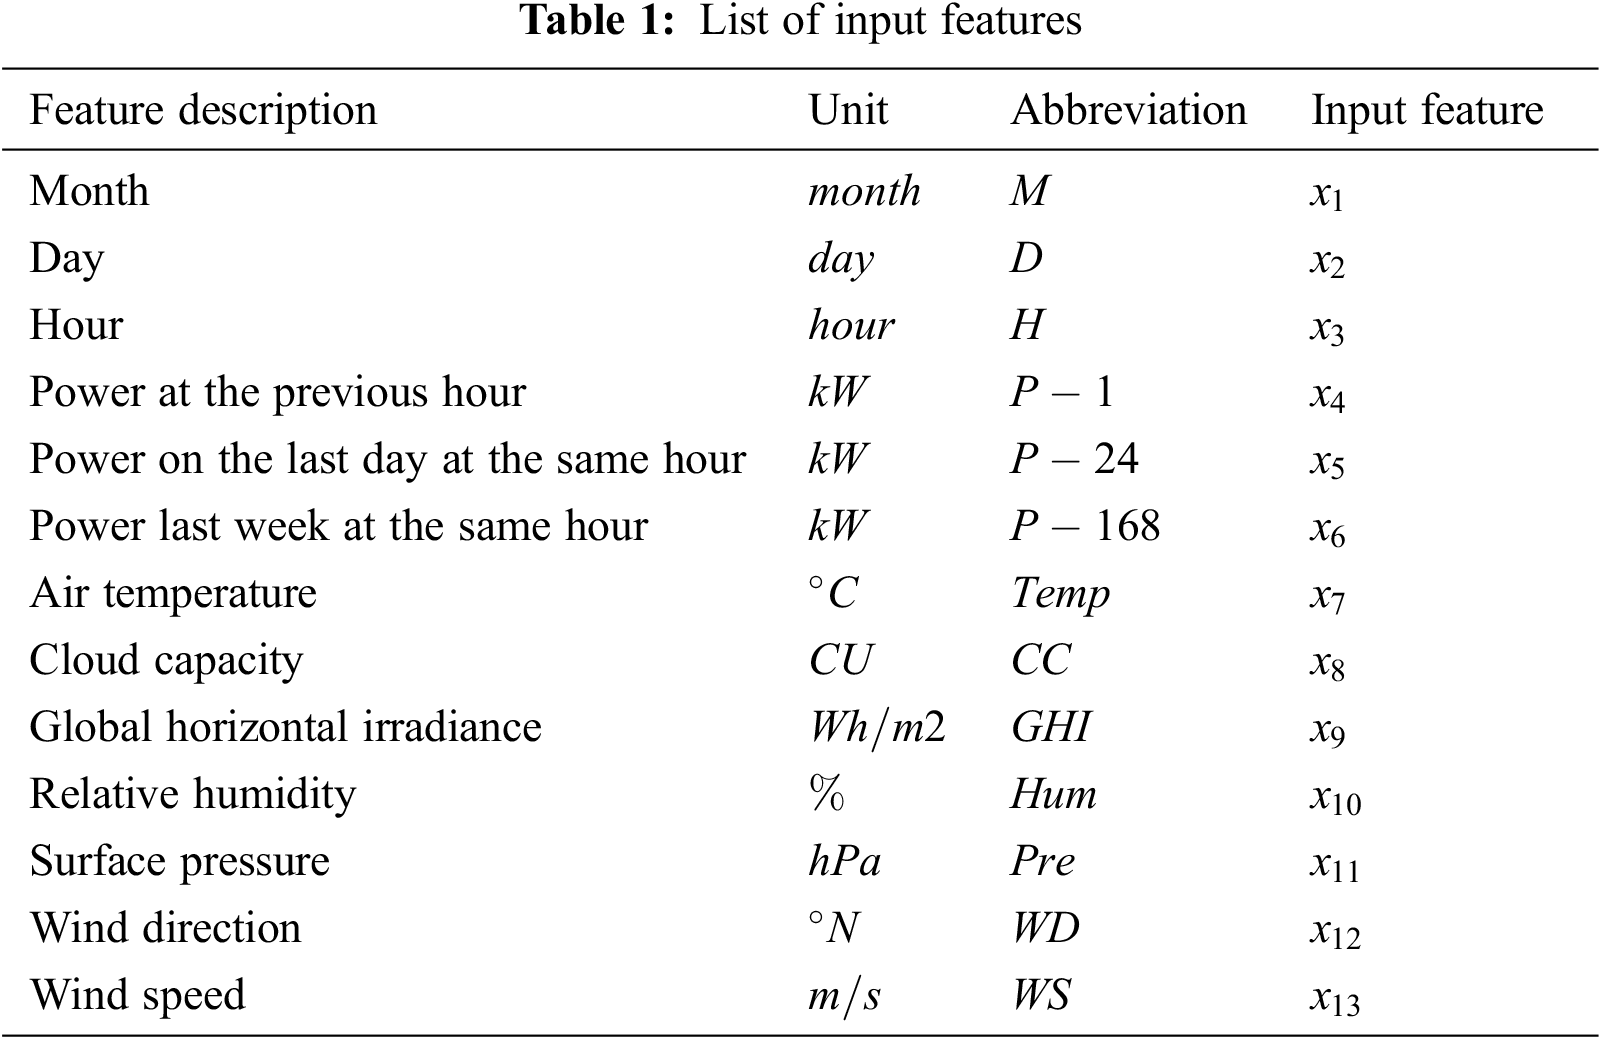

Figure 3: Sample of data that shows the variation in (Left) mosque load (Right) temperature at the study site
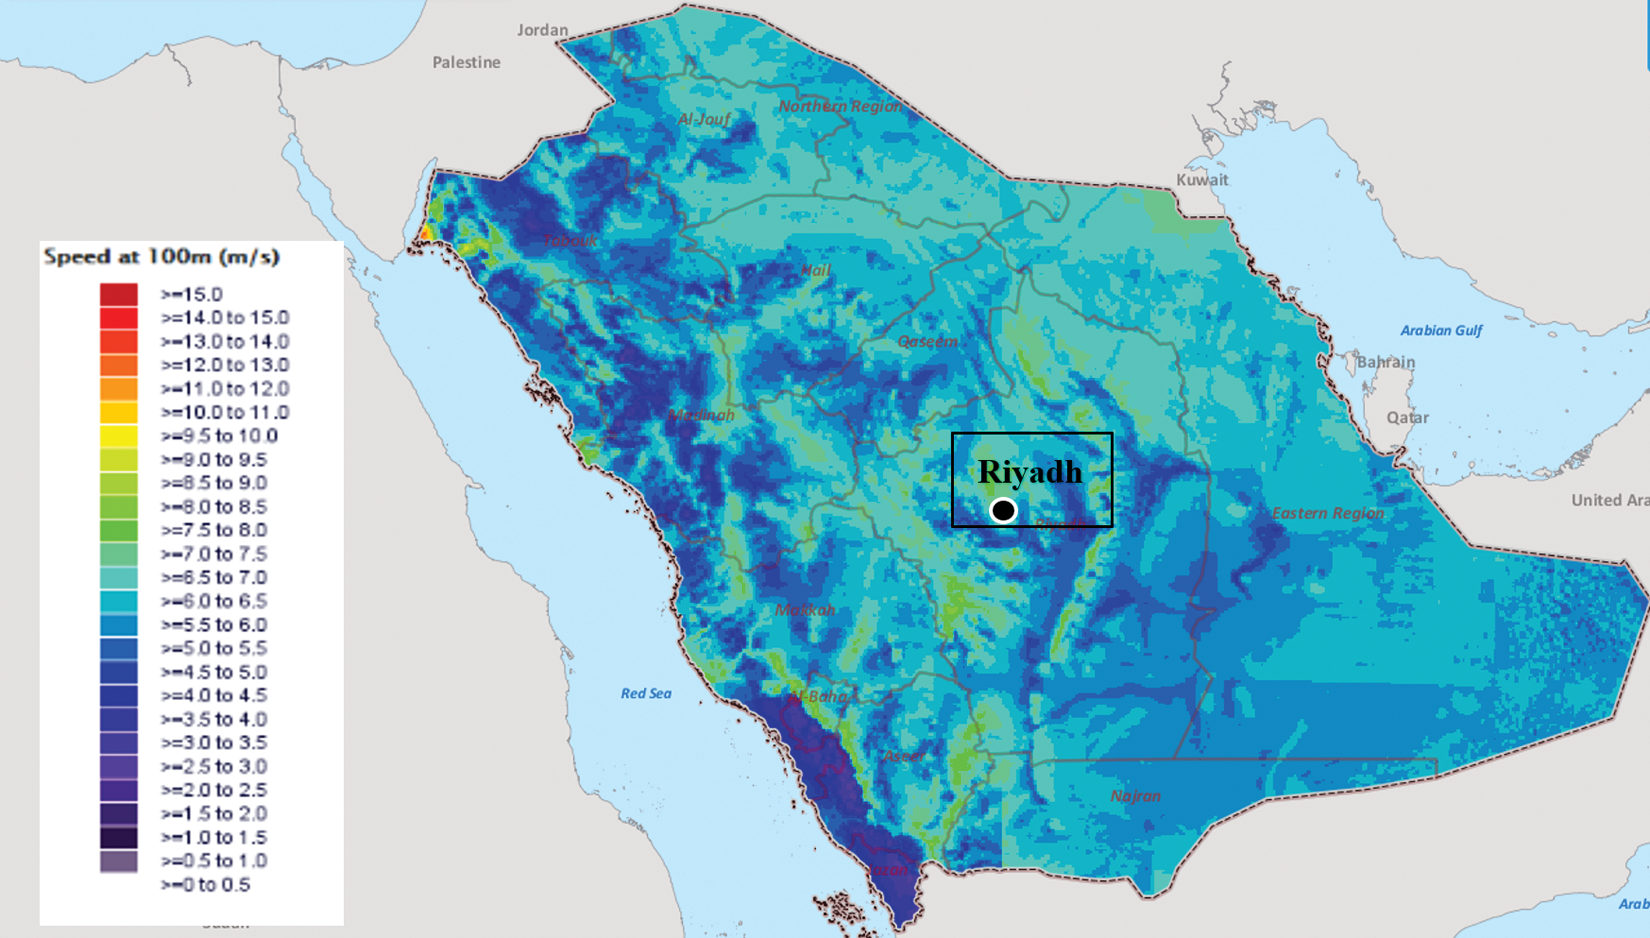
Figure 4: Wind map of the study location, Riyadh, Saudi Arabia [30]
Time variables are selected to forecast the mosque load as the prayers have a specific time on the day and the variation in time varies slowly over the year. On the other hand, the meteorological datasets may impact the thermal of the building. For example, the outdoor temperature highly affects the indoor temperature of the mosque. Moreover, the air conditioning systems consume more electricity when the outdoor temperature, reducing their overall efficiency. The lag observations of the mosque load are significant as the mosque load tends to be repeated daily and weekly; hence, the kilowatt reading at the previous hour
4 Correlation Between Features and Mosque Load
The Pearson Correlation Coefficient is used in this research work to measure the relationship between the input features with the electrical load of the mosque. Hence, the Pearson Correlation Coefficient (P) of input features
where

Figure 5: The correlation values of the input features with mosque load
In addition, to examine the impact of different combinations of the input features, 13 sets of features are identified. These sets are listed in Table 2. In this study, the selection of these sets was based on their correlation with the mosque load. That is, we gave more weight to those features that are highly related to the mosque load. For instance, the set of features (F1) contains the feature which has the highest correlation value with the mosque load (Power at the previous hour). Similarly, F2 contains two features that have the best two correlation values with the mosque load, and so forth.
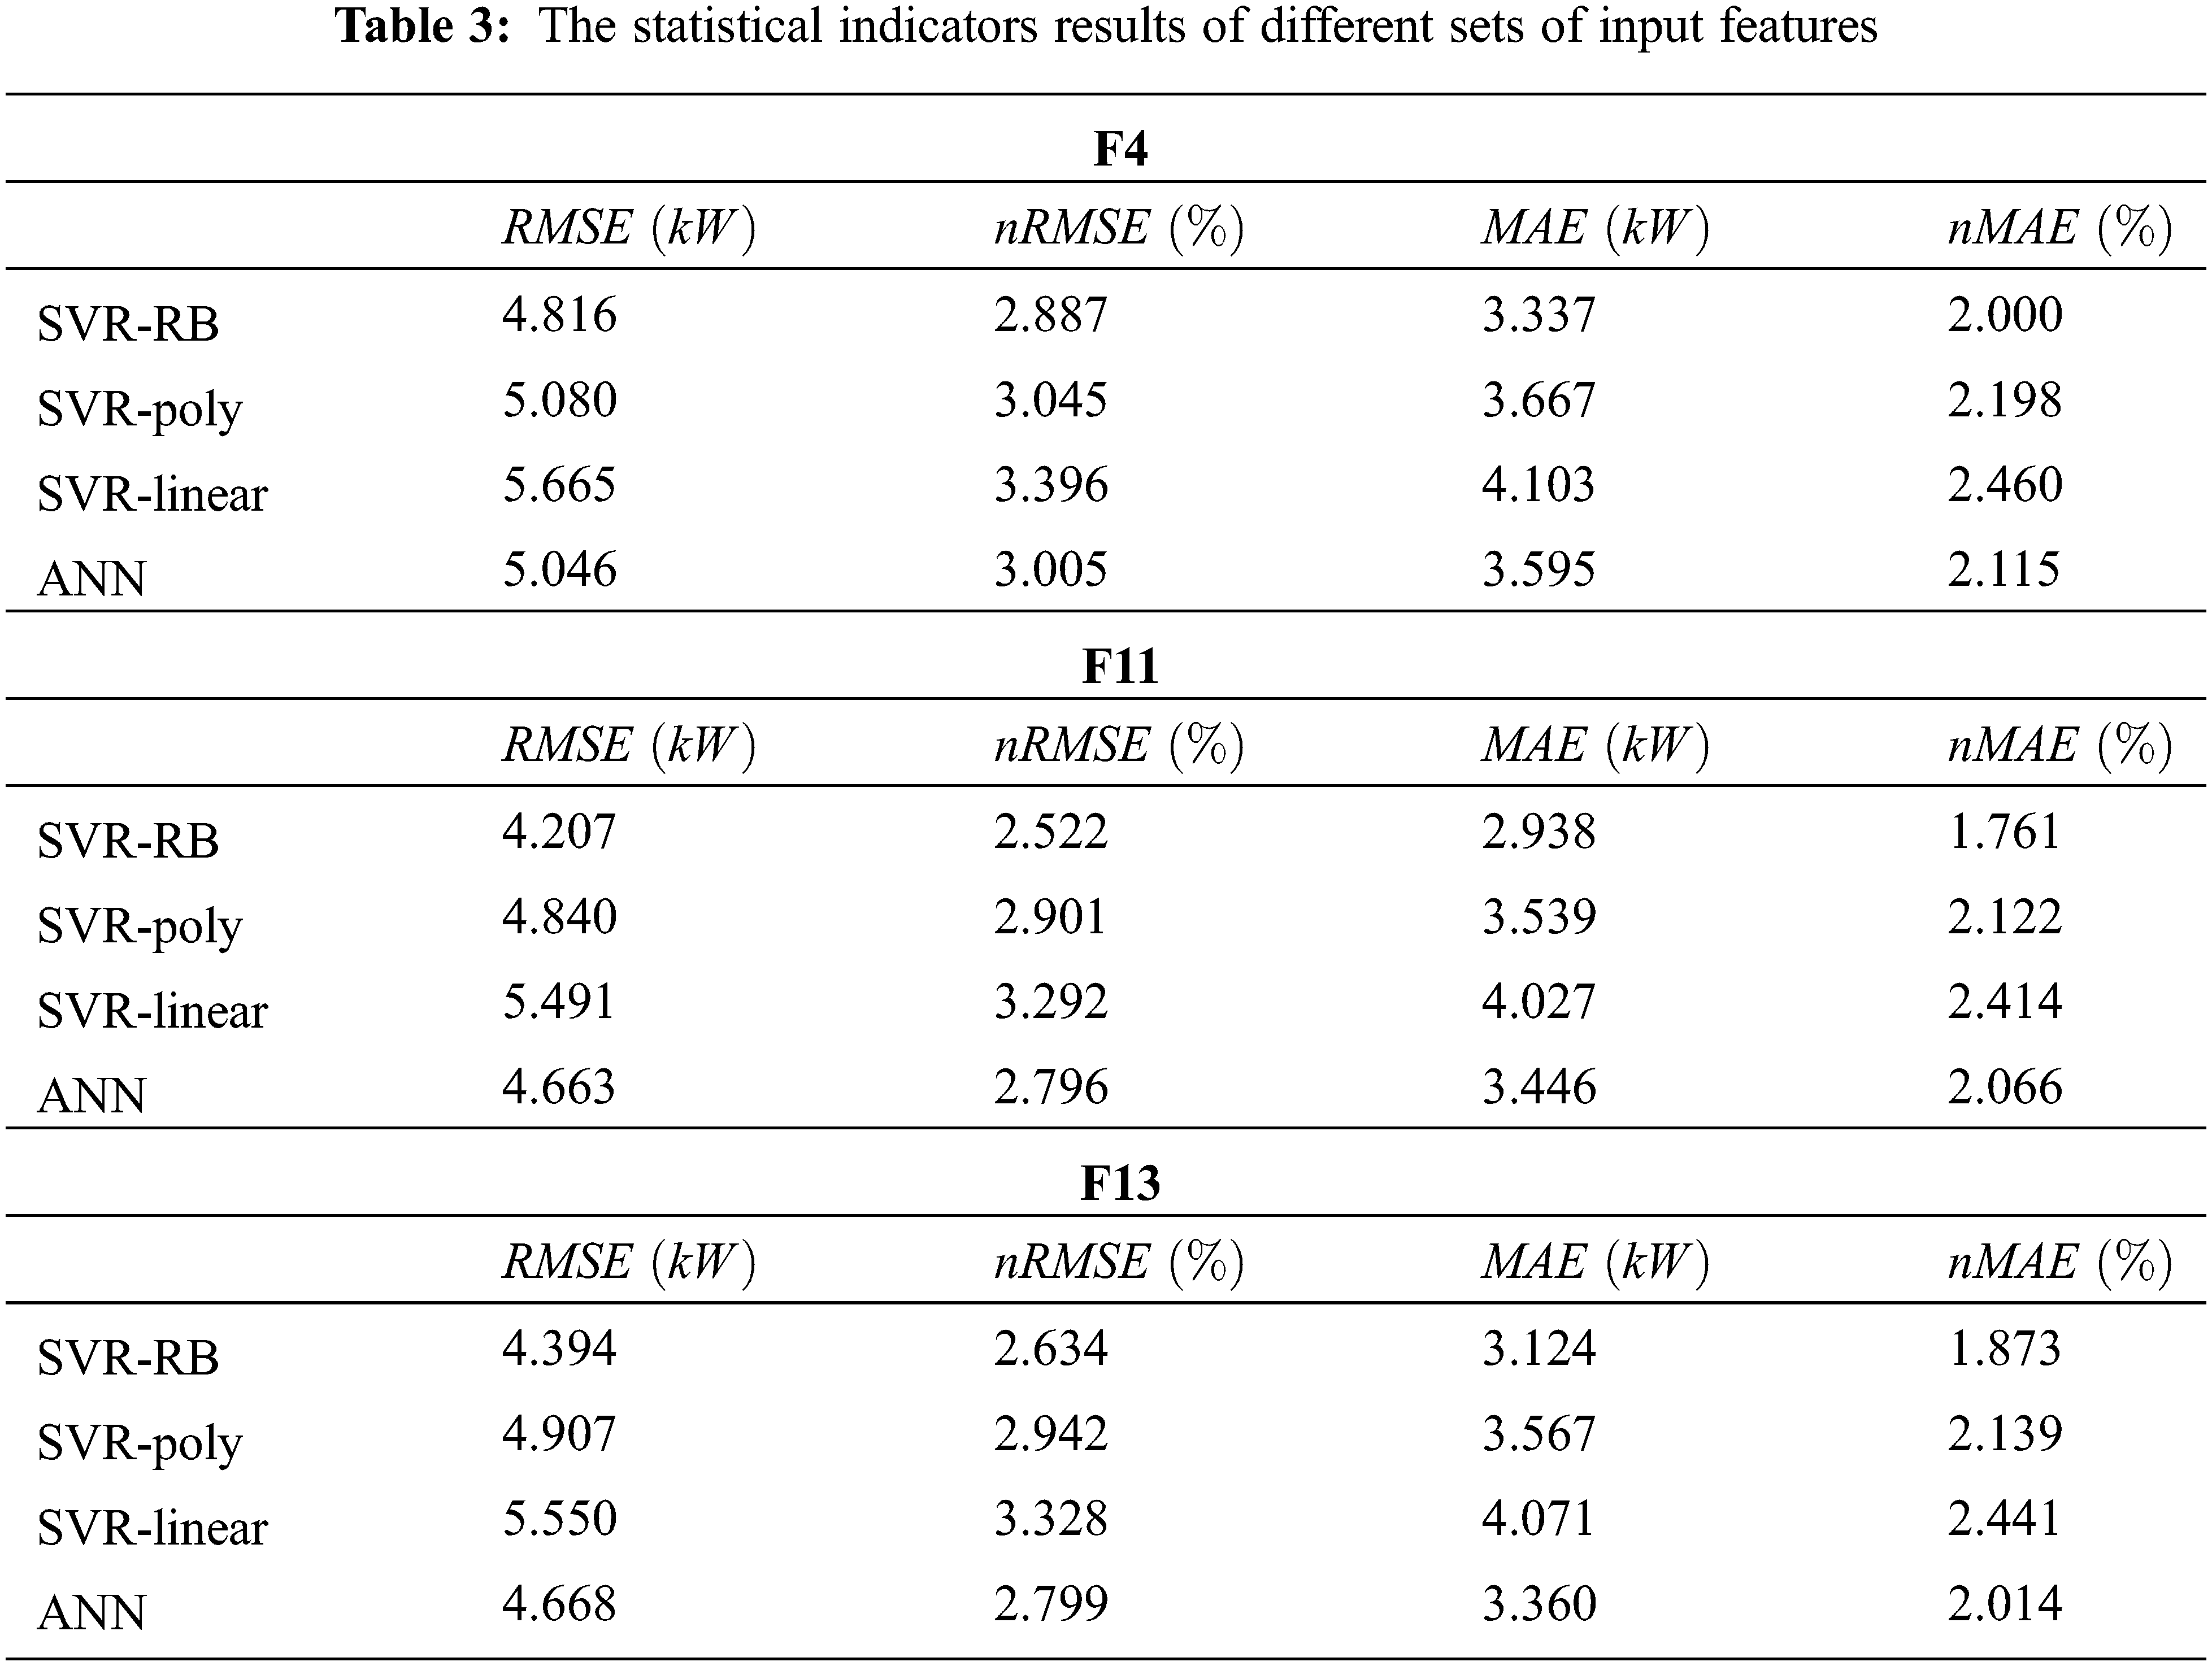
The final forecasting outcomes are acquired after applying the data preprocessing technique and identifying the importance of each feature. Hence, in this section, the feasibility of the forecasting algorithms to predict a 1-h ahead of mosque load is presented. The results of the best forecasting model and the best input features are shown here. Fig. 6 depicts the results of the statistical errors RMSE and MAE, for all forecasting models with the examined input features. Furthermore, Table 3 contains the numerical values of the error measurements with feature combinations F4, F11, and F13 considering the four forecasting approaches.

Figure 6: The forecasting model results of
5.1 Comparison Results of the Forecasting Algorithms
In this study, the performance of four forecasting algorithms is investigated to predict the mosque load. Fig. 6 and Table 3 reveal that SVR-RB prediction accuracy is higher than the comparison methods. The forecasting precision of SVR-RB varied in terms of the statistical error values. The RMSE values of SVR-RB with different sets of features are range from 6.872 to 4.207 kW. These findings show that SVR-RB is capable of capturing the nonlinear properties of the electrical load of the mosque.
Considering other forecasting approaches, ANN shows high accuracy forecasting results followed by SVR-Poly. For instance, the RMSE and MAE of the SVR-RB with F13 found to be 4.394 and 3.124 kW, while ANN provided an RMSE of 4.668 kW and MAE of 3.360 kW. These findings are also obtained with other features combination as listed in Fig. 6 and Table 3. On the other hand, SVR-Linear models have the largest error values and are not able to track the observed values of the mosque load.
5.2 Analysis of the Input Features
Fig. 6 and Table 3 display that the input features (F11) lead to the most accurate forecasting results among the 13 input features. This set of features contains eleven variables, namely Day, Power at the previous hour, Power on the last day at the same hour, Power last week at the same hour, Air Temperature, Global Horizontal Irradiance, Relative Humidity, Surface Pressure, Wind Direction, Wind Speed. Regarding the error metrics, this set of features yields RMSE, nRMSE, MAE, and nMAE values of 4.207 kW, 2.522%, 2.938 kW, and 1.761%, respectively.
The precision plots are visualized in the subplots in Fig. 7 with F1, F5, F11, and F13, respectively, using SVR-RB. These subplots display the performance of SVR-RB when the observed mosque load is plotted against the predicted load values generated from the forecasting models. It can be seen that the data are more concentrated at the center of the regression line. This indicates that the forecasting model can forecast the future values of the mosque load.

Figure 7: The measured vs. predicted mosque load with (a) F1, (b) F5, (c) F11, and (d) F13
The input features (F11) can be considered as the optimal set of variables with all the examined prediction approaches. Hence, the best forecasting model obtained in this study to predict the mosque load is by using SVR-RB with eleven variables (F11). In addition, in Fig. 8, the measured electrical load of the mosque is compared against the forecasting results for three different days with the input feature (F11) using the four forecasting methods. It can be seen that the SVR-RB fits the daily mosque load profile accurately.

Figure 8: Different simulation days displaying the performance of ANN and SVR with F11
In this paper, the performance of four machine learning algorithms—Artificial Neural Network (ANN), and Support Vector Regression (SVR) based on the Radial Basis (RB) function (SVR-RB), Polynomial (Poly) function (SVR-Poly), and Linear (Linear) function (SVR-Linear)—is examined to predict the future hour of a mosque load located Riyadh, Saudi Arabia. To obtain the set of features that offers the most accurate forecasting results, 13 different feature combinations are formulated. Different evaluation metrics are used to assess the prediction accuracy of each of the considered models. These metrics are Root Mean Square Error (RMSE), normalized RMSE (nRMSE), Mean Absolute Error (MAE), and normalized MAE (nMAE).
The study results revealed that the SVR with RB function model has the superiority in predicting the mosque load. Among the 13 feature sets, the set that contains eleven features led to the best prediction outcomes with all forecasting algorithms. For the mosque load, the SVR-RB with eleven features appeared to be the best forecasting model with the lowest forecasting errors metrics giving RMSE, nRMSE, MAE, and nMAE values of 4.207 kW, 2.522%, 2.938 kW, and 1.761%, respectively. On the other hand, the ANN algorithm has good forecasting accuracy results followed by SVR-Poly. In addition, the optimal input feature selection played a significant role not only in yielding precise load forecasting results but also in expediting the pace of the training phase.
Finally, ANN and SVR are the forecasting methods utilized in this research work. Further forecasting approaches, such as random forest, recurrent neural networks, and long short-term memory, can be employed to predict the mosque load by other researchers. In addition, since the performance of SVR and ANN highly depends on their hyperparameters and architectures, optimal selection of such quantities can be further explored to measure the sensitivity of the models to the change in these parameters.
Acknowledgement: The author extends his appreciation to the Deputyship for Research & Innovation, Ministry of Education and Qassim University, Saudi Arabia for funding this research work through the Project Number (QU-IF-4-3-3-30013).
Funding Statement: The author extends his appreciation to the Deputyship for Research & Innovation, Ministry of Education and Qassim University, Saudi Arabia for funding this research work through the Project Number (QU-IF-4-3-3-30013).
Conflicts of Interest: The author declares that he has no conflicts of interest to report regarding the present study.
References
1. V. V. Kolisetty and D. S. Rajput, “A review on the significance of machine learning for data analysis in big data,” Jordanian Journal of Computers and Information Technology, vol. 6, no. 1, pp. 41–57, 2020. [Google Scholar]
2. R. de la Torre, C. G. Corlu, J. Faulin, B. S. Onggo and A. A. Juan, “Simulation, optimization, and machine learning in sustainable transportation systems: Models and applications,” Sustainability (Switzerland), vol. 13, no. 3, pp. 1–21, 2021. [Google Scholar]
3. F. Behgounia and B. Zohuri, “Machine learning driven an E-commerce,” International Journal of Computer Science and Information Security, vol. 18, no. 10, pp. 61–70, 2020. [Google Scholar]
4. P. Guerra and M. Castelli, “Machine learning applied to banking supervision a literature review,” Risks, vol. 9, no. 7, pp. 1–24, 2021. [Google Scholar]
5. R. Pothumsetty, “Implementation of artificial intelligence and machine learning in financial services,” International Research Journal of Engineering and Technology, vol. 7, no. 3, pp. 3186–3193, 2021. [Google Scholar]
6. O. A. Omitaomu and H. Niu, “Artificial intelligence techniques in smart grid: A survey,” Smart Cities, vol. 4, no. 2, pp. 548–568, 2021. [Google Scholar]
7. S. M. Miraftabzadeh, M. Longo, F. Foiadelli, M. Pasetti and R. Igual, “Advances in the application of machine learning techniques for power system analytics: A survey,” Energies, vol. 14, no. 16, pp. 0–24, 2021. [Google Scholar]
8. Deloitte and Touch (M.E.The Digital Islamic Services Landscape: Uncovering the Digital Islamic Services Opportunity for the Middle East and the World. England, London, UK: Deloitte and Touch, 2015. [Online]. Available: www2.deloitte.com. [Google Scholar]
9. A. M. Elshurafa, A. M. Alsubaie, A. A. Alabduljabbar and S. A. Al-Hsaien, “Solar PV on mosque rooftops: Results from a pilot study in Saudi Arabia,” Journal of Building Engineering, vol. 25, pp. 100809, 2019. [Google Scholar]
10. Ministry of Islamic Affairs, Statistical Book for the Year 2020. Riyadh, Saudi Arabia: Ministry of Islamic Affair, 2020. [Online]. Available: https://www.my.gov.sa. [Google Scholar]
11. A. Al Ghamdi, Saudi Arabia Energy Report. Riyadh, Saudi Arabia: The King Abdullah Petroleum Studies and Research Center, 2020. [Online]. Available: https://www.kapsarc.org. [Google Scholar]
12. N. Al-Tamimi, A. Qahtan and O. Abuelzein, “Rear zone for energy efficiency in large mosques in Saudi Arabia,” Energy and Buildings, vol. 223, pp. 110148, 2020. [Google Scholar]
13. M. A. Hammad, B. Jereb, B. Rosi and D. Dragan, “Methods and models for electric load forecasting: A comprehensive review,” Logistics & Sustainable Transport, vol. 11, no. 1, pp. 51–76, 2020. [Google Scholar]
14. S. Sepasi, E. Reihani, A. M. Howlader, L. R. Roose and M. M. Matsuura, “Very short term load forecasting of a distribution system with high PV penetration,” Renewable Energy, vol. 106, pp. 142–148, 2017. [Google Scholar]
15. M. Madhukumar, A. Sebastian, X. Liang, M. Jamil and M. N. S. K. Shabbir, “Regression model-based short-term load forecasting for university campus load,” IEEE Access, vol. 10, pp. 8891–8905, 2022. [Google Scholar]
16. E. Vivas, H. Allende-Cid and R. Salas, “A systematic review of statistical and machine learning methods for electrical power forecasting with reported mape score,” Entropy, vol. 22, no. 12, pp. 1–24, 2020. [Google Scholar]
17. M. O. Oyedeji, I. Alade and T. F. Qahtan, Short-Term Load Forecasting Models for Great Britain Power System Using Machine Learning Techniques on a net-Imports Dataset. Rochester, NY, USA: Social Science Research Network, 2022. [Online]. Available: https://ssrn.com/abstract=4119306. [Google Scholar]
18. Y. Chen, W. Yang and B. Zhang, “Using mobility for electrical load forecasting during the COVID-19 pandemic,” arXiv preprint arXiv, vol. 2006, pp. 08826, 2020. [Google Scholar]
19. B. N. Oreshkin, G. Dudek, P. Pełka and E. Turkina, “N-BEATS neural network for mid-term electricity load forecasting,” Applied Energy, vol. 293, pp. 116918, 2021. [Google Scholar]
20. G. F. Fan, M. Yu, S. Q. Dong, Y. H. Yeh and W. C. Hong, “Forecasting short-term electricity load using hybrid support vector regression with grey catastrophe and random forest modeling,” Utilities Policy, vol. 73, pp. 101294, 2021. [Google Scholar]
21. A. Haque and S. Rahman, “Short-term electrical load forecasting through heuristic configuration of regularized deep neural network,” Applied Soft Computing, vol. 122, pp. 108877, 2022. [Google Scholar]
22. G. Chitalia, M. Pipattanasomporn, V. Garg and S. Rahman, “Robust short-term electrical load forecasting framework for commercial buildings using deep recurrent neural networks,” Applied Energy, vol. 278, pp. 115410, 2020. [Google Scholar]
23. G. F. Fan, S. Qing, H. Wang, W. C. Hong and H. J. Li, “Support vector regression model based on empirical mode decomposition and auto regression for electric load forecasting,” Energies, vol. 6, no. 4, pp. 1887–1901, 2013. [Google Scholar]
24. B. Sch, R. C. Williamson and P. L. Bartlett, “New support vector algorithms,” Neural Computation, vol. 12, no. 5, pp. 1207–1245, 2000. [Google Scholar]
25. M. P. Almeida, M. Muñoz, I. de la Parra and O. Perpiñán, “Comparative study of PV power forecast using parametric and nonparametric PV models,” Solar Energy, vol. 155, pp. 854–866, 2017. [Google Scholar]
26. W. S. Mcculloch and W. Pitts, “A logical calculus of the ideas immanent in nervous activity,” Bulletin of Mathematical Biology, vol. 52, no. 1, pp. 99–115, 1990. [Google Scholar]
27. A. J. Smola and B. Scholkopf, “A tutorial on support vector regression,” Statistics and Computing, vol. 14, no. 3, pp. 199–222, 2004. [Google Scholar]
28. L. Wen, K. Zhou and S. Yang, “Load demand forecasting of residential buildings using a deep learning model,” Electric Power Systems Research, vol. 179, pp. 106073, 2020. [Google Scholar]
29. A. Botchkarev, “Performance metrics (error measures) in machine learning regression, forecasting and prognostics: Properties and typology,” arXiv preprint arXiv, vol. 1809, pp. 03006, 2018. [Google Scholar]
30. King Abdullah City for Atomic and Renewable Energy, Renewable Resource Atlas. Riyadh, Saudi Arabia, 2022. [Online]. Available: https://rratlas.kacare.gov.sa/RRMMPublicPortal/?q=en/Home. [Google Scholar]
Cite This Article
 Copyright © 2023 The Author(s). Published by Tech Science Press.
This work is licensed under a Creative Commons Attribution 4.0 International License , which permits unrestricted use, distribution, and reproduction in any medium, provided the original work is properly cited.
 Downloads
 Citation Tools