
 Submit a Paper
 Propose a Special lssue
 Open Access
ARTICLE

An Efficient Text Recognition System from Complex Color Image for Helping the Visually Impaired Persons
1 Department of Electrical Engineering, College of Engineering, Jouf University, Sakaka, Saudi Arabia
2 Laboratory of Informatics, Gaspard-Monge, A3SI, ESIEE Paris, CNRS, Gustave Eiffel University, France
3 LETI, ENIS, University of Sfax, Sfax, Tunisia
4 Remote Sensing Unit, College of Engineering, Northern Border University, Arar, Saudi Arabia
5 Laboratory of Electronics and Microelectronics (LR99ES30), University of Monastir, Tunisia
6 Department of Computer Engineering and Networks, College of Computer and Information Sciences, Jouf University, Sakaka, Saudi Arabia
7 College of Computer Sciences, King Khalid University, Abha, Saudi Arabia
* Corresponding Author: Ahmed Ben Atitallah. Email:
Computer Systems Science and Engineering 2023, 46(1), 701-717. https://doi.org/10.32604/csse.2023.035871
Received 08 September 2022; Accepted 07 November 2022; Issue published 20 January 2023
 View Full Text
 Download PDF
Abstract
The challenge faced by the visually impaired persons in their day-to-day lives is to interpret text from documents. In this context, to help these people, the objective of this work is to develop an efficient text recognition system that allows the isolation, the extraction, and the recognition of text in the case of documents having a textured background, a degraded aspect of colors, and of poor quality, and to synthesize it into speech. This system basically consists of three algorithms: a text localization and detection algorithm based on mathematical morphology method (MMM); a text extraction algorithm based on the gamma correction method (GCM); and an optical character recognition (OCR) algorithm for text recognition. A detailed complexity study of the different blocks of this text recognition system has been realized. Following this study, an acceleration of the GCM algorithm (AGCM) is proposed. The AGCM algorithm has reduced the complexity in the text recognition system by 70% and kept the same quality of text recognition as that of the original method. To assist visually impaired persons, a graphical interface of the entire text recognition chain has been developed, allowing the capture of images from a camera, rapid and intuitive visualization of the recognized text from this image, and text-to-speech synthesis. Our text recognition system provides an improvement of 6.8% for the recognition rate and 7.6% for the F-measure relative to GCM and AGCM algorithms.Keywords
Text recognition dates back a long time. The starting point was the need to create a reading machine to help the blind [1,2]. Hundreds of recognition systems are currently on the market. They are classified into two types: document-specific readers (such as reading checks, envelopes, and forms); and versatile readers (such as office automation, press, technical documentation, and archiving) [3]. This proliferation of character recognition applications is linked to the desire to limit the quantity and volume of documents to be stored and thus to facilitate their processing. Indeed, character recognition avoids all manual coding phases carried out by operators using the keyboard as an interface. It will therefore have the effect of saving time, simplifying a tedious task and limiting the amount of paper used.
In this context, a unique approach to extracting text regardless of the document area, homogeneous or complex, encounters problems [4–7]. Thus, each type of zone has different characteristics that are similar to very specific image processing algorithms. These algorithms themselves encounter difficulties in properly isolating the text because of its complexity (textures, color gradient appearance) or the poor quality of the document (noise, variation in brightness). Once the text is extracted, it is segmented into disjointed characters. Then, the similarities of each letter with a set of letters from a database are calculated. Recognition is performed by selecting the smallest of the similarities. This similarity requires an efficient description of the characters uninfluenced by possible deformations such as the variation of scales, fonts, etc.
In the literature, the first methods that have been proposed for text localization are methods based on segmentation and spatial clustering approaches. They use color information where the grayscale of text boxes and their intended contrast with the background are concerned. They can be interesting because of their simplicity, but can split the characters into multiple fragments in the case of polychrome characters or noisy and low-resolution data. Other methods that we have encountered in the literature are based on the use of thresholding algorithms. Indeed, the letters can be fragmented and grouped using a criterion of proximity and homogeneity of gray levels. The selected text zone is compared to a reference dictionary presented by Ohya et al. [8]. Smith et al. [9] remove, by gradient thresholding, the strong vertical contours of the image. The isolated contours are erased and the others are grouped by morphological filters. Many works employ this gradient thresholding method, which differs in terms of image preprocessing, binarization algorithm implementation (global or adaptive), and post-processing complexity. We can cite Sato et al. [10], Hasan et al. [11] and Chen et al. [12,13] used this strong gradient detection as a module for pre-localizing potential areas for superimposed text search. Many works utilizing learning algorithms have been proposed to jointly contribute to the reduction of false detections and the improvement of the text recognition, citing [14–18].
The text recognition problem in the complex color images is still an open problem. Indeed, there is not yet a detection and localization method capable of locating all types of text, which is why a large number of techniques are being proposed to solve this problem. Indeed, the extraction phase consists of starting from the boxes containing localized text, binarizing, and preparing the text area to make it the most suitable for an optical character recognition (OCR) module. In general, we start with boxes containing localized texts and whose interior has been repaired. For the segmentation aspect, the interclass variance maximization algorithm (Otsu/Fisher [19]) is still one of the most widely used. More generally, it is local variants applied inside the boxes containing localized texts that are implemented to take into account the problem of complex backgrounds. Sumathi et al. [20,21] proposed an efficient method to extract text from complex color images based on the gamma correction method (GCM). This method allows us to remove the background in order to extract the text from the image.
Human communication is dependent on text and speech. Thus, visually impaired persons can collect information from voices. With the help of this work, the visually impaired persons can read the text present in the captured image. In this context, in this paper, we develop a text recognition system that allows the isolation, the extraction, and the recognition of text from a complex color image having a textured background, a degraded aspect of color, and poor quality. In fact, the mathematical morphology method is used to locate and detect the text in the complex color image. After that, we apply the optimized GCM to each region of interest, which allows us to separate the foreground (text) and the background (noise and texture). Then, the Otsu is applied to remove the background and leave the foreground on the located text region (not on the whole image). By the way, if it has noise or intensity variation in the image, it will be limited and not affect the detection of the best threshold by the Otsu algorithm in order to separate background and foreground and extract text. In the end, the tesseract OCR recognizes the text for each region of interest. A graphical interface for the proposed text recognition system has been developed using the Qt framework. This interface can assist the visually impaired persons by synthesizing the recognized text from the captured image via a camera into speech. The developed system has low computational complexity and can speed up the overall processing time. The following points summarize the contribution of this work:
• Improvement of the text detection from a complex color image by using the mathematical morphology method.
• An optimized method is proposed for text detection. This method allows to reduce the computational complexity of the gamma correction method.
• A new and efficient text recognition system is proposed for text extraction, detection, and recognition.
• Development of the graphic interface through the Qt framework in order to assist the visually impaired persons by synthesizing the recognized text from the captured image via a camera into speech.
Accordingly, this paper is divided as follows: An efficient text detection and localization method is described in Section 2. Section 3 presents the GCM algorithm used for text detection and the optimization proposed for this algorithm to reduce its computational complexity. A text recognition system for helping the impaired is developed in Section 4. The performance evaluation of our system is illustrated in Section 5. Section 6 concludes this paper.
2 Text Detection and Localization
The Mathematical morphology method (MMM) is a theory of nonlinear information processing used in the analysis of pictures, which was proposed by Wu et al. [22]. The MMM is based on the observation that there are contrast colors between the text and its adjacent background, which is an important characteristic for the detection of the text area. Fig. 1 depicts the entire procedure of this morphology-based technique. However, to determine the text, the MMM starts by generating a grayscale image from the input image. Then, it applies the difference between the dilation and the erosion morphology applied to the grayscale image in order to detect text regions from a complex background, as shown in Fig. 2b.
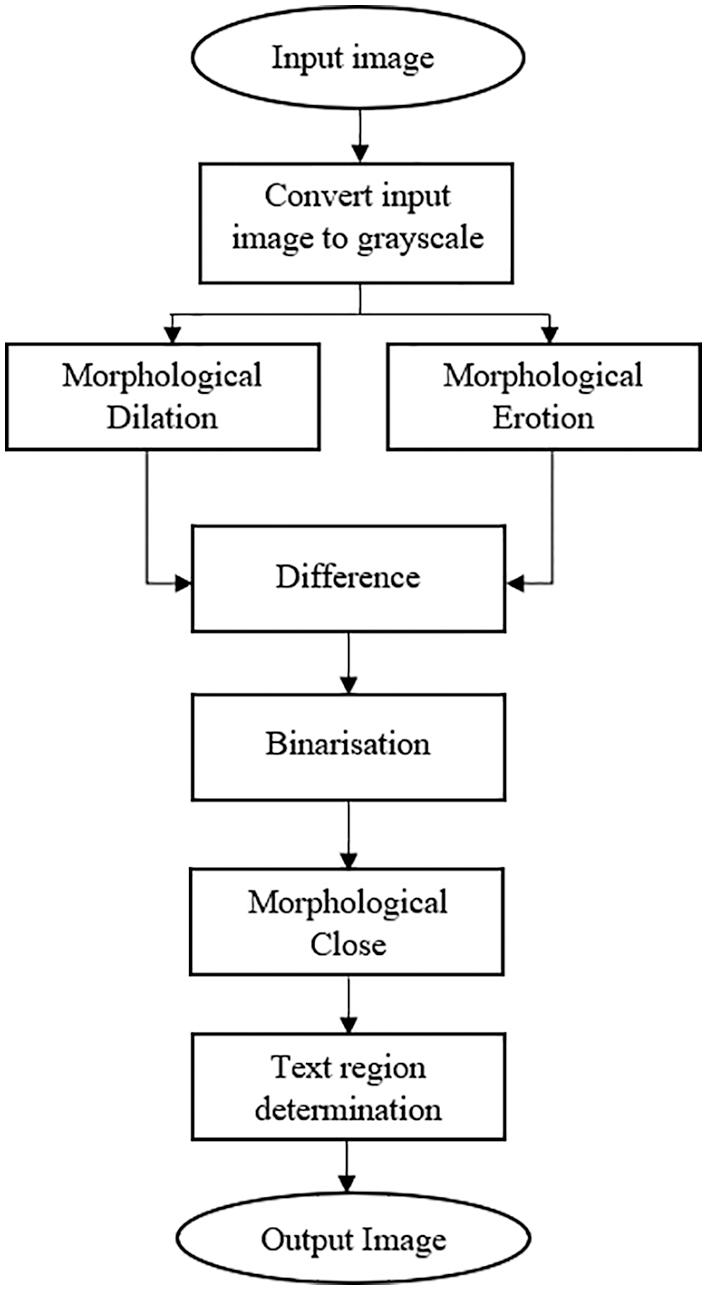
Figure 1: Flowchart for text detection and localization

Figure 2: (a) Input image, (b) Morphological gradient image, (c) Binarized image, (d) Components connected through closing, (e) Localized text regions
However, let I(x, y) be a gray-level input image. Let
After obtaining the morphological gradient image, a thresholding procedure is applied using Eq. (4) to extract the text segments. In the thresholding procedure, a parameter T is dynamically defined based on the background of the image. This parameter is responsible for determining the limit value of the binarization operation. Fig. 2c illustrates the binarized image.
After the binarization step, the morphological closing is applied. In fact, the erosion and the dilation have the disadvantage of strongly modifying the size of the structures in the image. To reduce this effect, they are often used in combination. Thus, the morphological closing is defined as dilation followed by erosion as depicted in Eq. (5). Fig. 2d illustrates the output of the morphological closure.
The next step is to determine and locate the actual text region among the candidate regions smoothed to the boundaries by some useful cues, such as the aspect ratio of the text region. Based on the observation, the variation of intensity around pixel transition is important because of the complex structure of the text. In this context, the local binary pattern (LBP) is an efficient and simple tool to represent texture consistency using only the intensity pattern. LBP forms the binary pattern using the current pixel and all of its circular neighboring pixels and can be converted to a decimal number as presented by Eq. (6).
where P and R, respectively, designate the number of circular neighboring pixels of a specific pixel and the radius of the circle which are chosen by the user.
If the actual text region has been determined from among the smoothed candidate regions, the next step is to localize the text regions, which is done in bounding boxes which are then dilated by 2 pixels in order to fully encompass all the pixels of the characters (Fig. 2e).
3.1 Gamma Correction Method (GCM)
The GCM is one of the most robust methods used for text extraction [23,24]. This method makes it possible to partially or completely remove the heterogeneous background while preserving the characteristics of the text. Thus, it aims to remove non-textual details in images by applying the appropriate gamma value. The gamma transformation is expressed by Eq. (7), which is an operator that depends on the parameter γ.
The GCM processing steps are illustrated in Fig. 3. However, the GCM transforms a gray-level image into 100 modified images using a range of gamma values going from 0.1 to 10.0 with a step of 0.1. Four co-occurrence matrices are calculated for each image. After that, the texture feature measurements are extracted from the four co-occurrence matrices. Then, the threshold value is computed for each image using the Otsu algorithm [19]. In the end, the energy, the contrast, and the threshold are inspected to determine the optimal gamma value, which allows the improvement of the image contrast for the text extraction. Hence, the GCM method is based on four fundamental steps (generation of co-occurrence matrices, extraction of Haralick features, calculation of the Otsu threshold, and estimation of the optimal gamma value), which will be detailed in the rest of this section.

Figure 3: Gamma correction for image contrast enhancement
3.1.1 Generation of Co-Occurrence Matrices
The co-occurrence matrix [25], also called the Spatial Gray Level Dependence Matrix (SGLDM), is one of the best approaches used for extracting texture characteristics such as energy and contrast. Indeed, it makes it possible to statistically analyze the texture by studying the spatial relationships of pairs of pixels. It thus characterizes the periodicity and the directivity of the textures.
The calculation of the co-occurrence matrices used in the GCM is carried out as follows. For each image in gray levels, four co-occurrence matrices are calculated, which correspond to a translation d equal to 1 and to the four angles a: 0°, 45°, 90°, and 135° (Fig. 4a). Fig. 4b shows an example of the positions of pairs of identical pixels (in blue) in the pixel matrix of the image. From the values of these pixels (Fig. 4b), the corresponding coordinate box is incremented by 1 in the co-occurrence matrix (Fig. 4c). The result is a square matrix of the size Ng × Ng, where Ng represents the number of gray levels.

Figure 4: Example of the generation of the four co-occurrence matrices (a) displacement and angle, (b) Position of neighboring pixels, (c) Incrementing the corresponding values in the co-occurrence matrix
3.1.2 Calculation of Haralick Characteristics
From the generated co-occurrence matrices, it is possible to calculate several characteristics for the texture description called Haralick characteristics [26]. The GCM uses only the contrast and the energy characteristics, which are computed according to Eqs. (8) and (9), respectively.
3.1.3 Calculation of the Otsu Threshold
The principle of the Otsu method consists of automatically finding the threshold which minimizes the weighted intra-class variance
With
Hist(i) designates the pixel number of the gray level i. L and H designate the width and height of the image I, respectively. The variances of the classes
3.1.4 Estimating of the Optimal Gamma Value
The energy and the contrast values of the original image, which has a gamma value equal to 1, are examined to determine the peaks in the energy (Pe), contrast (Pc), and Otsu threshold (Pt). Consequently, three rules are used to estimate the optimal gamma value. The first rule is applied if the energy is greater than Pe. Otherwise, if the energy is strictly less than Pe, the second rule is applied if the contrast is greater than Pc, and the third rule is applied if the contrast is strictly less than Pc.
In the case of the first rule, if the value of the energy E ⩾ Pe, we look for the value of the maximum Otsu threshold to be equal to Pt. If several instances are found, we select the one with a maximum contrast value equal to Pc and energy E ⩾ Pe. If no instance is found, the value of the threshold closest to Pt is sought.
In the case of the second rule, if the energy value E < Pe and the contrast value C ⩾ Pc, we look for an instance that has the energy value E ⩾ 0.1, the contrast value C ⩾ Pc and the threshold value of Pt at from the gamma row from 1 to 10. If more than one instance is found, select an instance whose maximum energy value is equal to Pe and whose contrast value is greater than Pc. If such a case is not found, we look for a candidate between the gamma values of 0.1 and 0.9. The threshold value should be close to Pt.
In the case of the third rule, if the energy value E < Pe and the contrast value C < Pc, we look for an instance that has an energy value E ⩾ 0.1. The maximum contrast value must be greater than 100 for gamma values between 1 and 10. If no instance is found, we search for an instance between the gamma values of the interval [0.1, 1] such that the value of the threshold should be closer to Pt. The gamma value of the selected instance is the optimal value.
However, in the case of the Fig. 5a, the rule 3 is selected. In fact, for γ = 1 (original image), the energy value is <0.05 and the contrast value is <1000, therefore γ = 0.9 (Fig. 8b) and T = 0.609375 (Fig. 8c).
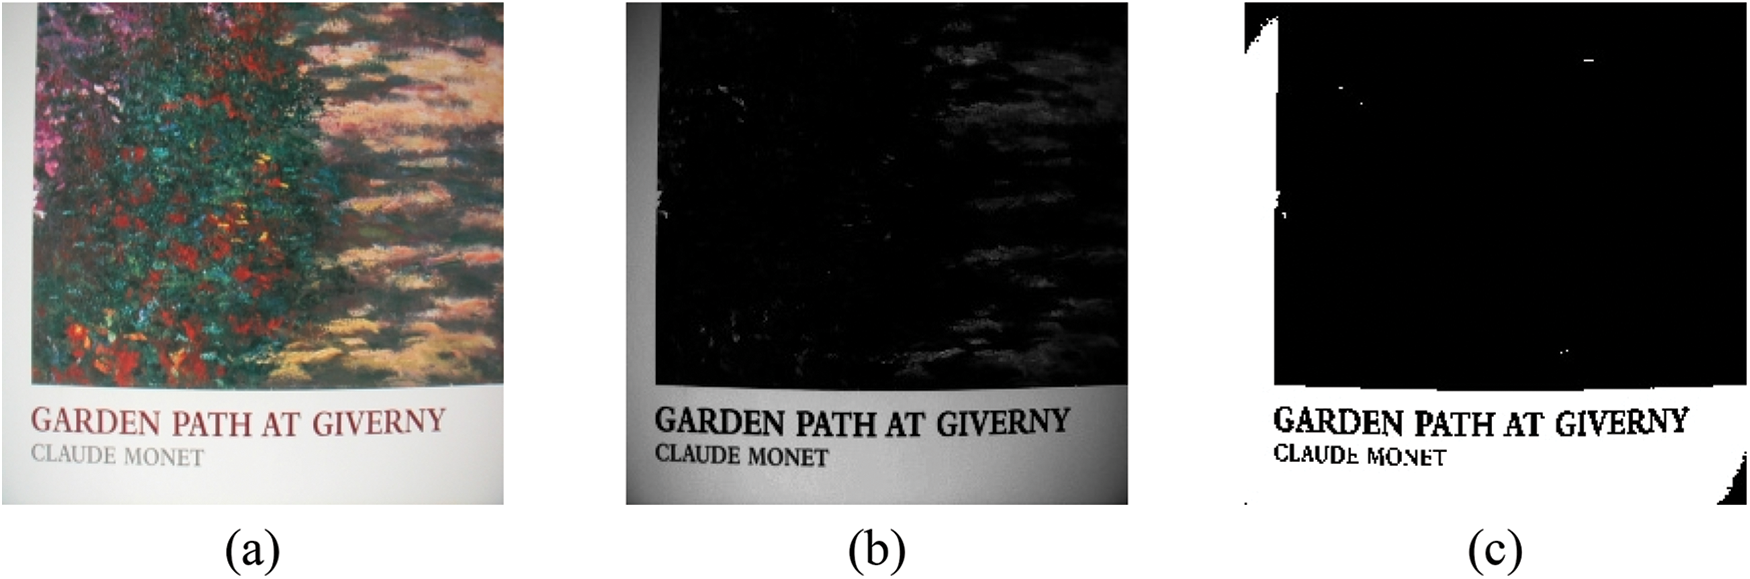
Figure 5: (a) Original image “Contrast = 62.379, Energy = 0.00145387” (b) Modified image “γ = 0.9” (c) Binarized image “T = 0.609375”
3.2 Acceleration of the Gamma Correction Method (AGCM)
The main factor in the high complexity of the GCM algorithm is the number of images to process, which is equal to 100. In this section, we propose to accelerate the GCM (AGCM) by making a prediction of a subset smaller than the set of 100 images. For that, we have studied the behavior of the curves of energy, contrast, Otsu threshold, and optimal gamma values. This study makes it possible to build relationships between the behavior of these parameters and sub-rows of gamma values likely to contain the optimal gamma value. Fig. 6 illustrates the contrast, energy, and Otsu threshold curves calculated by the GCM method. These curves are constructed from the 100 gamma values calculated by GCM.

Figure 6: Image classifications and corresponding characteristic curves: (a, d, g) Original images, (b, e, h) GCM characteristic curves, (c, f, i) AGCM characteristic curves. Contrast curve (red), Energy (blue), Otsu threshold (green) and optimal gamma value (black vertical line)
Based on sharp peaks and changes in the contrast curve, each image is classified as having strictly increasing, decreasing, or constant contrast. Abrupt changes are called discontinuities. They represent a radical change in the rendering of the resulting image. These curves clearly show the behavior of the characteristics and allow us to extract the relationships between the curve and the optimal gamma value based on the shape of the curve rather than numerical criteria.
A strictly rising contrast curve (Fig. 6b) has an optimal gamma value of 10 and generally means that the image has slightly varying threshold, energy, and Otsu contrast characteristics. In a strictly decreasing curve, in general, the optimal gamma value is close to its peak point. This peak is always located in the interval γ = [0.9, 3.5] (Fig. 6e). A constant contrast curve (Fig. 6h) denotes an image that is influenced more by the behavior of the energy curve than by the behavior of the contrast curve. In this case, if the energy curve is strictly increasing, this indicates the presence of a low gamma value.
Thus, for the AGCM, we propose to calculate the contrast, energy, and threshold parameters of Otsu at particular points. These points correspond to some gamma values among the 100 possible values. They are given by the following set γ:
These values were chosen from the gamma values that define the behavior of the parameter curves so that the entire curve can be classified reliably as in the original gamma correction method. The AGCM behavior is illustrated by Fig. 6c, 6f, 6i.
Thus, in the AGCM, the calculation of the optimal gamma value is performed on a relatively small number of images. The AGCM uses a set of rules resulting from a behavioral analysis of the parameters, which is presented in Fig. 7. We can see from Fig. 7 that the AGCM has 6 possible branches numbered from (1) to (6). These branches can be grouped into 3 main ones: In branch (1), the contrast curve is strictly increasing. In branches (2) and (3), the contrast curve is decreasing. Finally, for branches (4), (5), and (6), the contrast curve is constant.

Figure 7: AGCM rules With C = contrast, E = energy,
As illustrated in Fig. 8, our text recognition system consists of a text detection and localization block based on the MMM method; a text extraction block based on the AGCM algorithm; a text recognition block based on the Tesseract [27], which is an Optical Character Recognition (OCR) algorithm capable of recognizing all characters for over 100 different languages and is used to recognize the text from the AGCM output image; and a text to speech based on the Google tool.
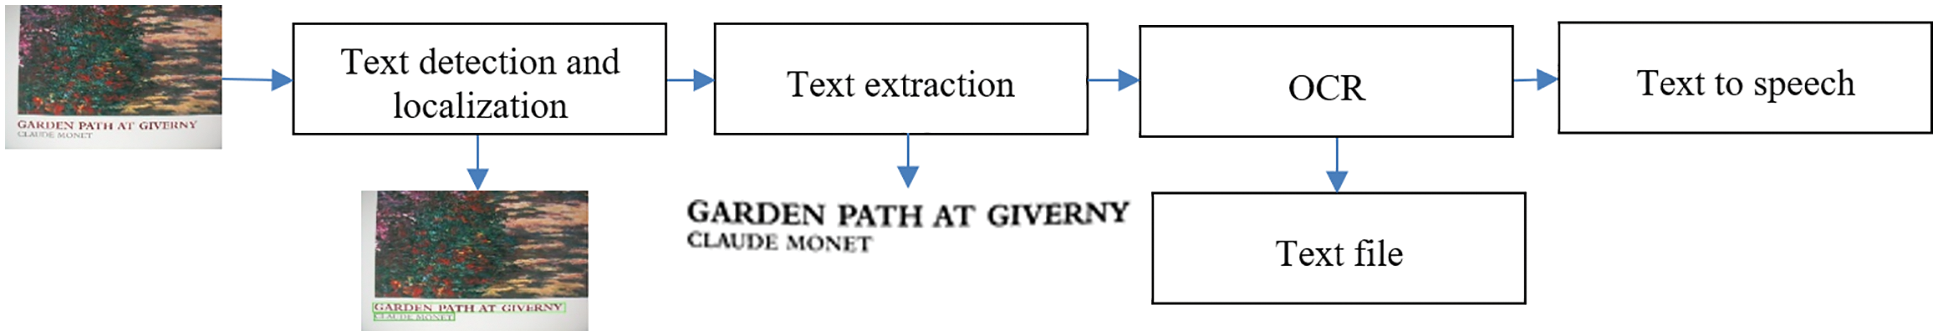
Figure 8: Text recognition system
However, the Tesseract OCR [27,28] uses two pass to recognize the words. So, on the first pass, the satisfying word is sent to the adaptive trainer to attempt to recognize the word. Afterward, the second pass is applied to each word that was not successfully recognized by the first pass. At the end, the recognized text is output.
Our text recognition system is developed using Qt, which is an application development framework. Qt provides a dedicated IDE “Qt Designer” interface, allowing us to create a graphical interface by placing the different widgets, rather than implementing everything in code manually. The code is then only used to link the widgets to their actions. However, Fig. 9 shows the main interface of our text recognition system.

Figure 9: Main interface of our text recognition system
As presented in Fig. 10, to use this interface, we have to select an image by going to File > Open Media (for any image size) or use the webcam to capture an image by going to File > Open Webcam (the size of the image depends on the camera resolution). The selected image in the input can has any text orientation.

Figure 10: File type selection window
Once the image that contains the text is selected, our text recognition system commences to process the image by clicking on the Process Base Media button from the main interface and generating the interface depicted in Fig. 11. From this interface, we can see the original image, the grayscale image, the gamma corrected image for the optimal gamma value, the binarized image, the text zone in the image which is converted to speech, and the optimal gamma value. So, to provide more flexibility to our system, the generated interface can be configured by using the “Actions” menu (Fig. 12) from the main interface. In fact, we can select the things to display by checking the box in the “Actions” menu.

Figure 11: Generated interface by the text recognition system
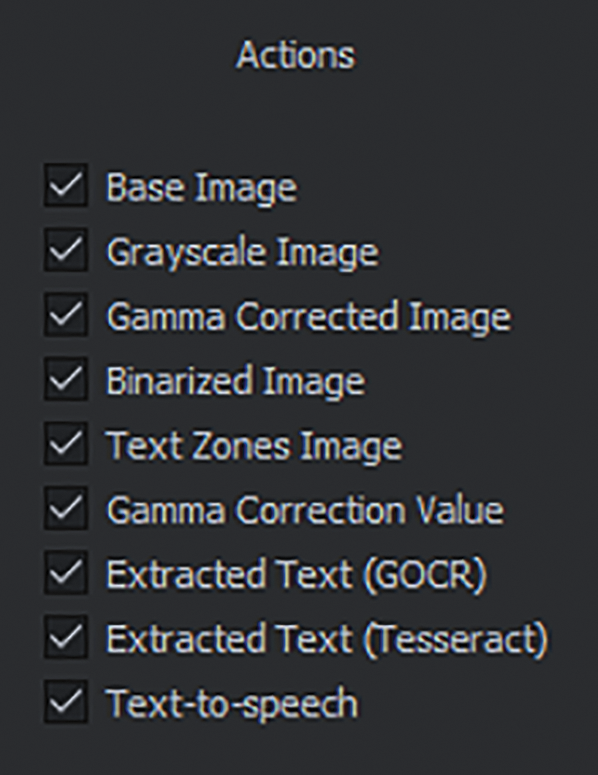
Figure 12: “Actions” menu
Then, by clicking on the “Extract Text” button from the main interface, the text is recognized by using the Tesseract 5.2.0 [29] and displayed in a specific window as illustrated by Fig. 13.
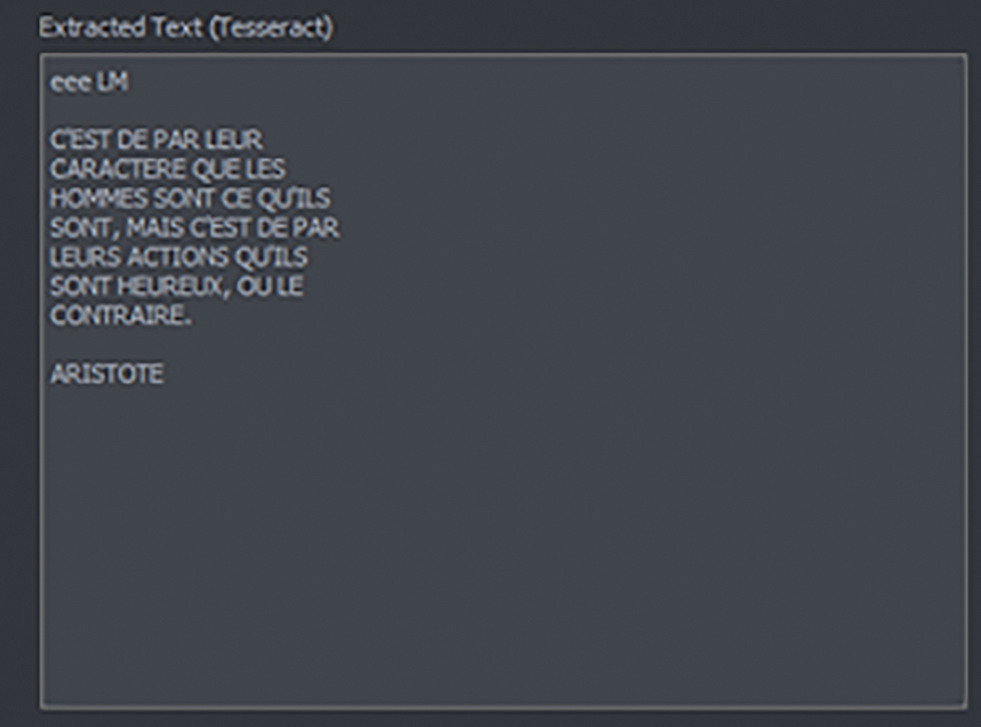
Figure 13: Text recognition
In the end, the text is translated into speech by clicking on the “Text-to-Speech” button from the main interface. So, the “Text-to-Speech” interface (Fig. 14) appears to adjust the volume and restart or stop the listening of the speech.
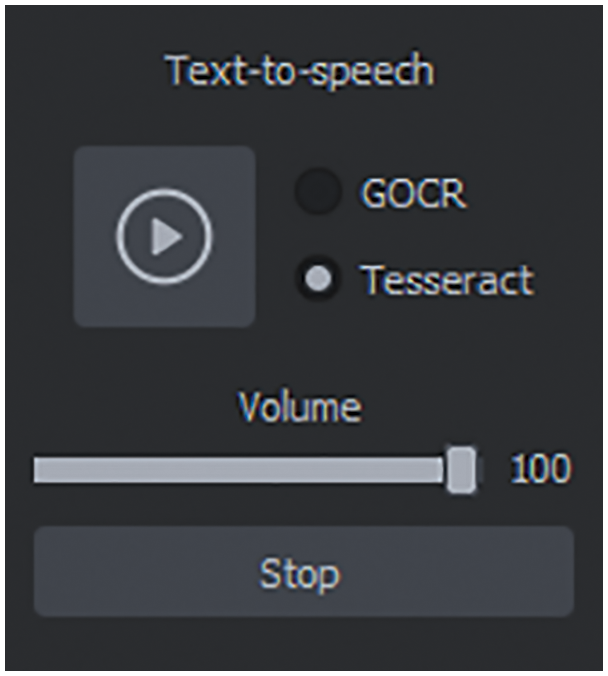
Figure 14: “Text to speech” window
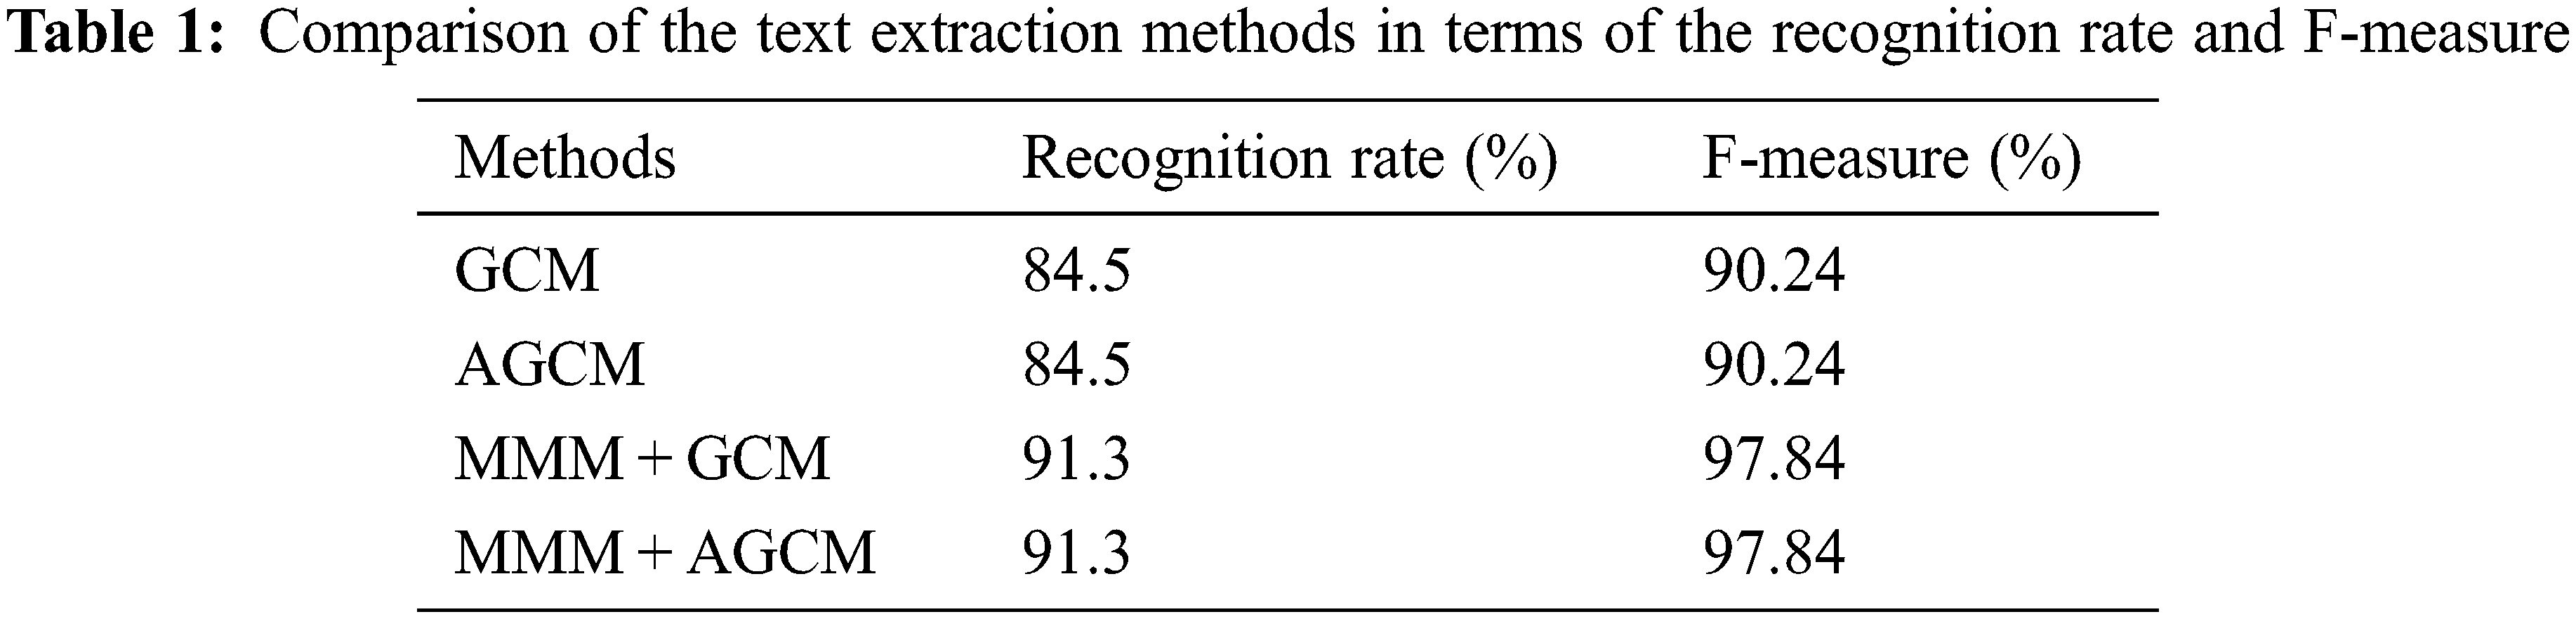
The proposed system is evaluated on the basis of the International Conference on Document Analysis and Recognition (ICDAR) dataset [30]. This dataset contains various text documents with varying degrees of complexity. In fact, this dataset contains images from different scenes, different light, different orientation and different pixel sizes. For a quantitative evaluation, the recognition rate is used to evaluate how many percent of the text regions are correctly detected by our text recognition system compared to other methods as recorded in Table 1. The recognition rate is computed by Eq. (17).
where N indicates the number of characters in the reference text, S presents the number of substitutions, I designates the number of insertions, and D specifies the number of deletions.
Further, the F-measure metric is used to assess the accuracy of the image binarization. The F-measure is measured based on Eq. (18). Where the recall (R) is defined by the number of relevant pixels correctly classified with regard to the number of relevant pixels contained in the image studied as depicted by Eq. (19). But, precision (P) represents the number of correctly classified relevant pixels relative to the total number of pixels in the image as illustrated by Eq. (20).
From Table 1, we can note that the AGCM and the GCM algorithms with the MMM method give a better character recognition rate and F-measure compared to the AGCM and the GCM without the MMM method. We explain these results by the fact that the text region detection by the MMM method allows for perfect text extraction and recognition results. On the other hand, from Table 1, we can see that the AGCM with the MMM method gives the same recognition rate and F-measure compared to the GCM with the MMM method, which implies that our AGCM algorithm does not affect the text extraction and recognition results with a decrease in the computational complexity relative to the GCM.
However, we have measured the execution time of our optimized text recognition system (MMM + AGCM + Tesseract OCR) on a computer with a Core (TM)i7-1165G7@2.80 GHz Intel processor. As depicted in Fig. 15, our optimized system can process various sizes of color complex images, such as 512 × 512 pixels, 256 × 256 pixels, and 128 × 128 pixels in 1.035, 0.805, and 0.4 s, respectively. Hence, an optimization in the execution time is provided by our text recognition system in the order of 78% for 512 × 512 pixels, 70% for 256 × 256 pixels, and 67% for 128 × 128 pixels sized images relative to the not optimized recognition system (MMM + GCM + Tesseract OCR).
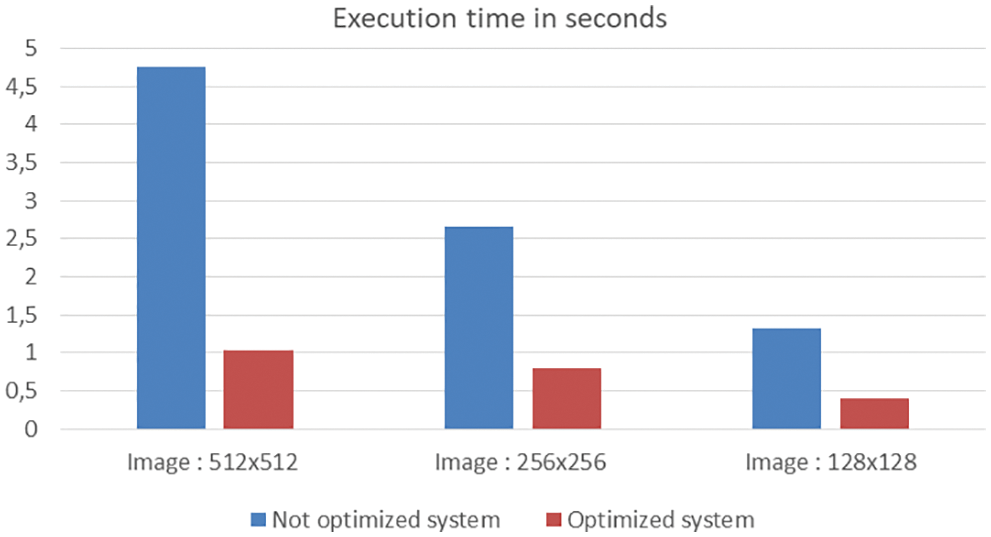
Figure 15: Comparison of the execution time for not optimized and optimized text recognition system
Our future work will be focused on using machine learning methods and developing hybrid machine learning methods for text detection, extraction and recognition [31].
By the way, our text recognition system (MMM + AGCM + Tesseract OCR) presents an efficient system for helping the visually impaired persons recognize text (Fig. 16) with a minimum complexity.
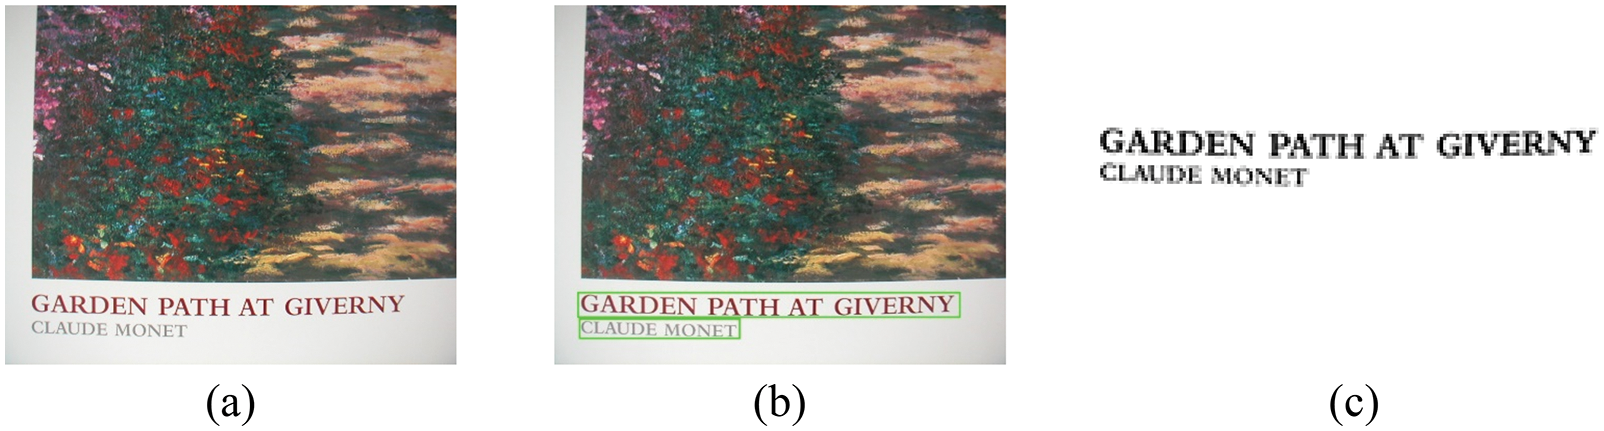
Figure 16: (a) Original image, (b) the text region detection by the MMM method, (c) text extraction by the AGCM algorithm
In this work, an efficient text recognition system was developed to localize, extract, and recognize the text from complex color images. This system is based on the MMM method for text localization, an optimized GCM algorithm for text extraction, and Tesseract OCR for text recognition of the text in the image provided by the AGCM algorithm. The framework Qt is used through the “Qt Designer” to create a graphical interface for our system. This interface can be used by the visually impaired persons to recognize text from an image or camera and generate speech related to the recognized text. Our system provides low computational complexity and high accuracy for recognizing text with a recognition rate and an F-measure equal to 91.3% and 97.84%, respectively.
Funding Statement: This work was funded by the Deanship of Scientific Research at Jouf University under Grant Number (DSR2022-RG-0114).
Availability of Data and Materials: Data will be made available on request.
Conflicts of Interest: The authors declare that they have no conflicts of interest to report regarding the present study.
References
1. J. Mantas, “An overview of character recognition methodologies,” Pattern Recognition, vol. 19, no. 6, pp. 425–430, 1986. [Google Scholar]
2. B. Jacobsen, “World health organization,” 2021. [online]. Available: https://www.who.int/news-room/fact-sheets/detail/blindness-and-visualimpairment [Google Scholar]
3. S. N. Srihari, “High-performance reading machines,” in Proc. of the IEEE, vol. 80, no. 7, pp. 1120–1132, 1992. [Google Scholar]
4. E. Kavallieratou, “A binarization algorithm specialized on document images and photos,” in Proc. ICDAR'05, Seoul, Korea (Southpp. 463–467, 2005. [Google Scholar]
5. Y. Pan, X. Hou and C. Liu, “A hybrid approach to detect and localize texts in natural scene images,” IEEE Transactions on Image Processing, vol. 20, no. 3, pp. 800–813, 2011. [Google Scholar]
6. T. Q. Phan, P. Shivakumara and C. L. Tan, “Detecting text in the real world,” in Proc. of the ACM Conf. on Multimedia, New York, NY, USA, pp. 765–768, 2012. [Google Scholar]
7. C. Yi and Y. Tian, “Text extraction from scene images by character appearance and structure modeling,” Computer Vision and Image Understanding, vol. 117, no. 2, pp. 182–194, 2013. [Google Scholar]
8. J. Ohya, A. Shio and S. Akamatsu, “Recognizing characters in scene images,” IEEE Transactions on Pattern Analysis and Machine Intelligence, vol. 16, no. 2, pp. 214–220, 1994. [Google Scholar]
9. M. Smith and T. Kanade, “Video skimming for quick browsing based on audio and image characterization,” Tech. Report, CMU-CS-95-186, Computer Science Department, Carnegie Mellon University, 1995. [Google Scholar]
10. T. Sato, T. Kanade, E. K. Hughes, M. A. Smith and S. I. Satoh, “Video OCR: Indexing digital new libraries by recognition of superimposed captions,” Multimedia Systems, vol. 7, no. 5, pp. 385–395, 1999. [Google Scholar]
11. Y. M. Y. Hasan and L. J. Karam, “Morphological text extraction from images,” IEEE Transactions on Image Processing, vol. 9, no. 11, pp. 1978–1983, 2000. [Google Scholar]
12. D. Chen, J. M. Odobez and H. Bourlard, “Text detection and recognition in images and video frames,” Pattern Recognition, vol. 37, no. 3, pp. 595–608, 2004. [Google Scholar]
13. D. Chen, J. M. Odobez and J. P. Thiran, “A localization/verification scheme for finding text in images and video frames based on contrast independent features and machine learning methods,” Signal Processing: Image Communication, vol. 19, no. 3, pp. 205–217, 2004. [Google Scholar]
14. P. Clark and M. Mirmehdi, “Recognising text in real scenes,” International Journal on Document Analysis and Recognition, vol. 4, no. 4, pp. 243–257, 2002. [Google Scholar]
15. R. Lienhart and A. Wernicke, “Localizing and segmenting text in images and videos,” IEEE Transactions on Circuits and Systems for Video Technology, vol. 12, no. 4, pp. 256–268, 2002. [Google Scholar]
16. A. A. Chandio, M. Asikuzzaman, M. R. Pickering and M. Leghari, “Cursive text recognition in natural scene images using deep convolutional recurrent neural network,” IEEE Access, vol. 10, pp. 10062–10078, 2022. [Google Scholar]
17. A. İ. Topçu and B. Uğur Töreyin, “Neural machine translation approaches for post-OCR text processing,” in Proc. SIU, Safranbolu, Turkey, pp. 1–4, 2022. [Google Scholar]
18. S. Dome and A. P. Sathe, “Optical character recognition using tesseract and classification,” in Proc. ESCI, Pune, India, pp. 153–158, 2021. [Google Scholar]
19. N. Otsu, “A threshold selection method from grey-level histograms,” IEEE Transactions on Systems, Man, and Cybernetics, vol. 9, no. 1, pp. 62–66, 1979. [Google Scholar]
20. C. P. Sumathi and G. G. Devi, “Automatic text extraction from complex-colored images using gamma correction method,” Journal of Computer Science, vol. 10, no. 4, pp. 705–715, 2014. [Google Scholar]
21. G. G. Devi and C. P. Sumathi, “Text extraction from images using gamma correction method and different text extraction methods—A comparative analysis,” in Proc. ICES, Chennai, India, pp. 1–5, 2014. [Google Scholar]
22. J. C. Wu, J. W. Hsieh and Y. S. Chen, “Morphology based text line extraction,” Machine Vision and Applications, vol. 19, pp. 195–207, 2008. [Google Scholar]
23. A. Boudabous, M. A. Ben Atitallah, R. Kachouri and A. Ben Atitallah, “HW/SW design and FPGA implementation of the GCM for an efficient text extraction from complex images,” International Journal of Scientific & Technology Research, vol. 9, no. 3, pp. 6572–6581, 2020. [Google Scholar]
24. M. A. Ben Atitallah, R. Kachouri, A. Ben Atitallah and H. Mnif, “An efficient HW/SW design for text extraction from complex color image,” Computers, Materials & Continua, vol. 71, no. 3, pp. 5963–5977, 2022. [Google Scholar]
25. N. M. Zaitoun and M. J. Aqel, “Survey on image segmentation techniques,” Procedia Computer Science, vol. 65, pp. 797–806, 2015. [Google Scholar]
26. R. M. Haralick, K. Shanmugam and I. Dinstein, “Textural features for image classification,” IEEE Transactions on Systems Man and Cybernetics, vol. SMC-3, no. 6, pp. 610–621, 1973. [Google Scholar]
27. R. Smith, “An overview of the tesseract OCR engine,” in Proc. ICDAR, Curitiba, Brazil, pp. 629–633, 2007. [Google Scholar]
28. R. W. Smith, “Hybrid page layout analysis via tab-stop detection,” in Proc. ICDAR, Barcelona, Spain, pp. 241–245, 2009. [Google Scholar]
29. Tesseract-OCR release 5.2.0, [Online]. Available: https://github.com/tesseract-ocr/tesseract [Google Scholar]
30. C. K. Chng, Y. Liu, Y. Sun, C. C. T. Ng, C. Luo et al., “ICDAR2019 robust reading challenge on arbitrary-shaped text-RRC-ArT,” in Proc. ICDAR, Sydney, NSW, Australia, pp. 1571–1576, 2019. [Google Scholar]
31. S. Huang, M. Huang, Y. Zhang, J. Chen and U. Bhatti, “Medical image segmentation using deep learning with feature enhancement,” IET Image Processing, vol. 14, no. 14, pp. 3324–3332, 2022. [Google Scholar]
Cite This Article
 Copyright © 2023 The Author(s). Published by Tech Science Press.
This work is licensed under a Creative Commons Attribution 4.0 International License , which permits unrestricted use, distribution, and reproduction in any medium, provided the original work is properly cited.
 Downloads
 Citation Tools