
 Submit a Paper
 Propose a Special lssue
 Open Access
ARTICLE

Nonlinear Teager-Kaiser Infomax Boost Clustering Algorithm for Brain Tumor Detection Technique
1 Computer Science and Engineering, Amrita College of Engineering and Technology, Nagercoil, 629901, India
2 Information Technology, K. C College of Engineering and Management Studies and Research, Thane, India
3 Computer Science and Engineering, NPR College of Engineering and Technology, Dindigul, 629902, India
* Corresponding Author: P. M. Siva Raja. Email:
Computer Systems Science and Engineering 2023, 46(2), 2589-2599. https://doi.org/10.32604/csse.2023.028542
Received 12 February 2022; Accepted 29 June 2022; Issue published 09 February 2023
 View Full Text
 Download PDF
Abstract
Brain tumor detection and division is a difficult tedious undertaking in clinical image preparation. When it comes to the new technology that enables accurate identification of the mysterious tissues of the brain, magnetic resonance imaging (MRI) is a great tool. It is possible to alter the tumor’s size and shape at any time for any number of patients by using the Brain picture. Radiologists have a difficult time sorting and classifying tumors from multiple images. Brain tumors may be accurately detected using a new approach called Nonlinear Teager-Kaiser Iterative Infomax Boost Clustering-Based Image Segmentation (NTKFIBC-IS). Teager-Kaiser filtering is used to reduce noise artifacts and improve the quality of images before they are processed. Different clinical characteristics are then retrieved and analyzed statistically to identify brain tumors. The use of a BraTS2015 database enables the proposed approach to be used for both qualitative and quantitative research. This dataset was used to do experimental evaluations on several metrics such as peak signal-to-noise ratios, illness detection accuracy, and false-positive rates as well as disease detection time as a function of a picture count. This segmentation delivers greater accuracy in detecting brain tumors with minimal time consumption and false-positive rates than current state-of-the-art approaches.Keywords
Tumors in the brain are generated by the growth of abnormal cells, which then spread to other parts of the brain. It may be caused by abnormal cell development in the brain. Brain tumor detection and division is a difficult tedious undertaking in clinical image preparation. When it comes to the new technology that enables accurate identification of the mysterious tissues of the brain, MRI is a great tool. It is possible to alter the tumor’s size and shape at any time for any number of patients by using the brain picture. Radiologists have a difficult time sorting and classifying tumors from multiple images.
Reference [1] shows that Tumors are classified as either malignant or noncancerous. It has been proved that the third level of brain tumors is also malignant, which leads to death, much as the greatest degree of cancer. Early detection and treatment are critical for patients [2]. Both benign and malignant brain tumors are regarded to constitute a threat. At long last, the tumor spreads to the brain, where it may smooth out the other growth in the region. It is possible to have a primary tumor and a secondary one in the same brain. The original tumor originates in the brain tissues, whereas the secondary tumor spreads to the skull from other areas of the body [3]. Additionally, MRI is used to identify cancers since it offers information on the organization of human soft tissue that is engaged in radiography, which may help to understand the human body’s structure [4]. Because of its ability to shift between different soft tissues, MRI is more important and beneficial in medical imaging. In addition, the MRI picture carries the tumor’s information along with it. As one of the most effective medical imaging procedures, the MRI stands out among the many options available today.
The MRI is used extensively in advanced neuroscience research to analyze the brain’s structure and function. Soft tissue structure may be shown clearly in MR pictures. Also, MR imaging has greatly improved the ability to identify and document brain disease. Computerized image analysis methods are needed because the amount of data for human interpretation is too large [5]. The MRI scan is regarded as superior to the CT scan because it has a great ability to see soft tissue [6]. MR images are more often used for the site identification and growth imaging of brain tumors because of their increased precision [7]. While CT and X-ray pictures are rigid, MR images are more flexible [8]. Because radiation is harmful to the human body, MR pictures offer the benefit of not relying on it. In addition, for MRI classification, knowledge-oriented systems, atlas approaches, shaped techniques, fuzzy schemes, variation segmentation, and neural networks are used [9]. Two well-established techniques supervised and unsupervised procedures, are used for MRI classification. The Supervised processes combine the k-nearest neighbors, the Artificial Neural Network (ANN), and the support vector machine. Fuzzy c-means plus a self-organization map make up the unsupervised technique. The supervised and unsupervised MRI classification approach has been applied in many studies [10].
The ability to withstand numerous MRI protocols and get protocol certifications for a variety of pictures [11]. MR images are utilized to identify the tumor component by injecting a different product into the tumor sector [12]. The most recent medical imaging inquiry has encountered some challenges in recognizing the brain tumor in MR pictures. Among many patients, tumor tissue may be distinguished from normal tissue, although most of the time the two are linked. The anatomical structure of the tissue may be precisely seen using MR imaging [13]. The information obtained by MR imaging is particularly helpful in the detection of a brain tumor [14]. When using a computer-assisted clinical tool to diagnose a brain tumor, the MR images must be segmented precisely. The segmentation of a brain picture is required for the detection of a brain tumor of some kind.
The task of manually segmenting MRI scans of the brain requires considerable expertise. Furthermore, for this, non-uniform segmentation, a lot of time, a non-repeatable assignment, and segmentation results are required. There are situations when a computer-assisted tool may be quite helpful in this regard [15].
An area of ongoing study in the field of computerized medical diagnosis is brain tumor segmentation, which has a high fatality rate because of brain tumors in MR images. Select findings from the calculated tomography are shown in the MRI. Also, it gives a large variance across numerous soft tissues of the human body in computerized medical diagnostic systems. As time goes on, the MRI will be much more useful for brain and cancer imaging [16]. An MRI image’s characteristics are regarded as significant since they represent a picture in its smallest form. Classifiers may classify tumors as normal or malignant using additional feature extraction techniques [17]. In this case, the MRI is the preferred medical imaging technique, with the image focusing on soft tissues including tendons, ligaments, and brain tissue. With MRI, you do not have to worry about being harmed in any way. This categorization method has been used by several researchers in the classification of medical pictures. MRI, X-ray, Computed Tomography (CT), and Positron Emission Tomography (PET) are all now used to identify tumours, but the MRI imaging approach is considered to be the best because of its enhanced decision-making capabilities. k-NN Based Classification of Brain MRI Images were introduced in [18] to categorize the benign or malignant tumor. However, the disease detection time was higher. Tumors may be identified using the MRI approach [19]. The radiologists review the MRI to identify the presence of abnormalities based on the visual clarity of the images [20]. To reduce the dimension of the 3D model was proposed the data are projected to the low-dimensional subspace to reduce the complexity of data processing using the principal component analysis (PCA) model. A two-stage reversible robust audio watermarking algorithm is proposed to protect medical audio data. The scheme decomposes the medical audio into two independent embedding domains, embeds the robust watermark and the reversible watermark into the two domains respectively.
The random discrete doping (RDD) [21] in the active device area is used to derive an analytical model to compute the standard deviation, σVth, RDD of the Vth-distribution for any arbitrary channel doping profiles. However, improved device performance tends to offer lower Vth variability. Medical image processing made [22] it possible to diagnose various dangerous diseases like cancer and tumor at an early stage. But extracting the correct boundaries of the infected region through segmentation is a major challenge. Machine learning tools and optimization methods are analysis of biomedical signals that greatly benefits the healthcare sector by improving patient outcome through early, reliable detection.
Medical imaging is the practice of capturing pictures of the human body’s interior organs to aid in the diagnosis of disease. Using these pictures, clinicians can more easily identify the widest range of brain tumor types. As a result of the optic nerves being damaged, Brain tumor is the main cause of memory loss. Because repairing injured optic nerves is so difficult, early diagnosis of Brian tumors is particularly important. As a result, it is essential to identify automatic detection of brain’s tumor. Conventionally, the identification of brain tumors using various machine learning algorithms is quite common. However, it is still inefficient in terms of addressing the issue of precise detection while using the least amount of time possible. Brain tumor identification is carried out using NTKFIBC-IS, an effective segmentation approach.
Fig. 1 depicts the suggested NTKFIBC-IS method for detecting illness properly by image segmentation, as shown. An MRI image dataset is used to count the number of MRI pictures. After the pictures are collected, the Nonlinear Teager-Kaiser filtering approach is used to reduce noise artifacts and improve image quality for precise illness detection. The Infomax boost clustering algorithm is then used to separate the picture into its component components and extract the area of interest. Afterward, the picture feature is retrieved from the inputs. As a final step, all the retrieved characteristics are compared to the illness feature that is being tested. As a consequence, the MRI pictures of brain’s tumor illness have been recognized as normal. Following is a breakdown of the steps involved in implementing the NTKFIBC-IS approach as outlined above.
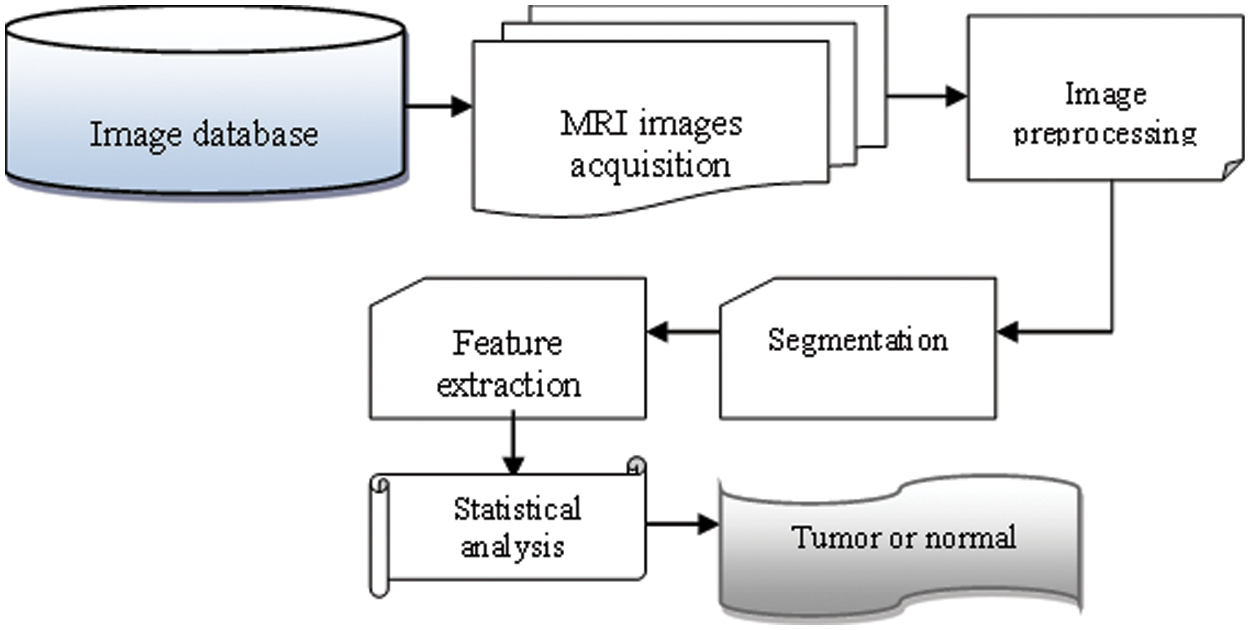
Figure 1: Flow process of the NTKFIBC-IS technique
2.1 Nonlinear Teager-Kaiser Filtering Technique
The first step of the proposed NTKFIBC-IS technique is image preprocessing to obtain the contrast enhancement image for accurate brain tumor detection. The contrast enhancement is obtained using the Nonlinear Teager-Kaiser filtering technique.
Let us consider the input funds images ‘
From (1),
From (2),
In the above Eq. (3),
2.2 Infomax Boost Clustering-Based Image Segmentation
When a group of pixels with similar features are used to separate a picture, this technique is known as image segmentation. There is a wide range of uses for this technology, from compressing images and identifying objects to identifying diseases and other diseases. To process a whole picture using this method would be very inefficient. Images may then be segmented for further processing using image segmentation. Using the Infomax boost clustering algorithm, images may be segmented for further analysis.
The infomax boost clustering is a machine learning ensemble technique that provides strong clustering results by combing the weak hypothesis. A weak hypothesis is a base clustering technique that provides slightly accurate results. On the contrary, a boost clustering technique provides well-correlated results with the true output results. Therefore, the proposed technique uses the ensemble clustering technique to improve brain’s tumor detection accuracy and minimizes time consumption.
The ensemble technique uses mutual informative k means the clustering technique is a weak hypothesis. Clustering is the method of grouping similar pixels into dissimilar clusters. Initialize the ‘k’ number of clusters
From (4),
where, D indicates a gradient ascent function,
where W denotes strong clustering results, and
where
In (8),
Experimental analysis of the proposed NTKFIBC-IS technique is used in two existing systems [1] and [2]. The use of a BraTS2015 database enables the proposed approach to be used for both qualitative and quantitative research. This dataset was used to do experimental evaluations on several metrics such as peak signal-to-noise ratios, illness detection accuracy, and false-positive rates as well as disease detection time as a function of a picture count. This segmentation delivers greater accuracy in detecting brain tumors with minimal time consumption and false-positive rates than current state-of-the-art approaches.
BraTS2015
The annual undertaking of BraTS (Brain Tumor Segmentation using Multimodal Techniques) since 2012 following the MICCAI session. Different low-and high-grade gliomas in the brain are used for training in the BraTS2015, along with mixed high-and low-grade brain pictures for assessment. Skull-removed photos play a role in the proposed work. Accordingly, a few statistical parameters are given high regard by incorporating the results of segmentation into the supplied BraTS system.
The suggested NTKFIBC-IS methodology and the two associated techniques have been quantitatively analyzed using various quantitative metrics, such as the peak signal-to-noise ratio, illness diagnosis accuracy, false-positive rate, and detection time.
The mean square error of the difference between the original noisy picture and the quality-enhanced image is used to calculate the peak signal-to-noise ratio. The following is the formula for calculating the mean square error and the peak signal to noise ratio.
where,
Disease Detection Accuracy is defined as the ratio of several MRI images accurately detected as brain tumor or normal from the total number of MRI images.” Therefore, the accuracy of disease detection is mathematically expressed as follows,
When N is the total number of fundus photos, and Ka is the number of fundus images successfully diagnosed as brain tumor or normal, the value of DDA reflects the disease detection accuracy, and N is the total number of fundus images. Accuracy in illness detection is assessed in percentages (percent).
Time spent by an algorithm to identify a picture as normal or glaucoma may be used to measure illness detection time. Therefore, the overall disease detection time is expressed as follows,
where,
Table 1 shows the peak signal-to-noise ratio performance analysis with different picture sizes derived from the ARIMA database. The 10 distinct peak signals to noise ratios for each approach are shown in the table value.
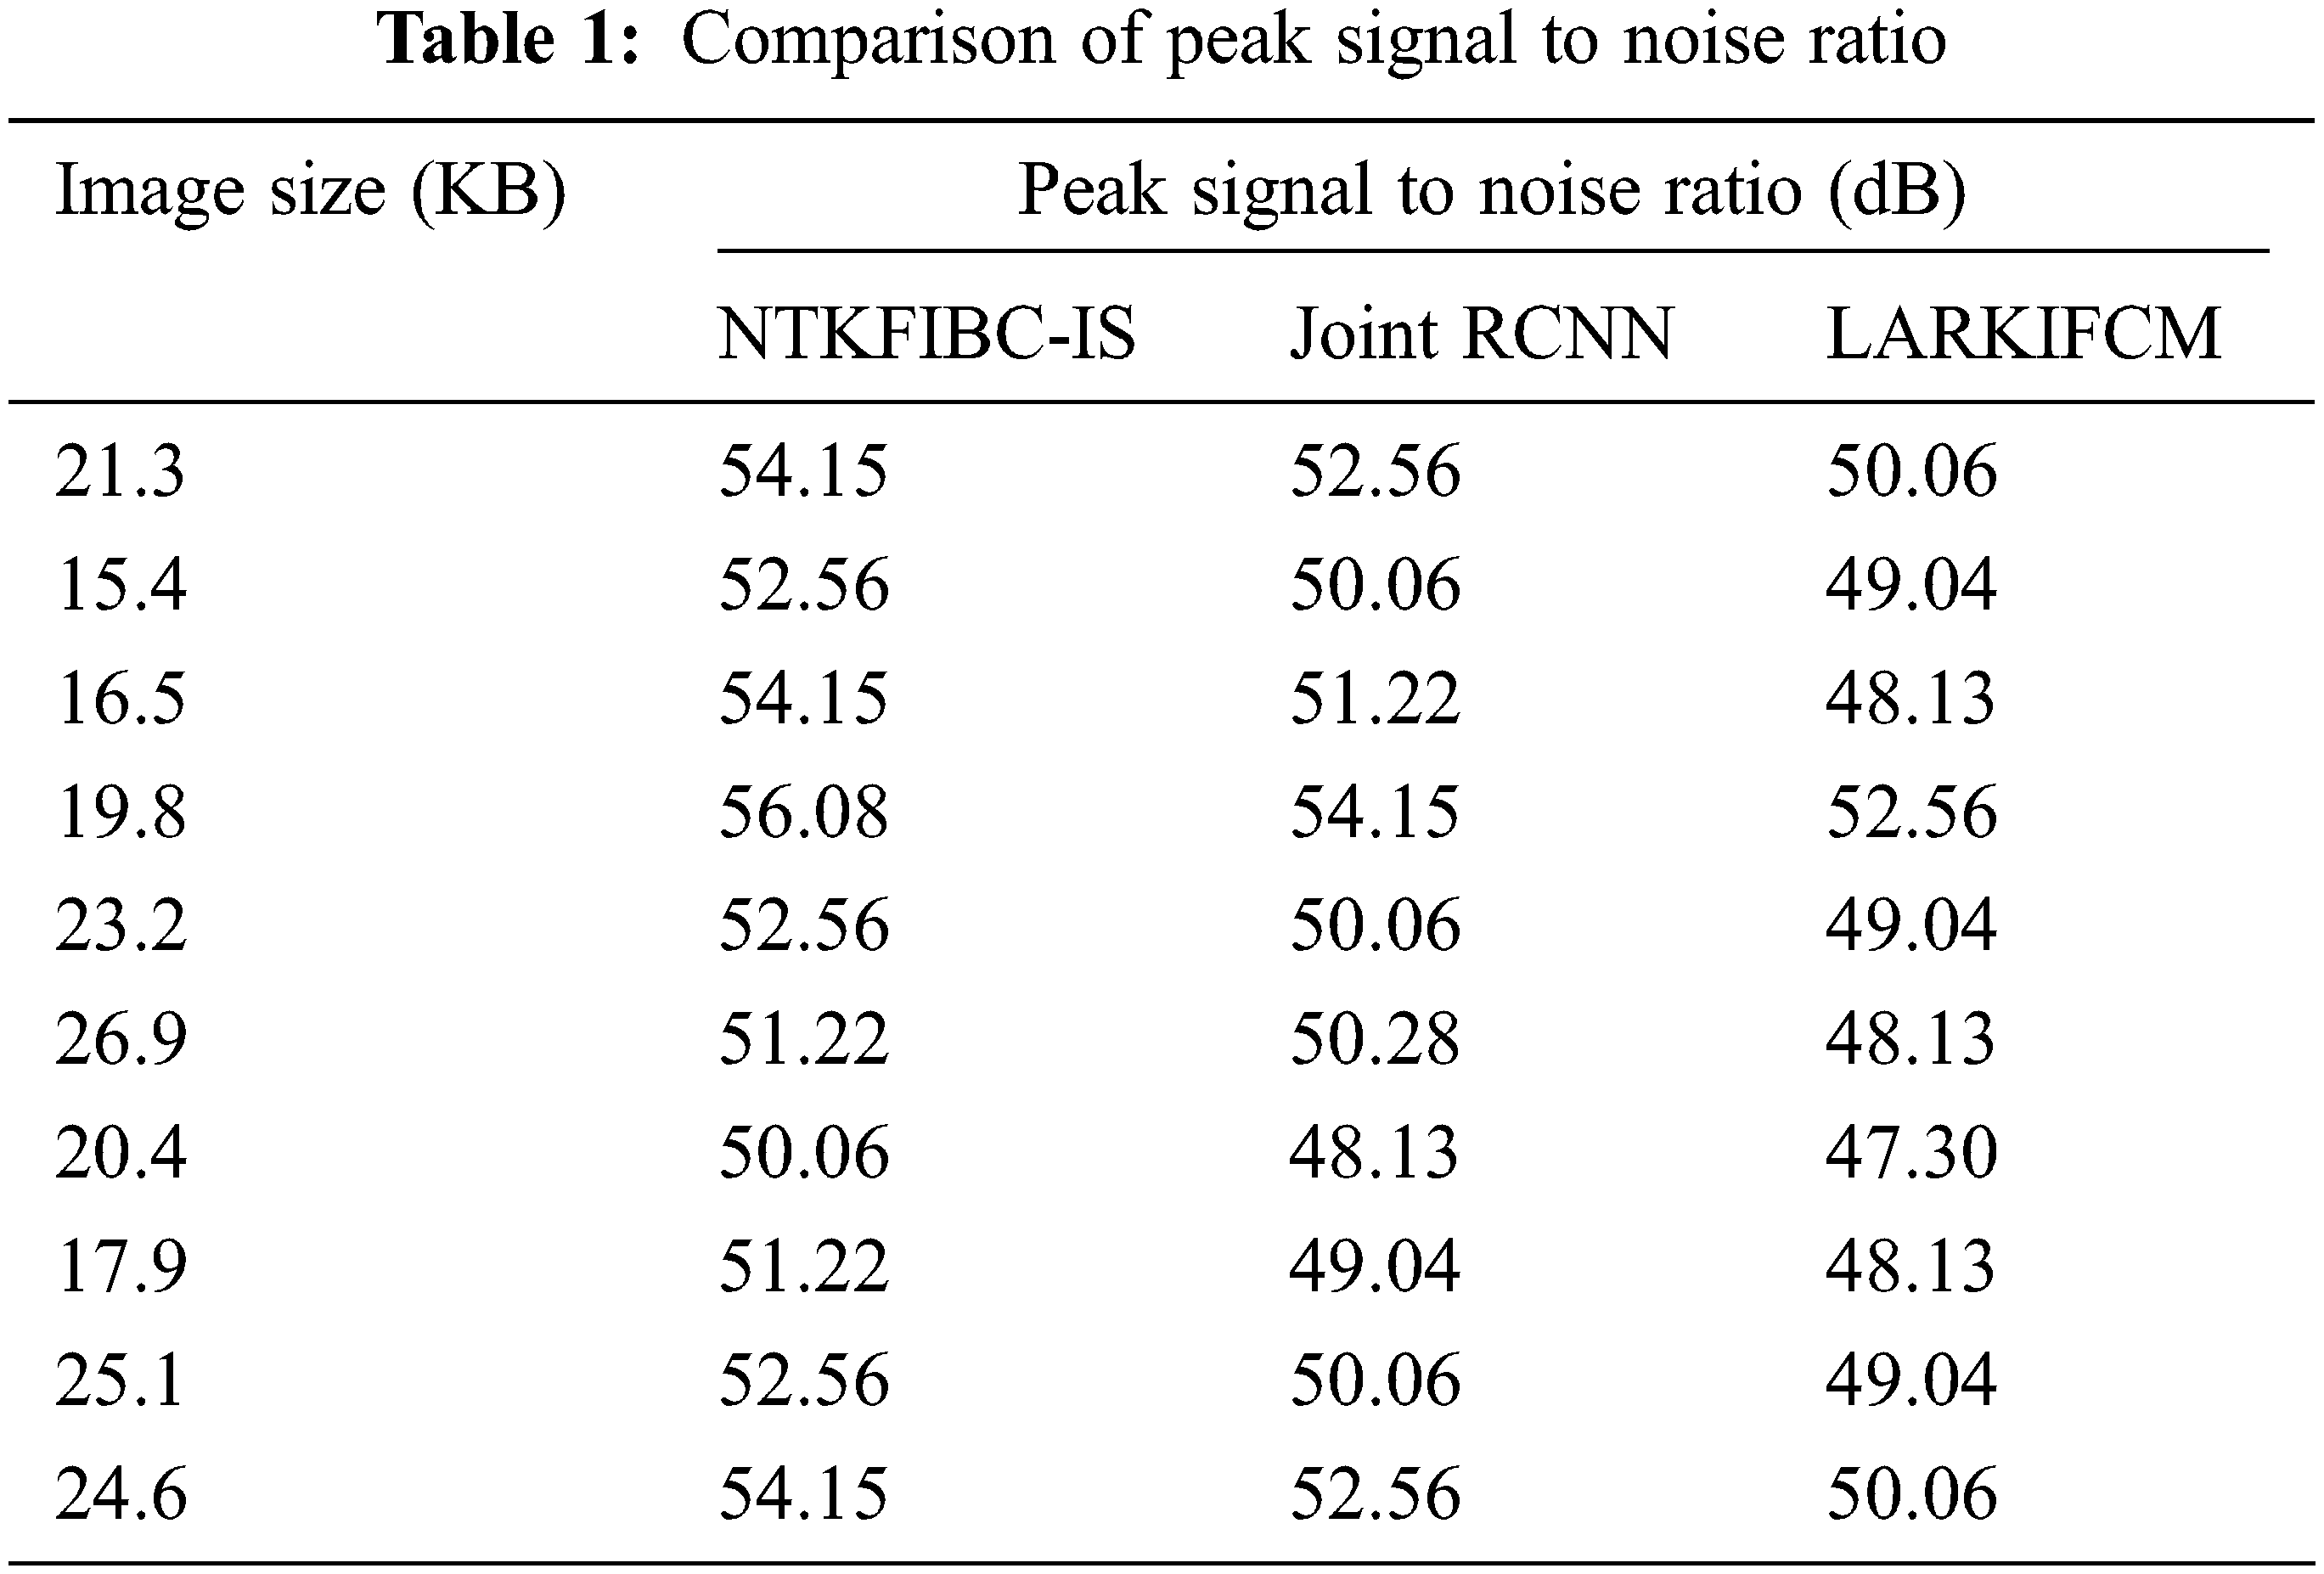
The findings show that the NTKFIBC-IS methodology outperforms the other two techniques currently in use. For the sake of determining the peak signal-to-noise ratio, we will use the 21.3 KB picture. The NTKFIBC-IS approach has a mean square error of 0.25 and a peak signal to noise ratio of 54.15 dB. The mean square error and the peak signal to noise ratio are 0.36 and 52.56 dB, respectively, when using the Joint CNN [1]. Similarly, LARKIFCM [2] has a mean square error of 0.64 and a PSNR of 50.06 dB. The NTKFIBC-IS method has a lower mean square error and a greater peak signal-to-noise ratio, as shown by the statistics. As a consequence, 10 distinct outcomes may be found for each approach. There is a comparison of NTKFIBC-IS a finding with previously observed results. Averaging 10 findings, the NTKFIBC-IS approach improves the peak signal-to-noise ratio by 4% in comparison to [1] and 8% when compared to [2].
Fig. 2 shows the comparison of peak signal to noise ratio using three distinct methodologies. The following graph shows that the peak signal-to-noise ratio and the various retinal picture sizes as supplied in the horizontal direction may be examined on the vertical axis. The graph is non-linear because the input picture has varying degrees of noise. The two-dimensional graph shows that the suggested strategy improves performance outcomes when compared to the two previous approaches. For this enhancement, the Nonlinear Teager-Kaiser filtering method is used to eliminate noise artifacts from the original picture. Noiseless pixels are eliminated from the retinal picture in this procedure. This improves the image’s quality while also reducing the mean square error.
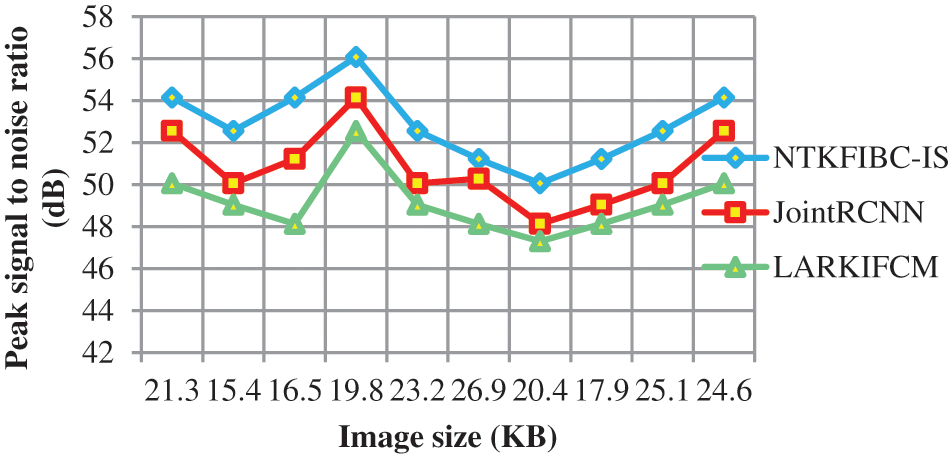
Figure 2: Graphical representation of the peak signal to noise ratio
Table 2 compares illness detection accuracy with the number of retinal pictures obtained from 10 to 100. Various methods provide different levels of precision. The obtained results show that the suggested NTKFIBC-IS method outperforms well in terms of obtaining greater accuracy. Ten retinal photos from the ARIMA database are here for consideration. For eight out of the ten photos, glaucoma or normal vision may be accurately identified at an average of 80 percent. The other two approaches [1,2] have an accuracy of 70% and 60%, respectively. The NTKFIBC-IS approach used in this statistical study delivers more accurate findings than the others. As with nine runs, different input picture counts are used for testing. In this comparison, the total observed NTKFIBC-IS findings are compared to the accuracy of the current results. When compared to conventional JointRCNN [1], LARKIFCM [2], the NTKFIBC-IS approach improves illness detection accuracy by 6% and 11%, respectively.
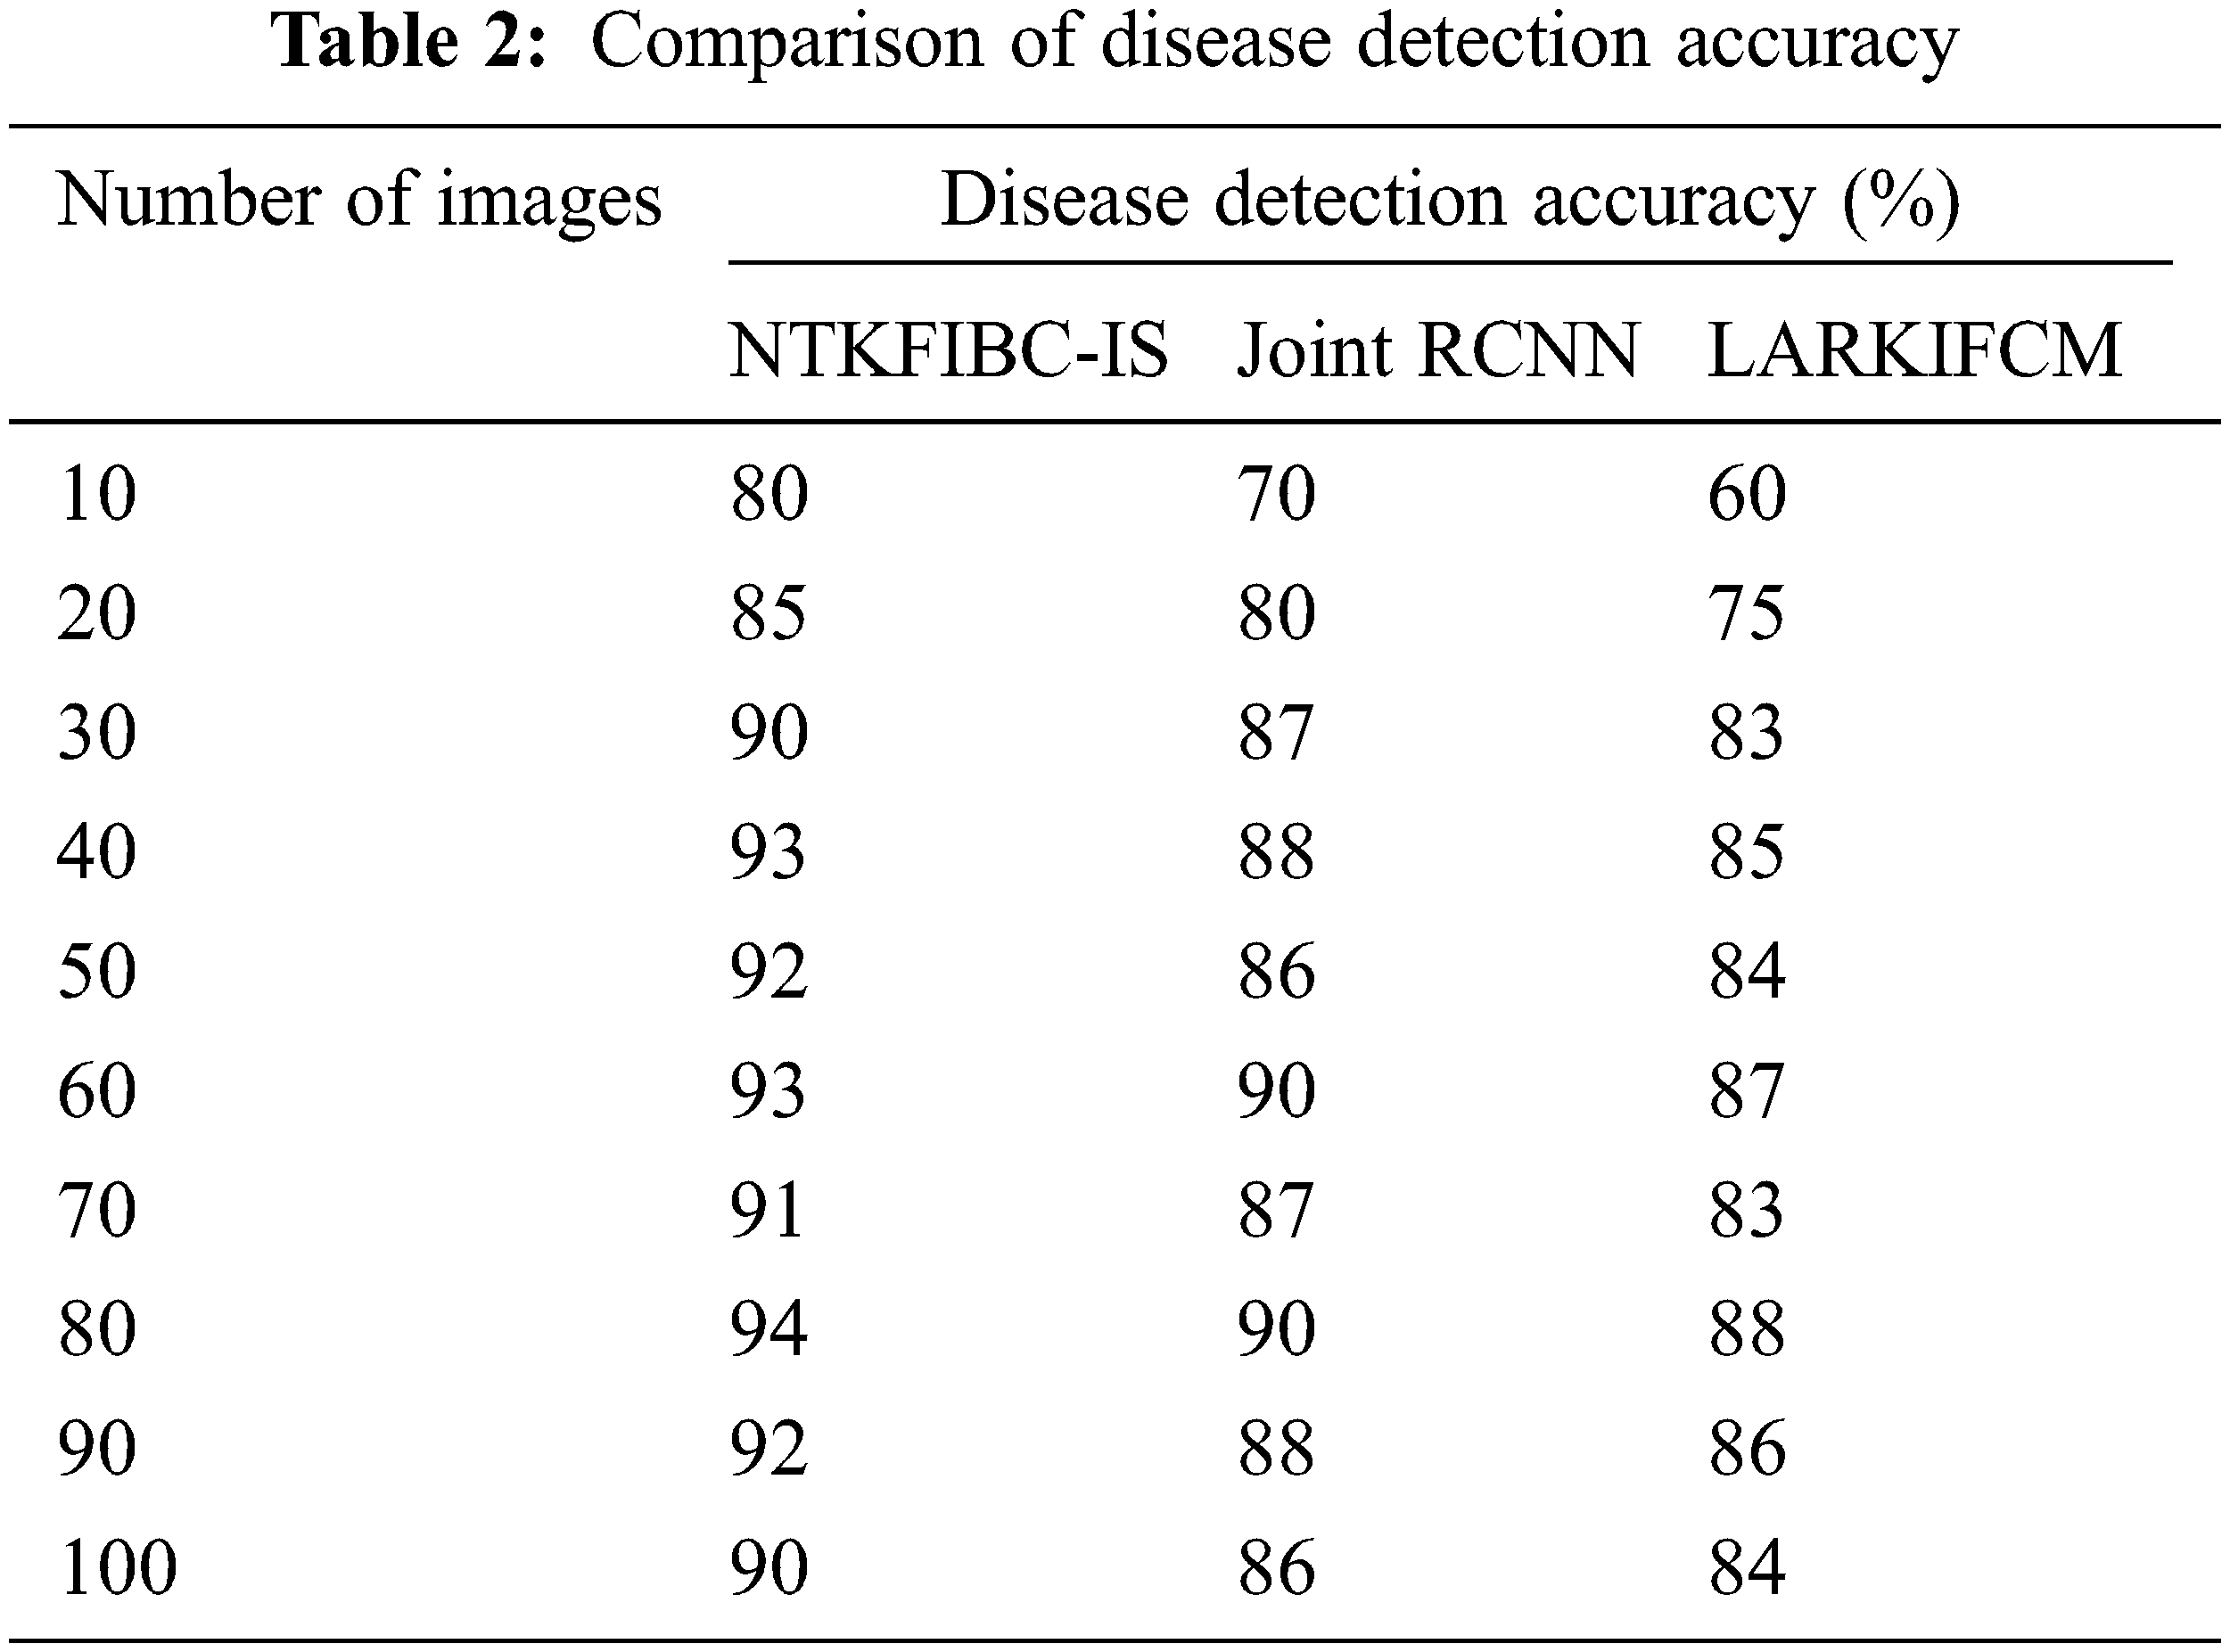
It is shown in Fig. 3 that the illness detection accuracy of 100 eye retinal pictures. As can be seen from the accompanying graphs, the accuracy varies depending on the number of input photographs. The suggested NTKFIBC-IS methodology has the best illness detection accuracy among the three techniques. Infomax Boost Clustering Based Segmentation and feature extraction are used to get these results. Image segmentation is done using a clustering approach known as an ensemble. The clinical characteristics are extracted from the image’s area of interest, which is determined using the segmented findings. It is determined whether or not the picture contains evidence of glaucoma using the estimated feature value.
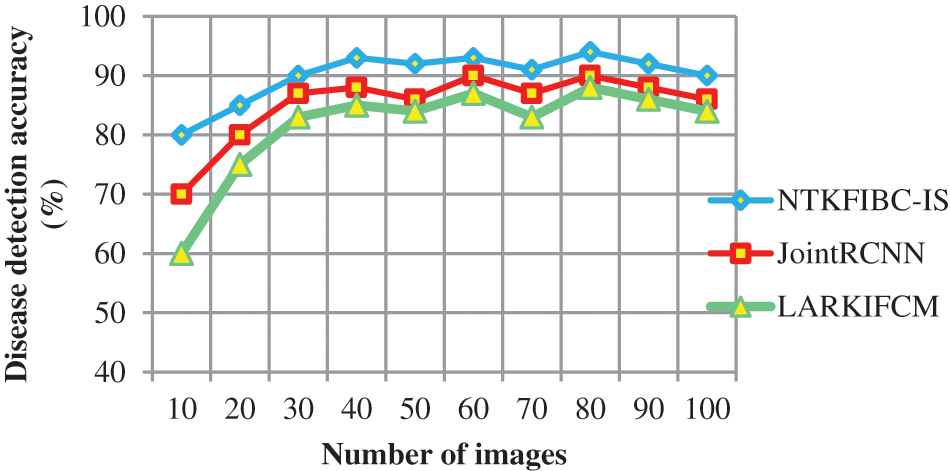
Figure 3: Graphical representation of the disease detection accuracy
Table 3 and Fig. 4 show the findings of illness detection time vs. the number of retinal pictures acquired from the ARIMA database. A shorter detection time may be achieved via preprocessing and segmentation, as shown by the observed outcomes. Detecting illness with accuracy takes longer because of the increased noise in the input photos In addition; illness diagnosis is conducted using the whole picture, which takes longer to identify the supplied input image. Partitioning the input picture into parts solves this issue. For picture segmentation, the infomax boost clustering method is used. Glaucoma illness detection time is also reduced as a result of this.
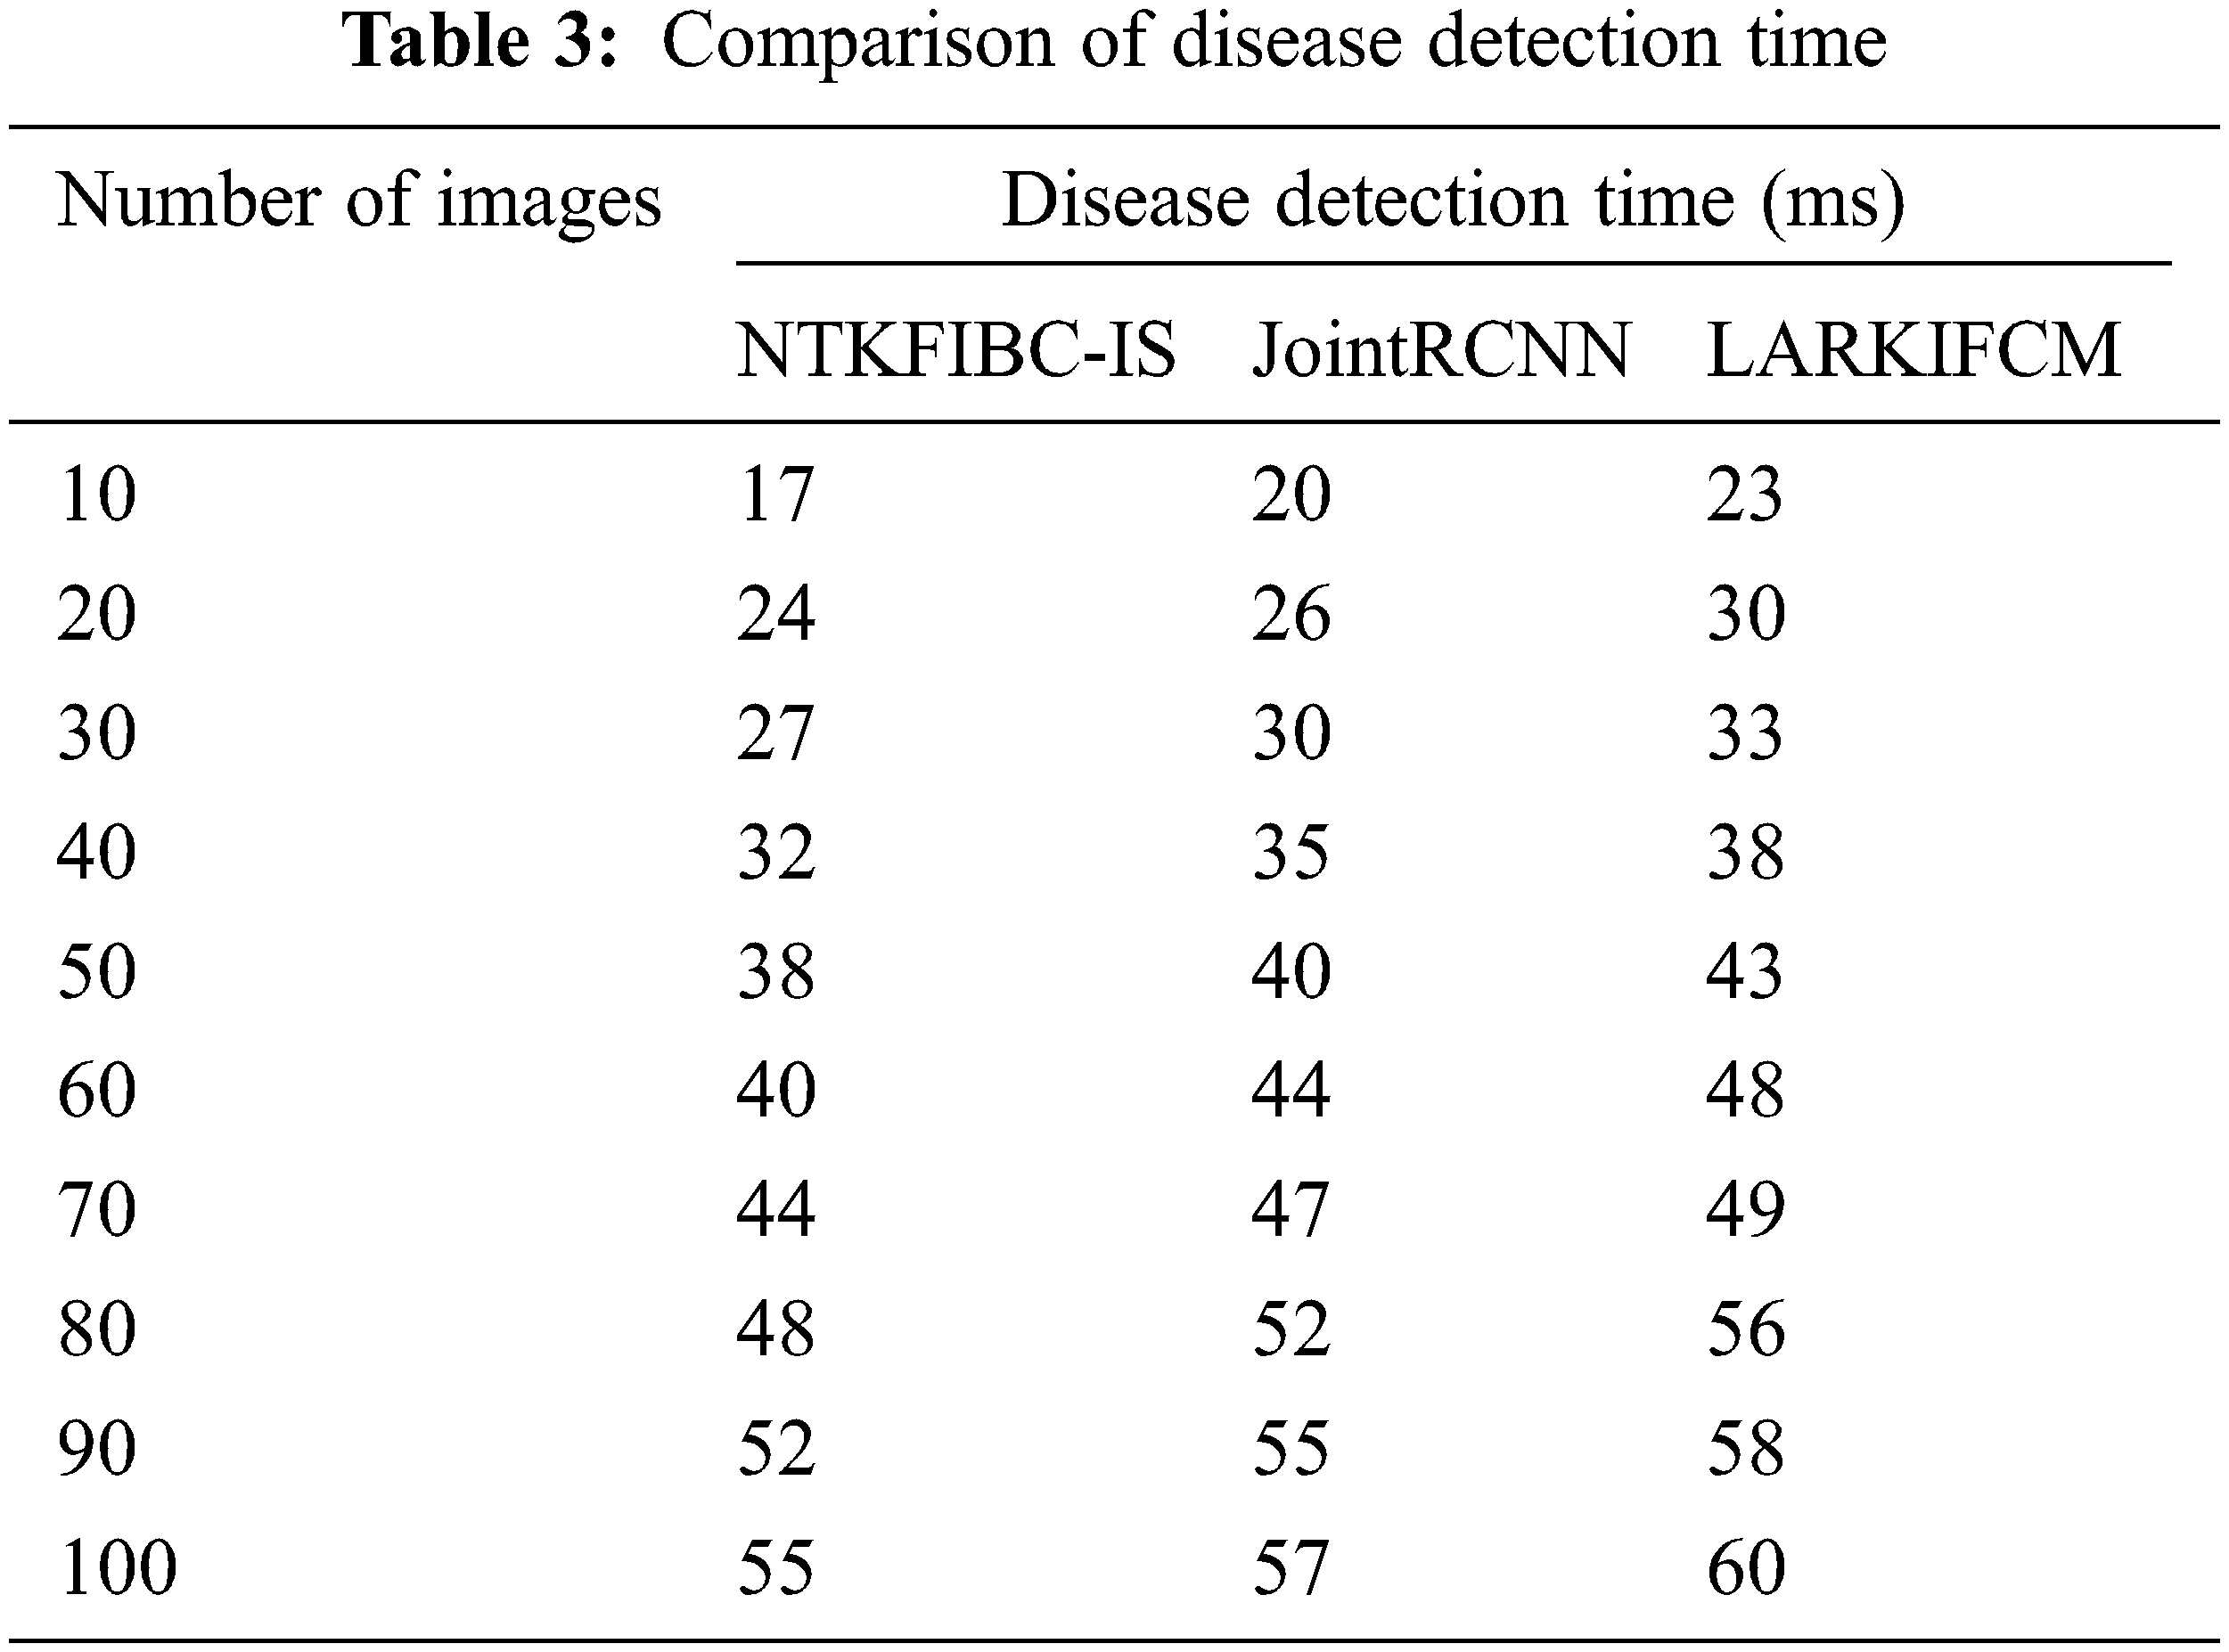
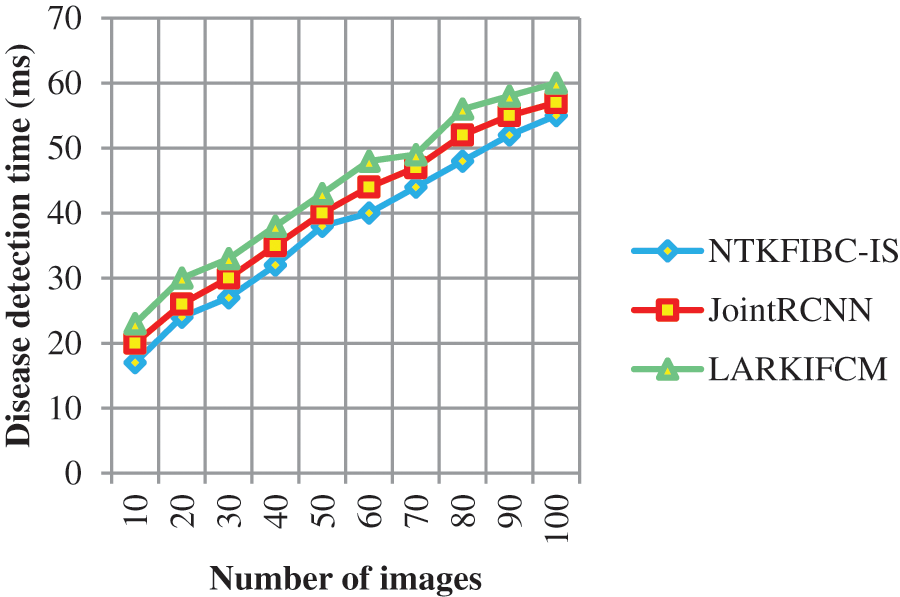
Figure 4: Graphical representation of the disease detection time
The illness detection time may be calculated using 10 retinal pictures in the first run. The illness detection times of [1] and [2] are 20 ms and 23 ms, respectively, but the NTKFIBC-IS approach takes 17 ms to complete. Additionally, each of the nine runs is conducted with a distinct number of retinal pictures. Results of the proposed NTKFIBC-IS methodology are compared to those of current techniques. A comparison of the NTKFIBC-IS approach with the two most recent techniques, JointRCNN [1] and LARKIFCM [2], shows an 8 percent and a 15 percent reduction in the time required to identify sickness.
The NTKFIBC-IS approach is obtained by automated screening systems to identify brain tumors, which is more accurate for early detection and tumor identification. To begin, the NTKFIBC-IS method uses nonlinear filtering to minimize the noise in the input MRI image and thus enhance image contrast. Once the preprocessed MRI image has been cleaned up, an ensemble clustering-based segmentation procedure is used to extract the most interesting parts of the area. Finally, the image’s segmented portion is used to remove clinical characteristics that are next compared to a specified threshold value. As a consequence, photos of a normal brain tumor or a Brian tumor are appropriately identified. A picture database is used to undertake a complete experimental assessment. Analysis of the quantitative and qualitative performance of NTKFIBC-IS and other approaches is performed. The systematic quantitative findings confirmed to the NTKFIBC-IS methodology was implemented better than other relevant techniques in terms of improved illness diagnosis accuracy and shorter disease detection time.
Funding Statement: The authors received no specific funding for this study.
Conflicts of Interest: The authors declare that they have no conflicts of interest to report regarding the present study.
References
1. M. Soltaninejad, G. Yang, T. Lambrou, N. Allinson and T. L. Jones, “Supervised learning based multimodal mri brain tumor segmentation using texture features from supervoxels,” Computer Methods and Programs in Biomedicine, vol. 157, pp. 64–89, 2018. [Google Scholar]
2. I. E. Kaya, A. C. Pehlivanlı, E. G. Sekizkardeş and T. Ibrikci, “Pca based clustering for brain tumor segmentation of t1w mri images,” Computer Methods and Programs in Biomedicine, vol. 140, pp. 19–28, 2016. [Google Scholar]
3. A. P. Hagargi and D. C. Shubhangi, “Brain tumour detection and art classification technique in mr brain images using rpcaqt decomposition,” International Research Journal of Engineering and Technology (IRJET), vol. 5, no. 4, pp. 1–9, 2018. [Google Scholar]
4. C. R. Rao, M. N. V. S. S. Kumar and G. S. B. Rao, “A novel segmentation algorithm for feature extraction of brain MRI tumor,” Information and Decision Sciences, vol. 701, pp. 455–463, 2018. [Google Scholar]
5. M. Latha and R. Surya, “Brain tumour detection using neural network classifier and k-means clustering algorithm for classification and segmentation,” International Journal of Computing Algorithm, vol. 5, pp. 37–40, 2016. [Google Scholar]
6. N. Manasa, G. Mounica and B. D. Tejaswi, “Brain tumour detection based on canny edge detection algorithm and its area calculation,” Physics and Computer Science, vol. 5, pp. 2347–8527, 2016. [Google Scholar]
7. R. Lavanyadevi, M. Machakowsalya, J. Nivethitha and A. N. Kumar, “Brain tumor classification and segmentation in mri images using pnn,” in 2017 IEEE Int. Conf. on Electrical, Instrumentation, and Communication Engineering (ICEICE), Karur, India, pp. 1–6, 2017. [Google Scholar]
8. D. Desai and N. Chapatwala, “Brain extraction methods for magnetic resonance images (mri),” International Journal of Innovative Research in Electrical, Electronics, Instrumentation and Control Engineering, vol. 4, no. 5, pp. 1–6, 2016. [Google Scholar]
9. A. V. Prabu, A. Bharti, N. Guru and S. Tripathy, “Brain tumour detection in mri images using matlab,” International Journal of Scientific Research in Science, Engineering, and Technology, vol. 2, no. 2, pp. 1230–1233, 2016. [Google Scholar]
10. D. N. George, H. B. Jehlol and A. S. A. Oleiwi, “Brain tumour detection using shape features and machine learning algorithms,” International Journal of Advanced Research in Computer Science and Software Engineering, vol. 6, no. 12, pp. 454–459, 2015. [Google Scholar]
11. N. Boughattas, M. Berar, K. Hamrouni and S. Ruan, “Feature selection and classification using multiple kernel learning for brain tumor segmentation,” in 2018 4th Int. Conf. on Advanced Technologies for Signal and Image Processing (ATSIP), Sousse, Tunisia, pp. 1–5, 2018. [Google Scholar]
12. S. T. Yassine, S. Sara, C. Bouchaib and R. Abdelilah, “A new fast brain tumor extraction method based on nl-means and expectation maximization,” in 2018 4th Int. Conf. on Optimization and Applications (ICOA), Mohammedia, Morocco, pp. 1–5, 2018. [Google Scholar]
13. G. Jothi and H. H. Inbarani, “Hybrid tolerance rough set–firefly based supervised feature selection for mri brain tumor image classification,” Applied Soft Computing, vol. 46, pp. 639–645, 2016. [Google Scholar]
14. S. Banerjee, S. Mitra and B. U. Shankar, “Automated 3d segmentation of brain tumors using visual saliency,” Information Sciences, vol. 424, pp. 337–353, 2018. [Google Scholar]
15. A. Mukaram, C. Murthy and M. Z. Kurian, “An automatic brain tumour detection segmentation and classification using MRI image,” Computer Science and Technology, vol. 6, no. 5, pp. 490–494, 2017. [Google Scholar]
16. G. B. Praveen and A. Agrawal, “Hybrid approach for brain tumor detection and classification in magnetic resonance images,” in 2015 Communication, Control and Intelligent Systems (CCIS), vol. 9, pp. 162–166, 2015. [Google Scholar]
17. T. Rajesh, R. S. M. Malar and M. R. Geetha, “Brain tumor detection using optimization classification based on rough set theory,” Cluster Computing, vol. 22, no. 1, pp. 1–7, 2019. [Google Scholar]
18. A. Arora, P. Roy, M. D. Shwetha, S. Venktesan and R. Babu, “K-NN based classification of brain mri images using dwt and pca to detect different types of brain tumour,” International Journal of Medical Research & Health Sciences, vol. 6, no. 9, pp. 15–20, 2017. [Google Scholar]
19. Praveen and A. Singh, “Detection of a brain tumor in mri images using a combination of fuzzy c-means and svm,” in 2015 2nd Int. Conf. on Signal Processing and Integrated Networks (SPIN), Noida, India, 2015. [Google Scholar]
20. A. Chinnu, “Mri brain tumor classification using svm and histogram-based image segmentation,” Chinnu A/ (IJCSIT) International Journal of Computer Science and Information Technologies, vol. 6, no. 2, pp. 1505–1508, 2015. [Google Scholar]
21. S. K. Saha, “Modeling statistical dopant fluctuations effect on threshold voltage of scaled JFET devices,” IEEE Access, vol. 4, pp. 507–513, 2016. [Google Scholar]
22. P. Juneja, S. Kaur, H. Sharma and P. Kumar, “Comparative analysis of various medical image segmentation methodologies in temporal order,” Journal of Natural Remedie, vol. 21, no. 2, pp. 170–177, 2020. [Google Scholar]
Cite This Article
 Copyright © 2023 The Author(s). Published by Tech Science Press.
This work is licensed under a Creative Commons Attribution 4.0 International License , which permits unrestricted use, distribution, and reproduction in any medium, provided the original work is properly cited.
 Downloads
 Citation Tools