
 Submit a Paper
 Propose a Special lssue
 Open Access
ARTICLE

Liver Tumor Decision Support System on Human Magnetic Resonance Images: A Comparative Study
1 Department of Biomedical Systems and Informatics Engineering, Yarmouk University 556, Irbid, 21163, Jordan
2 Department of Biomedical Engineering, Jordan University of Science and Technology, Irbid, 22110, Jordan
3 Department of Computer Engineering, Yarmouk University 556, Irbid, 21163, Jordan
4 The of Biomedical Technology, King Hussein Medical Center, Royal Jordanian Medical Service, Amman, 11855, Jordan
5 Faculty of Electrical Engineering & Technology, Campus Pauh Putra, Universiti Malaysia Perlis, Arau, 02600, Perlis, Malaysia
6 Faculty of Electronic Engineering & Technology, Campus Pauh Putra, Universiti Malaysia Perlis, Arau, 02600, Perlis, Malaysia
7 Advanced Computing, Centre of Excellence (CoE), Universiti Malaysia Perlis, Arau, 02600, Perlis, Malaysia
* Corresponding Author: Wan Azani Mustafa. Email:
Computer Systems Science and Engineering 2023, 46(2), 1653-1671. https://doi.org/10.32604/csse.2023.033861
Received 29 June 2022; Accepted 19 October 2022; Issue published 09 February 2023
 View Full Text
 Download PDF
Abstract
Liver cancer is the second leading cause of cancer death worldwide. Early tumor detection may help identify suitable treatment and increase the survival rate. Medical imaging is a non-invasive tool that can help uncover abnormalities in human organs. Magnetic Resonance Imaging (MRI), in particular, uses magnetic fields and radio waves to differentiate internal human organs tissue. However, the interpretation of medical images requires the subjective expertise of a radiologist and oncologist. Thus, building an automated diagnosis computer-based system can help specialists reduce incorrect diagnoses. This paper proposes a hybrid automated system to compare the performance of 3D features and 2D features in classifying magnetic resonance liver tumor images. This paper proposed two models; the first one employed the 3D features while the second exploited the 2D features. The first system uses 3D texture attributes, 3D shape features, and 3D graphical deep descriptors beside an ensemble classifier to differentiate between four 3D tumor categories. On top of that, the proposed method is applied to 2D slices for comparison purposes. The proposed approach attained 100% accuracy in discriminating between all types of tumors, 100% Area Under the Curve (AUC), 100% sensitivity, and 100% specificity and precision as well in 3D liver tumors. On the other hand, the performance is lower in 2D classification. The maximum accuracy reached 96.4% for two classes and 92.1% for four classes. The top-class performance of the proposed system can be attributed to the exploitation of various types of feature selection methods besides utilizing the ReliefF features selection technique to choose the most relevant features associated with different classes. The novelty of this work appeared in building a highly accurate system under specific circumstances without any processing for the images and human input, besides comparing the performance between 2D and 3D classification. In the future, the presented work can be extended to be used in the huge dataset. Then, it can be a reliable, efficient Computer Aided Diagnosis (CAD) system employed in hospitals in rural areas.Keywords
The liver is one of the essential organs in the human body. It forms most of the abdominal tissue and plays a vital role in removing toxins from the blood and balancing blood sugar levels. In addition, the liver regulates blood clotting and plays many vital roles in maintaining the balance in human beings. As a result, any abnormality in the liver will negatively affect the performance of the human body [1].
Liver cancer is the second leading cause of death worldwide [2]. Therefore, early diagnosis of liver cancer will lead to reduced mortality and increase the chances of survival. There are different types of liver tumors. Liver tumors may be benign or malignant. Benign tumors can be classified into Hepatocellular Adenoma (HCA) and Focal Nodular Hyperplasia (FNH). However, Hepatocellular Carcinoma (HCC) and Intrahepatic Cholangiocarcinoma (iCCA) are malignant tumors, while iCCA accounts for over 99% of primary liver cancer cases [3]. Various medical imaging techniques are used to acquire different images of the liver, such as MRI, Computed Tomography (CT), Positron Emission Tomography (PET), and Ultrasound.
MRI is recommended for tissue medical imaging because it provides differentiation between liver tissues, making the diagnosis of liver tumors uncomplicated. Dynamic Contrast-Enhanced-MRI (DCE-MRI) provides the most comprehensive information for differential diagnosis of liver tumors. DCE-MRI analyzes the temporal enhancement pattern of the tissue following the introduction of a paramagnetic Contrast Agent (CA) into the vascular system. The analysis is achieved via the acquisition of baseline images without contrast enhancement, followed by a series of images acquired over time (usually over a few minutes) during and after the arrival of the CA in the tissue of interest. The acquired signal is used to generate a so-called time-intensity curve for the tissue, which mirrors the tissue’s response to the arrival of CA in enhancement values. Simply said, a paramagnetic particle enters and disperses through the tissue and alters the MR Signal Intensity (SI) of the tissue depending on its local concentration.
Since the detection of liver tumors using MRI images depends on the radiologist’s expertise, this paper recommends a deep learning approach to reduce the human inputs in feature extraction, selection, and classification of the tumor type. This paper focuses on building a hybrid approach model that uses deep features besides 3D shape features and a 3D co-occurrence matrix for the tumor. This is to differentiate between four classes of liver tumors in 3D MRI and utilize the 2D deep learning features with 2D shape features and 2D co-occurrence matrix to classify 2D central slices MRI. CAD systems that use deep learning can help guide the radiologist and minimize misdiagnosis, including false-positive or false-negative rates. The novelty of this work appears in utilizing the benefits of Artificial Intelligence (AI) to develop a new CAD system that can distinguish accurately between different liver lesions without human input or image enhancement. This study compares the performance of using 2D and 3D features in classifying hepatic tumors.
Medical imaging plays a vital role in detecting body organ abnormalities. This section analyses and reviews current developments employing machine and deep learning techniques to detect liver cancer using Magnetic Resonance Imaging (MRI) scans. In 2018, Trivizakis et al. proposed a novel 3D Convolutional Neural Network (CNN) to differentiate primary and metastatic tumors using 130 liver MRI scans. The model consisted of four convolutional layers, followed by a fully-connected layer with 2048 neurons and one softmax layer. The dataset contained 37.7% primary and 62.3% metastatic tumors acquired from a Greek hospital, and the results showed significant improvement in 3D accuracy (83%) compared to original-slice 2D classification accuracy (67.4%) [4].
In 2020, Zhen et al. used 31,608 images to train a Convolutional Neural Network (CNN) that can discriminate between two types and seven types of tumors and used 6,816 images to validate the model. Model D, which performs the binary classification problem using unenhanced images, achieved an AUC of 0.9416%, 90.9% sensitivity, 94.1% specificity, and 93% accuracy. The seven classes problem achieved an accuracy at par with the results obtained from three experienced radiologists [5]. Moreover, Naeem et al. developed a machine learning algorithm for liver cancer classification that uses fused CT and MRI images. The dataset they used was acquired from Bahawal Victoria Hospital in Pakistan, which used various machine learning classifiers like J48, Multiple Layer Perceptron (MLP), Random Forest (RF), and Support Vector Machine (SVM). Using 10-fold cross-validation, MLP showed an overall accuracy of 95.78% in discriminating between 6 liver types of cancer [6].
In 2020, Hamm et al. engineered a custom CNN to discriminate between six common hepatic lesions. They used 494 MRI scans divided into 434 training and 60 validation images. They also used data augmentation techniques and Monte Carlo cross-validation. The deep learning system demonstrated 92% accuracy, 98% specificity, and 92% sensitivity. Computation time per lesion was 5.6 milliseconds [7,8]. Furthermore, Kim et al. used 54,900 images from 549 patients to train a CNN-based automatic system to detect and classify Hepatocellular Carcinoma (HCCs). The system achieved 90% accuracy, 93% specificity, and 87% sensitivity [9]. The model classified HCC six times faster than the human reader, interpretation time per 100 images is 3.4 s.
In 2021, Starmans et al. [10] used machine learning to automatically and non-invasively differentiate between benign and malignant primary solid liver tumors. They used three different datasets from 486 patients. The results obtained when training using dataset A and testing using dataset B were 0.74 AUC, 0.64 accuracies, 0.79 sensitivity, and 0.53 specificity. Meanwhile, the results obtained when training using dataset A and testing using dataset C were 0.76 AUC, 0.69 accuracies, 0.82 sensitivity, and 0.59 specificity. In 2022, Meng et al. [11] combined serum Raman spectroscopy with deep learning algorithms to rapidly detect liver cancer patients. Convolutional Neural Networks with 10-fold data enhancement achieved the best performance with an accuracy rate of 96.95%, 0.96 AUC, 92.89% sensitivity, and a running time of 67.4 s compared to Long Short-Term Memory (LSTM) network and Particle Swarm Optimization-support Vector Machine (PSO-SVM).
The limitations of the previous studies are that most of the papers implemented a 2D CNN [5,7–10]. Meanwhile, [4,9] employed dropouts to handle the overfitting model. On the other hand, [6,11] compared papers on different machine learning and deep learning algorithms for 2D MR images.
The most significant work is by [4], who implemented four consecutive strided 3D convolutional layers with 3 × 3 × 3 kernel size and rectified linear unit (ReLU) as activation function. It was followed by a fully connected layer, 50% dropout, and batch-normalization applied after layers 2 and 4. The work also employed 3D tomographic data that better characterize the features. On the other hand, [4,9] employed dropout to handle the overfitting model. Nevertheless, [9] implemented 2D CNN, which was less efficient in performance. The work of [4] may be complicated and costly in terms of architecture specification. This is because works that employed 2D CNN might encounter less efficient performance due to lesser acquisition of features and less efficient architecture compared to work by [4]. This paper used a simple method by employing 3D CNN features beside 3D shape and texture features to obtain a high level of accuracy. On top of that, it compares 2D and 3D hepatic tumors classification.
The proposed methodology is described in Fig. 1. The method starts with the segmented liver tumor, crops the volume, followed by features extraction, feature selection, and finally, the appropriate classifier.
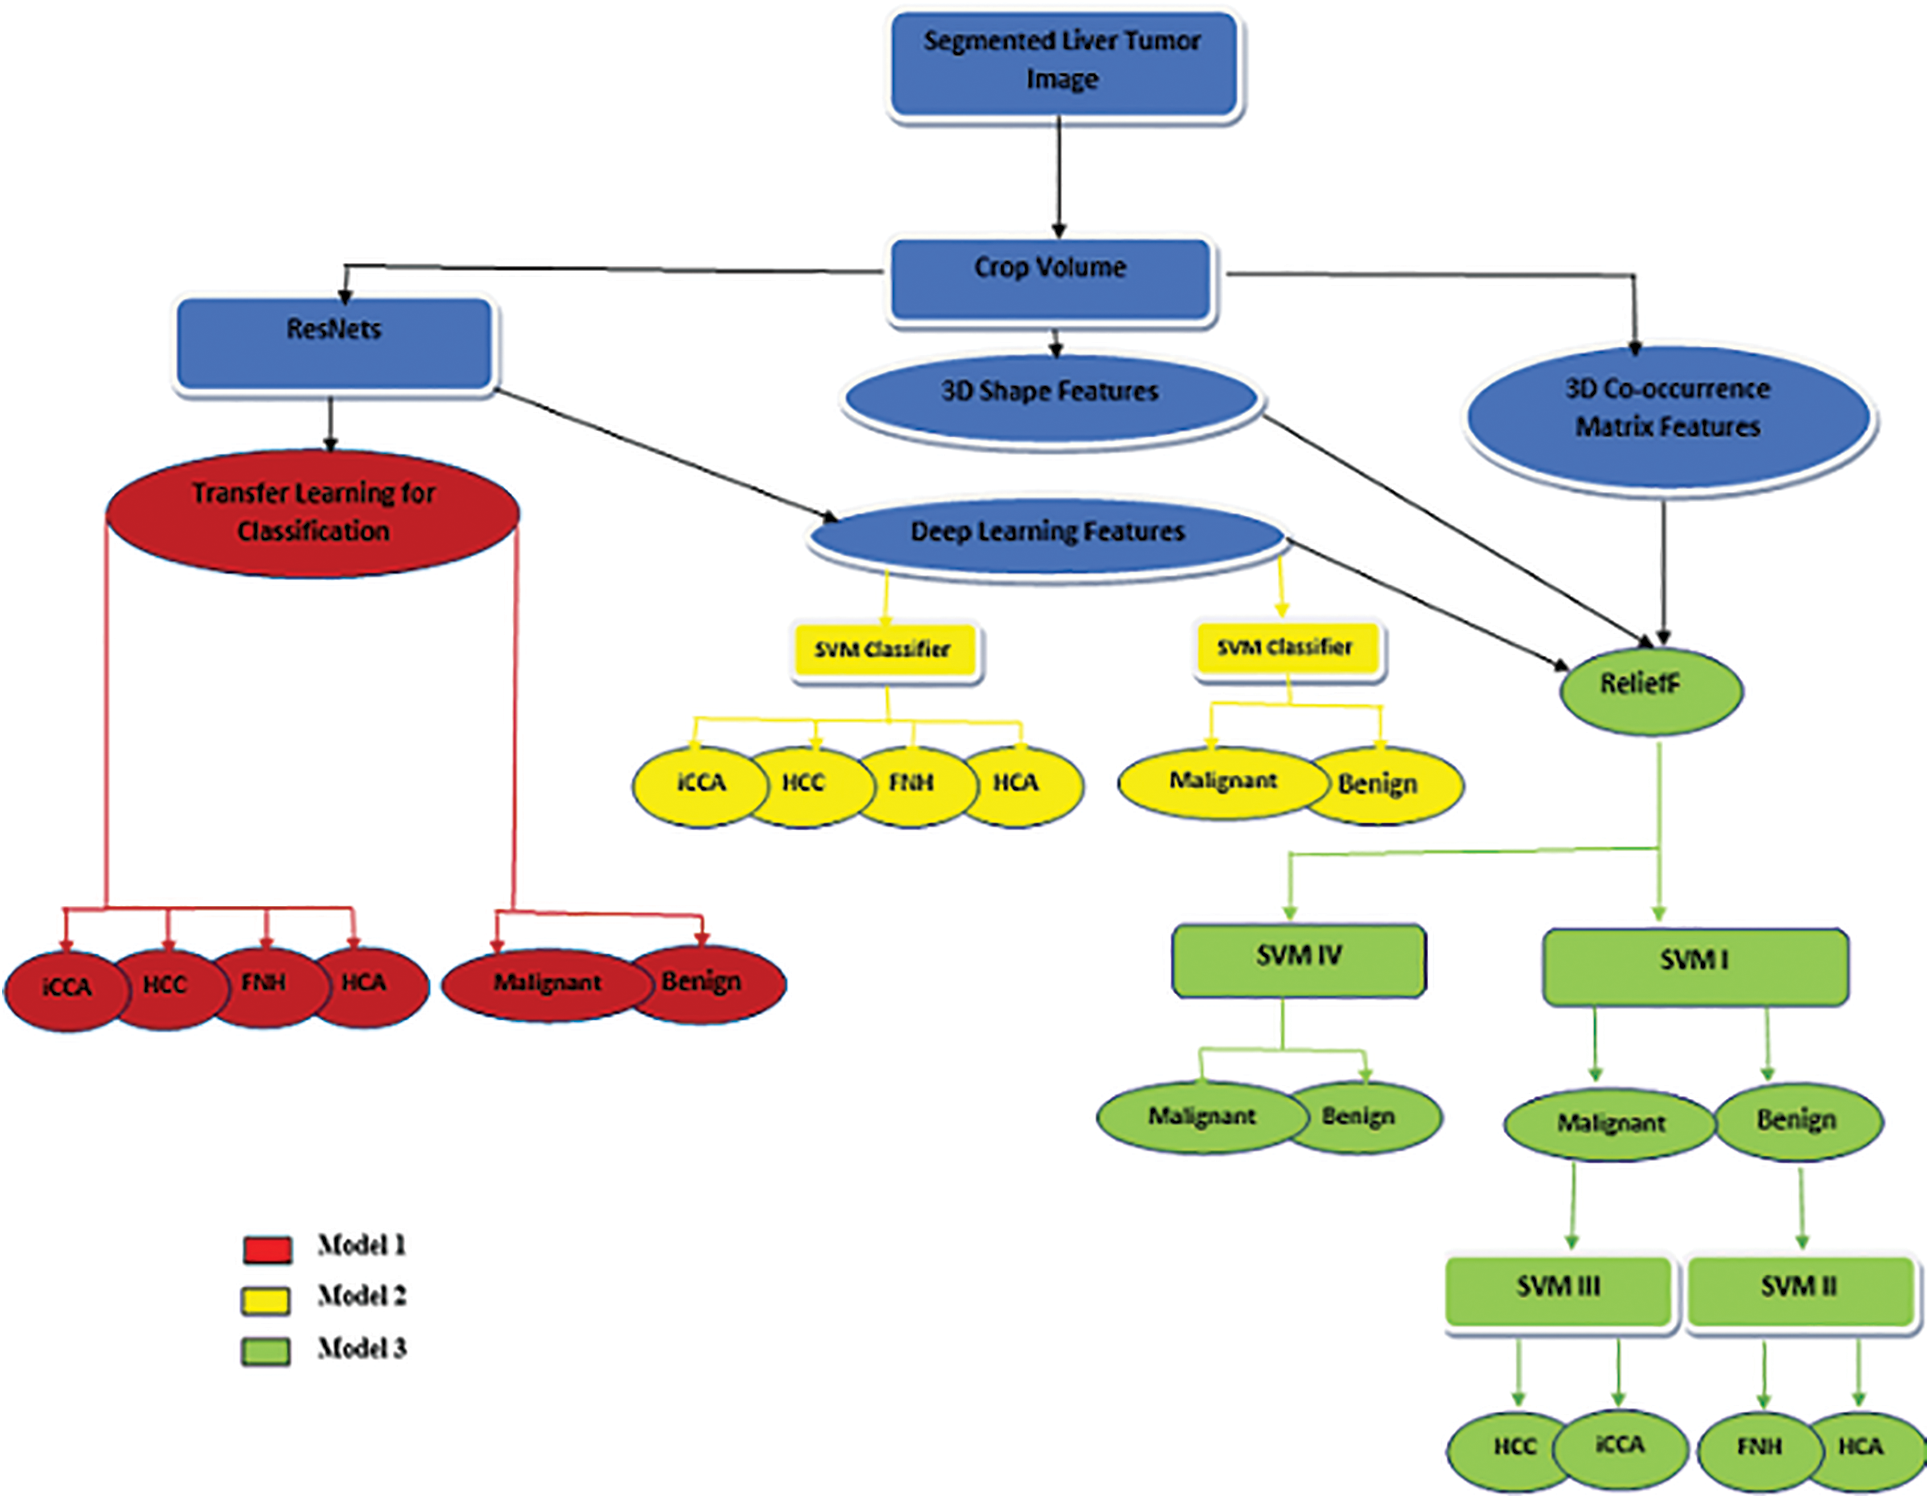
Figure 1: The proposed method
Based on the nature of input features, the structure of the classifier, and the number of discriminated classes, this paper employs three different models as follows:
• Model 1: marked by the red color, which utilizes the transfer learning technique.
• Model 2: discriminated by the yellow color, combining deep learning features and SVM machine learning classifiers.
• Model 3: distinguished by the green color, utilizing a combination of deep learning features and hand-crafted features (3D shape and 3D Co-occurrence) with a machine learning classifier (either cascading or standalone SVM classifier).
The previous models are applied to the central slice of MR images to compare the performance of proposed models 2D and 3D images.
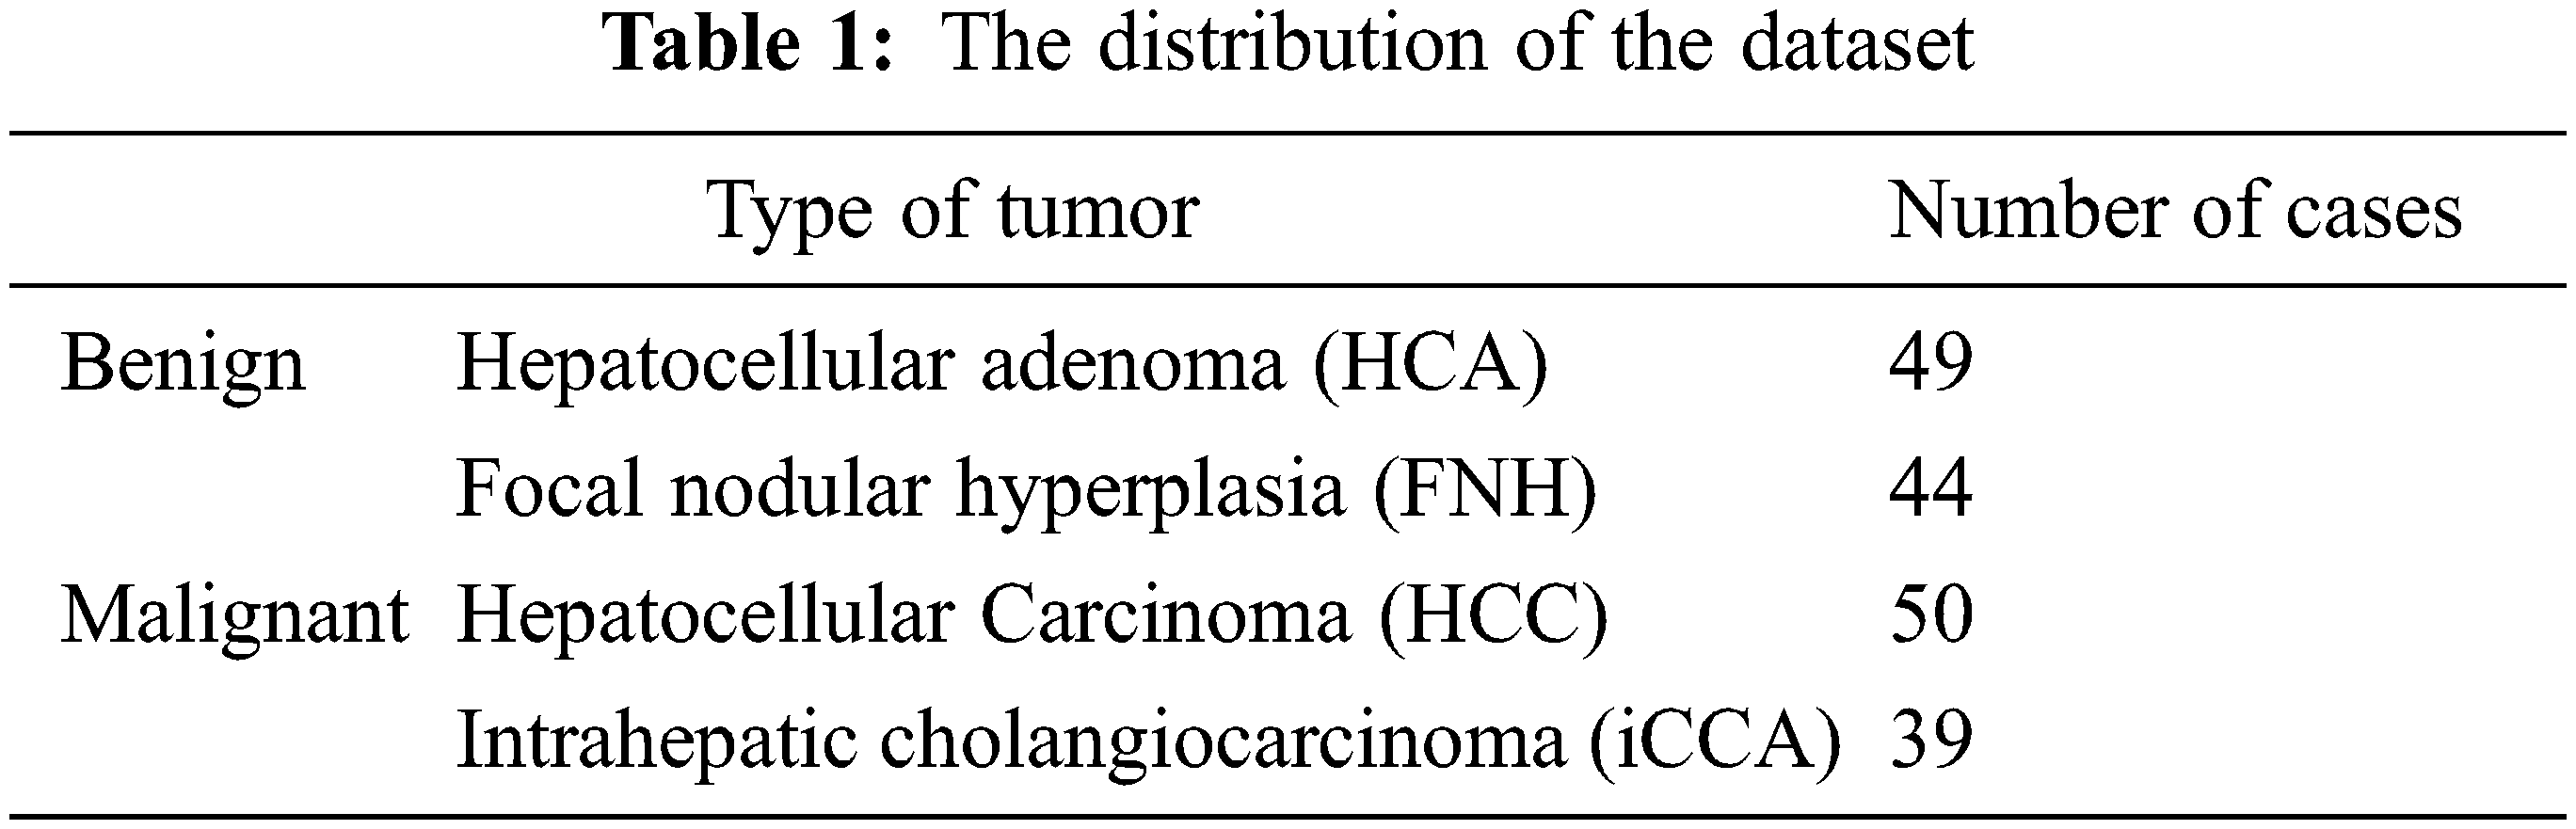
This paper uses the WORC database, which is composed of 6 different datasets from many diseases and different modalities and consists of 930 patients composed of six datasets gathered at the Erasmus MC. One of the datasets included in the primary solid liver tumors is labeled either malignant with two types of hepatocellular carcinoma or intrahepatic cholangiocarcinoma or benign with two types of hepatocellular adenoma or focal nodular hyperplasia. The total number of cases is 186 patients [12]. The distribution of the dataset based on the type of tumor is presented in Table 1 shows the classes of the dataset.
Feature extraction technique contributes significantly to the field of image processing, and it is a pre-request step for building a machine learning model in pattern recognition tasks. The feature is defined as a character or attribute of the image; many types of feature extraction techniques can be categorized into manual and automated features. This paper discusses these two categories with various features: texture and shape features for volumetric MR liver tumor and automated features extraction using deep learning strategies.
Liu et al. [13] extracted three types of features from multi-views, including Grey Matter (GM) volume, solidity, and convexity. First, the grey matter volume features of 83 brain regions were extracted from each registered MRI image as the representations in the first view for the ith image. Then, each brain region is normalized, indexed by j by the volume of the brain mask as a fraction of the whole brain.
Although the GM volume feature had been widely used in many brains and Alzheimer’s studies [14–17], it was unreliable due to anatomical variability between subjects. Liu et al. [18] proposed two other features, convexity and solidity, in addition to the GM volume features. Both convexity and solidity required the convex hull. This was defined as the ratio of the convex hull surface area to the surface area of the jth region of interest. The convexity and solidity provided complementary information to the volume features describing the brain region atrophy. Fig. 2 also shows the convexity and solidity values of the left hippocampus for the four subjects. The three types of features extracted from multi-views were then concatenated to form a tripled-sized feature vector, a(i) ∈ ℝ1 × 249, as a naive representation of each subject. Although the above-mentioned work was for the brain, it applies to other parts of organs in the body, especially for MRI-based image acquisition.
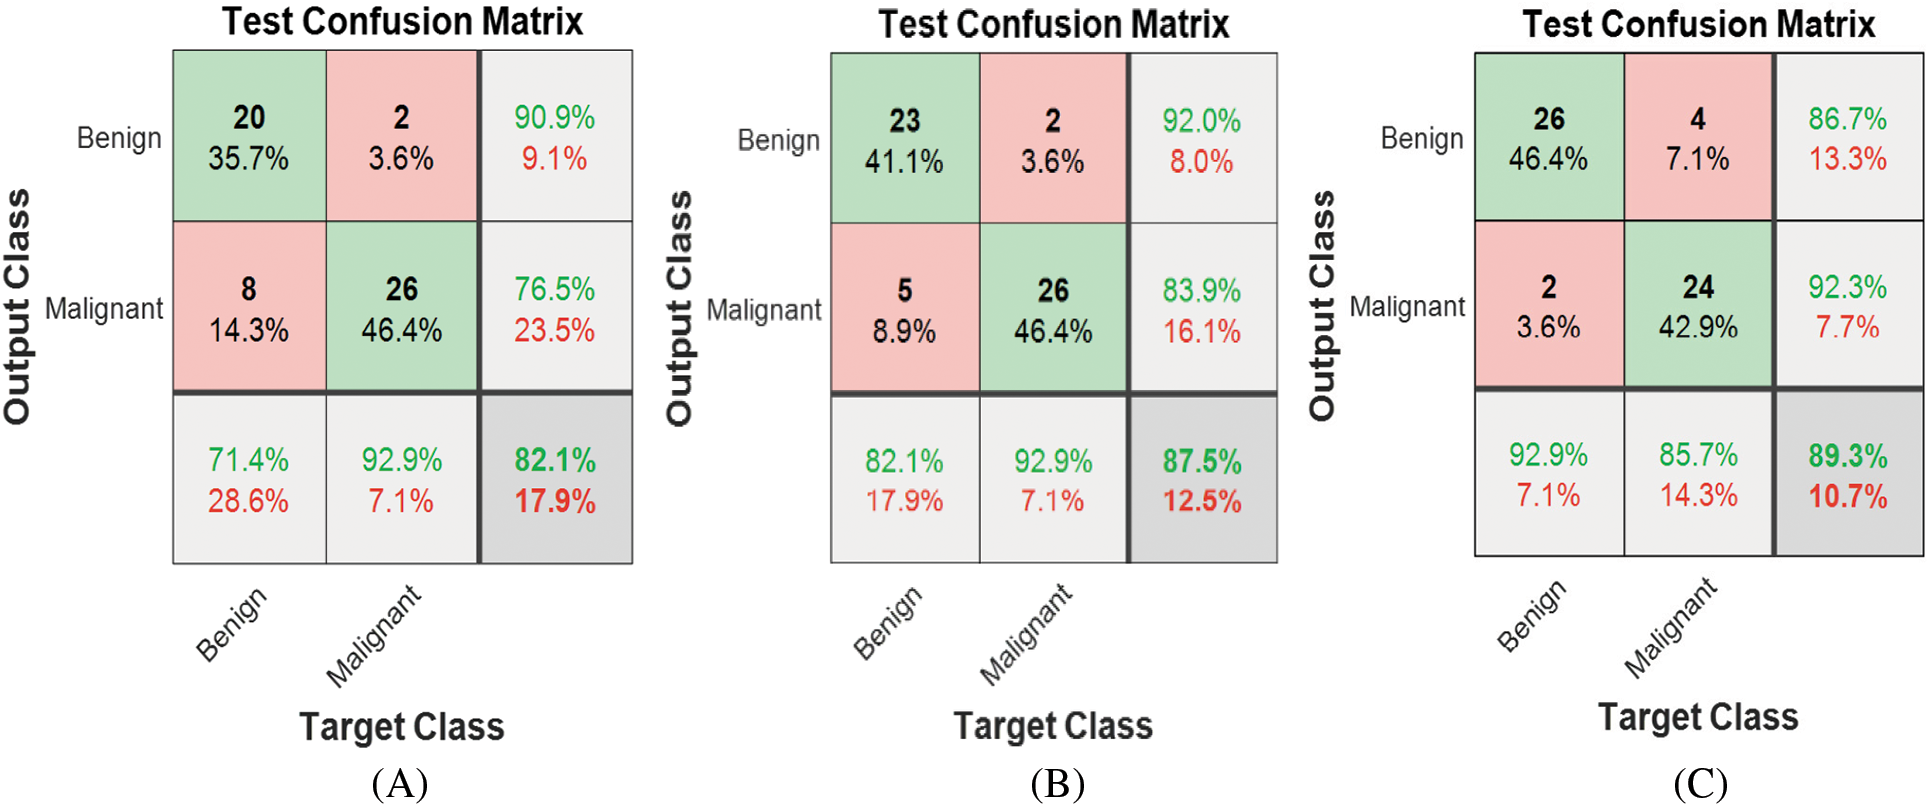
Figure 2: Model 1 (2 classes) test confusion matrices (A) ResNet18, (B) ResNet50 (C) ResNet101
Besides, Qiu et al. [19] mentioned that magnetic resonance imaging (MRI), which is different from computed tomography, ultrasound, and other anatomical imaging methods, mainly focuses on functional imaging and is widely used in many diseases [20,21]. For diffusion-weighted imaging (DWI), a commonly used functional imaging sequence is effective in detecting and staging metastatic liver tumors as well as evaluating LF and cirrhosis [22,23]. This study utilized the benefits of previous studies in extracting 3D shape features of existing tumors in liver MR images and 2D shape features of central slices. These features are surface area, volume, and equivalent diameter, as shown in Eq. (1) [24].
The extent feature, defined as the ratio of the voxels in the region to total voxels in the bounding box, is illustrated in Eq. (2). Convex volume solidity is defined as the ratio of volume to convex volume.
Gray-level co-occurrence matrices (GLCM) is an approach for retrieving texture information from the digital image. It quantifies specific pairwise gray level occurrence at specific relative positions [25]. It is considered the most adopted algorithm, especially for textural feature extraction and classification of medical images [26] and remote sensing images [27]. Texture classification derived from volumetric data will have better distinctive power than 2D texture derived from the data of the 2D cut, where the 3D GLCM gives a percentage of classification better than the 2D method [28]. Furthermore, Dacheng et al. [29] used 3D co-occurrence matrices in Content-Based Image Retrieval (CBIR) applications, and Chen et al. [30] used 3D-GLCM to extract the iris features for iris recognition and proved that The 3D-GLCM method could obtain a good recognition rate. Also, in [31], the characteristic features were extracted from face images using 3D GLCM matrices and obtained a high correct recognition rate (CRR).
Moreover, Tan et al. [32] proposed a 3D GLCM-based Convolution neural network (3D-GLCM CNN) model for the clinical task of polyp classification for discriminating volumetric malignant polyps from benign polyps. Besides, Barburiceanu et al. [33] proposed an approach to feature extraction from volumetric images by adopting improved 3D GLCM based on illumination information, gradient magnitude, and gradient orientation. This is followed by the extraction of Haralick features, gradient-based and orientation-based proposed indicators, which showed that the improved 3D Co-Occurrence Matrix increases the discrimination power and the classification performance. Also, they presented a texture feature extraction technique for volumetric images with improved discrimination power by combining two complementary sets of feature vectors derived from Local Binary Patterns (LBP) and the 3D Gray-Level Co-occurrence matrix [34]. The twelve features extracted are energy, entropy, correlation, contrast, variance, the sum of mean, inertia, cluster shade, cluster tendency, homogeneity, max probability, and inverse variance are extracted from 3D liver tumor and from the central slice of the tumor as a 2D image to compare the performance of the proposed methodology between 2D and 3D classification problems.
Commonly, deep learning models require huge data to train where transfer learning strategy is utilized. This paper employs three pre-trained neural network architectures, namely ResNet18, ResNet50, and ResNet101 [35–39]. In 2016, ResNet (short for Residual Network) was a specific type of neural network previously introduced by He et al. [35]. Residual neural networks utilize the idea of skipping connections or shortcuts to jump over some layers. Here, typical ResNet models are implemented with double- or triple-layer skips containing Rectified Linear Unit (ReLU) and batch normalization. The skip connections in ResNet solve the problem of vanishing gradient in deep neural networks by allowing this alternate shortcut path for the gradient to flow through. Another way these connections help is by allowing the model to learn the identity functions, which ensures that the higher layer will perform at least as well as the lower layer and not worse. The number of layers in ResNet varies from 18 to 152. The residual blocks have two or three layers.
In ResNet models, all convolutional layers apply the same 3 × 3 convolutional windows, and the number of filters increases following the depth of the network, from 64 to 512 (for ResNet18) and from 64 to 2048 (for ResNet50 and ResNet101). Furthermore, all models have only one max-pooling layer with a pooling size of 3 × 3, and a stride of 2 is applied after the first layer. Therefore, reducing the input resolution is significantly limited during the training process.
The deep learning approach used in this study is two cases, one as a classifier for discriminating between various volumetrical types of tumors bypassing the whole 3D MR image or passing the 2D central slice of the MR image. On the other hand, it is utilized as a feature extractor to reveal the contribution of the surrounding tumor tissues in discriminating between different classes. This scenario is applied on whole volumetric MR images and on a central slice of MR to compare the performance between 2D and 3D classification tasks.
General feature selection methods can be categorized into filters and wrappers. Filter-based feature selection methods are, in general, faster than wrapper-based methods. The ReliefF algorithm is one of the filter-based feature selection methods. It is an effective, simple, and widely used approach to feature weight estimation. The weight for a feature of a measurement vector is defined in terms of feature relevance. When interpreted using probabilistic terms, the learned weight for a feature is related to the difference between two conditional probabilities. These two probabilities are of the value of a feature being differently conditioned on the given nearest miss and nearest hit, respectively. Thus, ReliefF usually performs better than the other filter-based approaches due to the feedback of the nearest-neighbor classifier. On top of that, ReliefF is often more efficient than the wrapper approach because ReliefF determines the feature weights by solving a convex optimization problem [40,41].
The original ReliefF can deal with nominal and numerical attributes. However, it cannot deal with incomplete data and is limited to two-class problems. Its extension, called the ReliefF algorithm [41], is not limited to two-class problems. It is more robust and can deal with incomplete and noisy data. ReliefF randomly selects an instance but then searches for k of its nearest neighbors from the same class, called nearest hits, and k nearest neighbors from each of the different classes, called nearest misses. It updates the quality estimation for all attributes based on selected instances, hits, and misses. The update formula is similar to that of ReliefF, except that the contribution of all the hits and all the misses are being averaged. The contribution for each class of the misses is weighted with the prior probability of that class. Since the contributions of hits and misses are determined in each step and symmetric, the misses’ probability weights must sum up to 1. As the class of hits is missing in the sum, each probability weight must be divided with factor 1. The process is repeated for m times. Selection of k hits and misses is the basic difference to ReliefF and ensures greater robustness of the algorithm concerning noise. User-defined parameter k controls the locality of the estimates. For most purposes, it can be safely set to 10. To deal with incomplete data, the difference function is changed. Missing values of attributes are treated probabilistically [41].
The main goal of this paper is to compare the effectiveness of employing 3D dimensional features and deep volumetric features in discrimination between various types of hepatic tumors and 2D dimensional features besides deep learning features. The classification is performed in different scenarios. Here, the first scenario is the automated deep learning classification of 3D tumors and 2D central slices. The second scenario is hybrid classification with a combination of 3D deep graphical features, 3D co-occurrence features, and 3D shape features. On the other hand, the same scenario is applied for 2D central slice MR images. In the last scenario, the classifier that has been used is the Ensemble classifier, with the main block being the support vector machine (SVM) classifier. Gaussian SVM classifier is utilized in this paper for binary classification in each stage of SVM [42,43]. The rest of this paper discusses the obtained results in different scenarios. All scenarios are applied to 2D and 3D images to compare the effectiveness of 3D features in distinguishing between different hepatic tumors.
The methodology used in this article focuses on combining hand features (3D texture and 3D shape features) for 3D classification and (2D texture and 2D shape) for 2D classification. In addition, automated features to construct three different models to discriminate between two and four liver tumor categories are either 3D or 2D. The convolutional network structures used in this paper are ResNets with 18 layers, 50 layers, and 101 layers.
4.1 Two Classes Classification
Automated binary classification is carried out using three ResNet structures. Fig. 2 shows the corresponding confusion matrices for each ResNet using Model 1. ResNet101 achieved the best results among all structures, with 89.3% accuracy for discriminating between malignant and benign classes. The classification can be enhanced further by automatically extracting the features using ResNet101, exploiting the benefits of transfer learning, and then passing them to the Gaussian Support Vector Machine classifier. As a result, Model 2 accuracy is enhanced significantly to 94.6%, as shown in Fig. 3.
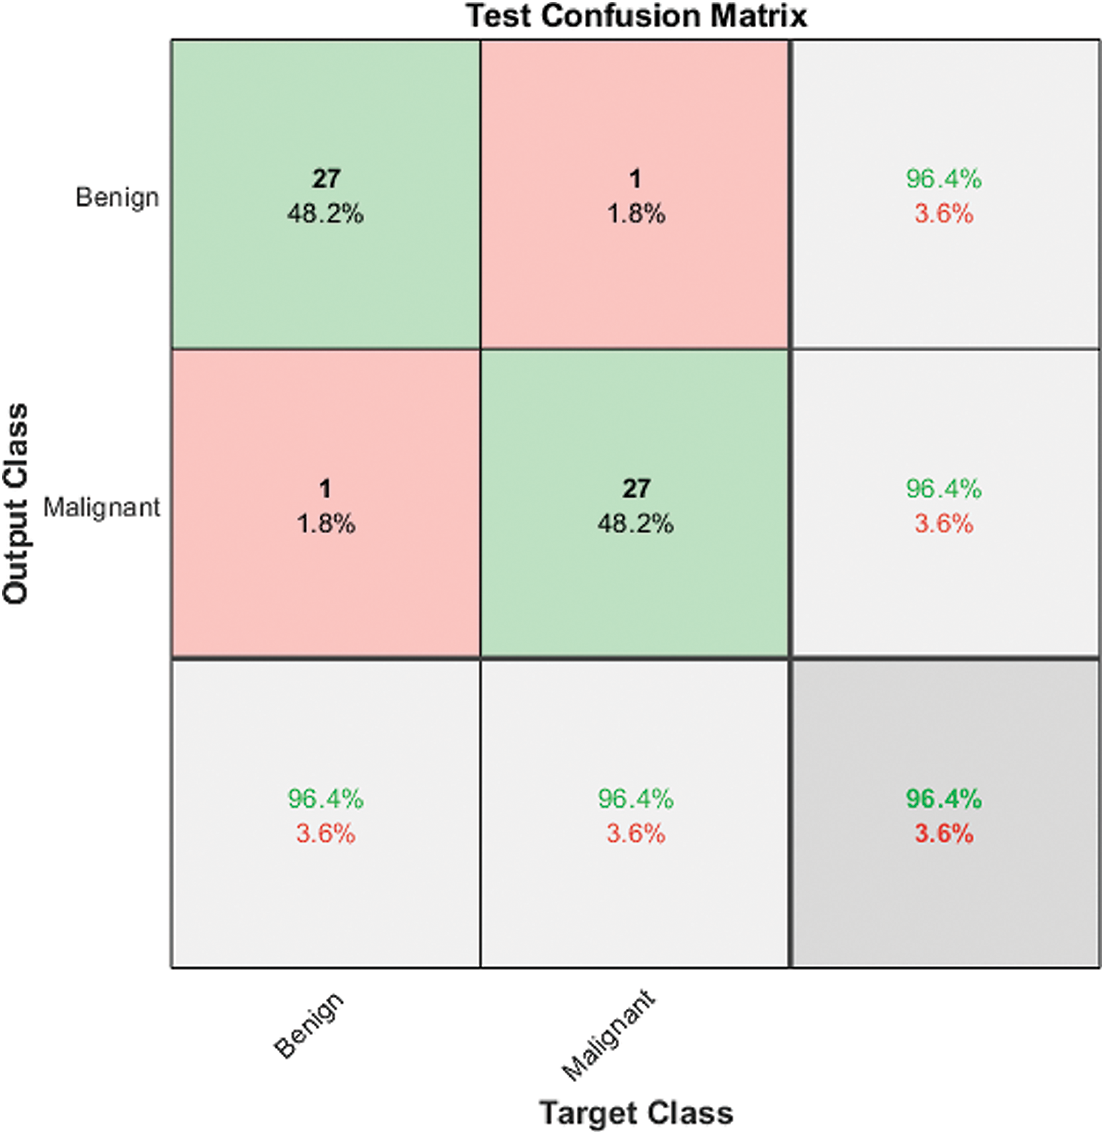
Figure 3: Model 2 (2 classes) test confusion matrix
Fig. 4 shows the Model 3 test confusion matrix. Model 3 improves the classification accuracy by combining the automated and hand-crafted features and applying the ReliefF features selection algorithm to obtain the most relevant features. These features are fed to a Gaussian Support Vector Machine (SVM) to achieve the highest accuracy of 100%. ReliefF selection method ranked the top ten features that contributed to distinguishing between benign and malignant cases. The top 10 features are ranked from the most significant feature to the lowest one: two deep features from 3D ResNet101, mean and Max Intensity, Convex Volume, Weighted Centroid, Volume, Entropy, Correlation, and Contrast.
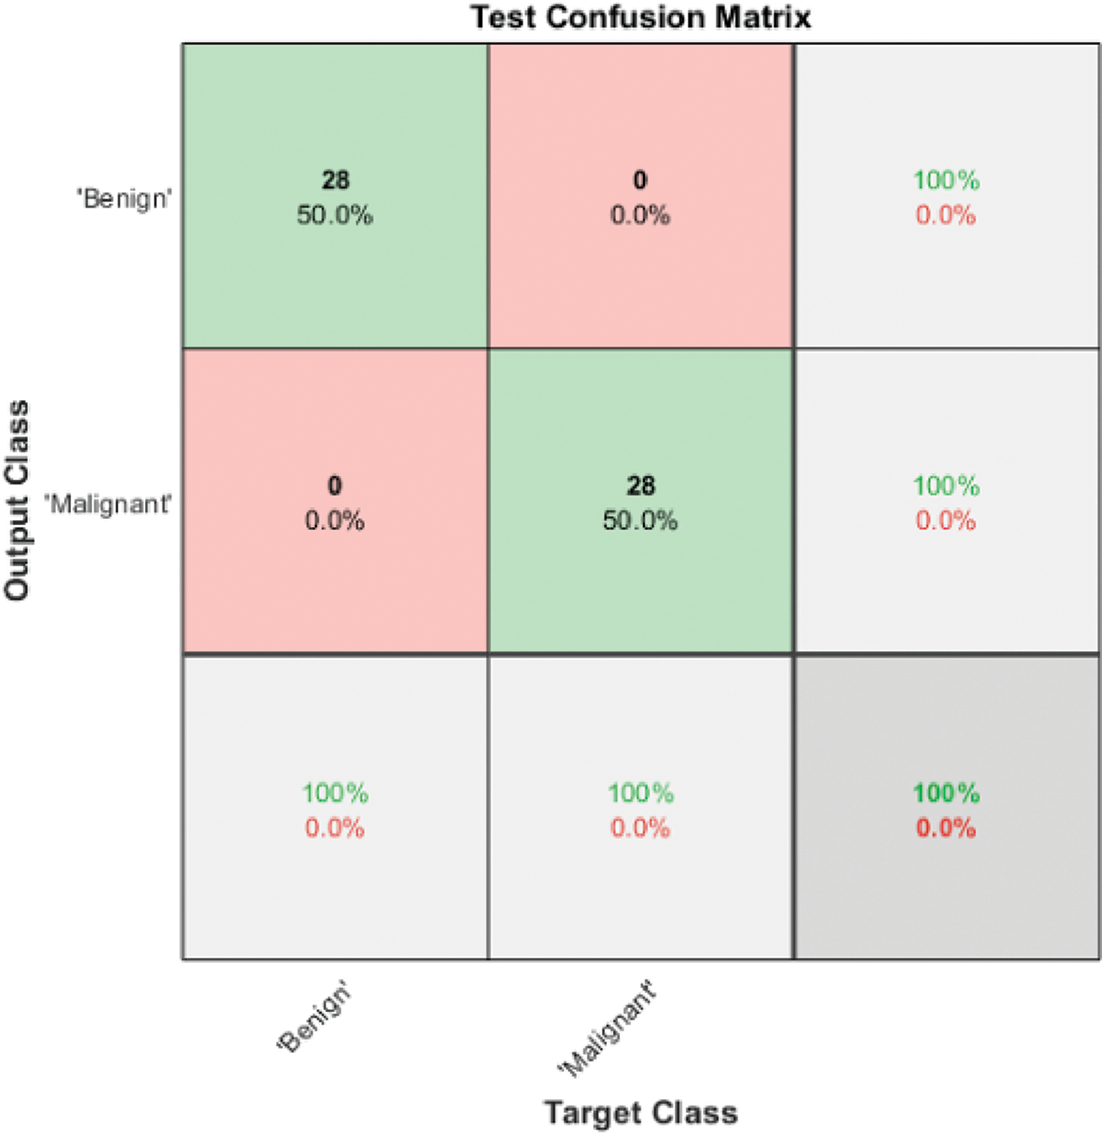
Figure 4: Model 3 SVM IV (2 classes) test confusion matrix
The same procedure is applied to a 2D central slice of MR images. Utilizing Model 1, ResNet18, ResNet50 and ResNet101 achieved accuracy 76.80%, 80.40%, 82.10%, respectively. For Model 2, the highest accuracy is obtained using ResNet101, reaching 91.10%. By employing Model 3 on a 2D central slice, the highest accuracy reached 96.4%. It is clear from the previously mentioned results that employing 3D features enhanced the performance of classification.
4.2 Four Classes Classification
Benign liver tumors are divided into two classes: Hepatocellular Adenoma (HCA) and Focal Nodular Hyperplasia (FNH). Furthermore, malignant tumors are divided into Hepatocellular Carcinoma (HCC) and Intrahepatic Cholangiocarcinoma (HCC). The 3D liver tumor of Model 1 was employed to discriminate between all four classes, but the results did not exceed 45% in the ResNet101 case. Model 2, on the other hand, uses the automated extracted four features from the last fully connected layer of ResNet101, which are then passed to a Gaussian SVM to obtain 94.4% accuracy for all four classes. Fig. 5 illustrates the Model 2 test confusion matrix for all four classes.
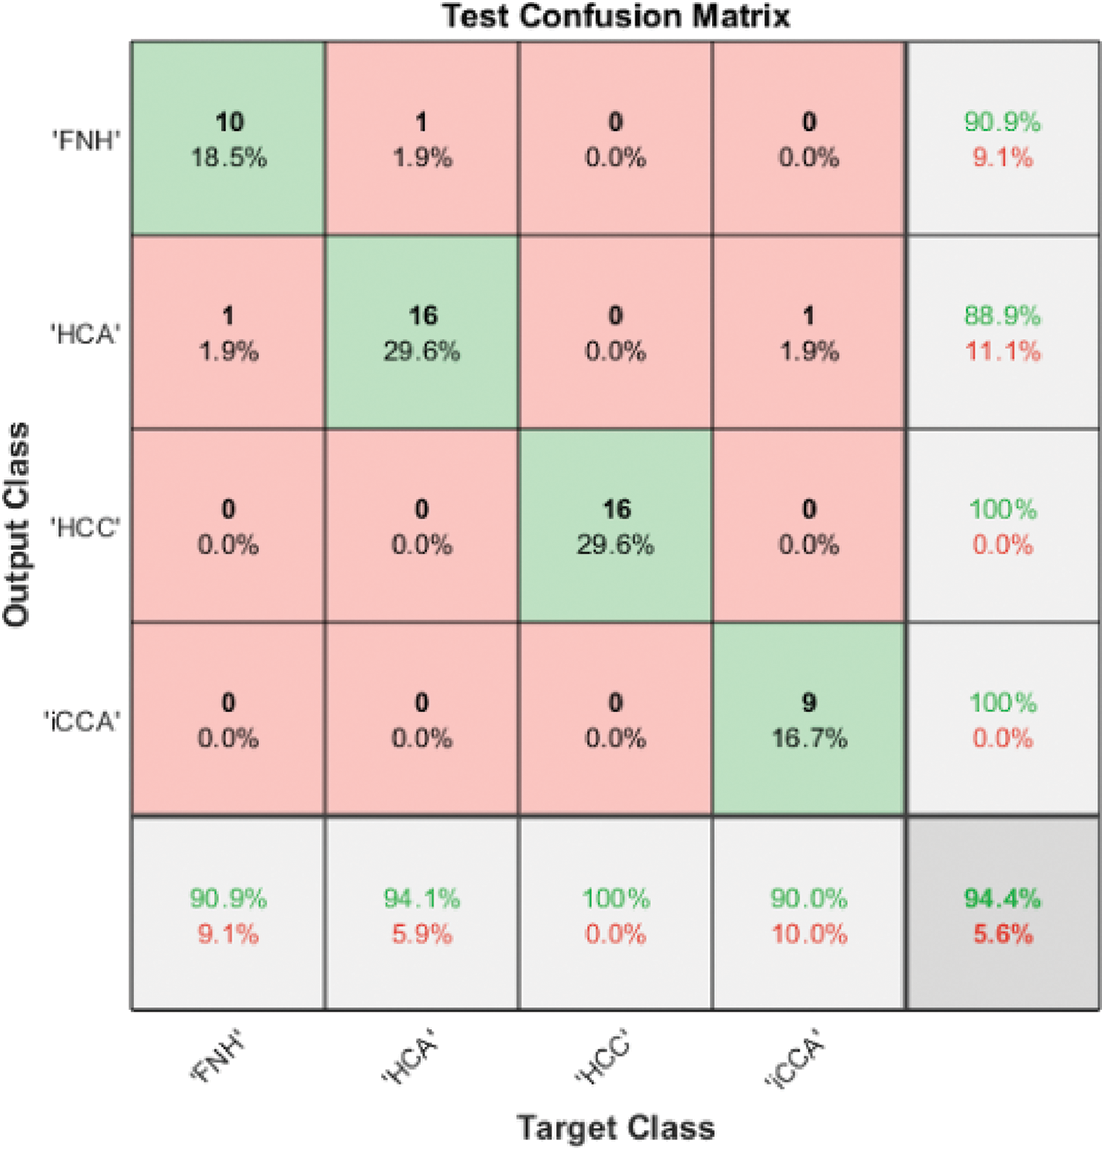
Figure 5: Model 2 (4 classes) test confusion matrix
Model 3 enhanced the discrimination accuracy by applying the cascading technique for distinguishing all four classes. Cascading in machine learning tries to obtain the highest accuracy in each level to guarantee performance in the next level because any misclassification in one level will affect the accuracy on the second level. Fig. 6 illustrates the Model 3 structure for all available classes. It uses three classifiers known as SVM I, SVM II, and SVM III.
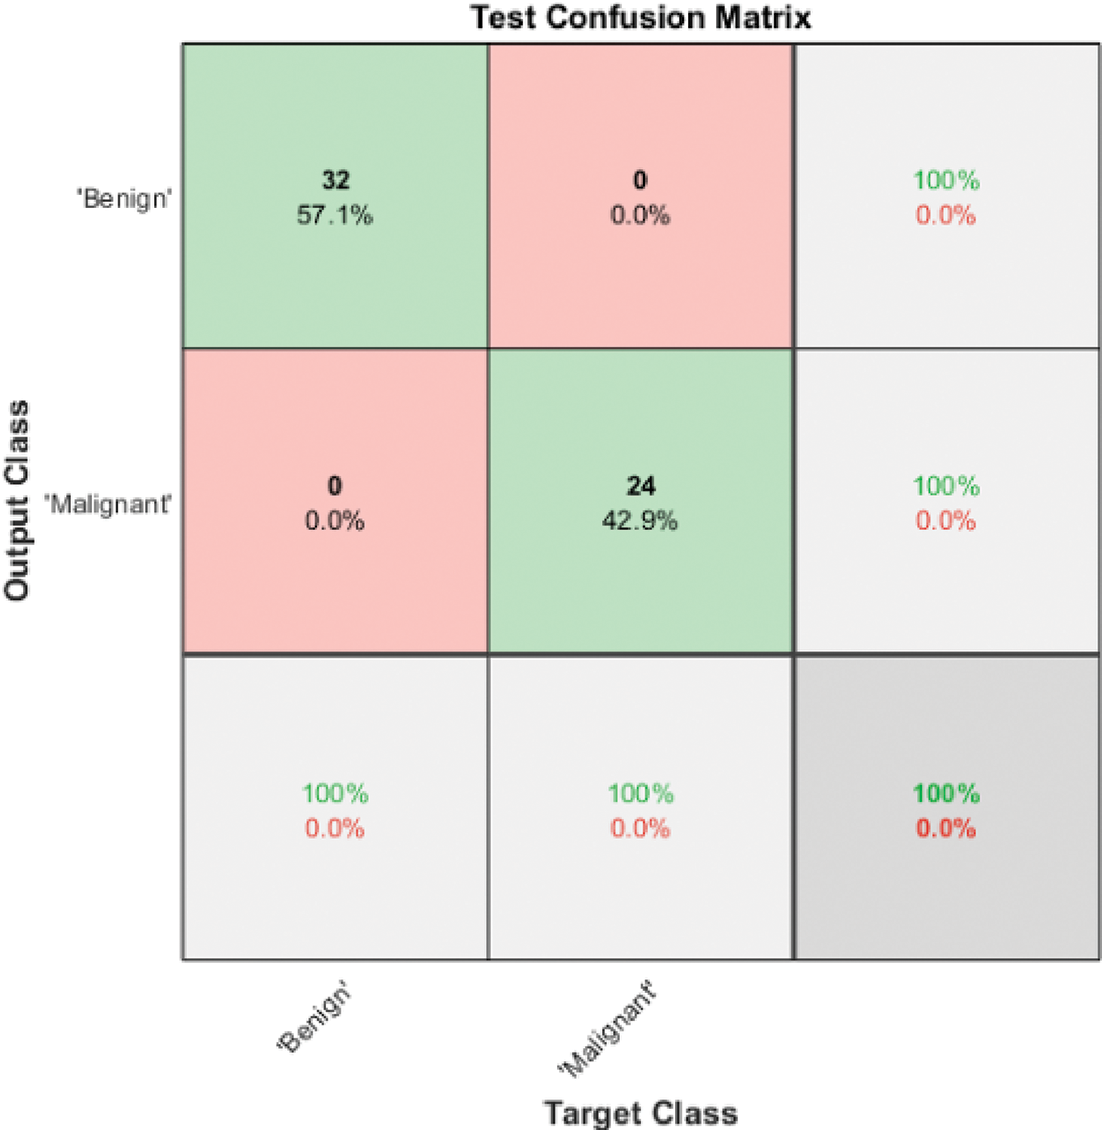
Figure 6: Model 3 SVM I (2 classes) test confusion matrix
Fig. 6 shows the test confusion matrix of SVM I. SVM I is responsible for discriminating between benign and malignant by employing two deep graphical features extracted using ResNet101, texture features and shape features. It also uses ReliefF as a feature selector. The ten most significant features are passed to a Gaussian SVM, and testing accuracy reaches 100%. The benign cases are processed using Model 3 SVM II to determine the benign class. On the other hand, the malignant cases are processed using Model 3 SVM III to define the type of malignancy, whether it is HCC or iCCA.
The resultant benign classes are further classified using Model 3 SVM II by utilizing the two automated graphical features from ResNet101 to classify the benign cases into FNH and HCA. Fig. 7 illustrates the confusion matrix of the Model 3 SVM II test phase, in which the accuracy reached 100%.
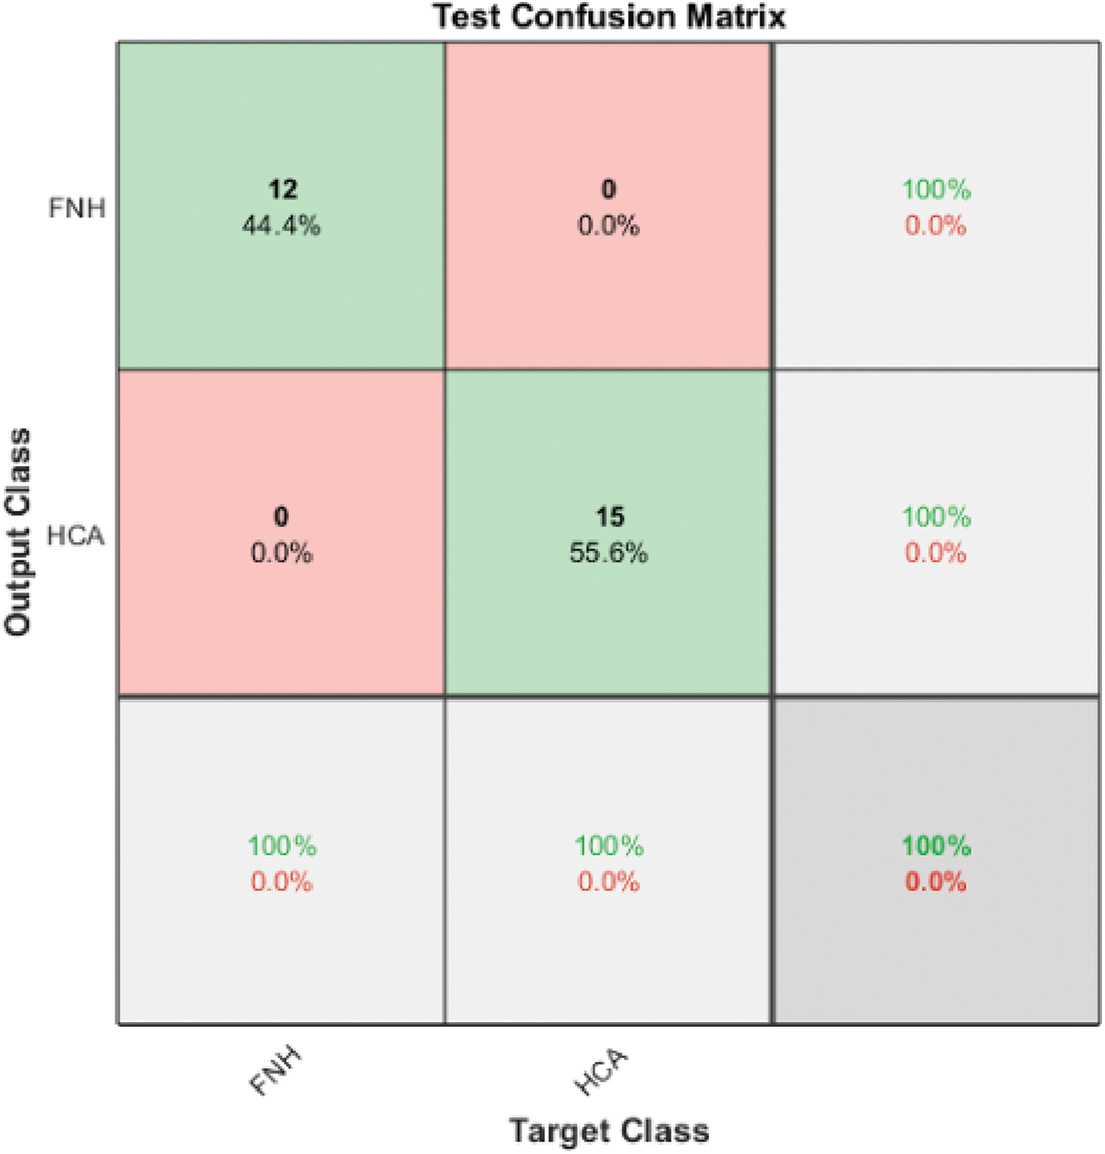
Figure 7: Model 3 SVM II (2 classes) test confusion matrix
The resultant malignant classes are further classified using Model 3 SVM III via two-deep graphical features. SVM III successfully classified the malignant cases into two types of malignancy HCC and iCCA. Fig. 8 illustrates the confusion matrix of the Model 3 SVM III test phase, where the accuracy reached 100%.
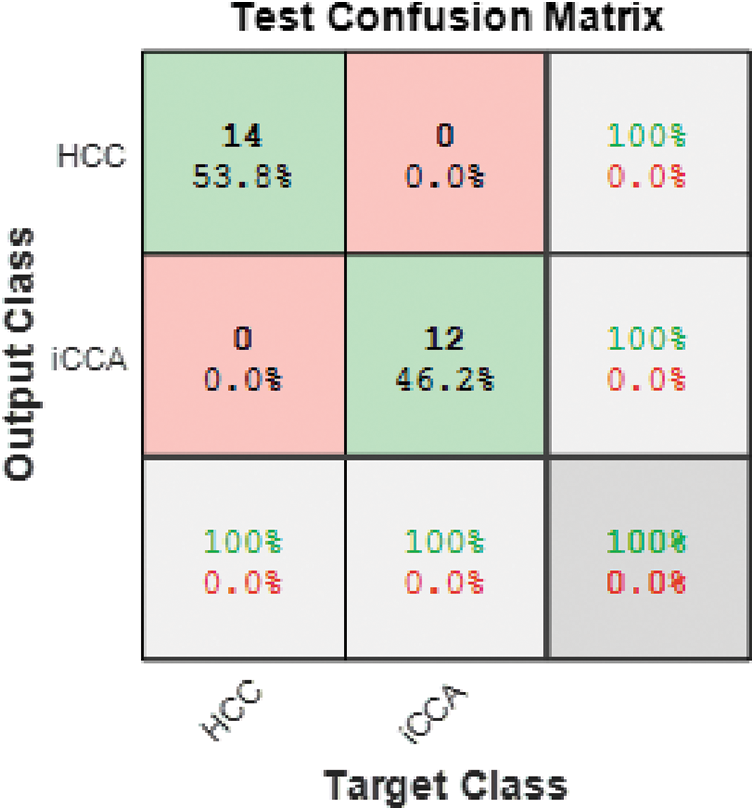
Figure 8: Model 3 SVM III (2 classes) test confusion matrix
The overall confusion matrix for the ensemble classifier of Model 3 is presented in Fig. 9. It is clear from the figure that the ensemble classifier achieved the highest overall accuracy for all four classes under investigation.
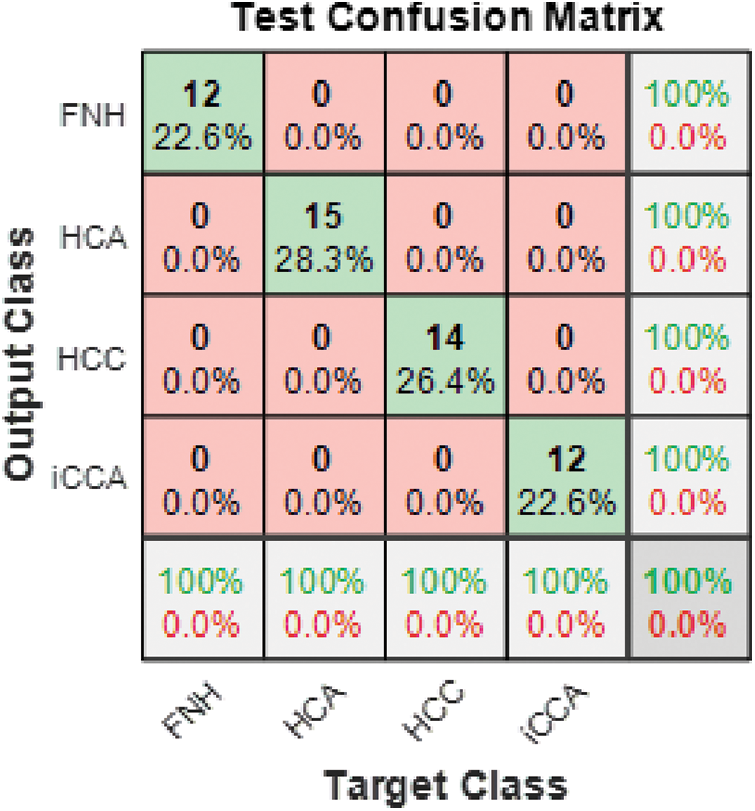
Figure 9: Model 3 (4 classes) test confusion matrix
The same procedure is applied to 2D central slice MRI images to discriminate between four classes. For Model1 , ResNet18, ResNet50 and ResNet101 achieved accuracy of 45.50%, 43.60%, 43.60%, respectively. On the other hand, Model2 obtained the highest accuracy using ResNet101, reaching 83.5%. On top of that, the performance of the 2D central slice is enhanced using Model 3, and the highest accuracy is not exceeding 92.67%. Table 2 summarizes the results obtained in this paper using various models to solve the two and four classes problem using 2D central MRI image models.
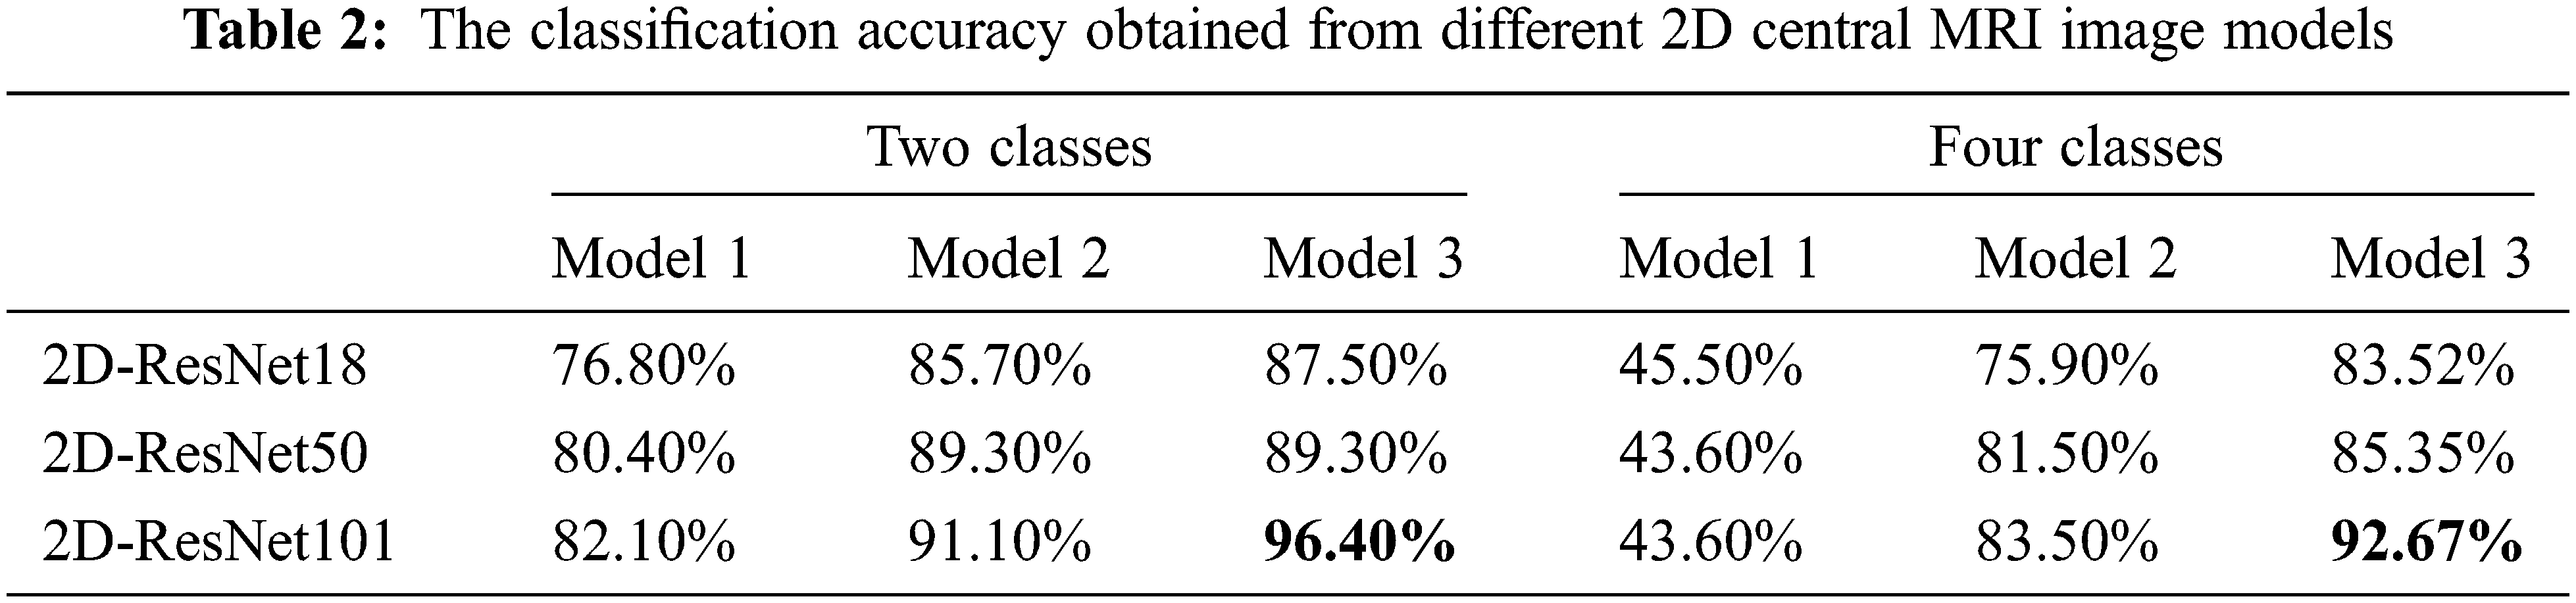
Table 3 summarizes the results obtained in this paper using various models to solve the two and four classes problem.
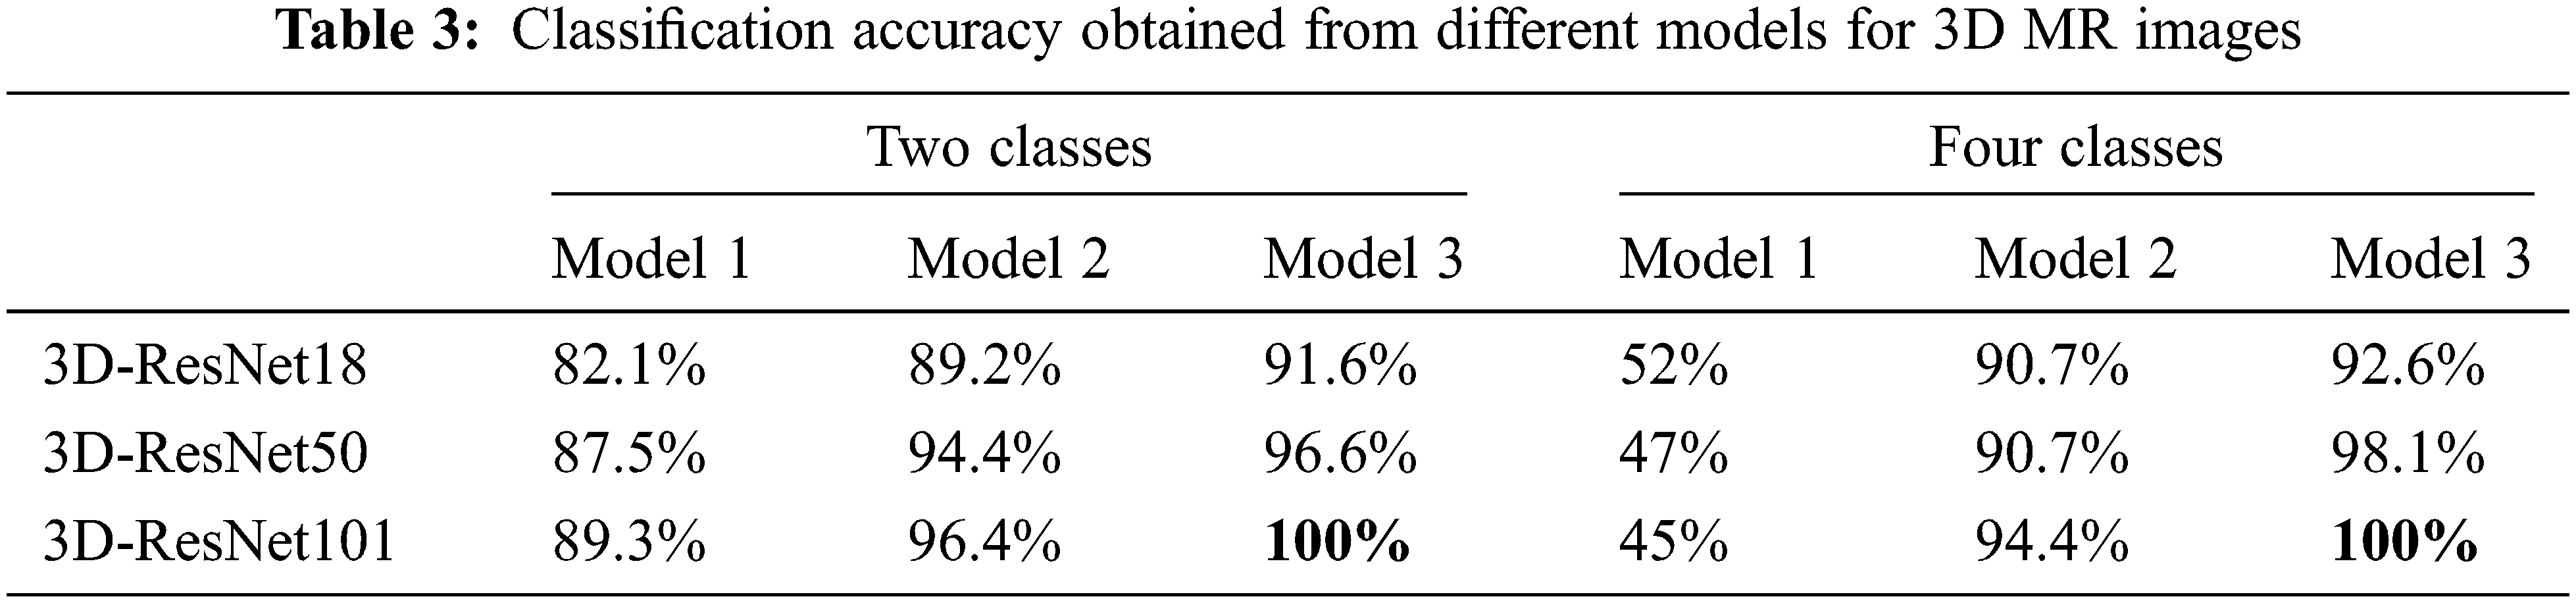
It is evident from Tables 2 and 3 that Model 3 performance was always higher than the performance of Model 2. Model 2 performance was always higher than Model 1 for all classification problems under consideration. It is also evident from Tables 2 and 3 that ResNet101 performance was higher than that of ResNet50 and ResNet18 for all models except for Model 1 in the four classes case. It is clear from Tables 2 and 3 that the performance of 3D classification is better than 2D in all models. That comes from the truth of considering the depth of the tumor using a 3D ResNet structure [44].
For the two classes problem in 3D MR images, Model 3’s ensemble classifier gives the highest accuracy using ResNet101 together with gaussian SVM. As a result, this model reached 100% classification accuracy. For the four classes problem, the best results are also obtained using Model 3, which combines deep learning as a feature extractor and Gaussian SVM as a machine learning classifier with an accuracy reaching 100%. Fig. 10 represents the summarized results in Tables 2 and 3 for Model 3, either in two or four classes.
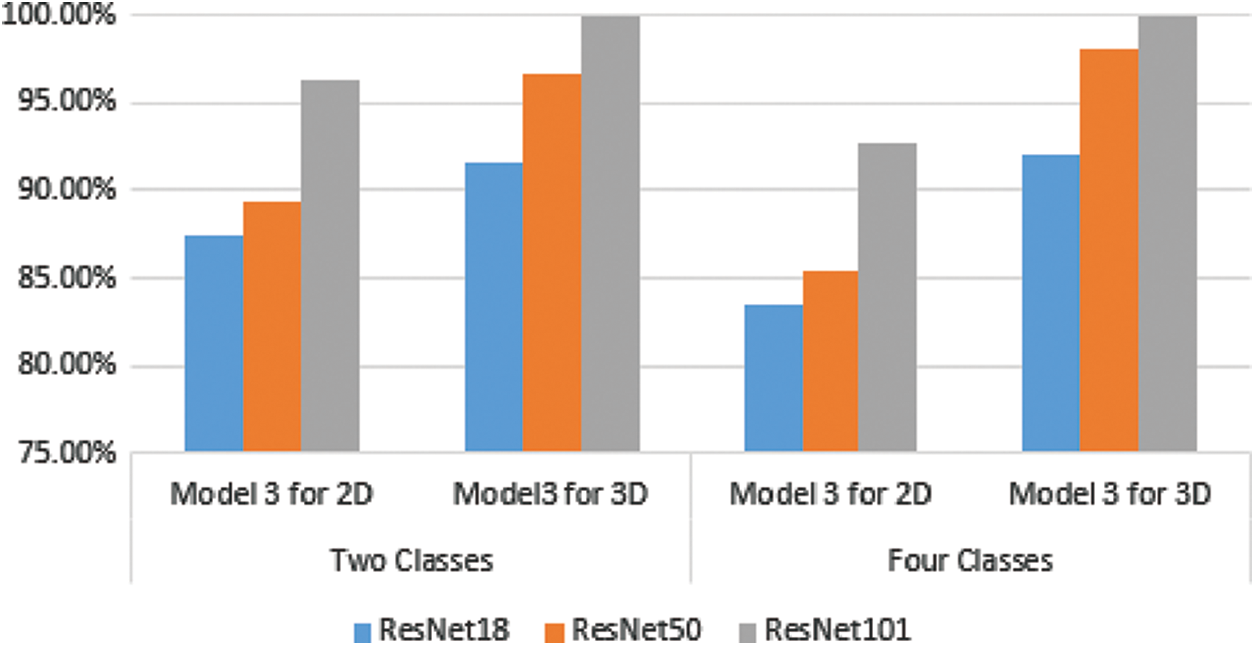
Figure 10: Comparison between 2D and 3D classification using model 3 for different ResNet structures
The combination of deep learning features for whole volumetric MR images considers the surrounding tissue of the tumor in 3D images besides the 3D texture features of the tumor by itself. On top of that, the 3D shape features of the tumor by themselves as well contribute mainly to obtaining higher accuracy. Other factors impact the highest accuracy, such as feature selection and augmentation, which leads to an increase in the number of images.
Model 3 achieved the highest level of accuracy in both cases, two and four classes. That leads to the proposed method’s milestone in building a robust CAD system for liver MR image diagnosis. Table 4 describes the comparison between the proposed method and the existing studies which use the same dataset.
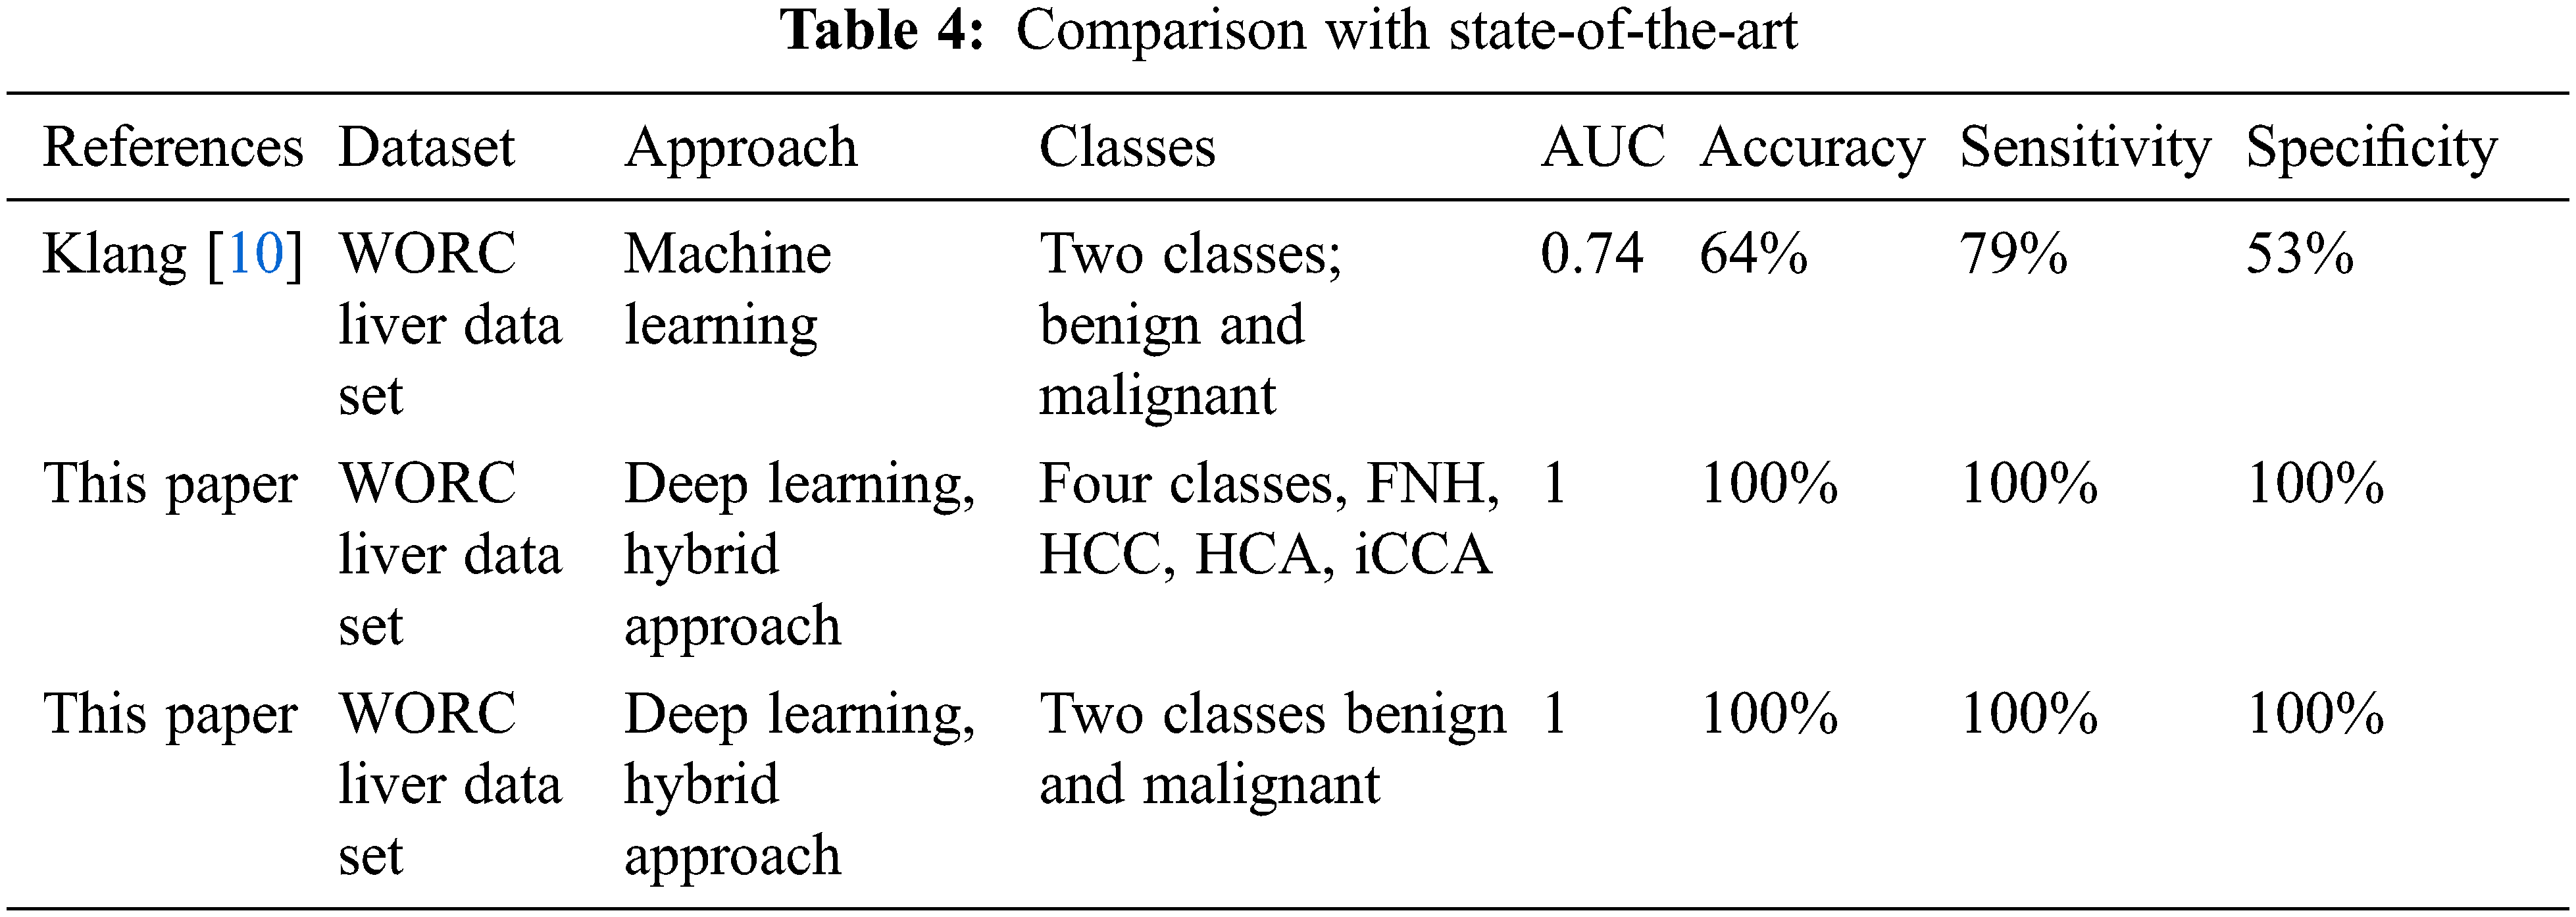
Based on the literature, just one study used the same dataset, but the proposed method obtained higher accuracy than it. The study discussed different issues in the classification of liver tumors using MRI images. The proposed approaches obtained the best results compared with the state-of-the-art literature that used the same data. Table 5 summarizes how this study compares to existing studies in the literature. Klang et al. [10] was the only study in the literature that used the WORC Liver dataset and a machine learning approach to solve the benign and malignant discrimination problem. They achieved 74% AUC, 64% accuracy, 79% sensitivity, and 53% specificity. It is also evident from Table 5 that the suggested method achieved the highest Area Under the Curve (AUC), sensitivity, accuracy, and specificity, besides considering the four classes of problem. Needless to say, Klang et al. [10] results are low compared with the suggested approach presented in this study. Besides, this study discusses the comparison between utilizing 2D and 3D features in classification. To summarize, the proposed approach obtained the best results in solving both classification problems (two and four classes) concerning all performance evaluation metrics such as AUC, sensitivity, accuracy, and specificity [45]. On the other hand, the obtained results were the best when compared with literature that used different datasets.
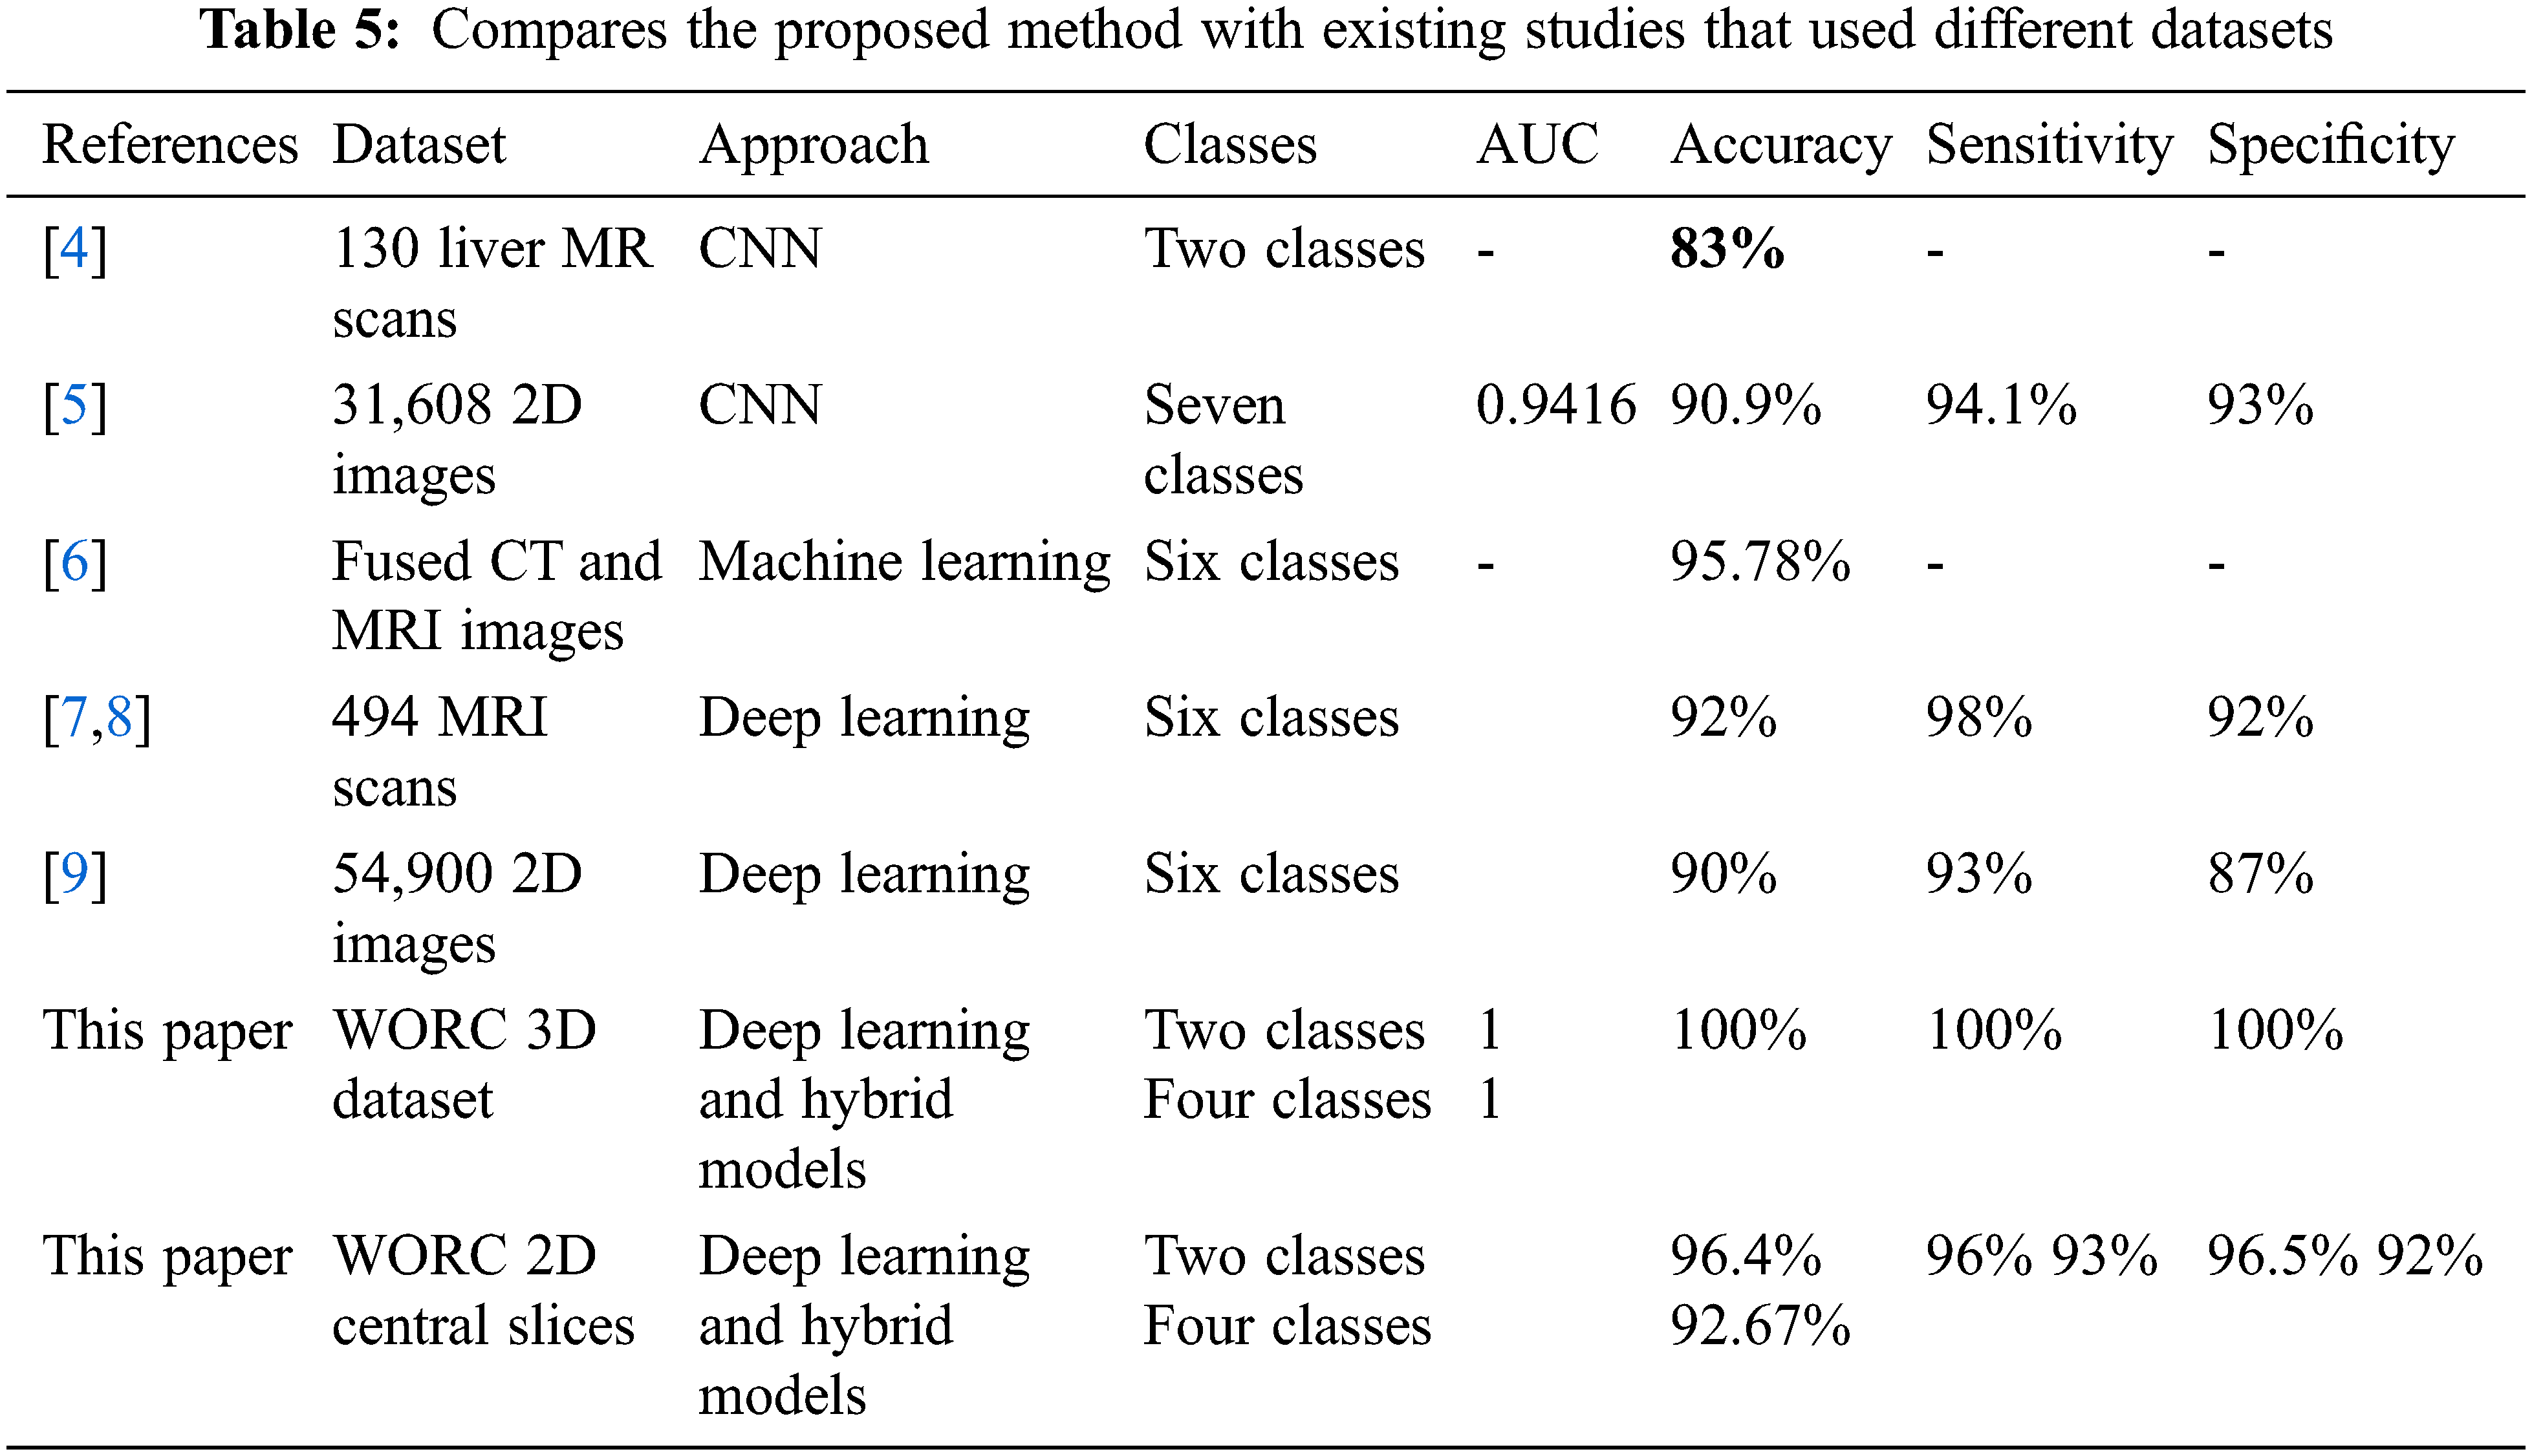
As clear from the table, this study compares the contribution of 3D deep learning structure with machine learning in obtaining the highest accuracy for four and two classes. Besides, this study reveals the disadvantages of using 2D classification for obtaining robust models in 3D classification tasks.
Any abnormal growth in the liver cells can be defined as a hepatic tumor. These tumors can be classified as benign or malignant with different degrees of severity. Early detection of such tumors may prevent complications and ramifications in the affected patients. Medical imaging is one of the most common and effective tools to detect these abnormalities and uncover the condition of internal organs. MRI imaging is the best modality to differentiate internal tissues due to its ability to enhance the contrast and provides sufficient details about the soft human tissues. This study uses 3D MRI liver tumor images to build an automated intelligent system capable of discriminating between benign tumors being HNF and HCA phenotypes and malignant tumors being HCC and iCCA phenotypes. The suggested approach combined features related to hepatic tumor texture, tumor shape, and deep features. The model then chose different types of features by employing an efficient selection method. Moreover, an ensemble classifier enhanced the performance of the proposed method and achieved an accuracy of 100% in discriminating between all four classes. Unfortunately, few studies explored the dataset used in this research. One study utilized a machine learning approach to discriminate liver tumors. Still, their results were lower than the results obtained in this study.
This paper illustrated the benefits of employing a 3D convolutional neural network and transfer learning to extract the most related and representative tumor features. In general, deep graphical features reduce the risk of misclassification and improve the accuracy of the machine learning model in discriminating different classes. The top performance obtained can also be attributed to the use of cascaded classifiers. In each stage, SVM succeeded in discriminating between two types of classes locally, resulting in the reduction and even elimination of the false positive and false negative cases of the global four classes problem. Similar performance cannot be obtained when deep learning classification is exploited as a one-stage classifier for solving multi-class problems. It seems that cascading resolves the classification complexity by partitioning the instances/data into generic classes and then refining the general classes into further sub-classes. Finally, we recommend the use of hybrid models in many medical fields to build a highly effective, dependable, and trustable computer-aided diagnosis system.
The limitations of the presented study are summarized by the requirement of a high-response PC because dealing with 3D images is time-consuming. On the other hand, high contrast images are required to help the proposed CAD system to discriminate the tumor and classify it correctly.
Acknowledgment: The authors would thank the Universiti Malaysia Perlis and anonymous reviewers for their contribution to enhancing this paper.
Funding Statement: The authors received no specific funding for this study.
Availability of Data and Materials: The dataset analyzed during the current study was derived from the WORC database, which includes labeled MR liver tumor images for 186 patients. The data is available online: https://xnat.bmia.nl/data/projects/worc (accessed on 25 January 2022).
Conflicts of Interest: The authors declare they have no conflicts of interest to report regarding the present study.
References
1. E. C. Seaberg, S. H. Belle, K. C. Beringer, J. L. Schivins and K. M. Detre, “Liver transplantation in the United States from 1987–1998: Updated results from the pitt-unos liver transplant registry,” Clinical Transplants, pp. 17–37, 1998. [Google Scholar]
2. Z. Qiu, H. Li, Z. Zhang, Z. Zhenfeng, S. He et al., “A pharmacogenomic landscape in human liver cancers,” Cancer Cell, vol. 36, no. 2, pp. 179.e11–193.e11, 2019. [Google Scholar]
3. X. Xu, Y. Mao, Y. Tang, L. Yang, X. Cailin et al., “Classification of hepatocellular carcinoma and intrahepatic cholangiocarcinoma based on radiomic analysis,” Computational and Mathematical Methods in Medicine, vol. 2022, pp. 1–9, 2022. [Google Scholar]
4. E. Trivizakis, G. C. Manikis, K. Nikiforaki, D. Konstantinos, C. Manos et al., “Extending 2-D convolutional neural networks to 3-D for advancing deep learning cancer classification with application to mri liver tumor differentiation,” IEEE Journal of Biomedical and Health Informatics, vol. 23, no. 3, pp. 923–930, 2019. [Google Scholar]
5. S. H. Zhen, M. Cheng, Y. B. Tao, Wang, Y. Fan et al., “Deep learning for accurate diagnosis of liver tumor based on magnetic resonance imaging and clinical data,” Frontiers in Oncology, vol. 10, pp. 14, 2020. [Google Scholar]
6. S. Naeem, A. Ali, S. Qadri, M. Wali Khan, T. Nasser et al., “Machine-learning based hybrid-feature analysis for liver cancer classification using fused (MR and CT) images,” Applied Sciences (Switzerland), vol. 10, no. 9, pp. 3134–3156, 2020. [Google Scholar]
7. C. A. Hamm, C. J. Wang, L. J. Savic, F. Marc, S. Isabel et al., “Deep learning for liver tumor diagnosis part I: Development of a convolutional neural network classifier for multi-phasic MRI,” European Radiology, vol. 29, no. 7, pp. 3338–3347, 2019. [Google Scholar]
8. C. J. Wang, C. A. Hamm, L. J. Savic, F. Marc, S. Isabel et al., “Deep learning for liver tumor diagnosis part II: Convolutional neural network interpretation using radiologic imaging features,” European Radiology, vol. 29, no. 7, pp. 3348–3357, 2019. [Google Scholar]
9. J. Kim, J. H. Min, S. K. Kim, S. Y. Shin and M. W. Lee, “Detection of hepatocellular carcinoma in contrast-enhanced magnetic resonance imaging using deep learning classifier: A multi-center retrospective study,” Scientific Reports, vol. 10, no. 1, pp. 1–11, 2020. [Google Scholar]
10. M. P. A. Starmans, R. L. Miclea, V. Vilgrain, M. Ronot, Y. Purcell et al., Automated differentiation of malignant and benign primary solid liver lesions on MRI: an externally validated radiomics model, medRxiv, vol. August, pp. 1–24, 2021. [Google Scholar]
11. C. Meng, H. Li, C. Chen, W. Wei, G. Jing et al., “Serum Raman spectroscopy combined with Gaussian—convolutional neural network models to quickly detect liver cancer patients,” Spectroscopy Letters, vol. 55, no. 2, pp. 79–90, 2022. [Google Scholar]
12. M. P. A. Starmans, M. J. M. Timbergen, M. Vos, A. P. Guillaume, J. D. Grünhagen et al., “The WORC database: MRI and CT scans, segmentations, and clinical labels for 930 patients from six radiomics studies,” medRxiv, pp. 2021.08.19.21262238, 2021. [Google Scholar]
13. S. Liu, W. Cai, Y. Song, P. Sonia, K. Ron et al., “Localized sparse code gradient in Alzheimer’s disease staging,” in Proc. of the Annual Int. Conf. of the IEEE Engineering in Medicine and Biology Society, EMBS, Osaka, Japan, pp. 5398–5401, 2013. [Google Scholar]
14. Y. Fan, “Ordinal ranking for detecting mild cognitive impairment and alzheimer’s disease based on multimodal neuroimages and CSF biomarkers,” in Lecture Notes in Computer Science (Including Subseries Lecture Notes in Artificial Intelligence and Lecture Notes in Bioinformatics), Springer, Berlin, Heidelberg, pp. 44–51, 2011. [Google Scholar]
15. S. Klöppel, C. M. Stonnington, C. Chu, D. Bogdan, S. Rachael et al., “Automatic classification of mr scans in Alzheimer’s disease,” Brain, vol. 131, no. 3, pp. 681–689, 2008. [Google Scholar]
16. S. Liu, W. Cai, L. Wen, S. Eberl, M. J. Fulham et al., “Localized functional neuroimaging retrieval using 3D discrete curvelet transform,” in Proc.-Int. Symp. on Biomedical Imaging, Chicago, Illinois, USA, pp. 1877–1880, 2011. [Google Scholar]
17. J. E. Iglesias, J. Jiang, C. Y. Liu and Z. Tu, “Classification of alzheimer’s disease using a self-smoothing operator,” in Lecture Notes in Computer Science (Including Subseries Lecture Notes in Artificial Intelligence and Lecture Notes in Bioinformatics), Springer, Berlin, Heidelberg, pp. 58–65, 2011. [Google Scholar]
18. S. Liu, W. Cai, L. Wen and D. D. Feng, “Multiscale and multiorientation feature extraction with degenerative patterns for 3D neuroimaging retrieval,” in Proc.-Int. Conf. on Image Processing, ICIP, Orlando, Florida, U.S.A, pp. 1249–1252, 2012. [Google Scholar]
19. Q. T. Qiu, J. Zhang, J. H. Duan, S. Z. Wu, J. L. Ding et al., “Development and validation of radiomics model built by incorporating machine learning for identifying liver fibrosis and early-stage cirrhosis,” Chinese Medical Journal, vol. 133, no. 22, pp. 2653–2659, 2020. [Google Scholar]
20. M. Shetty, “Imaging and differential diagnosis of ovarian cancer,” Seminars in Ultrasound, CT and MRI, vol. 40, no. 4, pp. 302–318, 2019. [Google Scholar]
21. B. Taouli and D. M. Koh, “Diffusion-weighted mr imaging of the liver,” Radiology, vol. 254, no. 1, pp. 47–66, 2010. [Google Scholar]
22. L. Petitclerc, G. Gilbert, B. N. Nguyen and A. Tang, “Liver fibrosis quantification by magnetic resonance imaging,” Topics in Magnetic Resonance Imaging, vol. 26, no. 6, pp. 229–241, 2017. [Google Scholar]
23. H. Donato, M. França, I. Candelária and F. Caseiro-Alves, “Liver MRI: From basic protocol to advanced techniques,” European Journal of Radiology, vol. 93, pp. 30–39, 2017. [Google Scholar]
24. G. Lehmann and D. Legland, “Efficient n-dimensional surface estimation using crofton formula and run-length encoding,” The Insight Journal, http://hdl.handle.net/10380/3342, pp. 1–10, 2022. [Google Scholar]
25. R. M. Haralick, I. Dinstein and K. Shanmugam, “Textural features for image classification,” IEEE Transactions on Systems, Man and Cybernetics, vol. SMC-3, no. 6, pp. 610–621, 1973. [Google Scholar]
26. B. Thamaraichelvi and G. Yamuna, “Gray level co- occurrence matrix features based classification of tumor in medical images,” ARPN Journal of Engineering and Applied Sciences, vol. 11, no. 19, pp. 11403–11414, 2016. [Google Scholar]
27. F. Tsai, C. K. Chang, J. Y. Rau, T. H. Lin and G. R. Liu, “3D computation of gray level co-occurrence in hyperspectral image cubes,” in Lecture Notes in Computer Science (Including Subseries Lecture Notes in Artificial Intelligence and Lecture Notes in Bioinformatics), Springer, Berlin, Heidelberg, pp. 429–440, 2007. [Google Scholar]
28. E. Ben Othmen, M. Sayadi and F. Fniaech, “3D gray level co-occurrence matrices for volumetric texture classification,” in 2013 3rd Int. Conf. on Systems and Control, ICSC 2013, Algiers, Algeria, pp. 833–837, 2013. [Google Scholar]
29. T. Dacheng, L. Xuelong, Y. Yuan, Y. Nenghai, L. Zhengkai et al., “A set of novel textural features based on 3D co-occurrence matrix for content-based image retrieval,” in Proc. of the 5th Int. Conf. on Information Fusion, FUSION 2002, Maryland, USA, pp. 1403–1407, 2002. [Google Scholar]
30. W. S. Chen, R. H. Huang and L. Hsieh, “Iris recognition using 3D co-occurrence matrix,” in Lecture Notes in Computer Science (Including Subseries Lecture Notes in Artificial Intelligence and Lecture Notes in Bioinformatics), Springer, Berlin, Heidelberg, pp. 1122–1131, 2009. [Google Scholar]
31. R. Y. Dillak, S. Dana and M. Beily, “Face recognition using 3D glcm and elman levenberg recurrent neural network,” in Proc.-2016 Int. Seminar on Application of Technology for Information and Communication, ISEMANTIC 2016, Semarang, Indonesia, pp. 152–156, 2017. [Google Scholar]
32. J. Tan, Y. Gao, Z. Liang, C. Weiguo, P. Marc et al., “3D-glcm cnn: A 3-dimensional gray-level co-occurrence matrix-based cnn model for polyp classification via ct colonography,” IEEE Transactions on Medical Imaging, vol. 39, no. 6, pp. 2013–2024, 2020. [Google Scholar]
33. S. Barburiceanu, R. Terebe and S. Meza, “Improved 3d co-occurrence matrix for texture description and classification,” in 2020 14th Int. Symp. on Electronics and Telecommunications, ISETC 2020, Timişoara, România, pp. 1–10, 2020. [Google Scholar]
34. S. Barburiceanu, R. Terebes and S. Meza, “3D texture feature extraction and classification using glcm and lbp-based descriptors,” Applied Sciences (Switzerland), vol. 11, no. 5, pp. 1–26, 2021. [Google Scholar]
35. K. He, X. Zhang, S. Ren and J. Sun, “Deep residual learning for image recognition,” in Proc. of the IEEE Computer Society Conf. on Computer Vision and Pattern Recognition, Honolulu, Hawaii, pp. 770–778, 2016. [Google Scholar]
36. S. Poudel, Y. J. Kim, D. M. Vo and S. W. Lee, “Colorectal disease classification using efficiently scaled dilation in convolutional neural network,” IEEE Access, vol. 8, pp. 99227–99238, 2020. [Google Scholar]
37. W. Ullah, A. Ullah, I. U. Haq, K. Muhammad, M. Sajjad et al., “CNN features with bi-directional LSTM for real-time anomaly detection in surveillance networks,” Multimedia Tools and Applications, vol. 80, no. 11, pp. 16979–16995, 2021. [Google Scholar]
38. H. Wu, M. Xin, W. Fang, H. M. Hu and Z. Hu, “Multi-level feature network with multi-loss for person re-identification,” IEEE Access, vol. 7, pp. 91052–91062, 2019. [Google Scholar]
39. J. Chen, M. Zhou, D. Zhang, H. Huang and F. Zhang, “Quantification of water inflow in rock tunnel faces via convolutional neural network approach,” Automation in Construction, vol. 123, 2021. [Google Scholar]
40. R. P. L. Durgabai and Y. R. Bushan, “Feature selection using relieff algorithm,” International Journal of Advanced Research in Computer and Communication Engineering, vol. 3, no. 10, pp. 8215–8218, 2014. [Google Scholar]
41. A. Stief, J. R. Ottewill and J. Baranowski, “Relief f-based feature ranking and feature selection for monitoring induction motors,” in 2018 23rd Int. Conf. on Methods and Models in Automation and Robotics (MMAR 2018), Międzyzdroje, Poland, pp. 171–176, 2018. [Google Scholar]
42. J. Cao, G. Lv, C. Chang and H. Li, “A feature selection based serial svm ensemble classifier,” IEEE Access, vol. 7, pp. 144516–144523, 2019. [Google Scholar]
43. H. Alquran, W. A. Mustafa, I. A. Qasmieh, M. Y. Yasmeen, M. Alsalatie et al., “Cervical cancer classification using combined machine learning and deep learning approach,” Computers, Materials & Continua, vol. 72, no. 3, pp. 5117–5134, 2022. [Google Scholar]
44. E. Amir, S. Luo and R. Chiong. “Introducing transfer learning to 3D ResNet-18 for Alzheimer’s disease detection on MRI images,” in 35th Int. Conf. on Image and Vision Computing, New Zealand (IVCNZ), Wellington, New Zealand, pp. 1–6, 2020. [Google Scholar]
45. K. Alawneh, H. Alquran, M. Alsalatie, W. A. Azani, A. Yazan et al., “LiverNet : Diagnosis of liver tumors in human ct images,” Applied Sciences (Switzerland), vol. 12, no. 11, pp. 1–16, 2022. [Google Scholar]
Cite This Article
 Copyright © 2023 The Author(s). Published by Tech Science Press.
This work is licensed under a Creative Commons Attribution 4.0 International License , which permits unrestricted use, distribution, and reproduction in any medium, provided the original work is properly cited.
 Downloads
 Citation Tools