
 Submit a Paper
 Propose a Special lssue
 Open Access
ARTICLE

AlertInsight: Mining Multiple Correlation For Alert Reduction
1 School of Computer Science and Engineering, Northeastern University, Shenyang, 110169, China
2 Neusoft Corporation, Shenyang, 110179, China
* Corresponding Author: Xia Zhang. Email:
Computer Systems Science and Engineering 2023, 46(2), 2447-2469. https://doi.org/10.32604/csse.2023.037506
Received 06 November 2022; Accepted 28 December 2022; Issue published 09 February 2023
 View Full Text
 Download PDF
Abstract
Modern cloud services are monitored by numerous multidomain and multivendor monitoring tools, which generate massive numbers of alerts and events that are not actionable. These alerts usually carry isolated messages that are missing service contexts. Administrators become inundated with tickets caused by such alert events when they are routed directly to incident management systems. Noisy alerts increase the risk of crucial warnings going undetected and leading to service outages. One of the feasible ways to cope with the above problems involves revealing the correlations behind a large number of alerts and then aggregating the related alerts according to their correlations. Based on these guidelines, AlertInsight, a framework for alert event reduction, is proposed in this paper. In AlertInsight, the correlations among event sources are found by mining a sequence of historical events. Then, event correlation knowledge is employed to build an online detector targeting the correlated events that are hidden in the event stream. Finally, the correlated events are aggregated into a single high-level event for alert reduction. Because of the weaknesses of the commonly used pairwise correlation analysis methods in complex environments, an innovative approach for multiple correlation mining, which overcomes computational complexity challenges by scanning panoramic views of historical episodes from the perspective of holism, is proposed in this paper. In addition, a neural network-based correlated event detector that can learn the event correlation knowledge generated from correlation mining and then detect the correlated events in a sequence online is proposed. Experiments are conducted to test the effectiveness of AlertInsight. The experimental results (precision = 0.92, recall = 0.93, and F1-score = 0.93) demonstrate the performance of AlertInsight for the recognition of multiple correlated alerts and its competence for alert reduction.Keywords
With the rapid development of advanced technologies such as big data, artificial intelligence, and the Internet of Things, modern cloud-based information systems are becoming increasingly massive and complex [1–3]. The operation and maintenance of cloud services are usually supported by automated platforms where numerous and varied monitoring tools are deployed to constantly patrol the running statuses of cloud services and related technology stacks. When anomalies are detected, the monitoring tools report alert events to the administrators, who can identify and handle them as soon as possible. On the one hand, the deployment of monitoring will gradually expand and penetrate various fields with the evolution of business applications. On the other hand, administrators always conduct comprehensive monitoring strategies for safety purposes. This situation adequately ensures that administrators perceive anomalies in time. However, at the same time, it also brings nonnegligible side effects. Some root cause problems may lead to numerous consequential alert messages from different sources, and redundant alerts may overload the administrators. This unwanted situation is called alert flooding [4,5]. Without understanding the event correlations hidden in flooding, it is challenging for administrators to prioritize critical alerts and assess possible incident impacts. In contrast, if we know the correlations among events, we can group the discrete events into clusters according to their correlations. Compared with those obtained from many independent original events, aggregation results significantly reduce administrators’ workload. Correlation knowledge can also effectively help administrators narrow their scope of attention and infer the propagation paths of failures. Moreover, this alert reduction idea does not interfere with the deployment of alert policies, which can still have the fine granularity to ensure a full runtime range for system monitoring.
However, obtaining knowledge of the correlations among alert event sources is nontrivial. Traditionally, such correlation knowledge usually comes from expert experience, but unfortunately, expertise mostly includes condensed, abstract, and generalized dogma, so it is still a long way from direct practice. Much research seeks to discover correlation knowledge using data mining [6,7]. This approach is free from mechanical models and empirical guidance, but only by the characteristics of the historical events can we determine the evidence of the correlations contained in it and then obtain correlation knowledge. Compared with methods based on expert experience, data mining methods are more targeted, practical, and easier to implement as automated and intelligent tools.
This paper focuses on discovering event correlations in an alert event sequence. According to our investigation, most correlation mining methods are generally based on pairwise correlations and assume that multiple correlations are composed of pairwise correlations from bottom to top [6,8,9]. As shown in Fig. 1, we first find the three pairwise relations, E1→E2, E2→E3, and E4→E2, and then, the clusters shown on the right side of Fig. 1 can be found. However, in our experience, the mining methods based on pairwise correlations are insufficient. Pairwise correlations have some limitations in alert correlation mining. Let us take an event sequence as an example, as shown in Fig. 2. The horizontal axis in Fig. 2 represents time, and the vertical axis represents different event sources. Intuitively, {E3, E4, E5} is a set of possibly correlated events. However, from the perspective of the correlations between any pair of the three events, E3, E4, and E5, neither the “statistical support” nor the “vector distance” measures can yield reliable pairwise correlations.
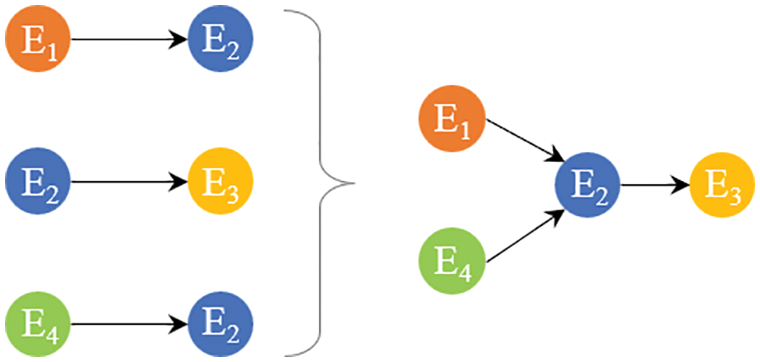
Figure 1: An example of composing multiple correlations by pairwise relations
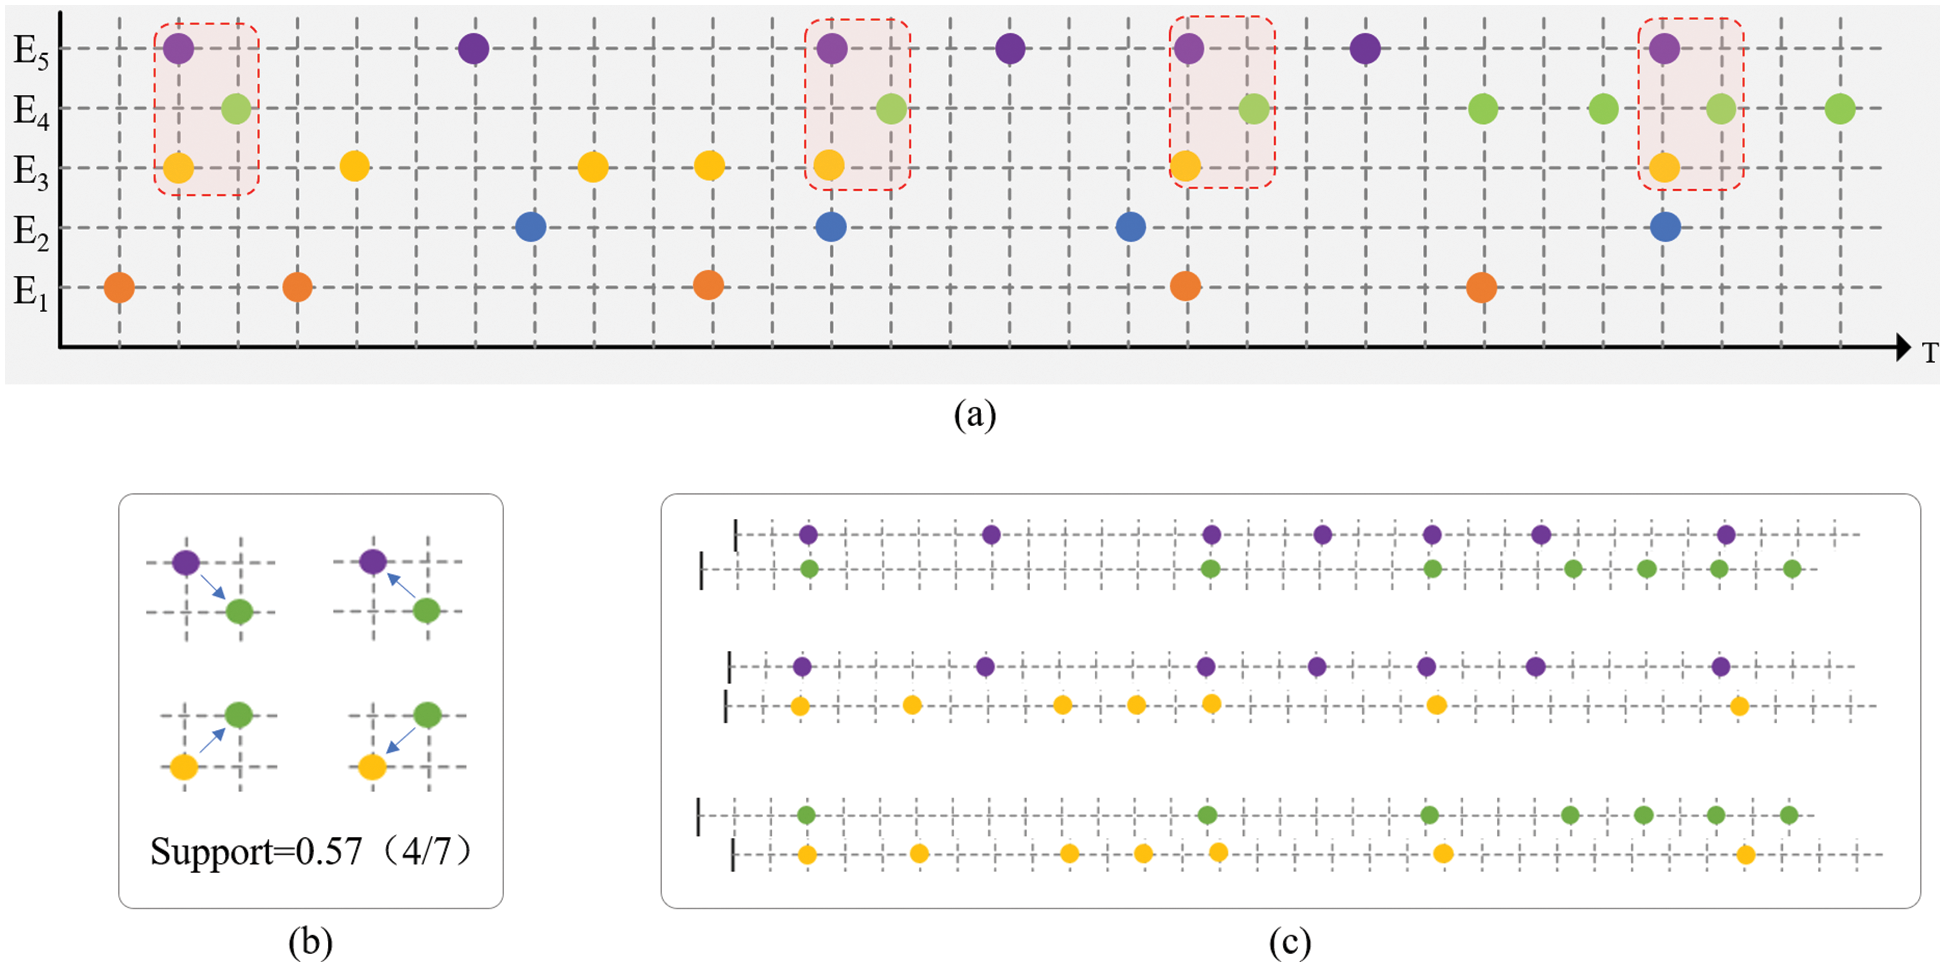
Figure 2: The dilemma of pairwise correlations. (a) An example of an event sequence. (b) Low accompanying support by statistics. (c) Large distance between vectors
In complex systems, many multiple correlations cannot be linearly constructed in a bottom-up manner via pairwise correlations. For this phenomenon, a qualitative analysis is given below. For example, concerning {E3, E4, E5}, among which any two events have no strong correlation, it is easy to find the actual significance as follows. A cloud service (E5) is supported by dual active instances (E3 and E4). E3 and E4 have weak influences on each other. When one fails, the over conformity caused by load shifting increases the failure probability of the other instance. The overlapping failures of E3 and E4 eventually lead to the breakdown of E5.
When analyzing multiple correlations straightforwardly, it is necessary to examine all combinations of events, which requires an algorithm with combinatorial complexity. Since there are often large numbers of event types in real problems, algorithms with combinatorial complexity are not feasible. Therefore, we attempt to innovatively discover multiple correlations among two or more events directly from historical episodes. We first illustrate this idea with a simple example. As shown in Fig. 3, we have attempted to adopt an approach with a more global and historical view, using unrelated random events as a background to highlight correlation clusters. We explain the method in detail in the following sections. In addition, the discovery of event correlations is not the ultimate goal. Based on correlation knowledge, we need to perform further research to detect correlated events from alert floods and reduce the number of alerts in real time. The following sections also elaborate on our correlated event detection model.
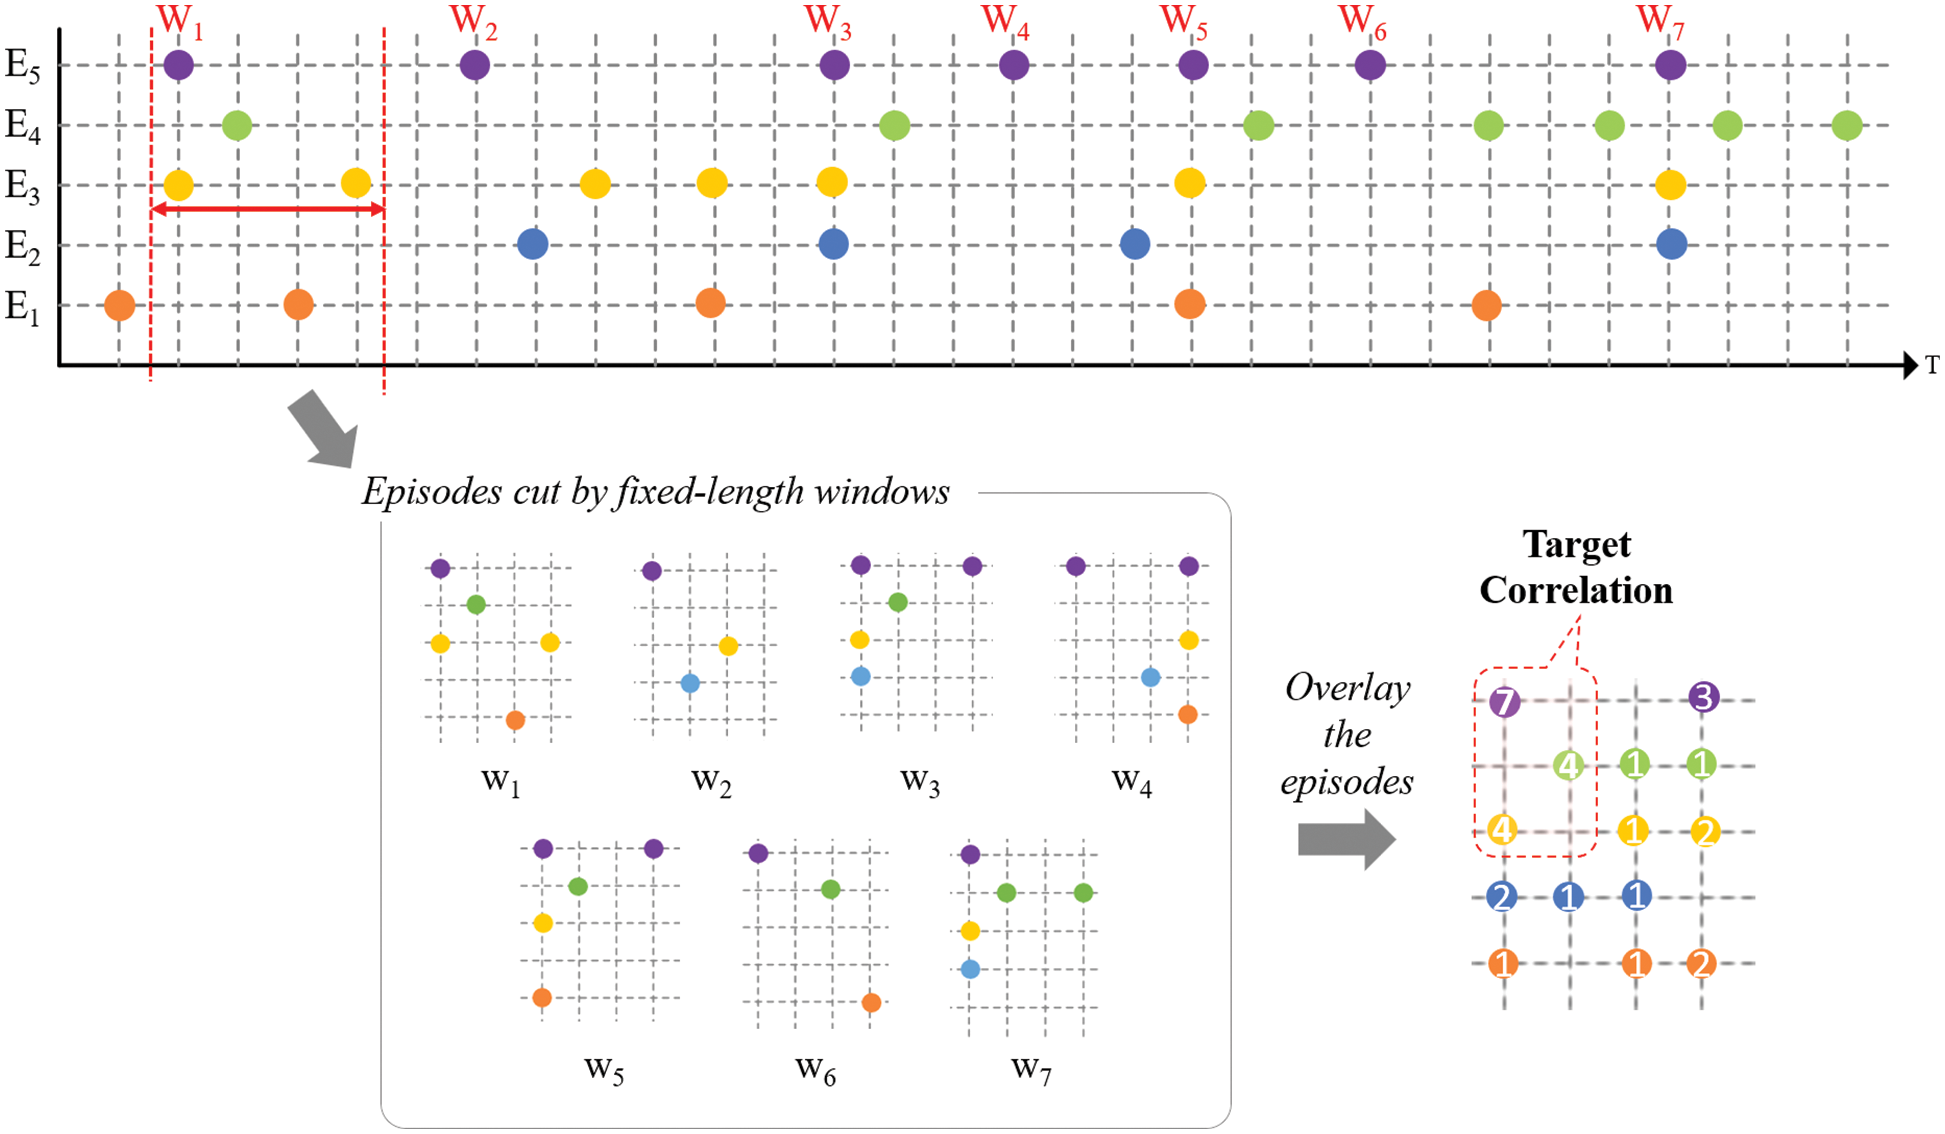
Figure 3: An example of the basic technical idea of our approach. The overlaid results of the historical episodes show significant local hotspots, which can be considered event correlations to be evaluated
Our contributions can be summarized as follows.
1. Motivated by real applications, this paper proposes an end-to-end framework called AlertInsight for alert reduction to help administrators respond to alert events more efficiently. AlertInsight can be used to discover event correlation knowledge by mining historical alert event sequences. Then, this knowledge can be used to detect the presence of correlated events in an event sequence online.
2. This paper proposes an unsupervised algorithm for mining multiple correlations to discover correlation knowledge.
3. To detect correlated events based on (2), an online model is designed based on machine learning, which can be used to identify correlated events from an alert event sequence in real time.
4. We conduct simulation experiments in which we compare AlertInsight with other correlation analysis methods and validate the effectiveness of the proposed correlated event detection model. The experimental results demonstrate the effectiveness of AlertInsight.
5. We have developed a simulation system to generate correlated events and released the source code publicly (available online at https://github.com/yumg/alerts-simulator), allowing researchers and practitioners to easily use it in future studies [10].
In this section, we first show the application scenarios of the target problems, then define several key concepts, and finally, provide the objective of our research.
Fig. 4 illustrates the application scenario of our research. Various monitoring tools generate a large number of alert events. Usually, these events are collected and persistently stored. Without losing generality, we assume that there is an event database that manages these event data. If the administrators browse events directly from the event database, they will likely be overwhelmed by redundant information overload. Therefore, it is necessary to set the “reduction filter” module to group raw alert events according to the obtained correlation knowledge. This module can provide a more organized and focused browsing view of alert events. This allows administrators to respond to alerts more efficiently. This paper studies how to obtain the “correlation knowledge” and build the “reduction filter” module. Next, we provide several necessary concepts to help elaborate the problem and specific research methods. For convenience, the main mathematical notations used in this paper are summarized in Table 1.
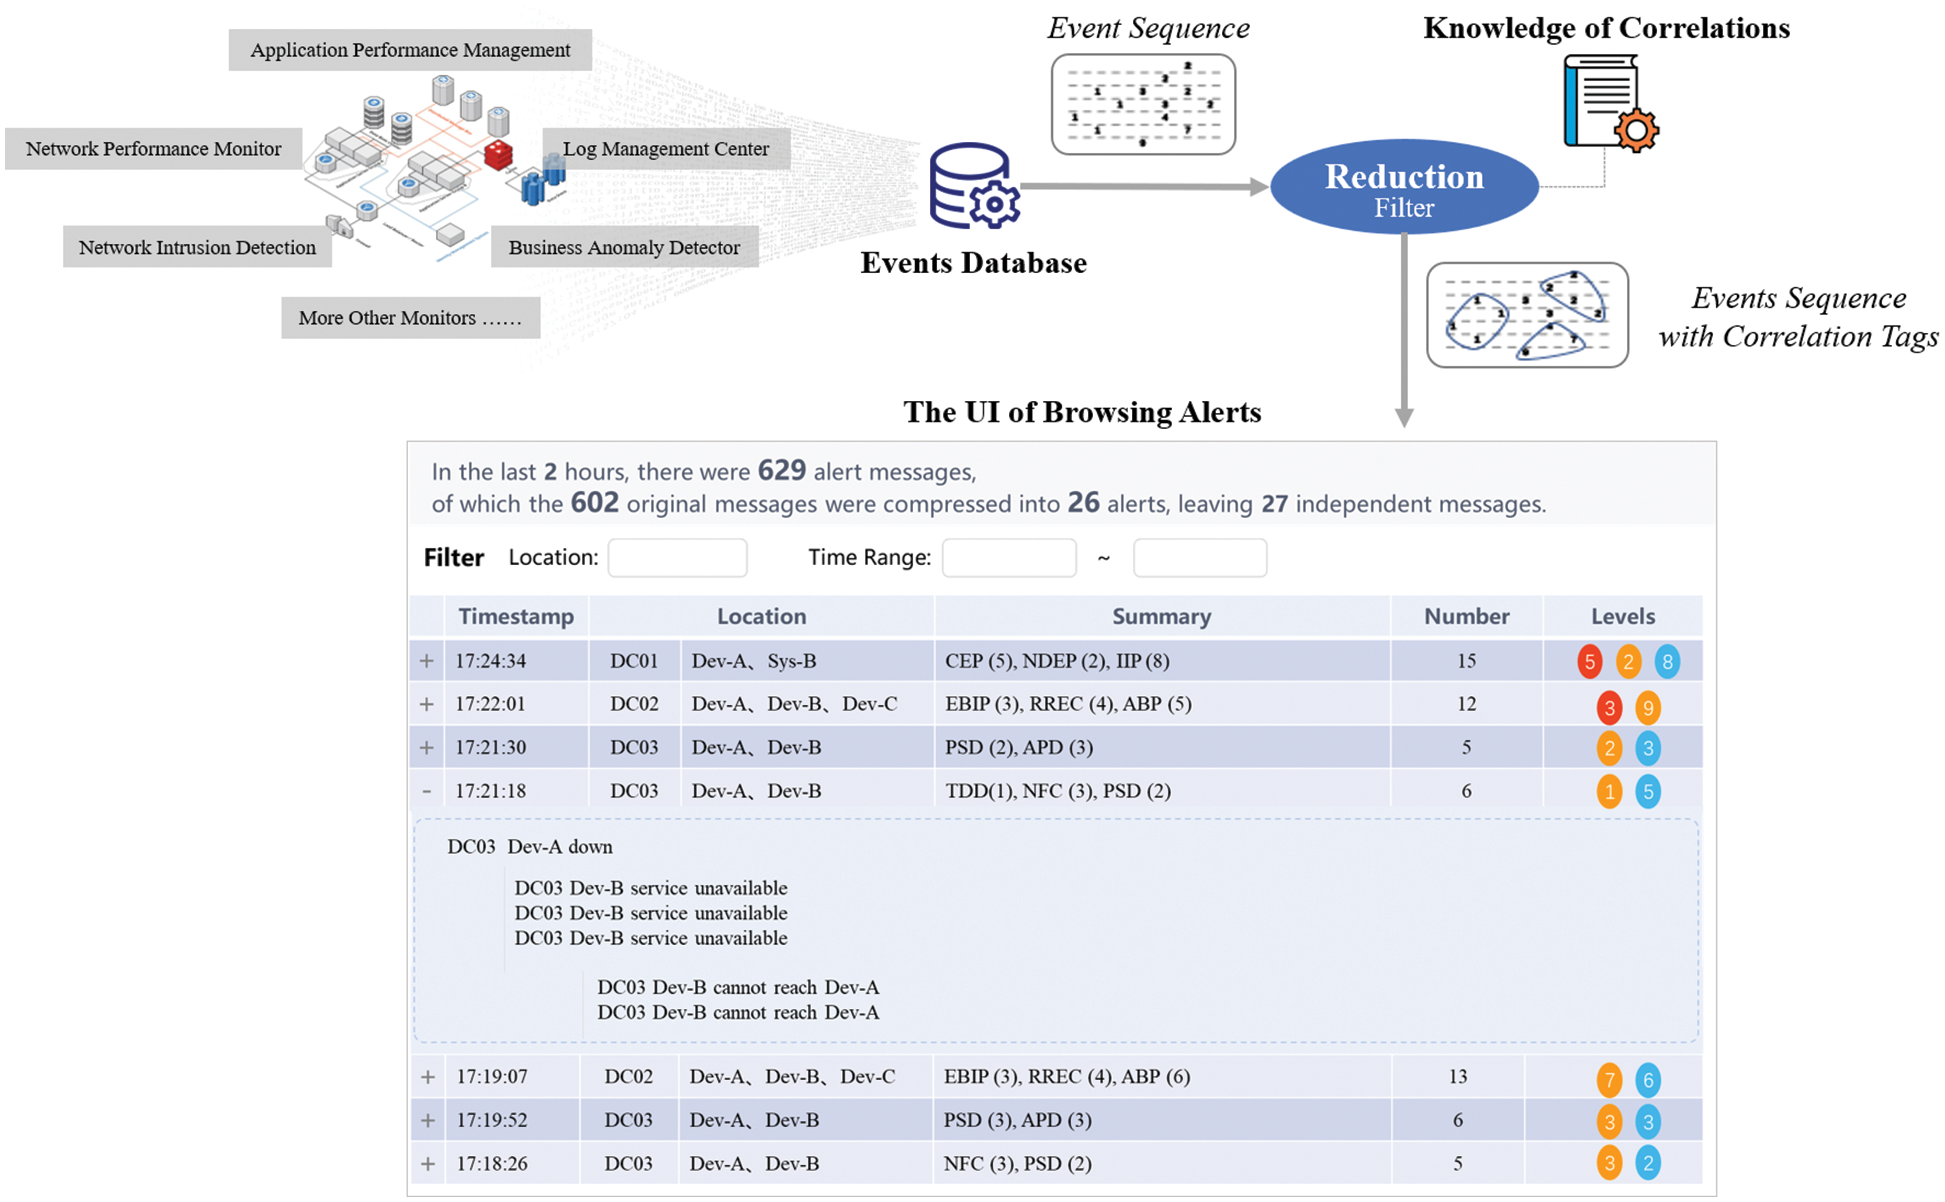
Figure 4: The application scenario and desired objective
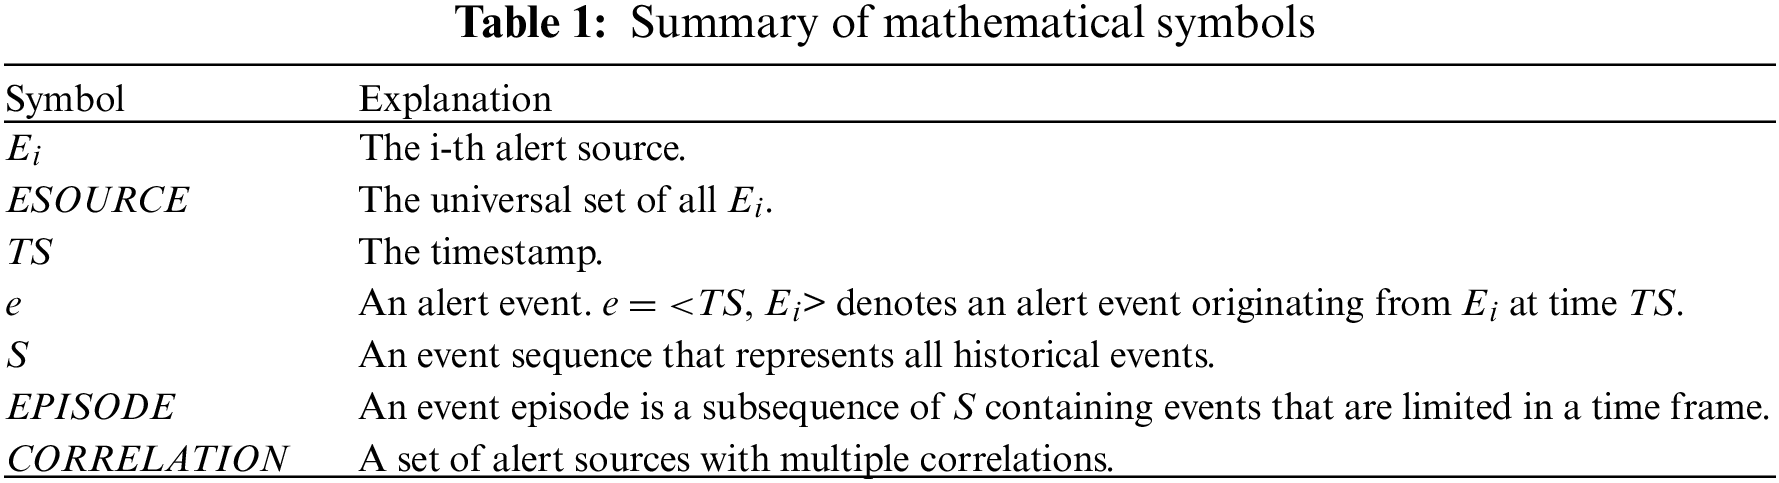
Alert Source and Alert Event: Alert events (hereafter referred to as events) originate from the triggering of an alert checking policy. The alert checking policy is the alert source, which also represents the event type. Conversely, each event is an instance of that type. We use the set ESOURCE = {Ei | i∈N*, i ≤ n} to represent n alert sources and the tuple e=<TS, Ei> to represent one alert event, where TS denotes the timestamp of the event, and Ei is the corresponding alert source.
Event Sequence: The alert sources generate events at all times, forming a sizable collection of events in which each event element <TS, Ei> has a timestamp property. Therefore, the events form a stream in chronological order, which we call an event sequence. Such a sequence can be expressed as a list S = [<TS1, Ei1>, <TS2, Ei2>, <TS3, Ei3>…<TSn, Ein>]. The time attributes of events make the event sequence more interesting; e.g., to examine event correlations, one should focus on event objects that occur closer together, and the repetition of historical events also brings many meaningful insights to data mining.
Event Episode: An event sequence usually refers to a whole collection or an unbounded stream. However, the study of event sequences often involves or focuses on some subsegments. An event episode is a subsegment containing events that are limited to a time frame. We use a list EPISODE = [<TSm, Ej1>, <TSm’, Ej2> … <TSn, Ejx>] to represent an event episode in some time range from TSm to TSn.
Event Correlation: In this paper, the so-called event correlation (“correlation” for short) refers to the companionship or co-occurrence between alert events generated from related sources. Based on this definition, we determine the relationships among the alert sources by searching the evidence of event companionship and symbiosis from the event sequence. The event correlations can be represented as sets of alert sources. For example, the set CORRELATION = {Ei, Ej, Ek} indicates that Ei, Ej, and Ek have multiple correlations.
With these definitions, our objective is to solve the following problems.
1. Correlation Mining: We aim to discover the event correlation knowledge contained in historical event sequences.
2. Correlated Event Detection: Based on the acquired event correlation knowledge, we want to detect the correlated events in an event sequence online.
For the problems in Section 2, we propose an end-to-end framework called AlertInsight for alert reduction, as shown in Fig. 5. The process of acquiring and applying the “correlation knowledge” using AlertInsight is described in detail. In AlertInsight, a module called “explorer” is set to find the correlations in an event database. The correlations and episodes are managed as knowledge. Since the task of the explorer is usually a sample mining process with limited historical information, not all the episodes with correlated events can be identified. Additionally, catching up with the latest events in a stream is unrealistic. Therefore, an additional detector module is set, which learns the event correlations and generalizes the ability to identify correlated events. Then, the detector can examine any episode online to suggest possible correlated events.
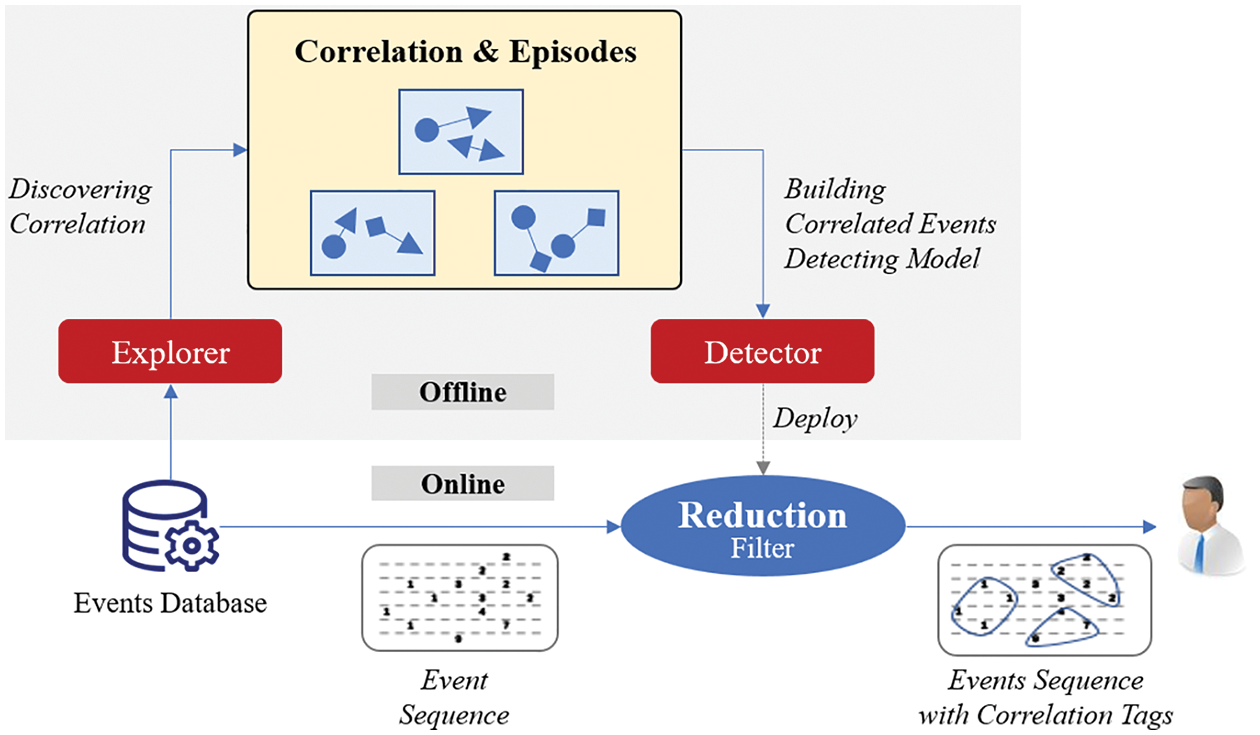
Figure 5: The framework of AlertInsight
AlertInsight is divided into offline and online parts. The offline work should be iteratively performed with reasonable scheduling. The explorer continuously replenishes and updates the “correlation patterns and episodes” in the knowledge base. When the knowledge base is updated, the detector must be updated accordingly. The detector is eventually embedded in the “reduction filter” to support correlated event aggregation for online browsing and querying. The explorer and detector are the two critical components of AlertInsight and correspond to the “correlation mining” and “correlated event detection” problems raised at the end of Section 2, respectively. In the following, we present the corresponding methods and models.
We mentioned some “correlation mining” challenges earlier. Multiple correlations may be missed or misjudged using methods based on pairwise correlation. Therefore, we propose an innovative method of multiple correlation mining for the explorer module of AlertInsight. We attempt to skip the study of pairwise correlations and use a holistic perspective to determine which multiple events may relate to each other.
The core idea for finding multiple correlations is as follows.
1. In general, events that receive attention are usually nonrandom. In other words, random situations are less worthy of attention.
2. Nonrandom events may recur for analogous reasons. The correlated events will be implicated in this recurrence.
3. Based on the above premise, compared with a random distribution, the clusters of events with repetitive traces indicate that the events involved may be relevant. The more significant the repetition, the more convincing it is.
The above also echoes the proverb “history repeats itself,” which is a phrase demonstrating the constant reincarnation and reciprocation of cause and effect in reality. A method based on pairwise correlations follows a reductionist logic. The opposite of reductionism is holism, which encourages us to go beyond the micro level and focus on the system as a whole.
Our proposed methodology for “correlation mining” is as follows. We examine the possible multiple correlations of each alert source in turn. Taking Ek ∈ ESOURCE as an example, we obtain all event instances of Ek from the event sequence S or a sample segment from S. Assuming that there are p event instances in Ek, which are denoted as ek (1 ≤ k ≤ p), we take each ek. TS as the base time and select the episode around that base moment. We assume there are p episodes, denoted as EPISODEk (1 ≤ k ≤ p). For convenience, we convert each EPISODEk into a vector EPISODE_Vk. Assuming that ESOURCE is ordered, for example, by the dictionary order of the source name, we sort EPISODE_Vk according to the order of EPISODE. Each element of EPISODE_Vk corresponds to an alert source EPISODE based on its position, and each element’s value is set as the time difference between ek. TS and the source’s instance. If there is no source, then Null is taken. We propose a reasonable presumption as follows by analyzing the p individual EPISODE_Vk in a cross-sectional comparison. In the p individual EPISODE_Vk, the elements corresponding to the events unrelated to ek will exhibit some randomness, while those intrinsically related to ek will show the opposite characteristic: a nonrandom distribution. Therefore, the next step is to distinguish the nonrandom events that are correlated with ek. For convenience, we set the matrix M = [EPISODE_V1, EPISODE_V2, … EPISODE_Vp]. Each column in M corresponds to the relative time to the Ek of a certain event source in the episodes. To distinguish nonrandom events, we first focus on the characteristics of the value distribution of each column of M. We use the interquartile range (IQR) [11] to determine the concentration of the distribution of the relative times: the more concentrated the distribution is, the smaller the IQR value, and conversely, the more random the distribution is, the larger the IQR value. Second, we can reasonably assume that the occurrences of correlated event sources are more numerous than those of uncorrelated sources. Under this assumption, we can search the event sources whose occurrences and IQRs are significantly distinguished from other sources. Any outlier detection algorithm can be used here. Our implementation utilizes the LOF method [12] to find occurrences/NormIQR significantly larger than normal and thus identify alert sources correlated with Ek. Eventually, the results can be represented as a set such as CORRELATIONEk = {Ek, Ex, Ey, Ez …}.
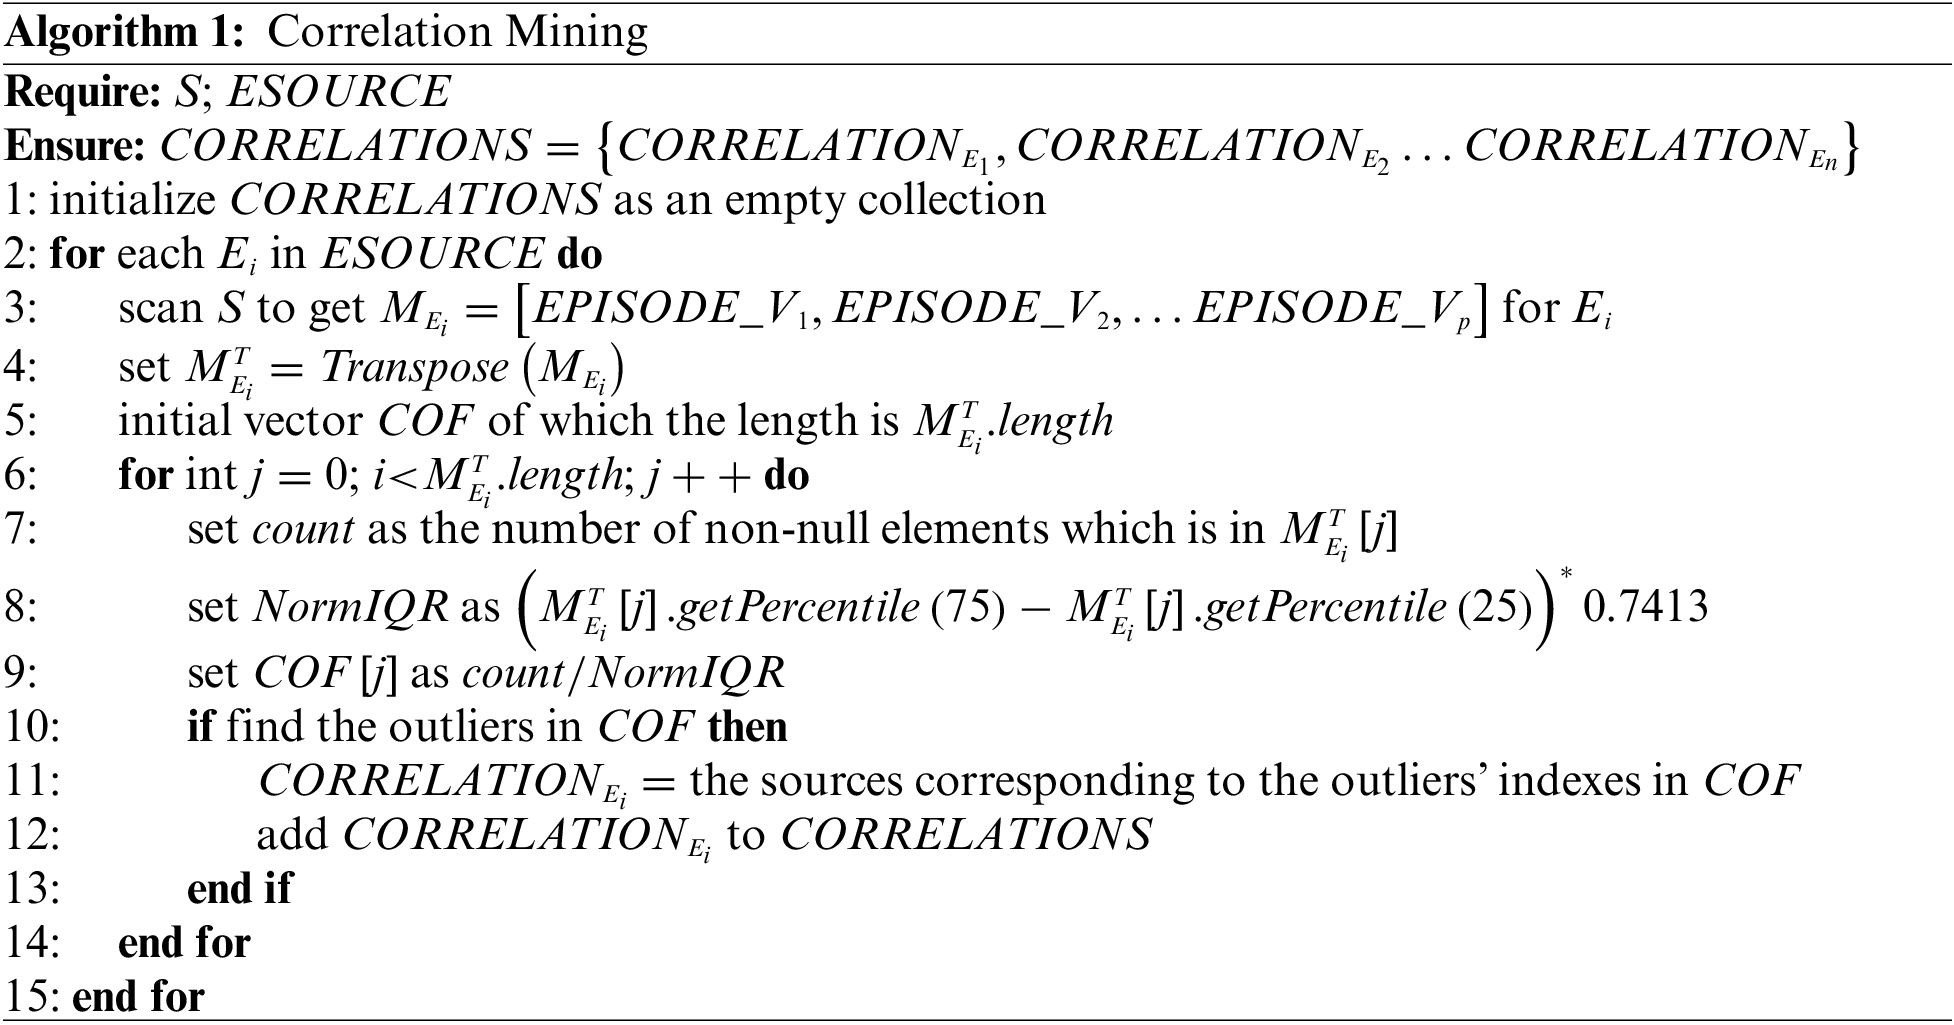
We give an example of the above process in Fig. 6, showing the data processing and computational steps for finding the correlation event set {E3, E4, E5} for E5. Moreover, we give the comprehensive and detailed pseudocode of the process in Algorithm 1. Based on the pseudocode of Algorithm 1, we can analyze the time complexity of the correlation mining process more clearly. The process is iterated for n event types, and in each iteration, n−1 calculations are needed to obtain the coefficients for every event type (n−1 in total). Then, an outlier detection algorithm is used to obtain the outliers among the n−1 coefficients. This paper uses the LOF algorithm for outlier detection, and its optimized time complexity is O(n × log(n)). Therefore, the overall time complexity of the above process is O(n(n + n × log(n))). Although the algorithm has O(n2× log(n)) complexity, it should be emphasized that the above notation n refers to the number of event types rather than the number of event instances in the sequence. That is, the time complexity of the correlation mining process is related only to the number of event types, not to the number of event instances. This is a great advantage because, in practice, the number of event types is often limited and relatively small. Moreover, in AlertInsight, the algorithm is executed in an offline batch fashion, requiring less responsiveness. Therefore, the complexity of O(n2× log(n)) is acceptable for the target scenario.
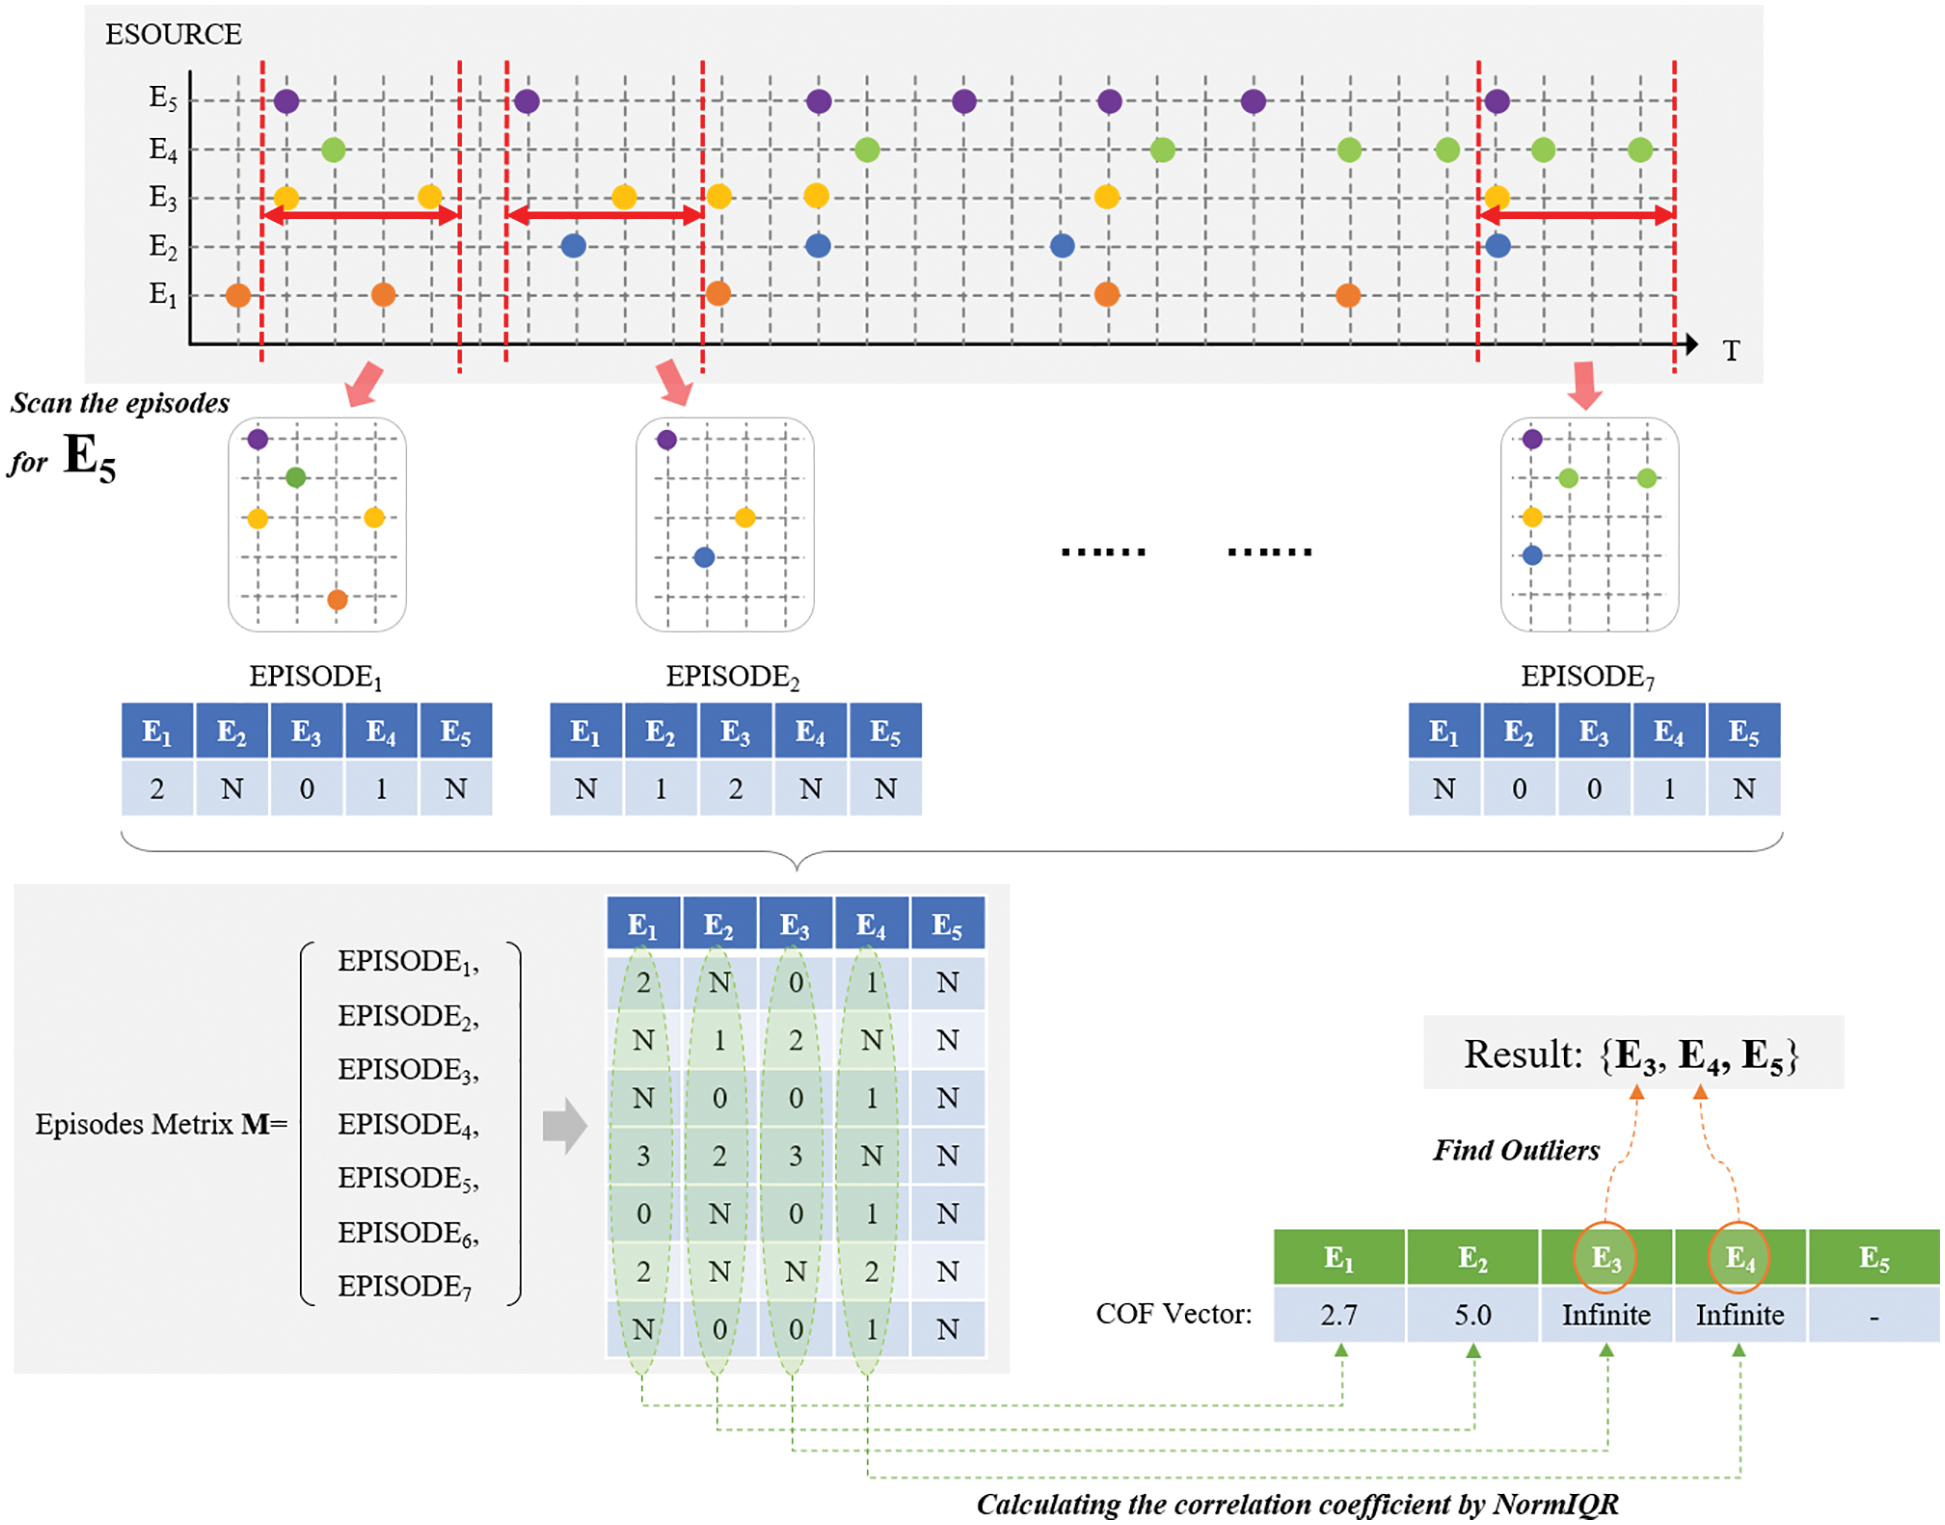
Figure 6: An example of the correlation mining process, in which we find the event sources correlated with E5
In addition, during the above process, it can be convenient to label the episodes that contain correlated events for the subsequent training of machine learning models for correlated event detection. It is also worth noting that if we assume that there can be more than one type of correlation for Ek, then, after each iteration, it is necessary to review the episodes that contain the correlated events involving Ek. These episodes need to be further clustered to obtain more accurate results. However, this assumption is ignored in this paper to highlight the basic idea.
3.3 Correlated Event Detection
The correlation mining method can be used to obtain results such as {E3, E4, E5}. However, correlations alone do not fully solve the target problem. We ultimately need to identify correlated events in the given episode. If the identification process relies on a correlation rule such as {E3, E4, E5}, the obtained identification results may be inaccurate. For example, we have the two correlations {E3, E4, E5} and {E4, E5, E6, E7}. Then, for an episode where E3, E4, E5, E6, and E7 exist, we have no way to determine which correlation actually applies to the episode and cannot accurately identify its correlated events. Therefore, to further achieve correlated event detection, we need to design a detection model for the detector module in AlertInsight.
As shown in Fig. 7, for each CORRELATION obtained by correlation mining, the corresponding EPISODEs are recorded. With this information, the problem of detecting correlated events in an EPISODE can be transformed into classifying the EPISODE itself, i.e., determining whether an EPISODE belongs to the category represented by a certain CORRELATION. This paper uses an artificial neural network (ANN) to implement the classification model. The advantages of the neural network are that it is robust for information processing and is more conducive to handling interference, such as noise and random disturbances generated in the production environment. Specifically, we design a binary classification model for each CORRELATION to determine whether an EPISODE belongs to that CORRELATION. Compared to multiclass classification, the binary classification model is more effortless. From the view of engineering, either a new CORRELATION emerges or an old CORRELATION is updated and does not affect the rest of the deployed model.
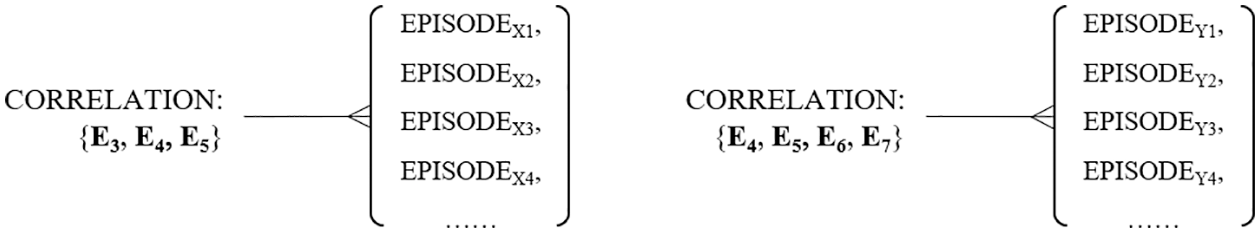
Figure 7: An example of the relations between CORRELATION and EPISODE
We present the ANN structure for reference, as shown in Fig. 8. The number of neurons in the input layer coincides with the number of alert sources. One hidden layer uses the rectified linear unit (ReLU) function as the activation function. The output layer has two neurons with the softmax function as the activation function to output the binary classification result. In AlertInsight, this network performs detection on real-time data streams online, so its responsiveness is very important. Therefore, we analyze its time complexity as follows. Let m denote the hidden layer size; then, since the number of neurons in the input layer coincides with the number of event types n, the time complexity of this model is O(n × m). In practice, the number of event types and the hidden layer size are often limited and relatively small, e.g., below 100. Therefore, the time complexity of O(n × m) is adequate for the responsiveness requirement.

Figure 8: The structure of the ANN utilized for correlated event detection
It is worth stating that for AlertInsight, the implementation of the detector is open. In addition to the ANN mentioned in this paper, many machine learning algorithms, such as decision trees, naive Bayes classifiers, and random forests, can be applied. Moreover, although supervised models are suggested, since the labels required by the model training process are generated automatically, there is no additional cost for manual data labeling. In addition, the time range of EPISODE needs to remain the same size during correlation mining and correlated event detection.
We evaluate AlertInsight through simulation experiments with explicit ground truths. First, we present the designs of the experiments, including the test datasets, the baseline algorithms, and the evaluation metrics. Then, we provide the experimental results and explain their implications.
Many works on alert reduction cite datasets generated based on intrusion detection [4,13]. In such datasets, alert events are mostly triggered by network attacks, and most research focuses on revealing the patterns of attack behavior hidden in the data. However, these datasets often lack rich and objective multiple correlations among events, which are particularly interesting in this paper. Therefore, these datasets are not suitable for validation in this paper.
To obtain datasets that effectively reflect the characteristics of the scenarios of interest, we develop a simulation system to simulate modular cloud service and module failures and produce validation datasets for empirical evaluation purposes. The simulation system can flexibly simulate diverse module correlations according to its configuration. Each module can have a certain probability of independent failure. This is because modules may not only fail independently but may also be implicated by their correlated modules, leading to correlated failures. The simulation system implements a monitoring mechanism that detects faults and generates alert events when the modules fail. We use AlertInsight to mine the correlations from those events and then compare the mining result with the ground truth to demonstrate the effectiveness of AlertInsight. Additionally, the simulation system provides an event sequence for detecting correlated events. We have made the code of the simulation system open source [10], allowing researchers and practitioners to easily use it in future studies.
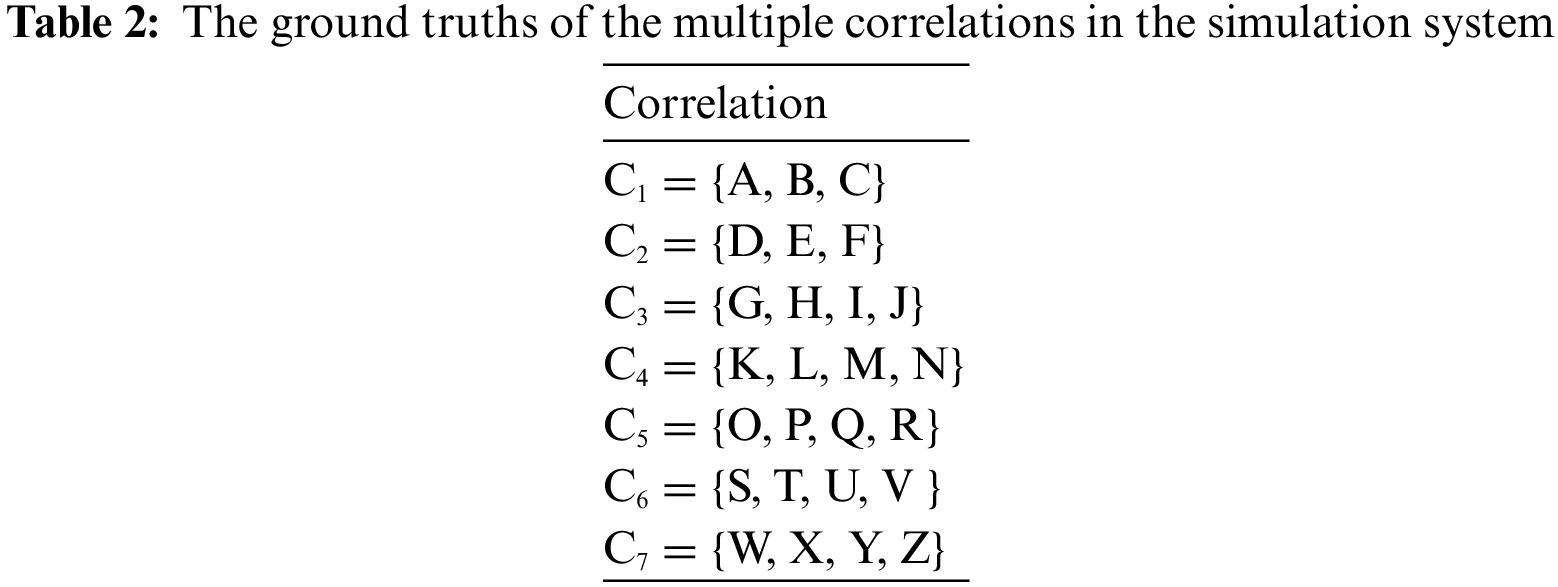
In the simulation, we set 52 modules identified by the 52 characters A–Z and A′–Z′. For modules A–Z, we set up several types of multiple correlations; therefore, in addition to their independent failures, these correlations lead to correlated failures. The other 26 modules A′–Z′ are independent and used as interference factors for correlation mining. Fig. 9 shows the correlations of modules A–Z. In Fig. 9, the nodes represent modules (event sources), the connections represent the relationships between the modules, and each connection’s direction represents its direction of influence. For example, a connection from A to B means that B is affected by A. Two types of connections are present in Fig. 9. One includes direct connections, such as the connection from A to B, which means that the failure of A will directly cause a cascading failure of B. The other type of connection is an intersecting connection at a plus node. For example, the connections from A and B converge to C, which means that a cascading failure of C can only occur because of a joint failure of A and B. Table 2 shows the ground truths in our experimental datasets, where multiple correlations are represented as a set Ci.
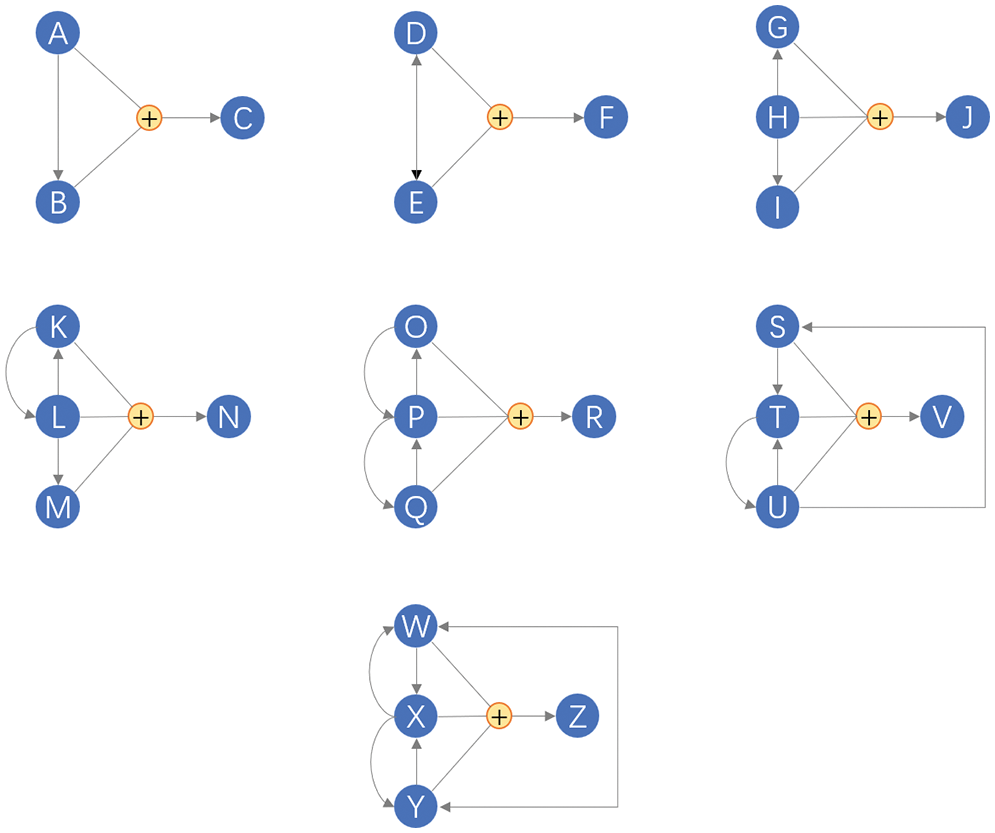
Figure 9: The multiple correlations in the simulation system
The abstract correlations shown in Fig. 9 have practical implications in reality. For example, to cope with the pressure imposed on the database by many concurrent requests and provide a low-latency service response, an architecture containing “MySQL + Redis” is used in the persistence layer of a cloud service. Let an event from A represents the situation in which the “Redis service is unavailable.” An event from B represents the situation in which “MySQL service is unavailable.” An event from C represents the situation in which the “cloud service is unavailable.” When the cache fails (the event from A), the database takes 100% of the request pressure. Therefore, the database failure probability increases significantly (the event from B). Subsequently (after both A and B), the cloud service is inevitably unavailable (the event from C).
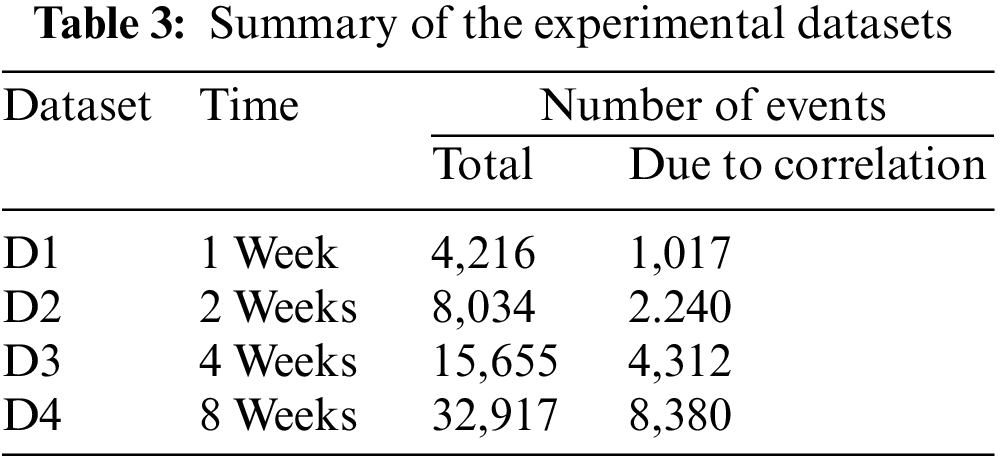
According to the correlation configuration shown in Fig. 9, we generate four datasets with different sizes, as shown in Table 3. Datasets D1–D4 possess different sizes and are generated by the simulation system in four batches, in which the generated contents are different due to random parameters.
We carefully choose four baseline algorithms (shown below) and conduct comparative experiments to examine the correlation mining effect of AlertInsight.
1. The J-measure [14] is an information-theoretic means of quantifying the information content of a rule, and it is widely used to measure event correlations.
2. Pearson correlation [15] is a popular method for measuring the linear correlation between a pair of time series.
3. Granger causality [16] is a hypothesis-testing method for determining whether a time series can be used to predict another.
4. Cross-correlation [17] is an evaluation method for measuring the latency and correlation of one set of time series relative to another.
There are two main reasons for choosing these four baseline algorithms. First, to the best of our knowledge, there are no other direct methods for calculating multiple correlations. Therefore, we have to use these four algorithms to address pairwise correlations and further combine the pairwise correlations to derive multiple correlations. Second, these four algorithms have been widely accepted as fundamental methods and have been cited in many related research works. For example, Su et al. [8] cited these algorithms to calculate the flux correlations of KPIs, and Luo et al. [15] cited these algorithms to correlate events with time series.
4.3 Evaluation Metric and Experimental Setup
We use the F1 score to evaluate the effectiveness of correlation mining. The F1 score is a commonly used evaluation metric for classification or clustering algorithms [18]. Its definition is shown in Eq. (1). Combining the specificity of the problem under study in this paper, we slightly modify the calculation parameters of the F1-score.
The definitions of Precision and Recall are shown in Eqs. (2) and (3), respectively
Our goal is to discover the multiple correlations shown in Table 2. Suppose that the result obtained from correlation mining contains some sets represented as Ci′ (i ≥ 0), where the elements of Ci′are correlated event sources. (1) If Ci includes Ci′ in the ground truth, it is counted as a TP. That is, from the perspective of the mining results, as long as a subset of the ground truth is contained in the mining results, it can be factored into Precision. (2) If one of the Ci is equal to Ci′ in the ground truth, it is counted as TP′. That is, from the perspective of the ground truth, only a mining result that is exactly equal to some ground truth can be counted in Recall. (3) For a given Ci′, if there is no Ci that includes it, it is counted as an FP. (4) If there exists a Ci without any Ci′ equal to it, it is counted as an FN.
For the baseline algorithms, since the thresholds (from 0 to 1) for the J-measure, Pearson correlation, and cross-correlation are usually determined based on actual requirements for Precision and Recall, we apply the precision-recall curve to select the best F1-score. For correlation mining, all algorithms use consistent sampling methods and the same sampling length of 900 s (including the vector length in the cross-correlation, Granger causality, and Pearson correlation methods; the tumbling window size in the J-measure method; and the episode length in AlertInsight). For correlated event detection, we use the ANN structure shown in Fig. 8, which is a backpropagation neural network with three layers. The number of neurons in the input layer coincides with the number of alert sources. The hidden layer utilizes the rectified linear unit (ReLU) function as the activation function, and the number of neurons in the hidden layer is 32. The output layer has two neurons with the softmax function as the activation function to output the binary classification result.
For fairness of comparison, we have conducted each experiment 10 times to avoid bias from randomization. All the experiments were conducted on a server with an Intel(R) Core(TM) i5-8250U CPU @ 1.6 GHz, 1.80 GHz, 16 GB RAM, and Windows 11. All the programs were coded with Java 8, and the artificial neural network for correlated event detection was implemented based on Eclipse Deeplearning4j [19].
4.4.1 The Overall Correlation Mining Performance
Discovering correlations is one of the crucial steps of the full process. We first present the best F1-scores obtained by the five tested correlation mining methods on datasets D1–D4 in Fig. 10. Overall, AlertInsight significantly outperforms the other four algorithms. Low precision values are observed for the remaining four algorithms, mainly due to their misidentification of correlations. This leads to suboptimal F1 scores, which are more pronounced for the granger causality and cross-correlation algorithms. In contrast, high and balanced recall and precision scores are obtained using AlertInsight, so it can meet the application requirements of the problem studied in this paper.
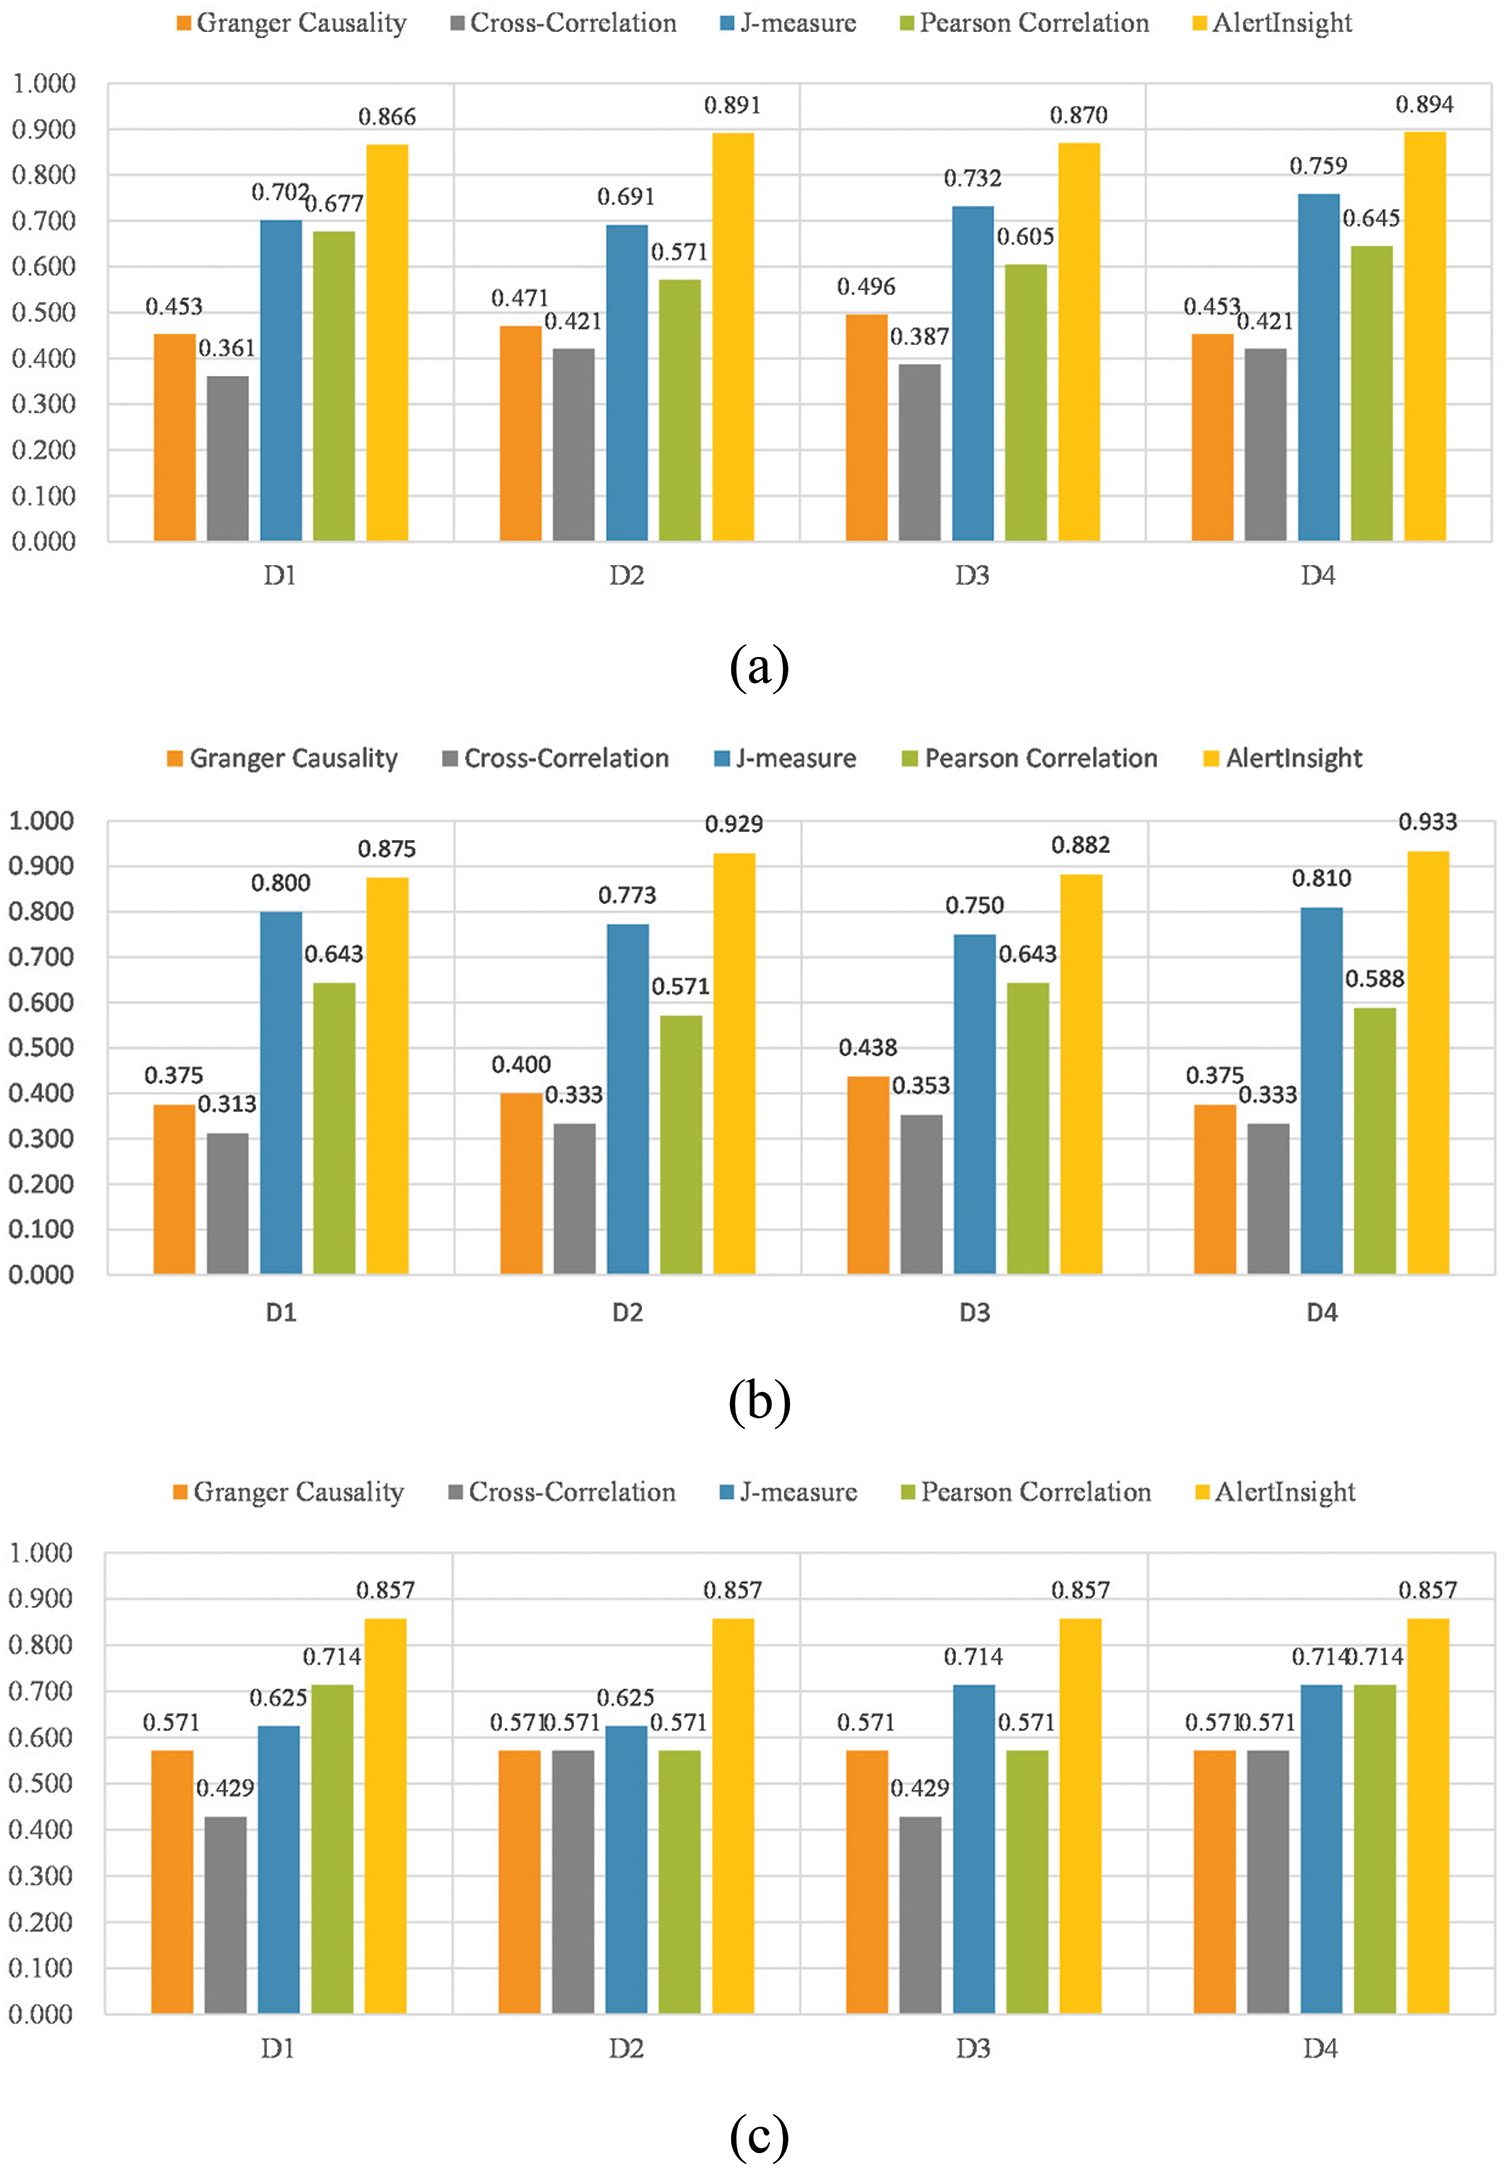
Figure 10: Comparison of the best scores of each tested correlation mining algorithm. (a) F1-score. (b) Precision. (c) Recall
Datasets D1–D4 are different sizes and are generated by the simulation system in four batches, in which the generated contents are different due to random parameters. However, since every batch uses a homogeneous simulation configuration for the same mining algorithm, switching among the D1–D4 datasets does not produce evident differences.
4.4.2 The Efficiency of Correlation Mining
In addition to its mining results, the algorithm’s efficiency is important for a correlation mining algorithm. Especially in the era of big data, the amount of available event data is increasing. Moreover, AlertInsight’s mining algorithm is a sampling-based calculation process. In practice, we always tend to input as large a sample as possible to ensure results with higher recall rates. Therefore, it is necessary to further examine the efficiency of correlation mining. We use four datasets with exponentially increasing sizes, D1 (size = 4,216), D2 (size = 8,034), D3 (size = 15,655), and D4 (size = 32,917), to test the running time of the correlation mining process of AlertInsight.
Fig. 11 shows the experimental results. As seen in the figure, the running time of AlertInsight’s mining algorithm does not increase rapidly with the exponential increase in the input size. We analyze the main reasons for these results as follows. From the process described in Algorithm 1, the main factor affecting the number of iterations of the mining algorithm is the number of event sources. In our experiments, although the input sizes increase, the number of event sources in the input remains constant. The above fact is why, in this experiment, although the input size grows exponentially, the running time exhibits almost only linear growth. The approximately linear growth seen in Fig. 11 is mainly due to the increased I/O overhead of loading and traversing data from the disk with the expanded input scale.

Figure 11: Comparison of the running times required for datasets of different sizes. The unit of the running time is in milliseconds
It is also worth stating that the outlier detection step shown in line 10 of Algorithm 1 affects the efficiency. In the implementation of this paper, we use the LOF algorithm [12], an O(n2) algorithm. In summary, two main factors affect the time consumption of the AlertInsight correlation mining process: (1) the number of event sources and (2) the efficiency of the outlier detector. Therefore, during the application of AlertInsight, it is feasible to improve the running efficiency by filtering out irrelevant event sources and choosing efficient outlier detection algorithms.
4.4.3 The Effectiveness of Correlated Event Detection
The ultimate goal of mining event correlation knowledge is to detect and degrade redundant event instances. After correlation mining, we propose a correlated event detection model employing a neural network, as described in Subsection 3.3. Next, we experimentally demonstrate the effect of the detection model.
We conduct the test using data spanning four weeks in dataset D3. The testing process is divided into the following three steps. Step 1: Use the first two weeks of the data to minimize the event correlations. Step 2: Train the online detection model based on the obtained event correlation knowledge. Step 3: Use the last two weeks of the data to test the detection model built in Step 2 and verify the effectiveness of correlated event detection and aggregation. Table 4 shows the correlations obtained in step 1. There is an incorrect C3′, and the correct C7 = {W, X, Y, Z} is not obtained.
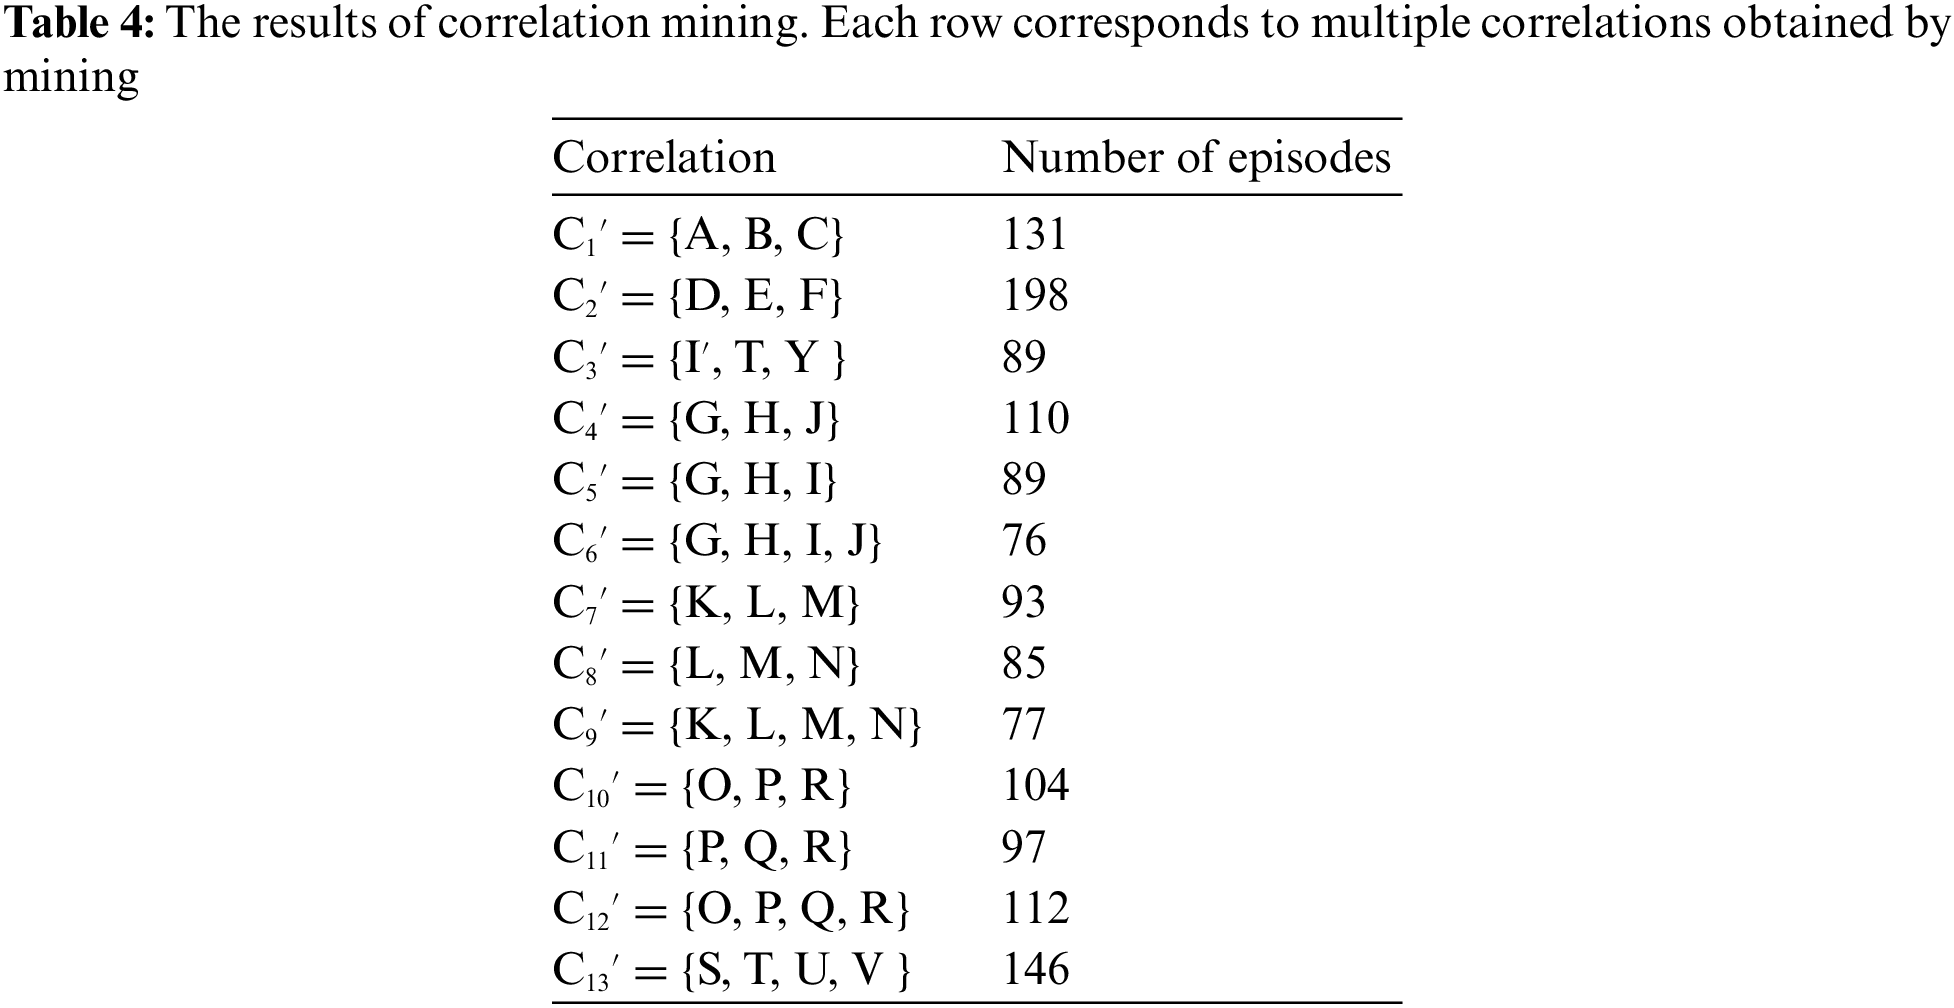
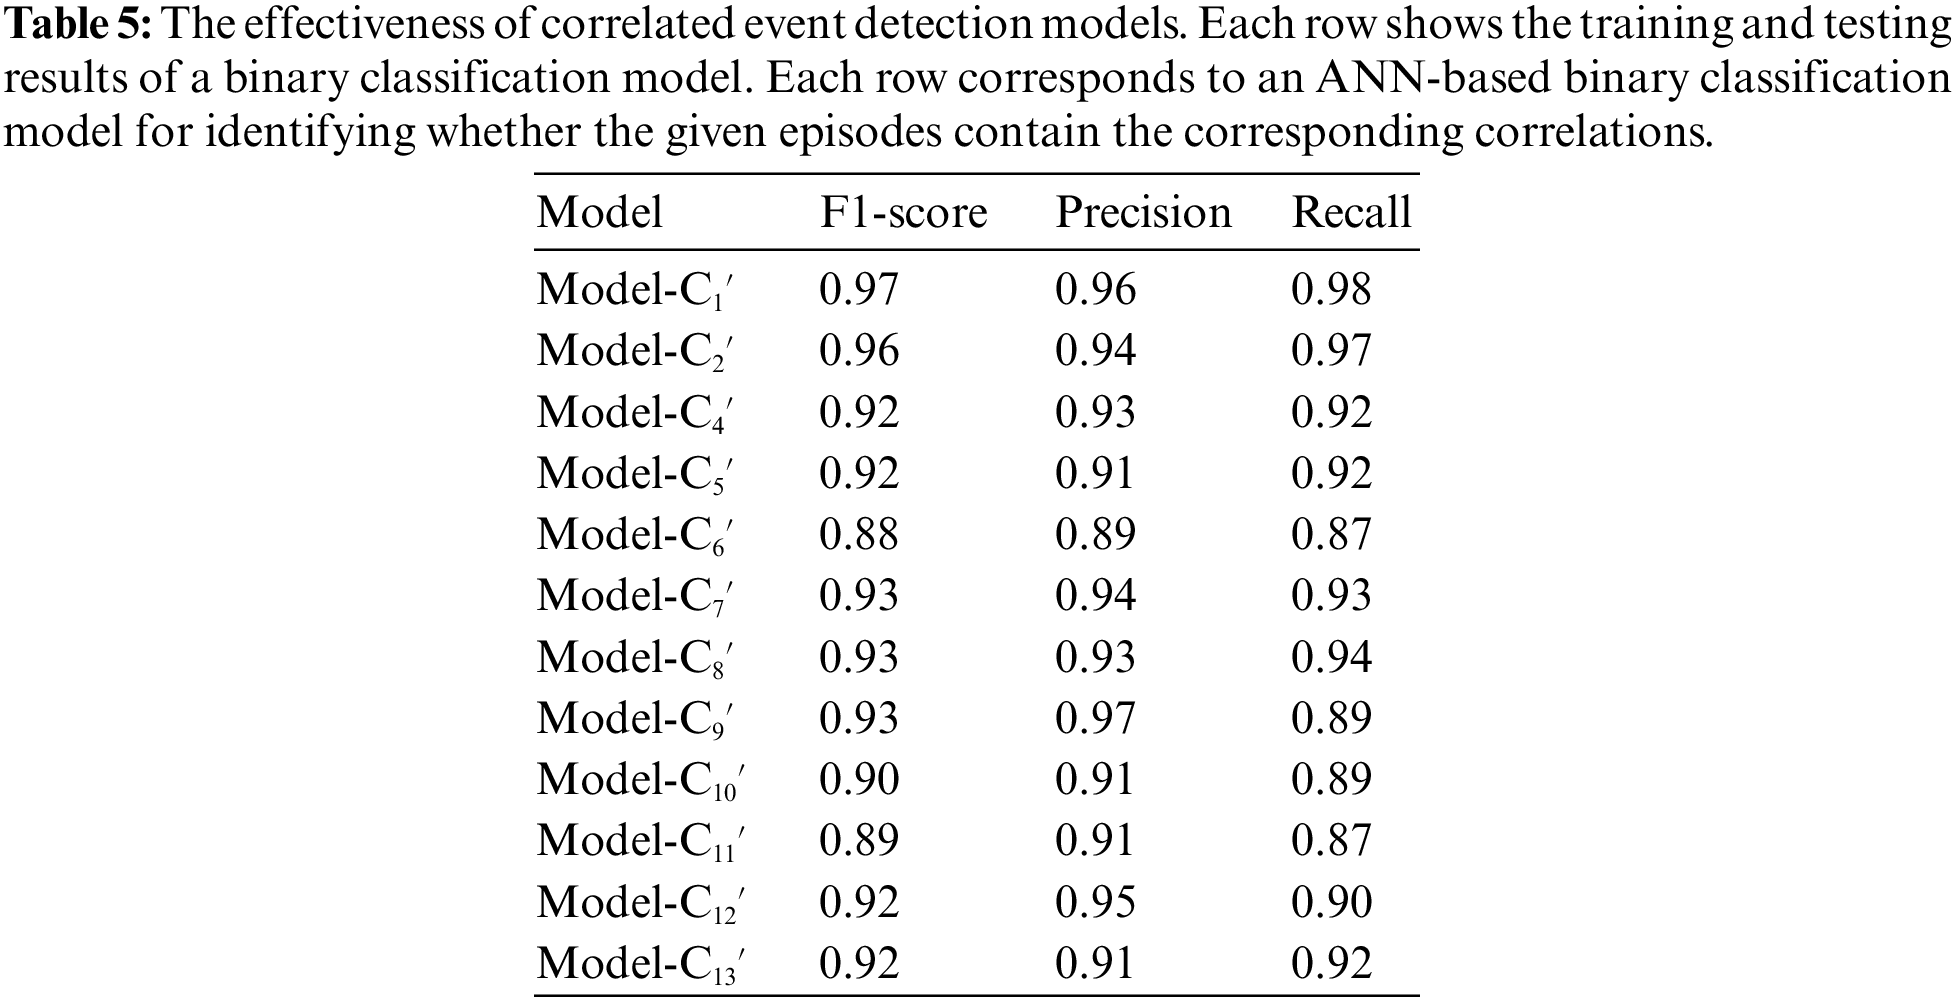
In addition to providing the multiple correlations obtained, Table 4 also gives the numbers of episode instances labeled during the mining process that contain the corresponding correlations. We use these labeled episodes to train a binary classification model for each correlation by following the model design described in Section 3.3. Because C3′ results from misidentification, except for C3′, we train the corresponding detection models for the remaining 12 correlations. For each model, we divide the labeled episodes into two parts by week: the first week is used for training, and the second week is used for validation. Table 5 shows the training results of the models, demonstrating that the technical route proposed by AlertInsight for correlated event detection is feasible.
Utilizing the detection model demonstrated in Table 5, we test the effectiveness of correlated event detection and aggregation on the last two weeks of data in dataset D3. The test is executed as follows. All episodes in which the event source emerges are traversed for each event source. The time range of the episodes is consistent with that of correlation mining. Then the models in Table 5 are used for detection for each episode. If an episode is detected as containing some correlation, then the correlated events are aggregated into a single high-level event. There are a total of 8093 original events in the two weeks of testing data, of which 2240 events occur under the influence of correlations. After detection and aggregation, we have correctly obtained 867 high-level events, covering 2178 original events triggered by correlations. Seventy-three misidentified episodes do not correlate, and 62 episodes with some correlation are missed. Suppose using the F1-score to measure the effect of this test, precision = 0.92, recall = 0.93, and F1-score = 0.93.
It can also be determined from this experiment that although the detection model is supervised, the labels required for model training are made automatically, so no additional workload is required for manual data labeling. In addition, the advantage of the binary classification model is that, from the perspective of engineering, either a new CORRELATION emerges or an old CORRELATION is updated and does not affect other models deployed online.
5.1 Correlation and Causality Mining
The discovery of correlations and causality has been a hot topic in data mining. Techniques based on support and confidence frameworks have been well developed. For example, Datta et al. [20] introduced a new algorithm for mining frequent patterns based on support and dissociation and, after that, generating association rules based on confidence and correlation. Compared with correlation mining, causality mining is more valuable, but it is also more challenging. Nogueira et al. [6] summarized several causal discoveries and inference methodologies. Nogueira et al. [7] presented a cross-sectional view of the causal discovery domain, emphasizing the machine learning/data mining area.
In recent years, correlation and causality mining has received much attention in IT operations and maintenance, where a large amount of machine data is generated. Discovering the mechanisms contained in these data is the key to accelerating intelligent operations and maintenance work. Correlation and causality knowledge can be used to predict system statuses, locate the root causes of failures, analyze the scopes of abnormal influences, etc. For example, Su et al. [8] proposed CoFlux, an unsupervised approach, to automatically determine whether two key performance indicators (KPIs) are correlated by fluctuations, in what temporal order they fluctuate, and whether they fluctuate in the same direction. Saha et al. [21] used state-of-the-art (SoTA) neural natural language processing (NLP) techniques to extract targeted information and construct a structured causal knowledge graph to build an incident causation analysis (ICA) engine for the artificial intelligence operations (AIOps) of cloud services. Zhang et al. [22] proposed CloudPin, a root cause localization framework employing a multidimensional algorithm with three submodels for prediction deviation, anomaly amplitude, and shape similarity. Otomo et al. [9] focused on the burstiness and causality of log time series data to extract meaningful information for troubleshooting. Zhang et al. [23] proposed a root cause analysis framework called CloudRCA, which uses heterogeneous multisource data, including KPIs, logs, and topologies. CloudRCA employs a knowledge-informed hierarchical Bayesian network (KHBN) model to infer root causes with high accuracy and efficiency.
Most of the above works use correlation or causality analysis for anomaly prediction and fault location. This paper aims to aggregate redundant alert events. We believe that the key to event aggregation is finding correlated events. However, unlike previous research on correlation mining, we propose a new approach focusing on multiple correlations. Moreover, we propose a correlated event detector with an applied correlation mining method for online alert reduction.
In many fields, the redundancy of massive alert events needs to be eliminated to effectively respond to incidents and control risks. For example, in industrial processes, many complex interconnections are present among the various types of devices. Therefore, it is easy to trigger alert flooding once some disturbances occur. In recent years, many works have studied the alert flooding problem in the industrial field. For instance, Lucke et al. [24] reviewed the SoTA methods in alert data analysis. They suggested a time series method for online industrial alert flood classification based on an industrial case study. Guo et al. [25] proposed an alert flood sequence alignment (AFSA) method to reveal the similarities between alert floods. Niyazmand et al. [26] proposed a modified PrefixSpan sequential pattern recognition algorithm to find alert patterns in different alert floods.
For network and information security, alert aggregation is also important. For instance, Landauer et al. [4] introduced similarity measures and merging strategies for arbitrary semistructured alerts and alert groups. Based on those metrics and techniques, proposed an incremental procedure for generating abstract alert patterns that enable the continuous classification of incoming alerts. Sun et al. [27] introduced different approaches to intrusion detection system (IDS) alert aggregation and proposed an improved frequent pattern growth (FP-growth) algorithm for this task. Werner et al. [13] developed a novel CLEAR system that continually learns to aggregate alerts in near-real time for intrusion detection.
Some works have taken broader perspectives regarding the technologies, methods, and systems related to alert reduction. For example, Zong et al. [28] studied the critical alert mining problem and developed an approximation algorithm that could obtain a near-optimal critical alert set in quadratic time; they also proposed pruning techniques to improve the runtime performance of the algorithm. Namaki et al. [29] proposed Kronos, a framework and system that automatically extracts highly dynamic knowledge for complex event analysis from cyber-physical systems. Kronos can capture events with an anomaly-based event model and integrate various events by correlating them with their temporal associations in real time based on heterogeneous, continuous cyber-physical measurement data streams. Solmaz et al. [30] described a rule mining and root cause analysis solution for alert event correlations and analyses, including a dynamic index for matching active alerts, an algorithm for generating candidate alert rules, a sliding window-based approach for saving system resources, and a graph-based solution for identifying root causes.
In this paper, we examine an approach for coping with alert flooding in the running environments of complex cloud services. Modern cloud services usually consist of many subsystem modules with complex interconnections, which hide behind an enormous number of discrete alert events. Therefore, this paper reports a new alert reduction approach driven by multiple correlation mining, different from previous research.
We now summarize the main findings of our work and discuss some possible directions for future research.
This paper targets the problem of alert noise reduction for complex cloud systems. We propose AlertInsight, a framework for alert event correlation and aggregation, which focuses on the multiple correlations among the events. In AlertInsight, we have proposed a method for multiple correlation mining based on historical episode scanning, which greatly decreases the computational complexity. Moreover, we design a model employing correlation knowledge to detect the correlated events in the event sequence. Experiments are conducted to test the effectiveness of AlertInsight. The experimental results (precision = 0.92, recall = 0.93, and F1-score = 0.93) demonstrate the performance of AlertInsight for the recognition of multiple correlated alerts. The experimental results demonstrate that AlertInsight could satisfy the practical requirements, and we have released the source code of the events simulation system for researchers and practitioners to use in their future studies [10].
In addition, we wish to discuss some important assumptions and limitations of this paper, as follows. First, Fig. 5 illustrates the architecture of AlertInsight, the explorer and detector of which are discussed in detail in this paper. The other components, including the event database as well as the correlations and episodes, are not discussed in detail because they are not within the scope of the main topic of this paper. We simply assume that the events database, and the correlations and episodes, are well governed. However, ensuring this assumption holds may require much professional data governance effort. Second, for correlation mining, we assume the repetitiveness of correlated events. On this basis, we design a method for efficient multiple correlation discovery by exploiting the repetitive traces exhibited by most correlated events in contrast to random events. However, the limitation of this method is that it is difficult to cover cases of rare events. In reality, a small number of rare events may also be implicated in some correlations. It will be difficult to make correct judgments using the presented identification method based on repetitive phenomena for such events. Further work will be needed to design additional mechanisms to address this problem.
In future work, in addition to the data quality issues mentioned above, based on multiple correlation mining, there is some valuable extension of the current work that deserves attention. (1) From the practice perspective, the accuracy of correlation knowledge and alert reduction are both critical. Although AlertInsight can automate the whole process, to improve the application effects, adding a human-in-the-loop design [31] to AlertInsight could enhance its correlation mining and alert reduction accuracies by receiving feedback from human experts, such as supplementing the correlations involving rare events. (2) Based on correlation knowledge, besides alert reduction, more research topics, such as “critical event identification” and “event influence analysis,” would also be meaningful. “Critical event identification” aims to find a set of events in a given event sequence S such that the number of events potentially triggered by them is maximized. It will help in determining key control points for complex cloud services. “Event influence analysis,” which aims to reason from a given small set of events based on multiple correlations to obtain a set of successor events with the highest probability, is a reverse view of the former topic. It will help administrators proactively respond to incidents and control risk propagation.
Funding Statement: The authors received no specific funding for this study.
Conflicts of Interest: The authors declare that they have no conflicts of interest to report regarding the present study.
References
1. J. Wang, Y. Yang, T. Wang, R. S. Sherratt and J. Zhang, “Big data service architecture: A survey,” Journal of Internet Technology, vol. 21, pp. 393–405, 2020. [Google Scholar]
2. O. Debauche, S. Mahmoudi, S. A. Mahmoudi, P. Manneback and F. Lebeau, “A new edge architecture for AI-IoT services deployment,” Procedia Computer Science, vol. 175, pp. 10–19, 2020. [Google Scholar]
3. Z. Jingyu, Z. Siqi, T. Wang, H. C. Chao and J. Wang, “Blockchain-based systems and applications: A Survey,” Journal of Internet Technology, vol. 21, pp. 1–14, 2020. [Google Scholar]
4. M. Landauer, F. Skopik, M. Wurzenberger and A. Rauber, “Dealing with security alert flooding: Using machine learning for domain-independent alert aggregation,” ACM Transactions on Privacy and Security, vol. 25, no. 3, pp. 18:1–18:36, 2022. [Google Scholar]
5. Y. Xu, J. Wang, Y. Yu, “Alarm event prediction from historical alarm flood sequences based on bayesian estimators,” IEEE Transactions on Automation Science and Engineering, vol. 17, no. 2, pp. 1070–1075, 2020. [Google Scholar]
6. A. R. Nogueira, A. Pugnana, S. Ruggieri, D. Pedreschi and J. Gama, “Methods and tools for causal discovery and causal inference,” Wiley Interdisciplinary Reviews: Data Mining and Knowledge Discovery, vol. 12, no. 2, pp. e1449, 2022. [Google Scholar]
7. A. R. Nogueira, J. Gama and C. A. Ferreira, “Causal discovery in machine learning: Theories and applications,” Journal of Dynamics and Games, vol. 8, no. 3, pp. 203–231, 2021. [Google Scholar]
8. Y. Su, Y. Zhao, W. Xia, R. Liu, J. Bu et al., “CoFlux: Robustly correlating KPIs by fluctuations for service troubleshooting,” in Proc. of the Int. Symp. on Quality of Service, Phoenix, AZ, USA, pp. 13:1–13:10, 2019. [Google Scholar]
9. K. Otomo, S. Kobayashi, K. Fukuda and H. Esaki, “An analysis of burstiness and causality of system logs,” in Proc. of the Asian Internet Engineering Conf., Bangkok, Thailand, pp. 16–23, 2017. [Google Scholar]
10. Alerts simulator. 2022. [Online]. Available: https://github.com/yumg/alerts-simulator. [Google Scholar]
11. D. L. Whaley III, “The interquartile range: Theory and estimation, master dissertation,” M.S. thesis, Department of Mathematics, East Tennessee State University, USA, 2005. [Google Scholar]
12. M. M. Breunig, H. -P. Kriegel, R. T. Ng and J. Sander, “LOF: Identifying density-based local outliers,” in ACM SIGMOD Int. Conf. on Management of Data, Dallas, Texas, USA, pp. 93–104, 2000. [Google Scholar]
13. G. Werner, S. J. Yang and K. McConky, “Near real-time intrusion alert aggregation using concept-based learning,” in CF ’21: Computing Frontiers Conf., Italy, pp. 152–160, 2021. [Google Scholar]
14. H. Liu, A. E. Gegov and F. T. Stahl, “J-measure based hybrid pruning for complexity reduction in classification rules,” WSEAS Transactions on Systems, vol. 12, no. 9, pp. 443–446, 2013. [Google Scholar]
15. C. Luo, J. -G. Lou, Q. Lin, Q. Fu, R. Ding et al., “Correlating events with time series for incident diagnosis,” in The 20th ACM SIGKDD Int. Conf. on Knowledge Discovery and Data Mining, New York, NY, USA, pp. 1583–1592, 2014. [Google Scholar]
16. H. Qiu, Y. Liu, N. A. Subrahmanya and W. Li, “Granger causality for time-series anomaly detection,” in 12th IEEE Int. Conf. on Data Mining, Brussels, Belgium, pp. 1074–1079, 2012. [Google Scholar]
17. Y. Sakurai, S. Papadimitriou and C. Faloutsos, “BRAID: Stream mining through group lag correlations,” in Proc. of the 2005 ACM SIGMOD Int. Conf. on Management of Data, Baltimore, Maryland, pp. 599–610, 2005. [Google Scholar]
18. Evaluation of clustering. 2022. [Online]. Available: https://nlp.stanford.edu/IR-book/html/htmledition/evaluation-of-clustering-1.html. [Google Scholar]
19. Deeplearning4j. 2022. [Online]. Available: https://github.com/eclipse/deeplearning4j. [Google Scholar]
20. S. Datta and S. Bose, “Mining and ranking association rules in support, confidence, correlation, and dissociation framework,” in Proc. of the 4th Int. Conf. on Frontiers in Intelligent Computing: Theory and Applications, Durgapur, India, pp. 141–152, 2015. [Google Scholar]
21. A. Saha and S. C. H. Hoi, “Mining root cause knowledge from cloud service incident investigations for AIOps,” in 44th IEEE/ACM Int. Conf. on Software Engineering: Software Engineering in Practice, Pittsburgh, PA, USA, pp. 197–206, 2022. [Google Scholar]
22. S. Zhang, Y. Zhao, J. Lu, B. Lyu, S. Zhu et al., “CloudPin: A root cause localization framework of shared bandwidth package traffic anomalies in public cloud networks,” in 32nd IEEE Int. Symp. on Software Reliability Engineering, Wuhan, China, pp. 367–377, 2021. [Google Scholar]
23. Y. Zhang, Z. Guan, H. Qian, L. Xu, H. Liu et al., “CloudRCA: A root cause analysis framework for cloud computing platforms,” in CIKM ’21: The 30th ACM Int. Conf. on Information and Knowledge Management, Queensland, Australia, pp. 4373–4382, 2021. [Google Scholar]
24. M. Lucke, M. Chioua, C. Grimholt, M. Hollender and N. F. Thornhill, “Advances in alarm data analysis with a practical application to online alarm flood classification,” Journal of Process Control, vol. 79, no. 2, pp. 56–71, 2019. [Google Scholar]
25. C. Guo, W. Hu, S. Lai, F. Yang and T. Chen, “An accelerated alignment method for analyzing time sequences of industrial alarm floods,” Journal of Process Control, vol. 57, no. 2, pp. 102–115, 2017. [Google Scholar]
26. T. Niyazmand and I. Izadi, “Pattern mining in alarm flood sequences using a modified PrefixSpan algorithm,” ISA Transactions, vol. 90, no. 5, pp. 287–293, 2019. [Google Scholar]
27. Y. Sun and X. Chen, “An improved frequent pattern growth based approach to intrusion detection system alert aggregation,” Journal of Physics: Conference Series, vol. 1437, no. 1, pp. 012070, 2020. [Google Scholar]
28. B. Zong, Y. Wu, J. Song, A. K. Singh, H. Çam et al., “Towards scalable critical alert mining,” in The 20th ACM SIGKDD Int. Conf. on Knowledge Discovery and Data Mining, New York, NY, USA, pp. 1057–1066, 2014. [Google Scholar]
29. M. H. Namaki, X. Zhang, S. Singh, A. Ahmed, A. Foroutan et al., “Kronos: Lightweight knowledge-based event analysis in cyber-physical data streams,” in 36th IEEE Int. Conf. on Data Engineering, Dallas, TX, USA, pp. 1766–1769, 2020. [Google Scholar]
30. S. E. Solmaz, B. Gedik, H. Ferhatosmanoglu, S. Sözüer, E. Zeydan et al., “ALACA: A platform for dynamic alarm collection and alert notification in network management systems,” International Journal of network management, vol. 27, no. 4, pp. e1980, 2017. [Google Scholar]
31. Y. Cui, P. Koppol, H. Admoni, S. Niekum, R. Simmons et al., “Understanding the relationship between interactions and outcomes in human-in-the-loop machine learning,” in Proc. of the Thirtieth Int. Joint Conf. on Artificial Intelligence, Montreal, Canada, pp. 4382–4391, 2021. [Google Scholar]
Cite This Article
 Copyright © 2023 The Author(s). Published by Tech Science Press.
This work is licensed under a Creative Commons Attribution 4.0 International License , which permits unrestricted use, distribution, and reproduction in any medium, provided the original work is properly cited.
 Downloads
 Citation Tools