
 Submit a Paper
 Propose a Special lssue
 Open Access
ARTICLE

Anomaly Detection and Classification in Streaming PMU Data in Smart Grids
1 Department of Computational Intelligence, SRM Institute of Science and Technology, Chennai, 603203, India
2 Department of Electrical and Electronics Engineering, SRM Institute of Science and Technology, Chennai, 603203, India
3 Department of Computer Science and Engineering, Government College of Engineering, Salem, 636011, India
* Corresponding Author: R. Annie Uthra. Email:
Computer Systems Science and Engineering 2023, 46(3), 3387-3401. https://doi.org/10.32604/csse.2023.029904
Received 14 March 2022; Accepted 13 June 2022; Issue published 03 April 2023
 View Full Text
 Download PDF
Abstract
The invention of Phasor Measurement Units (PMUs) produce synchronized phasor measurements with high resolution real time monitoring and control of power system in smart grids that make possible. PMUs are used in transmitting data to Phasor Data Concentrators (PDC) placed in control centers for monitoring purpose. A primary concern of system operators in control centers is maintaining safe and efficient operation of the power grid. This can be achieved by continuous monitoring of the PMU data that contains both normal and abnormal data. The normal data indicates the normal behavior of the grid whereas the abnormal data indicates fault or abnormal conditions in power grid. As a result, detecting anomalies/abnormal conditions in the fast flowing PMU data that reflects the status of the power system is critical. A novel methodology for detecting and categorizing abnormalities in streaming PMU data is presented in this paper. The proposed method consists of three modules namely, offline Gaussian Mixture Model (GMM), online GMM for identifying anomalies and clustering ensemble model for classifying the anomalies. The significant features of the proposed method are detecting anomalies while taking into account of multivariate nature of the PMU dataset, adapting to concept drift in the flowing PMU data without retraining the existing model unnecessarily and classifying the anomalies. The proposed model is implemented in Python and the testing results prove that the proposed model is well suited for detection and classification of anomalies on the fly.Keywords
PMUs are one of the most important smart grid monitoring resources since they enable dynamic view of the power system’s state [1]. The data supplied by the PMUs is used for a variety of applications, including state estimation, optimal power flow, and congestion management. This data, also known as synchrophasor data, is particularly important since the control centers rely on it to make judgments. Real time monitoring of power system changes can have several advantages for smart grid security. It will allow the operators to take corrective control measures that can prevent grid failures from transforming into falling power outages [2]. The issue of event identification/classification, together with event detection, is critical. A few examples of the events are listed in [3–5]. In case of faults, the system parameters are abnormal which creates huge disturbances in the system. During abnormal system conditions, there will be a lot of frequency variations [6]. Although PMUs have been increasingly deployed in the modern power system, real time utilization of PMU data is not yet realized completely. Hence, the PMU data has been used only for offline exploration of events and post-event analysis [7].
The PMU analyzes streaming electrical data that contains largely normal values, but when the normal values deviate, it indicates a system anomaly. As mentioned in [8], anomalies are caused by sensor failure, data transmission errors, and unusual behavior of the system. Generator outages, line outages, PMU outages, and intrusions are examples of probable abnormalities in PMU data [9]. If anomalies in streaming data are undetected, the essential remedial control measures will not be done in the required time frame. The following are some of the difficulties in identifying abnormalities in fast flowing PMU data: 95 percent of the values in streaming data are normal, whereas only 5 percent of the readings are abnormal; lack of labeled dataset to train the detection model; detecting anomalies within few seconds and lack of benchmark as mentioned in [10] and [11].
The key determination of this research work is launching of real-time methodology to promote remote examination of smart electrical grid for anomaly tracking, identification and classification. The proposed model consists of 3 modules namely, offline GMM, online GMM and clustering ensemble methods. The main idea behind the modules is as follows: the offline GMM is trained using normal PMU data and any data whose log-likelihood is not in the range of the normal data is considered as anomalies, then the online GMM is used to update the current model if there is concept drift considering catastrophic forgetting effect which are the two major issues of streaming data. The anomalies are classified using clustering ensemble model into their respective categories. The events considered here are Line to Line fault (LL), Single Line to Ground fault (SLG) and Double Line to Ground fault (LLG).
The structure of the paper is as follows: The related works are discussed in Section 2. The proposed methodology for anomaly detection and classification is provided in Section 3 and the experimental outcomes are delivered in Section 4. In Section 5, the paper is concluded.
The related works in anomaly detection and classification has been divided into two divisions namely: incremental learning and ensemble models. In the field of streaming data classification, large number of researches have been carried out to address the issues, such as, concept drift, catastrophic forgetting effect, memory usage and class imbalance. In [12], for classification in streaming data, a joined offline k Nearest Neighbor (kNN) and online k-means algorithm is proposed. The result of classification using hybrid of the two algorithms outperformed the other two when they are used individually. The drawbacks of individual methods are overcome when they are combined together so the hybrid approach is more promising than the individual methods. In [13], an adaptable framework for life-long learning is proposed. The offline classifier is the local generalized learning vector quantization and the online classifier is the incremental online learning vector quantization and a classifier choice which intervene between the online and offline classifier dependent on their confidence values is proposed. In [14], online micro cluster based nearest neighbor algorithm is used to perform scalable real time streaming data classification. In [15], online algorithms namely Incremental Support Vector Machine (ISVM), Online Approximate Support Vector Machine (LASVM), Online Random Forest (ORF), Incremental Learning Vector Quantization (ILVQ), Learn Plus Plus (LPPcart), Incremental Extreme Learning Machine (IELM), Stochastic Gradient Descent (SGDlin), Naïve Bayes Gaussian (NBGauss) are reviewed and compared. These algorithms are compared in terms of accuracy for 15 datasets out of which 11 datasets are with concept drift. The Incremental Gaussian Mixture Network (IGMN) [16] is able to learn from continuous streams in one-go but the running time is
For classification of data streams, the ensemble-based techniques are the most commonly used techniques. A survey on ensemble learning for data stream classification is given in [26]. They proposed a taxonomy derived from the study of over 60 algorithms for data stream ensemble learning. In [27], the Coverage Based Ensemble Algorithm (CBEA) is proposed, which is an online learning algorithm that learns at any time, operates on flowing data streams which are randomly distributed. In [28], from a sequence of input training data different classifiers are created. These classifiers classify large-scale streaming data using a heuristic substitution strategy which respond quickly to concept drift. A new ensemble-based algorithm suitable for classifying streaming data is suggested in [29]. The updating method promotes model adaptability as a result of concept drift, allowing the ensemble to obtain information to address poor results while slowing the updating speed in static concepts. Recent works use deep learning concept to detect anomalies such as Convolutional Neural Network (CNN) is used to detect anomalies in the PMU data in [30], feature complementary work is used in [31] and real-time small object detection is used in [32].
The main novelty projected in this research work is that anomaly detection in multivariate PMU streaming data has been addressed very effectively comparing with other models which has not been reported in literature works. The proposed model is the combination of identification of abnormalities and classification in PMU data. It is completely computerized, intelligible and particularly interpretable. In order to cope the trained model for concept drift and catastrophic forgetting effect, online GMM has been developed and implemented in PMU dataset through which efficient anomaly detection is performed. The advantage of this research work is that in addition to the discovery of abnormalities they are labelled on the fly under the respective category using clustering ensemble method.
3 Proposed Framework for Anomaly Detection and Classification
The framework that has been proposed is a fusion of anomaly detection and classification in the PMU data on the fly. Offline GMM method is used to identify the abnormalities in the multivariate PMU data which is based on density estimation technique [31]. Online GMM is used to manage the catastrophic forgetting effect and also the notion of the concept drift [32]. The anomalies that are identified using the offline GMM and the online GMM are fed as the input into the clustering ensemble technique in order to label the various anomalies including the LL, SLG and LLG. The methodology of the proposed system is illustrated in Fig. 1 which includes three modules: offline GMM, online GMM and clustering ensemble method.
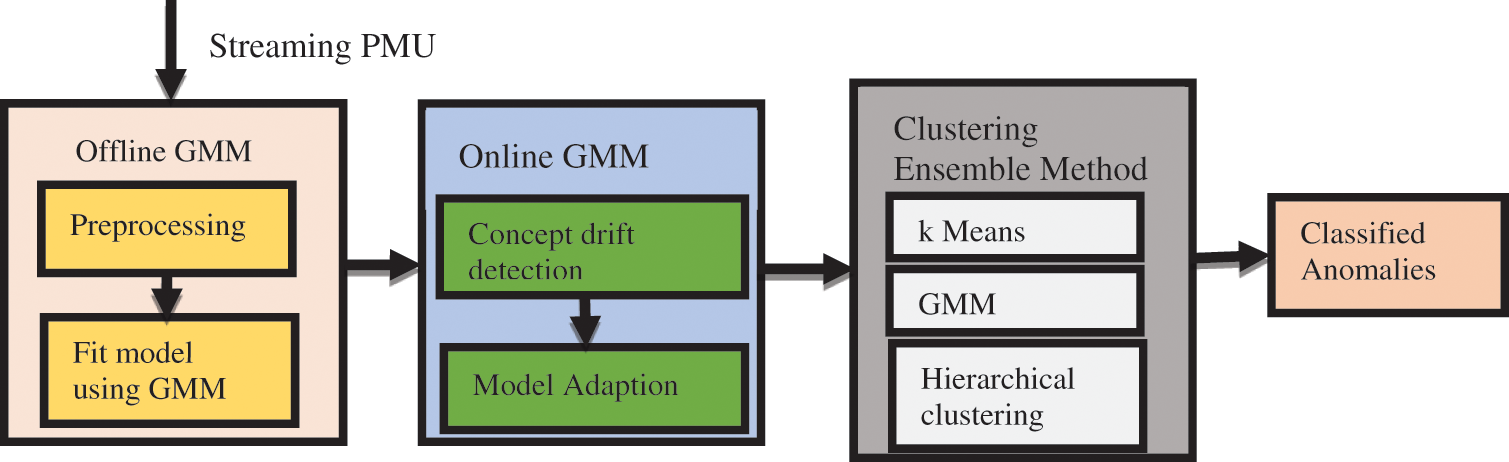
Figure 1: Proposed Framework for Anomaly Detection and Classification
Using density estimation technique, the offline GMM identify the abnormalities in the PMU data on the fly. The data gathered from PMU is 95% of the time normal in nature and the dataset used in this research has only normal data. So a generative model based on GMM is built in order to characterize the normal PMU data. The PMU data is highly correlated so when data from the PMU comes, principal component analysis is employed to extract the most discriminant features that are independent and also which preserve variance to a larger extent. The k-Means algorithm is used for the variables that were selected in order to understand the quantity of the cluster that is present in the PMU data. The log-likelihood of each of the training data is inspected and minimum and maximum values are fixed as thresholds. For testing purpose anomalies are simulated and included in the PMU dataset. During testing, if the log-likelihood of the test data lies beneath the smallest threshold value or higher than the utmost threshold they are measured as anomalies. The diagrammatic representation of the offline GMM for anomaly detection model is given in the Fig. 2.
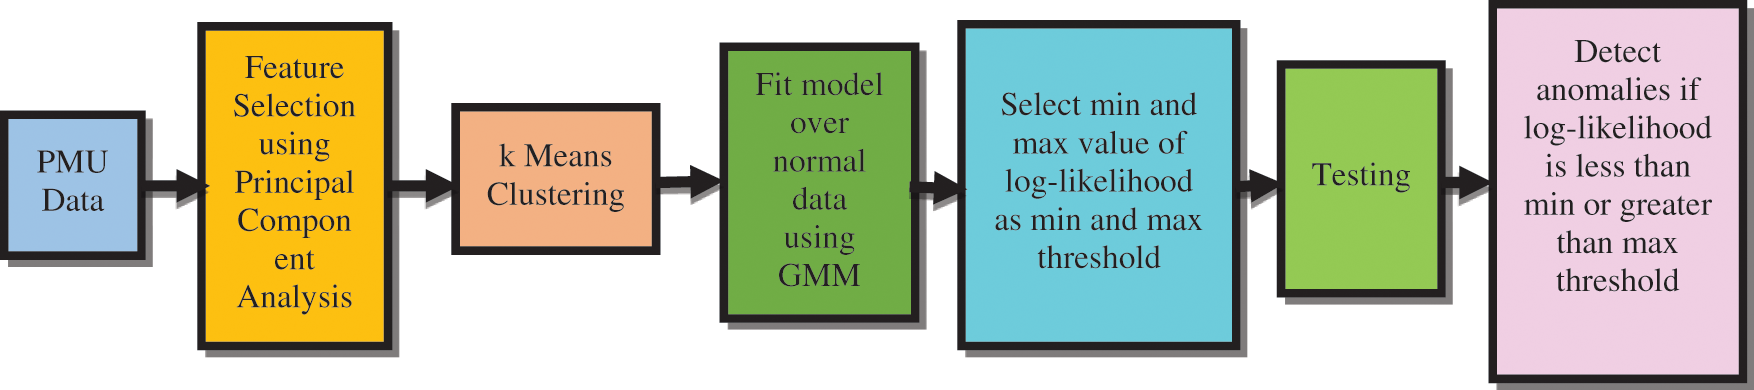
Figure 2: Offline GMM for Anomaly Detection
The offline GMM which is trained using the historical data will give accurate result for the new incoming data as long as the probability distribution of new data are similar to the historical data. Hence, the log-likelihood of recent data will be in same range as log-likelihood of the historical data. But when the probability distribution of recent data is no longer similar to the historical data, the offline GMM will not give the correct result which indicates concept drift and its parameters should be updated using the recent data. The presence of concept drift can be determined by checking the F1 score of consecutive 10 window data. If the F1 score decreases below 0.9 for all the 10 windows, then it indicates the presence of concept drift [33]. The online GMM will update the parameters using the offline GMM as well as the recently arrived data in the last 10 windows.
Let
For the left out mixtures
For left out mixtures
Now this adapted model can detect anomalies in the streaming PMU data.
3.3 Clustering Ensemble Method
The clustering ensemble technique uses the anomalies that are present in the streaming PMU data as input. These anomalies are identified using the offline GMM. The ensemble technique is used to classify the anomalies under the categories of the LL, SLG and LLG. The labeling of the data in the streaming PMU data is not possible under the online conditions, so this adds to the reason for using the clustering ensemble technique. The clustering ensemble technique consists of three modules which includes the ensemble member generation, consensus function and evaluation as shown in Fig. 3. The ensemble members used in the work are produced by the clustering method which includes the GMM method, hierarchical clustering and the k means clustering. The main function of a consensus function is to combine the results of the partitions to get the ultimate cluster result
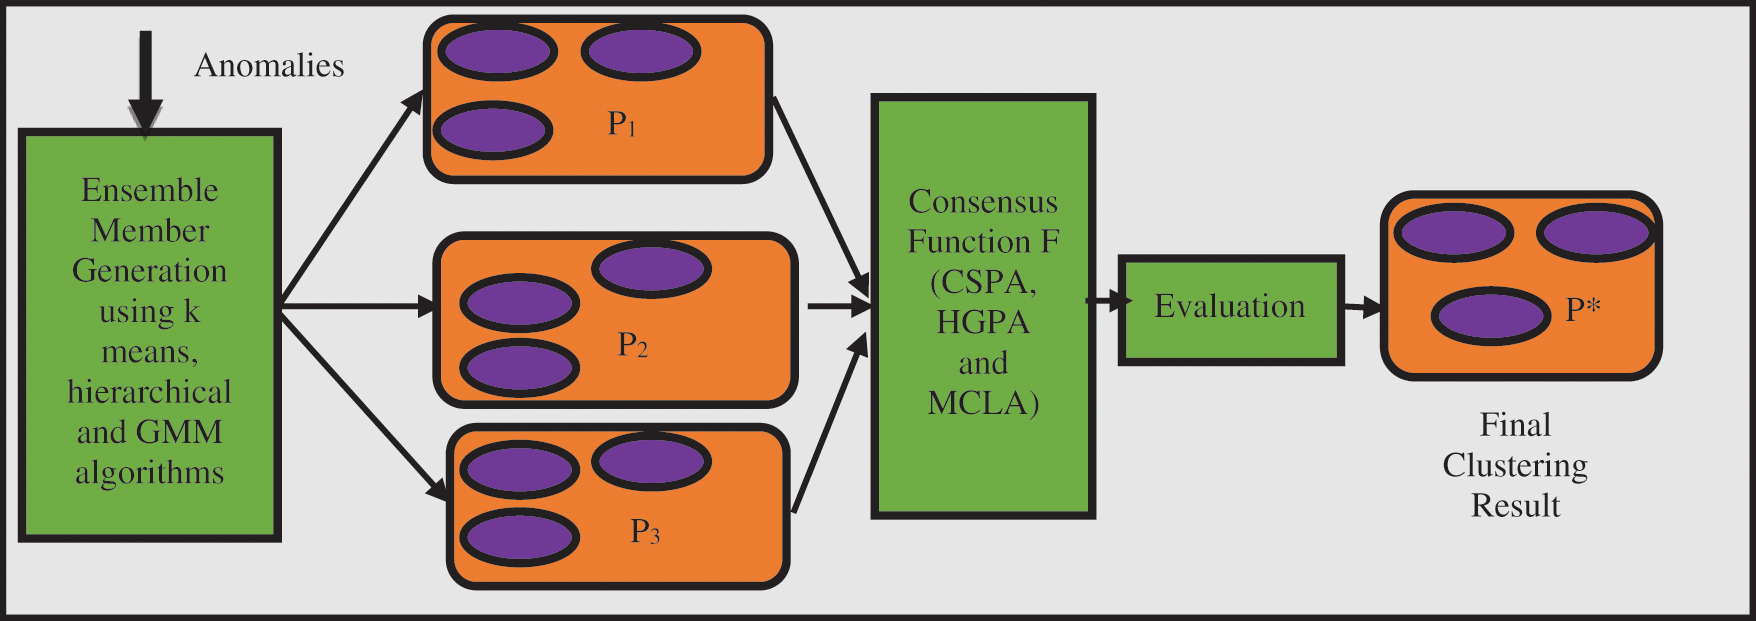
Figure 3: Clustering ensemble method for classifying anomalies
4 Experimental Results and Discussion
Experiments are carried out using the PMU dataset from the EPFL Institutions’ website. Fig. 4 shows the 16 features that make up the PMU dataset. The PMU produces a measurement every 0.02 s, therefore one hour of PMU data has 1,80,000 readings. The proposed offline GMM comprises of 1 h data for 10 days from the month of May 2016, with one measurement picked as a sample randomly for every 500 measurements. As a result, 360 samples are taken per hour, and 3600 samples are obtained throughout the course of ten days. The total data is divided into two partitions for the testing and the training: 70% training data and 30% testing data. The offline GMM model is trained using only normal data. As PMU data anomalies are not readily available, line faults such as SLG, LL, and LLG are simulated for testing purposes. For SLG fault, the current in phases B and C must be zero, while the current in phase A must be greatest, as shown in Eq. (8). The magnitude of the phase B and the phase C are both zero and these results in the angle of the phases B and C to be zero too. The current magnitude of the phase A is greater, which is got by multiplying the data point of the phase A magnitude by a factor of
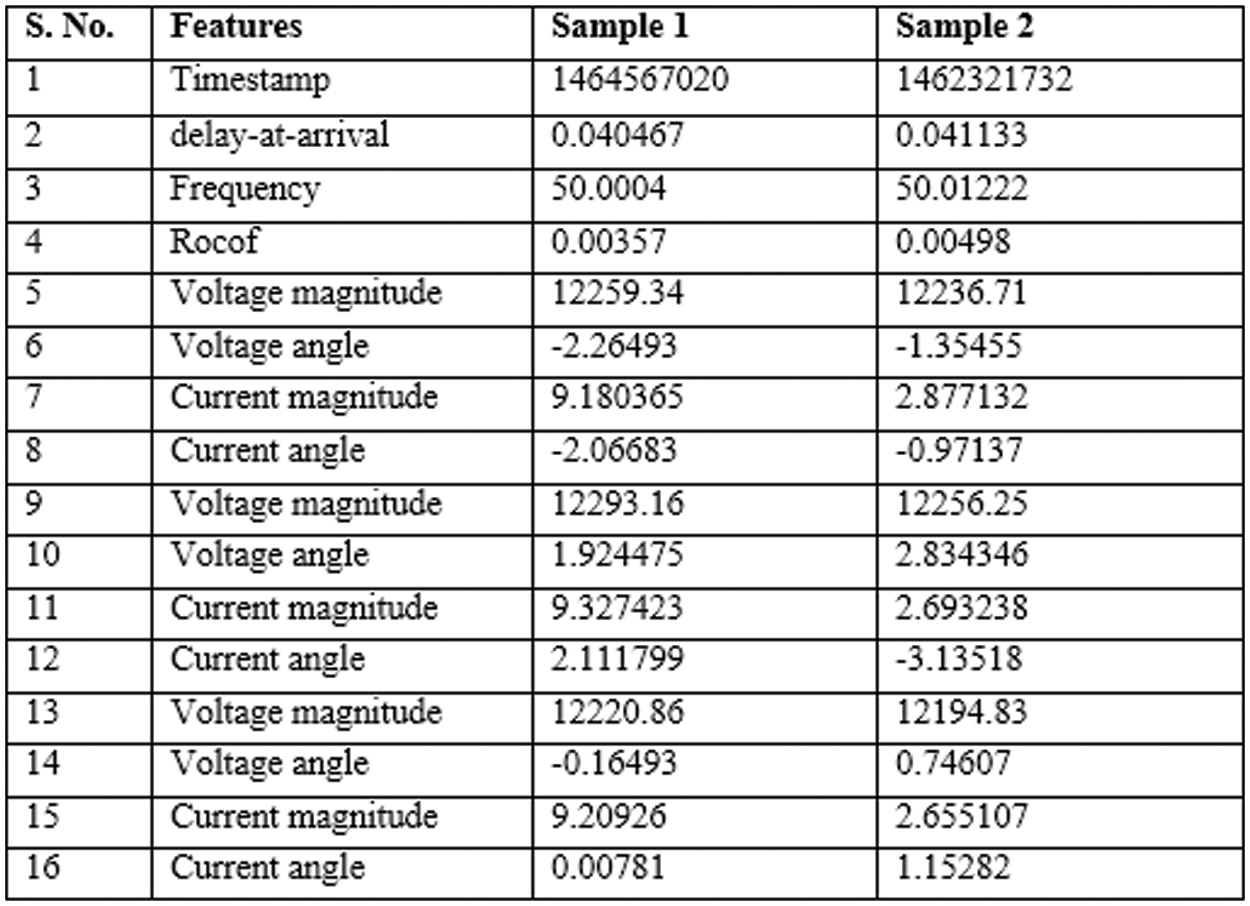
Figure 4: Samples from the PMU dataset
After the anomalies have been replicated, a dataset with the combination of the normal and anomalous data is created for testing. The model’s training is finished using 70% of the normal PMU dataset. The testing is finished with 30% of the remaining dataset, which is made up of equal number of normal data and simulated anomalies. Offline testing and online testing approaches are carried out. For online testing the PMU data is converted to streams by treating it as chunks in Python with a constant window size of 100. The labeled dataset is used to test the trained model. Precision, recall, and F1 score are the performance measures given by Eqs. (11)–(13) are used to evaluate the proposed model’s performance.
where
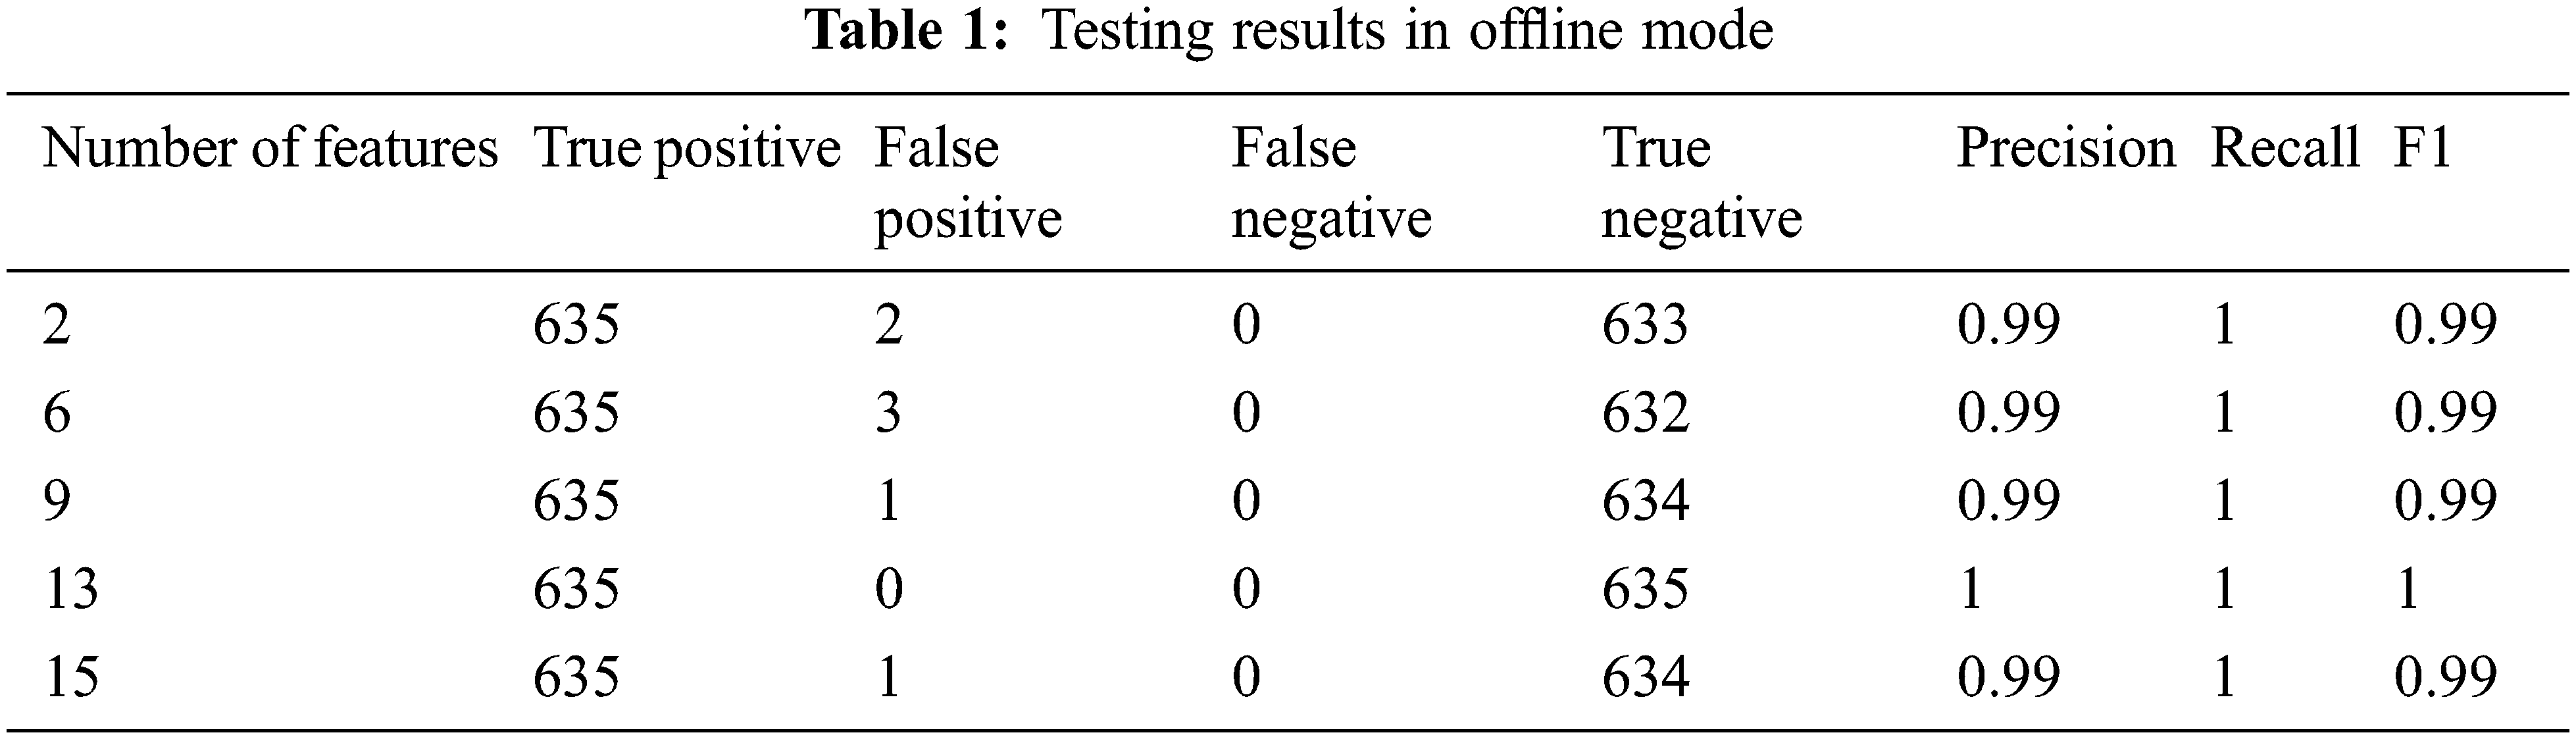
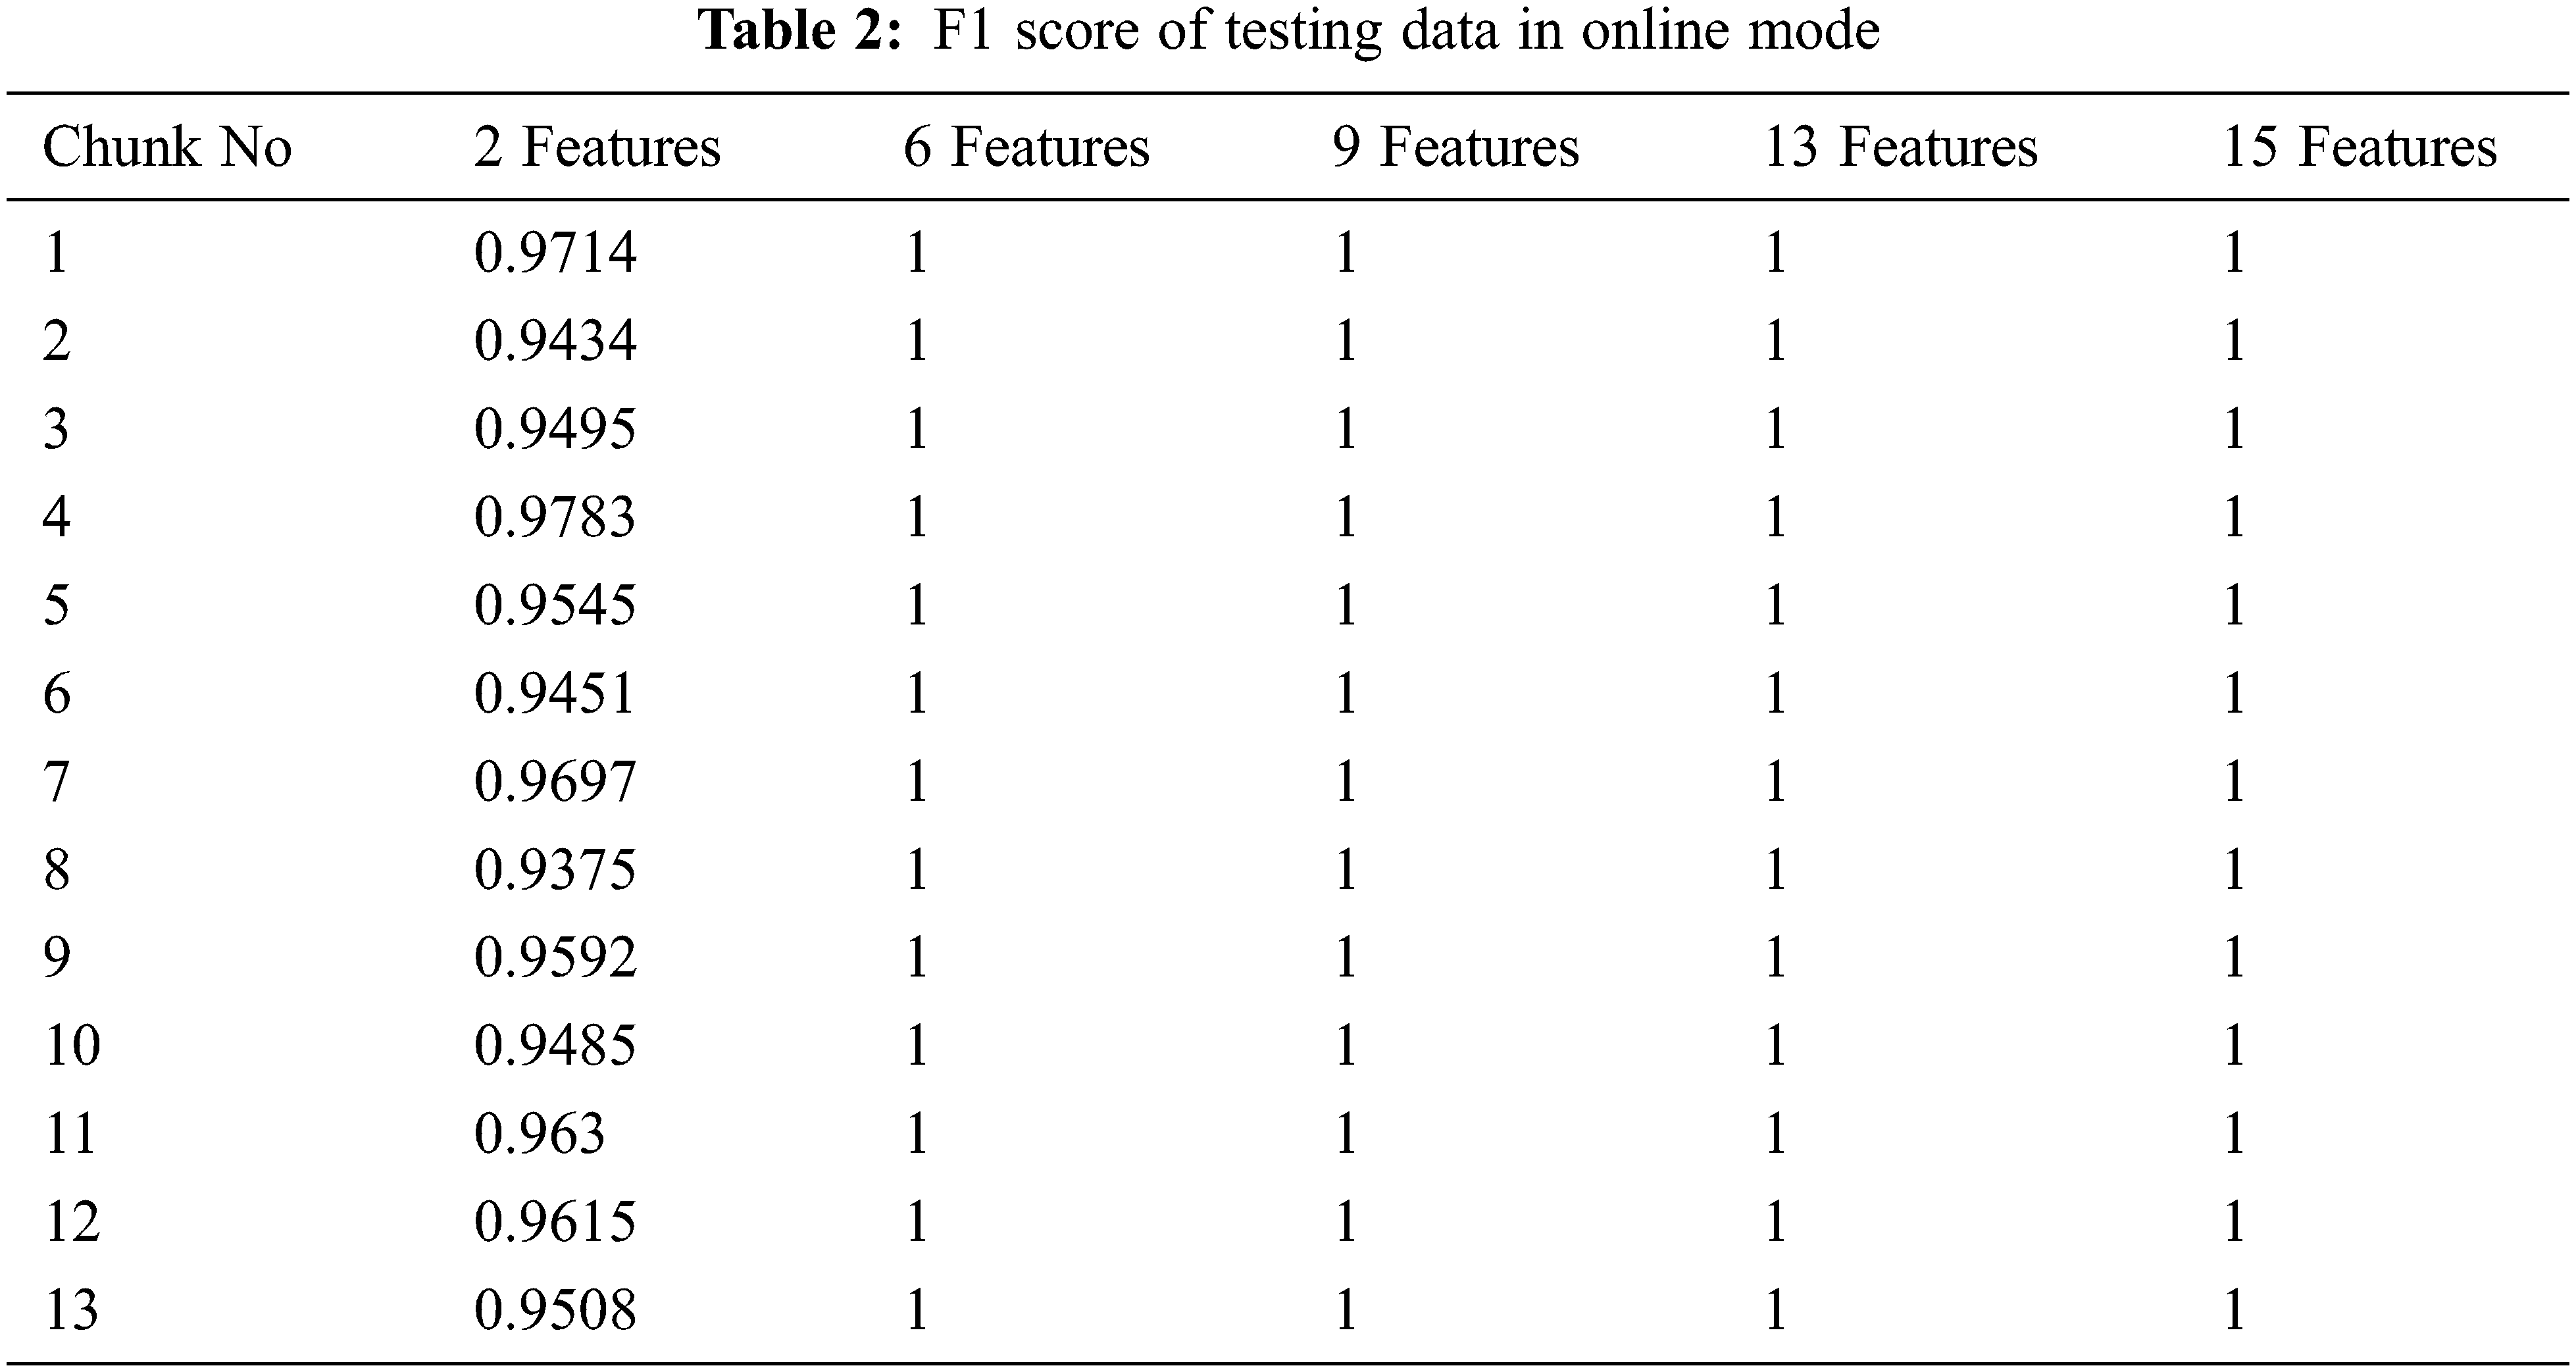
On 4235 data with 2, 6, 9, 13, and 15 features, there are 1270 testing data with 635 normal data and 635 anomalies. The result of testing in offline mode is shown in Table 1. For online testing, the test dataset was broken into chunks of size 100. The test dataset has 1270 data points divided into 13 pieces, with 12 chunks containing 100 data points and the final chunk containing 70 data points. Table 2 shows the F1 score of testing data in online mode with 13 chunks for 2, 6, 9, 13, and 15 features, demonstrating that the system can detect abnormalities in streaming PMU data with a low false positive rate and no false negatives.
The experimental set up for online GMM is the input is processed batch by batch with a window size of 100. Prequential testing [36] has been adopted for testing the streaming data so there is no test train split. The online GMM has been tested with the remaining samples of the month May and the month June. The number of features considered for online GMM is 15 as the offline GMM produce good result for 15 features. The offline model gives F1 score below 0.9 for the samples taken from the next ten days in the month of May which indicates the presence of concept drift and it is depicted in Fig. 5 and then the online GMM is updated with the recent 10 batches of data. The results prove that the recall and precision of online GMM is well above 0.98.
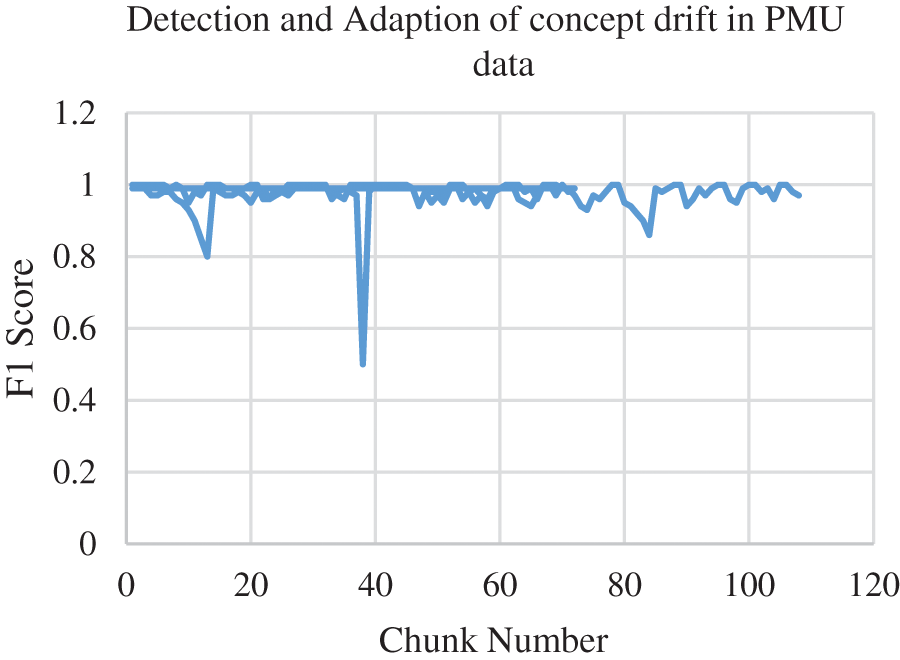
Figure 5: Detection and Adaption of concept drift in PMU data
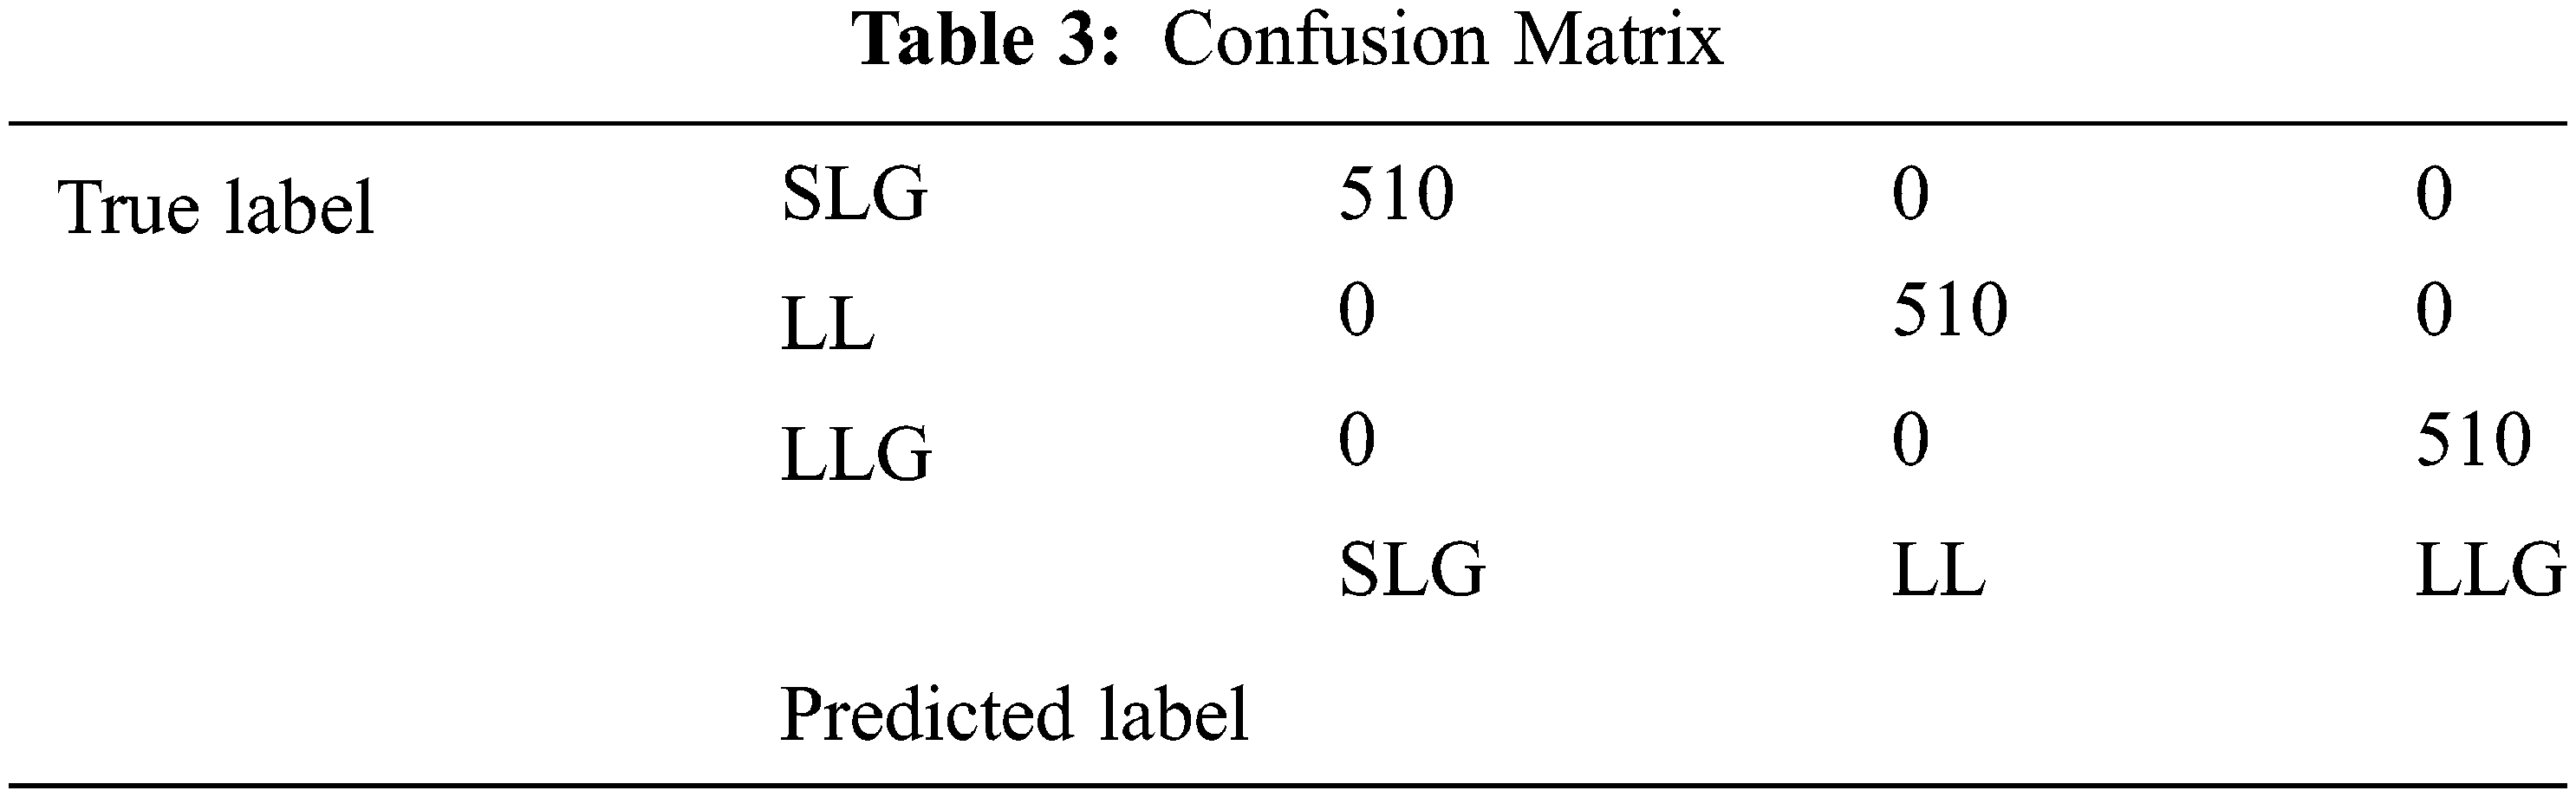
The experimental set up for clustering ensemble method is that around 1700 data were simulated and there are 5100 data in total. The total data is divided into a ratio of 70:30 for training and testing. So training data consists of 3570 data and testing data consists of 1530 data. GMM, Hierarchical and the k means algorithm were used to produce partitions and the labels. Consensus function such as CSPA, HGPA and MCLA are used to combine the labels that were produced. Performance metrics such as NMI and ARI is used to measure the quality of the clusters. In order to visualize the dataset, principal component analysis is applied. The three types of faults namely SLG, LL and LLG are clustered and the results are shown in Figs. 6a–6d respectively. The three type of faults namely SLG, LL and LLG with normal data is clustered and the results are shown in Figs. 7a–7d respectively. Fig. 8 briefs the detail of the normalized mutual information of the anomalies that are present in the PMU data. CSPA and MCLA projected value of 0.86 whereas HGPA received value of 0.55 in the clustering technique. This shows that if the NMI value is high then the clustering results are high. Fig. 9 showcases the ARI values. k means clustering performed well among all methods. GMM had value of 0.90 and agglomerative clustering had value of 0.81. The obtained outcomes prove that clustering ensemble technique achieves well when compared to the individual clustering methods. The confusion matrix for the results are given in Table 3.
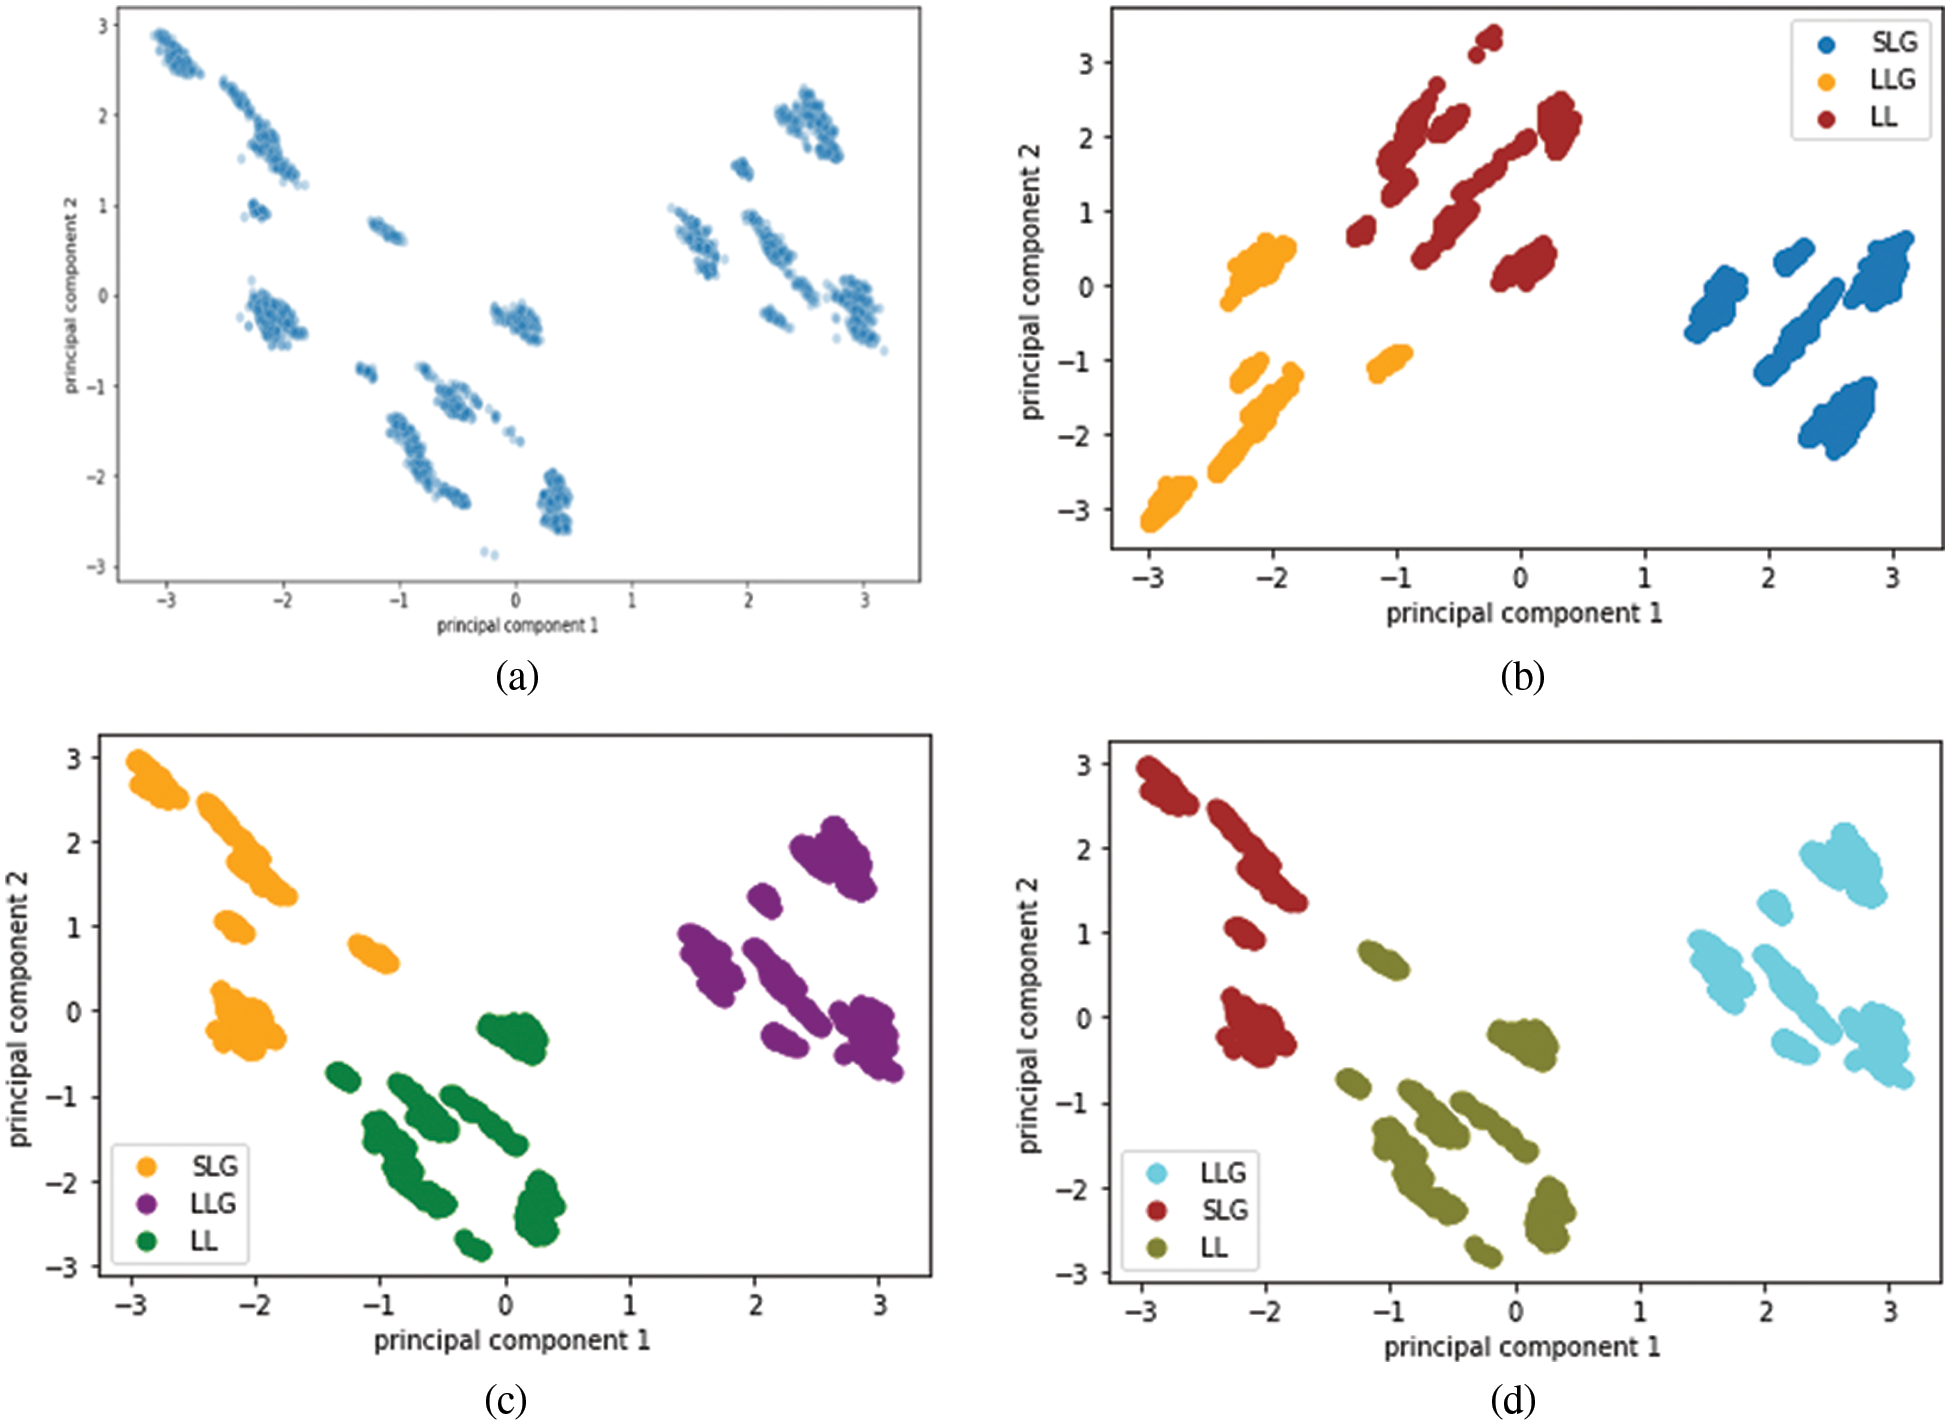
Figure 6: (a) Visualization of anomalies using Principal Component Analysis (b) Result of K means clustering (c) Result of Agglomerative clustering (d) Result of GMM
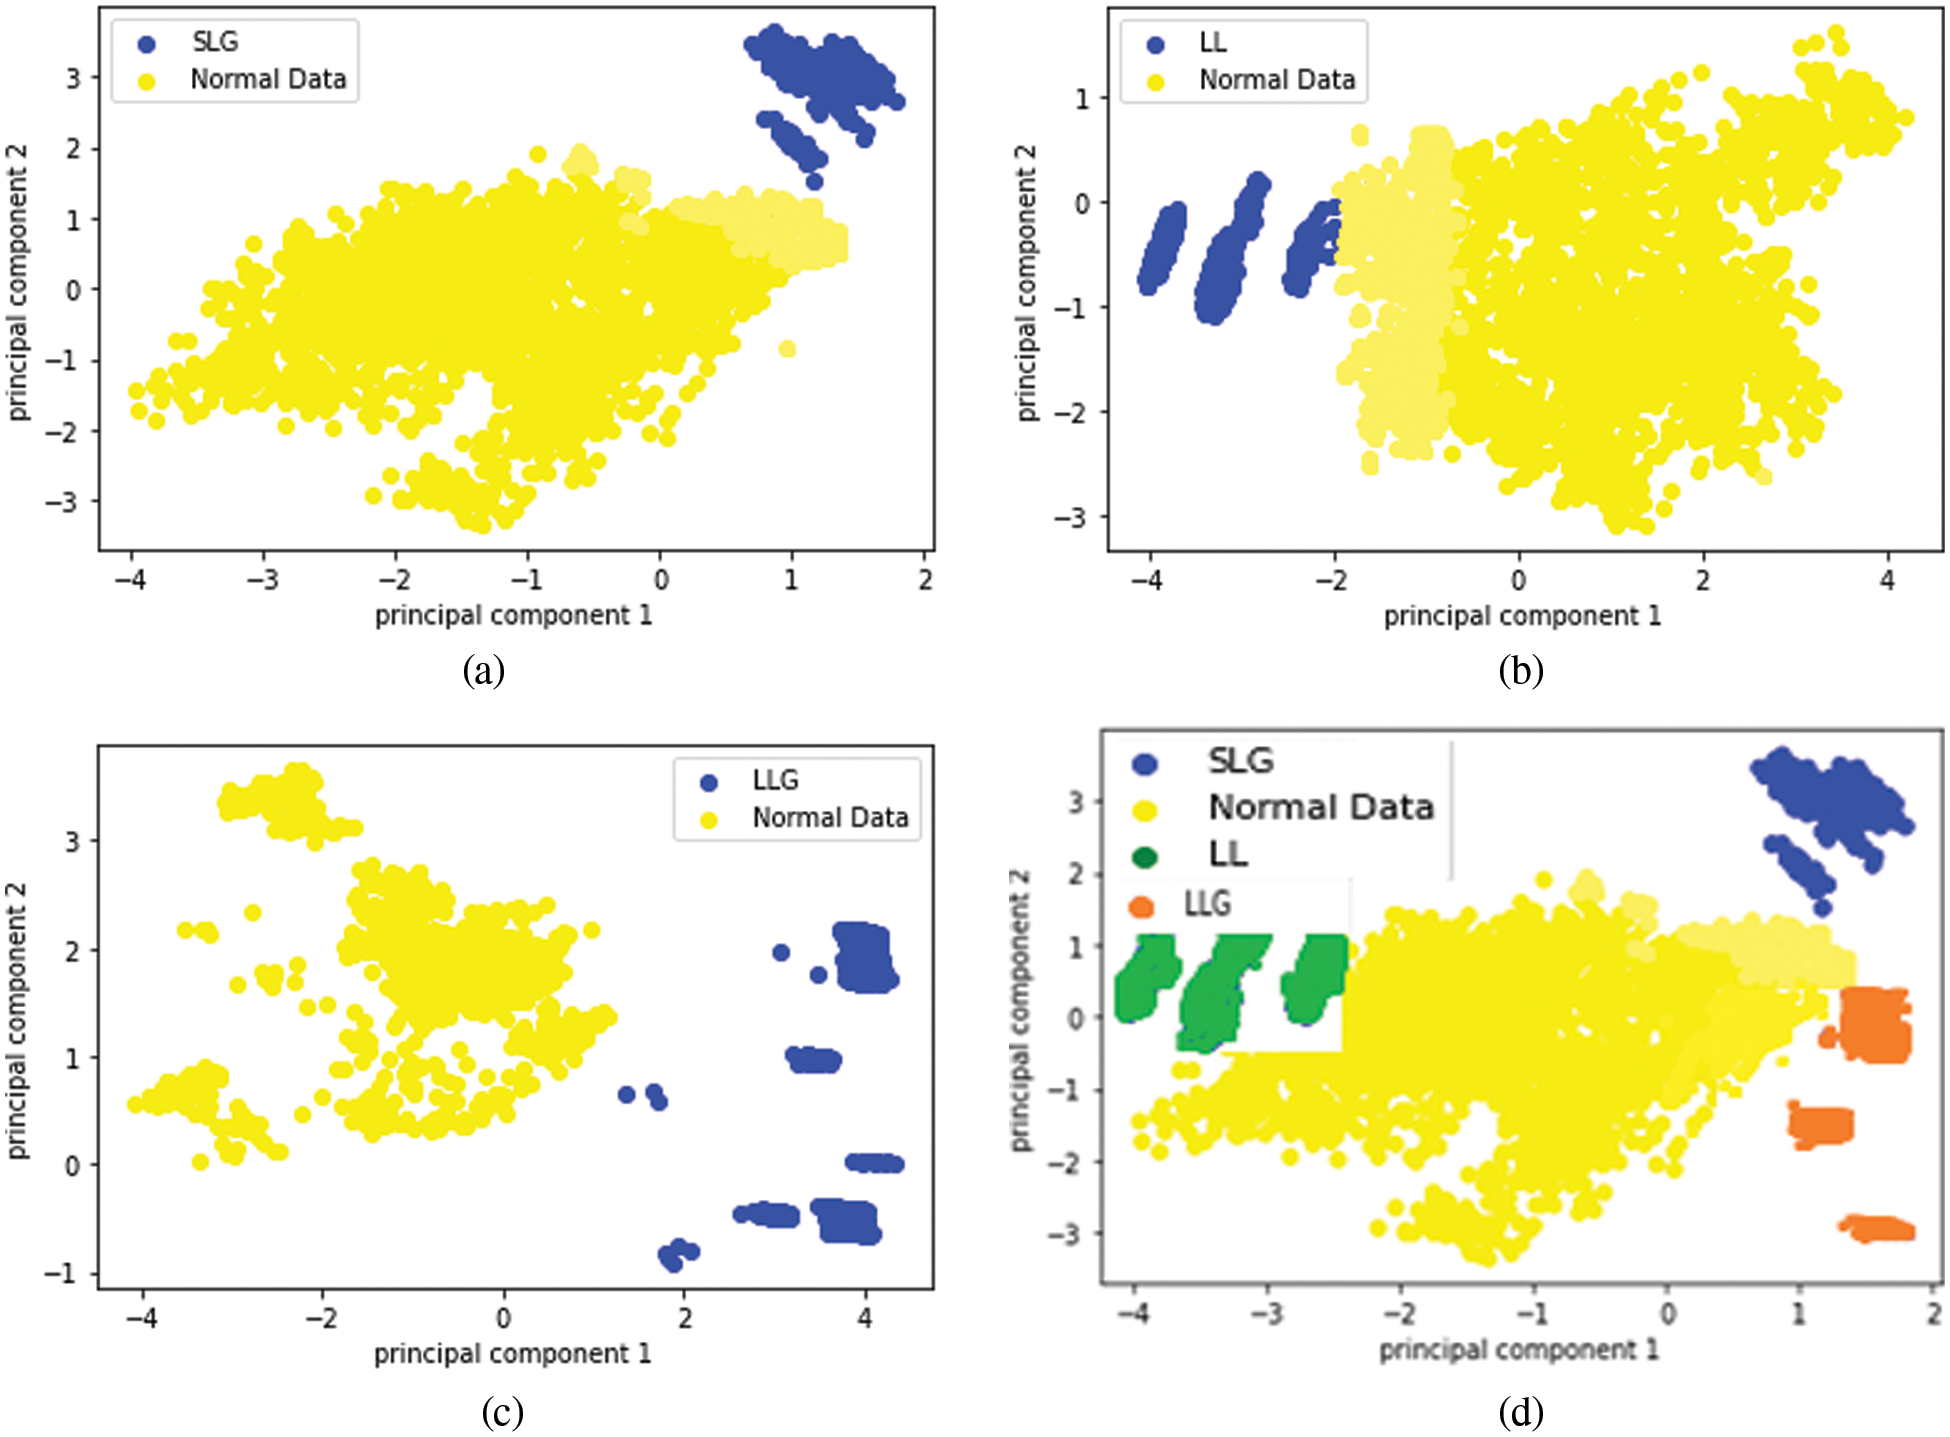
Figure 7: Result of clustering of anomalous data and normal data (a) Normal data and SLG fault (b) Normal data and LL fault (c)Normal data and LLG fault (d) Normal data, SLG, LL and LLG
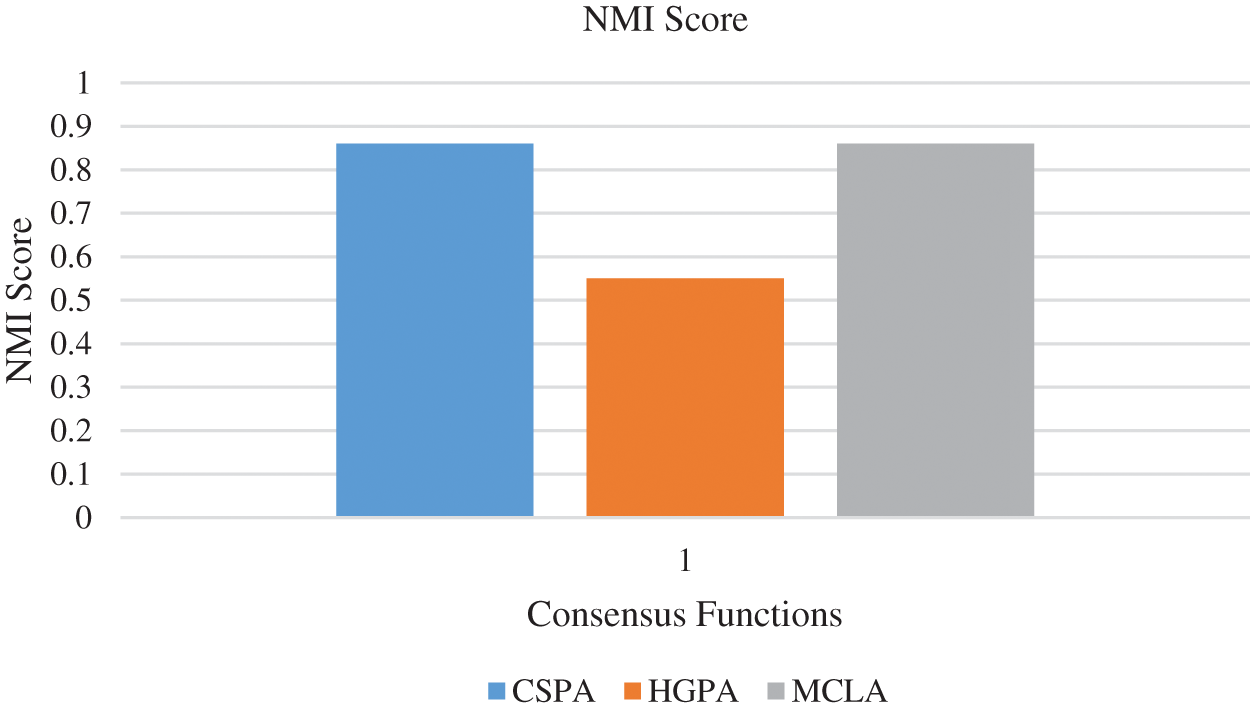
Figure 8: NMI Score of PMU dataset anomalies
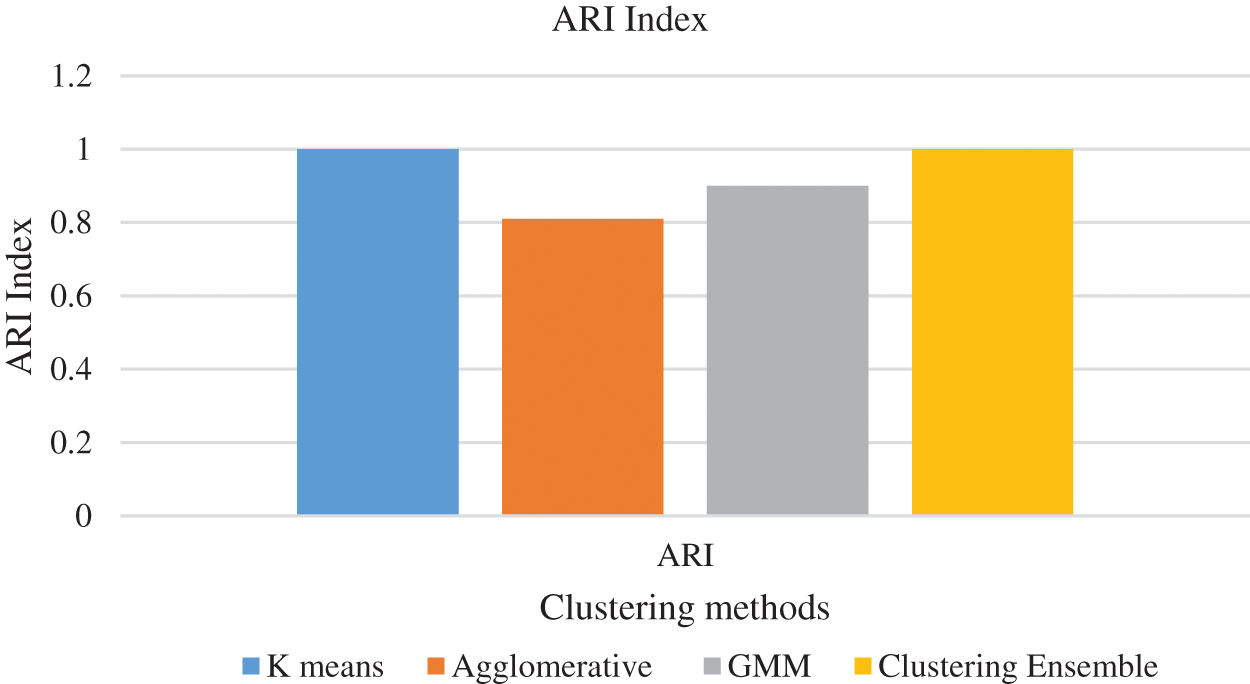
Figure 9: ARI for clustering methods
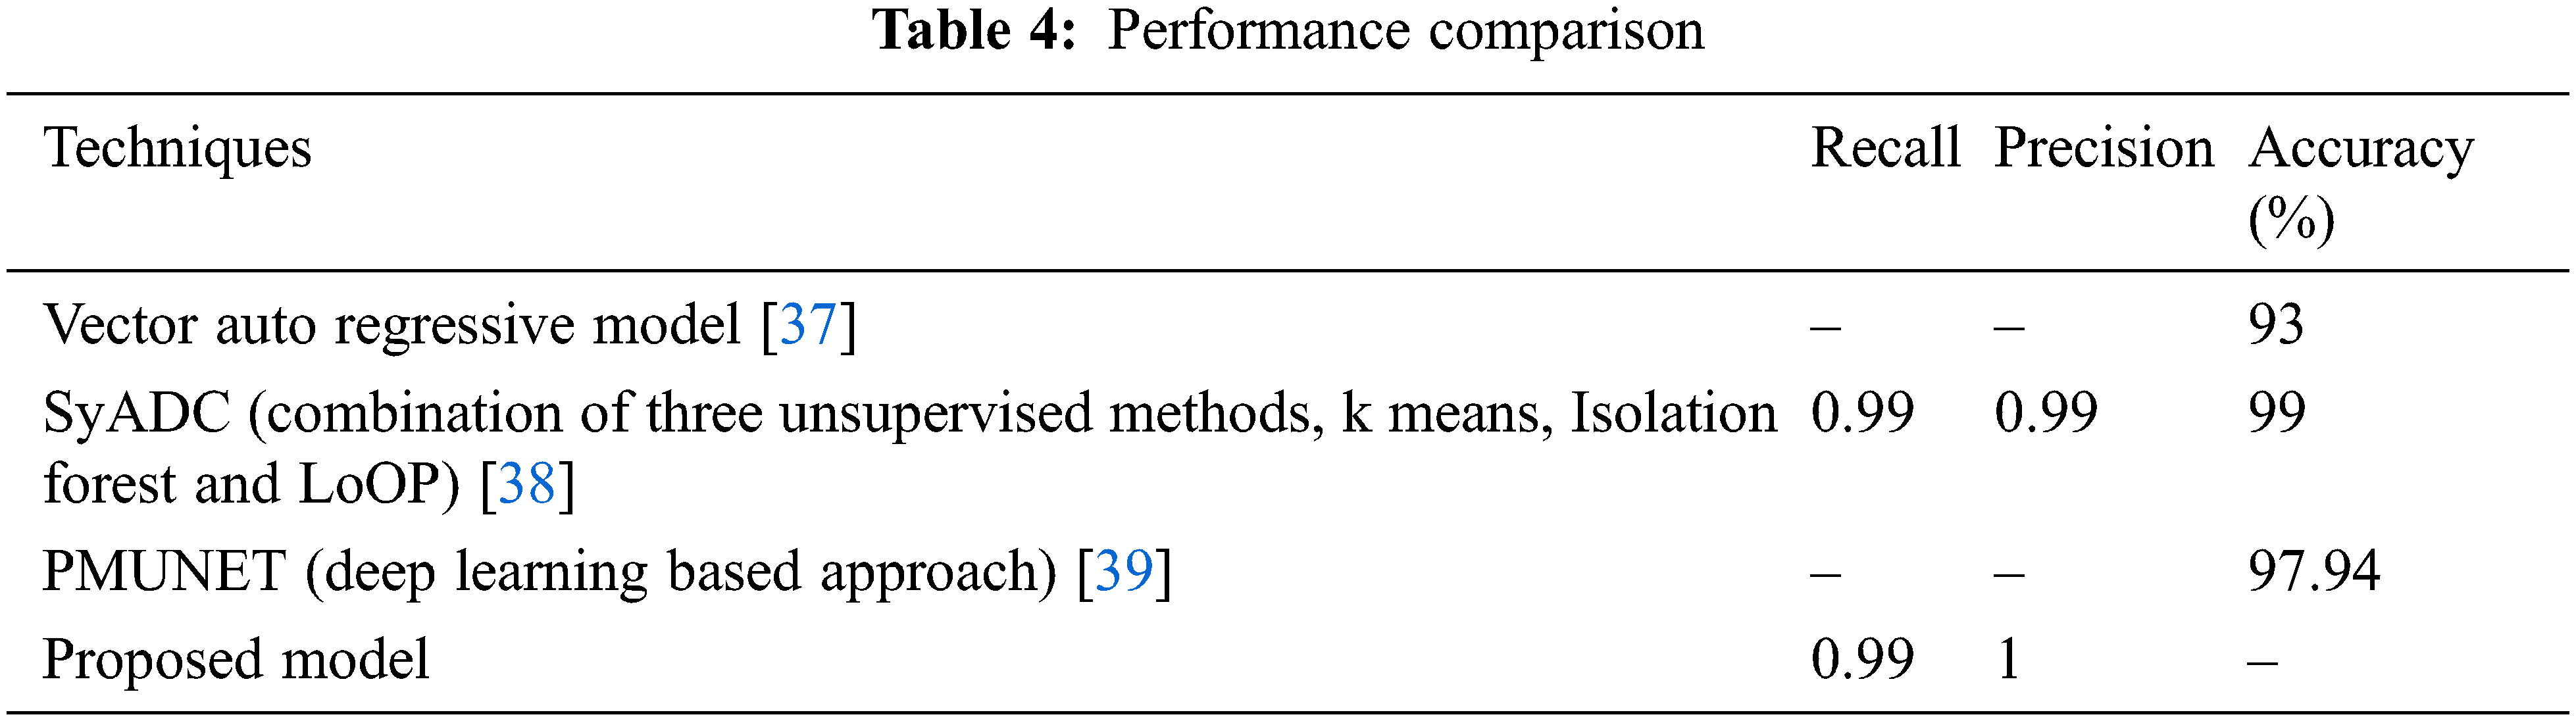
The results of the suggested work is compared with the current works and is shown in the Table 4. This explains that the performance of the proposed model is good when compared with the other research works that are carried out in parallel by other researchers in this field. The proposed scheme detected and classified anomalies using density based method and clustering ensemble method. Keeping in view the challenges of streaming data, the proposed scheme is incremental and adaptive to concept drift. Experimental results show that our proposed approach outperforms other existing approach in terms of recall and precision. If the detected anomalies are misclassified then the necessary corrective actions may not be taken at the right time. This will lead to fault and the occurrence of fault will be propagated to nearby areas that will end in regional blackout affecting the day to day activities of the common people.
This work proposes the identification and classification of abnormalities in large amounts of multivariate PMU data on the fly, which is not presented in previous works. This work focuses on detecting and classifying anomalies by using all the variables present in PMU data utilizing three modules: offline GMM, online GMM and clustering ensemble. The major motive for selecting unsupervised method is that it is not possible to tag the fast flowing PMU data. In this research work we handled both catastrophic forgetting effect and concept drift in an efficient manner using offline GMM and online GMM. The concept of catastrophic forgetting effect has been overcome by the use of offline GMM and not retraining the online GMM unnecessarily. This work considers samples of data from the month of May and June from the PMU dataset. As a future work this can be extended to all the data in the stream without taking samples. This work can be extended to find which type of concept drift is present in the PMU data. The identification of concept drift in real time PMU dataset is a challenging task as the true labels are not available. High detection performance has been achieved by the proposed framework by testing using the streaming PMU data.
Funding Statement: The authors received no specific funding for this study.
Conflicts of Interest: The authors declare that they have no conflicts of interest to report regarding the present study.
References
1. T. Guo and J. V. Milanovi, “Online identification of power system dynamic signature using PMU measurements and data mining,” IEEE Transactions on Power Systems, vol. 31, no. 3, pp. 1760–1768, 2016. [Google Scholar]
2. G. Ghanavati, P. D. Hines and T. I. Lakoba, “Identifying useful statistical indicators of proximity to instability in stochastic power systems,” IEEE Transactions on Power Systems, vol. 31, no. 2, pp. 1360–1368, 2015. [Google Scholar]
3. D. Nguyen, R. Barella, S. A. Wallace, X. Zhao and X. Liang, “Smart grid line event classification using supervised learning over pmu data streams,” in 2015 Sixth Int. Green and Sustainable Computing Conf. (IGSC), Las Vegas, Nevada, USA, pp. 1–8, 2015. [Google Scholar]
4. M. Rafferty, X. Liu, D. M. Laverty and S. McLoone, “Real-time multiple event detection and classification using moving window PCA,” IEEE Transactions on Smart Grid, vol. 7, no. 5, pp. 2537–2548, 2016. [Google Scholar]
5. S. Pan, T. Morris and U. Adhikari, “Classification of disturbances and cyberattacks in power systems using heterogeneous time synchronized data,” IEEE Transactions Industrial Informatics, vol. 11, no. 3, pp. 650–662, 2015. [Google Scholar]
6. S. Pandey, “A real time synchrophasor data-driven approach for event detection in the power grid,” M.S. thesis,Washington State Univ, Pullman, WA, 2017. [Google Scholar]
7. M. Jamei, A. Scaglione, C. Roberts, E. Stewart, S. Peisert et al., “Anomaly detection using optimally-placed μPMU sensors in distribution grids,” IEEE Transactions on Power Systems, vol. 33, no. 4, pp. 3611–3623, 2018. [Google Scholar]
8. D. J. Hill and B. S. Minsker, “Anomaly detection in streaming environmental sensor data: A data-driven modeling approach,” Environmental Modelling & Software, vol. 25, no. 9, pp. 1014–1022, 2010. [Google Scholar]
9. Z. Yang, N. Chen, Y. Chen and N. Zhou, “A novel PMU fog based early anomaly detection for an efficient wide area PMU network,” in 2018 IEEE 2nd Int. Conf. on Fog and Edge Computing (ICFEC), Washington DC, DC, USA, pp. 1–10, 2018. [Google Scholar]
10. D. Zhou, J. Guo, Y. Zhang, J. Chai, H. Liu et al., “Distributed data analytics platform for widearea synchrophasor measurement systems,” IEEE Transactions on Smart Grid, vol. 7, no. 5, pp. 2397–2405, 2016. [Google Scholar]
11. A. Lavin and S. Ahmad, “Evaluating real-time anomaly detection algorithms--the numenta anomaly benchmark,” in 2015 IEEE 14th Int. Conf. on Machine Learning and Applications (ICMLA), Miami, pp. 38–44, 2015. [Google Scholar]
12. J. A. V. Diosdado, V. Paul, K. A. Ellis, D. Coates, R. Loomba et al., “A combined offline and online algorithm for real-time and long-term classification of sheep behaviour: Novel approach for precision livestock farming,” Sensors, vol. 19, no. 3201, pp. 1–9, 2019. [Google Scholar]
13. L. Fischer, B. Hammer and H. Wersing, “Combining offline and online classifiers for life-long learning,” in 2015 Int. Joint Conf. on Neural Networks (IJCNN), Killarney, Ireland, pp. 1–8, 2015. [Google Scholar]
14. M. Tennant, F. Stahl, O. Rana and J. B. Gomes, “Scalable real-time classification of data streams with concept drift,” Future Generation Computer Systems, vol. 75, no. 1, pp. 187–199, 2017. [Google Scholar]
15. V. Losing, B. Hammer and H. Wersing, “Incremental on-line learning: A review and comparison of state of the art algorithms,” Neurocomputing, vol. 275, no. 1, pp. 1261–1274, 2018. [Google Scholar]
16. M. R. Heinen, P. M. Engel and R. C. Pinto, “IGMN: An incremental Gaussian mixture network that learns instantaneously from data flows,” in Proc. VIII Encontro Nacional de Inteligência Artificial (ENIA2011), Natal, RN, pp. 1–12, 2011. [Google Scholar]
17. R. C. Pinto and P. M. Engel, “Incremental Gaussian mixture model a fast,” PLOS ONE, vol. 10, no. 10, pp. 1–12, 2015. [Google Scholar]
18. Y. Zhang, L. Chen and X. Ran, “Online incremental EM training of GMM and its application to speech processing applications,” in IEEE 10th Int. Conf. on Signal Processing Proceedings, Beijing, China, pp. 1309–1312, 2010. [Google Scholar]
19. W. M. Fisher, G. R. Doddington and K. M. Goudie Marshall, “The DARPA speech recognition research database: Specification and status,” in Proc. of DARPA workshop on Speech Recognition, Palo Alto, CA, USA, pp. 1–94, 1986. [Google Scholar]
20. J. M. Acevedo Valle, K. Trejo and C. Angulo, “Multivariate regression with incremental learning of Gaussian mixture models,” in Proc. of the 20th Int. Conf. of the Catalan Association for Artificial Intelligence, Deltebre, Terres de L’Ebre, Spain, pp. 196–205, 2017. [Google Scholar]
21. W. Jun, D. Dayong, H. X. Sheng and Z. Bo, “Tracking concept drifting with an online-optimized incremental learning framework,” in In Proc. of the 7th ACM Int. Workshop on Multimedia Information Retrieval, Hilton, Singapore, pp. 33–40, 2005. [Google Scholar]
22. S. Calinon and A. Billard, “Incremental learning of gestures by imitation in a humanoid robot,” in 2007 2nd ACM/IEEE Int. Conf. on Human-Robot Interaction (HRI), Arlington Virginia, USA, pp. 255–262, 2007. [Google Scholar]
23. S. Thrun, M. Montemerlo, H. Dahlkamp, D. Stavens, A. Aron et al., “Stanley: The robot that won the DARPA grand challenge,” The 2005 DARPA Grand Challenge. Springer Tracts in Advanced Robotics, vol. 36, pp. 1–43, 2007. [Google Scholar]
24. O. Arandjelovic and R. Cipolla, “Incremental learning of temporally-coherent Gaussian mixture models,” in BMVC 2005: Proc. of the British Machine Conf. 2005, Oxford, UK, pp. 1–59, 2005. [Google Scholar]
25. M. Song and H. Wang, “Highly efficient incremental estimation of Gaussian mixture models for online data stream clustering,” Intelligent Computing: Theory and Applications III, vol. 5803, pp. 174–183, 2005. [Google Scholar]
26. H. M. Gomes, J. P. Barddal, F. Enembreck and A. Bifet, “A survey on ensemble learning for data stream classification,” ACM Computing Surveys, vol. 23, pp. 1–36, 2017. [Google Scholar]
27. J. Rushing, S. Graves, E. Criswell and A. Lin, “A coverage based ensemble algorithm (CBEA) for streaming data,” in 16th IEEE Int. Conf. on Tools with Artificial Intelligence, Boca Raton, Florida, pp. 106–112, 2004. [Google Scholar]
28. W. N. Street and Y. S. Kim, “A streaming ensemble algorithm (SEA) for large-scale classification,” in KDD ’01: Proc. of the Seventh ACM SIGKDD Int. Conf. on Knowledge Discovery and Data Mining, San Francisco, California, pp. 377–382, 2001. [Google Scholar]
29. J. R. B. Junior and M. C. Nicoletti, “An iterative boosting-based ensemble for streaming data classification,” Information Fusion, vol. 45, no. 2, pp. 66–78, 2019. [Google Scholar]
30. S. Basumallik, R. Ma and S. Eftekharnejad, “Packet-data anomaly detection in PMU-based state estimator using convolutional neural network,” International Journal of Electrical Power & Energy Systems, vol. 107, no. 2, pp. 690–702, 2019. [Google Scholar]
31. A. L. Amutha, R. Annie Uthra, J. Preetha Roselyn and R. Golda Brunet, “Anomaly detection in multivariate streaming PMU data using density estimation technique in wide area monitoring system,” Expert Systems with Applications, vol. 175, no. 2, pp. 1–11, 2021. [Google Scholar]
32. A. L. Amutha, R. A. Uthra, J. P. Roselyn and R. G. Brunet, “Streaming data classification using hybrid classifiers to tackle stability-plasticity dilemma and concept drift,” in IEEE 4th Conf. on Information & Communication Technology (CICT), Chennai, India, pp. 1–10, 2020. [Google Scholar]
33. L. Shalalfeh, P. Bogdan and E. A. Jonckheere, “Fractional dynamics of PMU data,” IEEE Transactions on Smart Grid, vol. 12, no. 3, pp. 2578–2588, 2021. [Google Scholar]
34. A. Strehl and J. Ghosh, “Cluster ensembles-a knowledge reuse framework for multiple partitions,” Journal of Machine Learning Research, vol. 11, no. 3, pp. 583–617, 2003. [Google Scholar]
35. L. Hubert and P. Arabie, “Comparing partitions,” Journal of Classification, vol. 2, no. 1, pp. 193–218, 1985. [Google Scholar]
36. A. Dawid, “Statistical theory the prequential approach,” The Royal Statistical Society, vol. 147, no. 2, pp. 278–292, 1984. [Google Scholar]
37. C. Hannon, D. Deka, D. Jin, M. Vuffray and A. Y. Lokhov, “Real-time anomaly detection and classification in streaming PMU data,” in 2021 IEEE Madrid PowerTech, pp. 1–6, 2021. [Google Scholar]
38. E. Khaledian, S. Pandey, P. Kundu and A. K. Srivastava, “Real-time synchrophasor data anomaly detection and classification using isolation forest, kmeans, and loop,” IEEE Transactions on Smart Grid, vol. 12, no. 3, pp. 2378–2388, 2021. [Google Scholar]
39. A. Ahmed, K. S. Sajan, A. Srivastava and Y. Wu, “Anomaly detection, localization and classification using drifting synchrophasor data streams,” IEEE Transactions on Smart Grid, vol. 12, no. 4, pp. 3570–3580, 2021. [Google Scholar]
Cite This Article
 Copyright © 2023 The Author(s). Published by Tech Science Press.
This work is licensed under a Creative Commons Attribution 4.0 International License , which permits unrestricted use, distribution, and reproduction in any medium, provided the original work is properly cited.
 Downloads
 Citation Tools