
 Submit a Paper
 Propose a Special lssue
 Open Access
ARTICLE

Early Detection of Alzheimer’s Disease Based on Laplacian Re-Decomposition and XGBoosting
1 Information Technology Department, Faculty of Computers and Information, Mansoura University, Mansoura, 35511, Egypt
2 Faculty of Computer Science and Engineering, Galala University, Suez, 435611, Egypt
3 Faculty of Computers and Artificial Intelligence, Benha University, Banha, 13518, Egypt
4 College of Computing and Informatics, Sungkyunkwan University, Suwon, Korea
* Corresponding Author: Tamer Abuhmed. Email:
Computer Systems Science and Engineering 2023, 46(3), 2773-2795. https://doi.org/10.32604/csse.2023.036371
Received 28 September 2022; Accepted 14 December 2022; Issue published 03 April 2023
 View Full Text
 Download PDF
Abstract
The precise diagnosis of Alzheimer’s disease is critical for patient treatment, especially at the early stage, because awareness of the severity and progression risks lets patients take preventative actions before irreversible brain damage occurs. It is possible to gain a holistic view of Alzheimer’s disease staging by combining multiple data modalities, known as image fusion. In this paper, the study proposes the early detection of Alzheimer’s disease using different modalities of Alzheimer’s disease brain images. First, the preprocessing was performed on the data. Then, the data augmentation techniques are used to handle overfitting. Also, the skull is removed to lead to good classification. In the second phase, two fusion stages are used: pixel level (early fusion) and feature level (late fusion). We fused magnetic resonance imaging and positron emission tomography images using early fusion (Laplacian Re-Decomposition) and late fusion (Canonical Correlation Analysis). The proposed system used magnetic resonance imaging and positron emission tomography to take advantage of each. Magnetic resonance imaging system’s primary benefits are providing images with excellent spatial resolution and structural information for specific organs. Positron emission tomography images can provide functional information and the metabolisms of particular tissues. This characteristic helps clinicians detect diseases and tumor progression at an early stage. Third, the feature extraction of fused images is extracted using a convolutional neural network. In the case of late fusion, the features are extracted first and then fused. Finally, the proposed system performs XGB to classify Alzheimer’s disease. The system’s performance was evaluated using accuracy, specificity, and sensitivity. All medical data were retrieved in the 2D format of 256 × 256 pixels. The classifiers were optimized to achieve the final results: for the decision tree, the maximum depth of a tree was 2. The best number of trees for the random forest was 60; for the support vector machine, the maximum depth was 4, and the kernel gamma was 0.01. The system achieved an accuracy of 98.06%, specificity of 94.32%, and sensitivity of 97.02% in the case of early fusion. Also, if the system achieved late fusion, accuracy was 99.22%, specificity was 96.54%, and sensitivity was 99.54%.Keywords
The aging population worldwide is increasing the number of dementia patients. Alzheimer’s disease (AD) is the most prevalent neurodegenerative illness in the elderly, causing the patient’s cognitive functions, including memory, problem-solving, and language, to decline gradually. Cognitive changes in AD often begin slowly and accelerate with time. According to recent studies, 55 million people have AD worldwide, and which number by 2030 is expected to increase to 78 million [1]. In research on AD, subjects are frequently classified into four categories of normal control (NC), early mild cognitive impairment (EMCI), late mild cognitive impairment (LMCI), and AD. The cognitive abilities of individuals with mild cognitive impairment (MCI) and dementia have deteriorated. However, EMCI has a lesser everyday impact, and patients with dementia frequently exhibit other symptoms, such as difficulties in thinking or impaired judgment [2,3]. MCI is a neurological disorder characterized by cognitive impairment that affects the patient’s ability to perform some daily tasks. MCI implies the onset and development of cognitive impairments beyond normal expectations of an individual’s age and education but is not severe enough to hinder their daily activities. It may happen as a transitional stage between normal aging and the preclinical stage of dementia.
As AD develops, the structure and metabolism of the brain change. As a result of this change, a phenotype, which consists of cortex and hippocampus shrinkages, expanded ventricles, and alteration of regional glucose, can be measured by medical imaging techniques, such as magnetic resonance imaging (MRI) and positron emission tomography (PET). Diagnosis and prediction of AD can be achieved by calculating and analyzing these medical images [4]. For example, a T1-weighted MRI provides high-resolution structural information for the brain, enabling the measurement of structural measures, such as thickness, size, and shape. On the other hand, PET imaging assesses brain tissue’s metabolic activity. PET images can reflect organ tissues and bloodstreams [5]. The information in the multimodal medical images should be used to provide better human visualization to support pathologists in making decisions. Image fusion is a common strategy for accomplishing this aim since the combined output preserves MRI image location information and the molecular activity information from PET. So, this research focuses primarily on the challenge of merging MRI-PET multimodal medical images [6].
In this study, the proposed system exploits MRI and PET image fusion to enhance AD prediction in its early stage and differentiate between different AD stages. Image fusion techniques include integrating images and image-related information from multi-source images [7,8]. The fusion of various sources of medical images is a well-established approach in the medical field [9,10]. It has been proven to significantly increase performance using a single imaging source [11].
After the fusion phase is performed, feature extraction is transitioned to the most important phase. Deep neural networks (DNNs), which are a part of the machine learning (ML) field, are theoretically capable of imitating any complex function and successfully addressing image feature extraction and classification problems [12]. Recent advancements in neural network-based on deep learning (DL) techniques have led to breakthroughs and advancements in several disciplines, which include object identification [2,3], image classification [4,13], and facial recognition [14,15]. Since feature extraction is the most crucial phase in the image classification system and directly impacts performance, the conventional classification methods employ various time-consuming feature engineering approaches [16,17]. However, CNN-based models have recently demonstrated an exceptional ability to extract high-quality features from raw images without user intervention [12,18].
In this study, the early detection of AD and classification system is created and concentrated on DL approaches and ensemble XGB. Because both VGG16 and XGB perform well in image classification challenges, this work investigates how these two components are combined. A new image classification method depends on the VGG16-XGBoost model to enhance the performance of the image classification issue. Also, to increase accuracy, the proposed framework VGG16-XGBoost model combines VGG16 work as a trainable extractor of deep features and XGB as a classifier. This two-stage approach ensures high feature extraction and classification accuracy. The main contributions of our work in this paper are in summary:
1. The proposed system is based on simple CNN architectures that deal with two different modalities: MRI and PET images. To take advantage of two modalities, the fusion is performed. MRI’s primary benefits are providing images with excellent spatial resolution and structural information for specific organs. PET images can provide functional information and the metabolisms of particular tissues.
2. Also, the main challenges for medical images are the small number of the dataset. So, data augmentation techniques are applied to maximize the dataset’s size and prevent the overfitting problem.
3. Resampling methods are used, such as “oversampling, downsampling”, to overcome collected imbalanced dataset classes.
4. The proposed system uses transfer learning to take advantage of the pre-trained models, such as the VGG16 model, because it is explored high deep features.
5. Ensemble methods have higher predictive accuracy compared to individual models. As a result, XGB is used for classification.
6. According to performance measures, the experimental results achieved high performance.
The remainder of the paper is structured as follows: Section 2 introduces the literature review on medical image classification and its challenges, then Section 3 provides the proposed framework in more detail. Section 4 reports the experimental analysis results of the proposed framework, while Section 5 describes the discussion in more detail. Finally, Section 6 concludes the work and postulates future work. Table 2 lists all used abbreviations and their meanings.
There have been a variety of research efforts conducted on the diagnosis of AD utilizing a variety of ML algorithms and DL techniques to detect dementia at an earlier stage. However, it is crucial to design and develop new methods based on the most recent and cutting-edge DL approaches to uncover relevant characteristics that may be employed for early AD diagnosis.
Recent studies have emphasized identifying novel features that contribute to the early diagnosis of dementia. In addition, these studies should increase the efficiency of early identification of Alzheimer’s disease by eliminating unnecessary and redundant features previously employed. Khan et al. [19] reviewed recent research on early AD detection by ML techniques. Researchers conclude in their review that several methods achieved promising prediction accuracy; however, a fair comparison was made difficult by evaluating different pathologically unproven data sets from different imaging modalities. Furthermore, many additional factors, such as preprocessing, the number of key feature-selection attributes, and imbalance classes, substantially impact the evaluation of prediction accuracy of AD prediction.
Using particular CSF biomarkers from an Alzheimer’s clinical dataset, Hassan et al. [20] proposed a classification model to predict earlier stages of AD. Several models were constructed and validated using various biomarkers to accurately predict the MCI status of a patient. Their findings indicate that the classification model based on J48 can accurately predict with 98.82% accuracy. Lodha et al. [21] presented a medical ML-based model. Advances in medical technology have made better data available to identify symptoms of different diseases in the early stages. Their paper uses ML algorithms to process this data obtained through neuroimaging technologies in its primitive stage for AD detection. Neural networks and random forests perform much better than other methods. This method is implemented so that results are instant and accurate. SVM and gradient boosting are also powerful algorithms for the problem of classification.
Rallabandi et al. [22] developed a technique for distinguishing between early and late MCI, as well as AD. For best results, researchers employ a nonlinear SVM classifier. While this approach may not be effective for clinical diagnosis, it represents a significant advancement in classifying MCI and AD. Hassan et al. [23] introduced a method for optimizing feature extraction using a transfer learning concept and a ResNet50 DL model. Extensive tests were carried out on the challenging standard benchmark ImageCLEF-2012 dataset containing 31 classes. The created approach achieved an increased classification accuracy of 87.91%, which was up to 10% higher than state-of-the-art approaches on the same dataset.
Islam et al. [14] presented an effective method for diagnosing AD by analyzing brain MRI data. Even though most current research is based on binary classification, their models considerably enhance multiclass classification as CN, EMCI, LMCI, and AD. Accomplishing a 93% degree of accuracy, their work can be useful for the early identification of AD. Although the provided approach was only evaluated on the AD dataset, it might be successfully applied to other medical diagnosis problems. Additionally, the method has great potential in other domains with limited datasets. But their accuracy, at only 93%, needs to be improved. Wang et al. [24] studied a CNN structure with eight layers. Six layers were employed for the feature extraction procedure, and two completely connected layers were used for the classification step. According to the results, max-pooling and Leaky Rectified Linear unit (LReLU) obtained a high degree of performance with 97.65% accuracy.
Alam et al. [25] introduced ensemble learning methods for identifying pneumoconiosis disease in chest X-ray radiographs (CXRs) by combining various deep-learning models. Three ensemble learning approaches (simple averaging, multi-weighted averaging, and majority voting (MVOT)) were developed to examine performance utilizing randomized cross-folds and leave-one-out cross-validations datasets. The statistical combination on a reliable model, CheXNet, was slightly improved in the second investigation’s multi-weighted averaging ensemble. The identical model, however, increased accuracy in the third investigation from 87.80% to 90.2%. The results of the investigation allowed there to pinpoint a DL model and ensemble architecture that performed better than the competition and had an accuracy of 91.50% in the automated detection of pneumoconiosis.
Devnath et al. [26] presented a unique DL-based skin cancer detector using an unbalanced dataset. The data imbalance was resolved using data augmentation to balance different skin and cancer groups. The diagnosis of diseases using photographs frequently uses DL models. The classification of skin cancer was carried out using DL-based models (AlexNet, InceptionV3, and RegNetY-320). InceptionV3 and AlexNet fared worse than RegNetY-320, according to the results, on the balanced and unbalanced F1-score and ROC curve datasets. A framework’s effectiveness as the presented value was 91%, 88.1%, and 0.95%, all much higher than the values produced using the state-of-the-art approach, which were 85%, 69.3%, and 0.90%, respectively. The detection of diseases could benefit from their efforts. It might decrease the need for pointless biopsies, save lives, and lower patient medical expenses.
The proposed model for the effective diagnosis of the onset of AD has been proposed to overcome the limitations of earlier studies. The medical images undergo a preprocessing phase to eliminate the class imbalance issue. Avoiding the curse of dimensionality by utilizing ensemble learning algorithms to choose important attributes is feasible. Most past studies employed pre-trained networks, which were trained on enormous image datasets containing non-medical imagery. This may demand more time and resources to adjust the network to classify medical images.
Moreover, this study investigates the most recent progress of the XGB in developing an AD diagnosis system. The previous limitations are as follows: they depend only on a single ML model compared to an ensemble classifier. Also, previous work, as shown in Table 1, is summarized. Also, previous work concentrates on traditional feature extraction that does not work well with the classifier to explore more features. Finally, the classification accuracy needs to enhance. To overcome these limitations of previous work, a model for effective diagnosis of the onset of AD has been proposed. First, a preprocessing step is performed on the pathologically proven data set to remove the class imbalance issue by using oversampling and under-sampling. Second, augmented images were generated from the original by flipping images horizontally and vertically to overcome the possible over-fitting problem in training. Third, the VGG16 is used as a feature extraction because traditional feature extraction cannot work well with the classifier to explore more features to learn the classifier. Fourth, the XGB depends on more than one model to give the final result of the classification rather than a single model. Finally, there is no overfitting to check the data’s stability. The K-fold is presented.


There is growing interest in using ensemble learning techniques for neurodegenerative diseases. Our suggested framework system, depicted in Fig. 1, includes a mechanism that assists in the early detection of disease. This framework system comprises five steps, beginning with reading multiple modalities of brain images from a standard database for AD patients. The preprocessing phase includes data standardization, skull stripping using BET, and data augmentation. The BET removes the skull from an image, leaving just the brain tissue-occupied region. This separates the brain tissue by utilizing the CSF-occupied dark matter between the skull and the brain.

Figure 1: The proposed system for detecting and diagnosing AD in the early stage
Fig. 1 shows that the third phase is divided into two sub-phases. The proposed system applies two fusion types, each of them separately from the other: early fusion and late fusion. The first sub-phase, using LDR, this step involves the integration of multiple modalities of brain images. In the past decade, medical image fusion has made significant progress forward. In contrast to previous methods, which were always susceptible to color distortion, blurring, and noise, our system uses LRD to address these concerns. LRD comprises two technological procedures. Complementary information, redundant information, and low-frequency sub-band images are obtained with a Laplacian decision graph decomposition and image enhancement. The proposed system then considered the heterogeneous features of redundant and complementary data. Using the inverse Laplacian transform, the outcome of the fusion is generated. After the fusion is performed, the VGG16-PCA is performed.
In the second sub-phase, feature fusion is performed, especially CCA, which is a multi-view feature fusion approach that aims to exploit and extract relevant features from different views. This step aims to fuse the previously extracted features using VGG16-PCA to produce more informative discriminative features between the tested groups.
In the third stage, feature extraction is used by CNN, where it is utilized a VGG16 model that has been pre-trained to extract features from a fused medical image. Only use the convolutional layer of the pre-trained VGG16 model to extract the features.
Finally, XGB is used to classify images as NC, EMCI, MCI, or AD. Transfer learning is the ideal strategy for employing a deep learning model as a baseline method or feature extractor. In contrast, XGB is a scalable ML approach. To avoid overfitting, tree boosting is used. Four phases of AD are classified into multiple classes (i.e., CN, EMCI, LMCI, and AD) in the final phase of the proposed framework.
Initially, the obtained dataset has unbalanced classes; hence, two resampling strategies are employed to overcome this issue (oversampling and under-sampling). Under-sampling refers to removing instances from a class overrepresented, whereas oversampling refers to adding cases to an underrepresented class. Many neuroimaging applications deal with imbalanced imaging data. For example, in the ADNI dataset, MCI cases eligible for the study are nearly two times the AD patient’s imaging modality and six times the control cases for the proteomics modality. Constructing an accurate classifier from imbalanced data is a challenging task. One of the key challenges in designing good prediction models on ADNI data lies in the class imbalance problem. A dataset is said to be imbalanced if one class has significantly more data points and fewer occurrences of the other. For example, the number of control cases in the ADNI dataset is half of the number of AD cases for proteomics measurement.
In contrast, there are 40% more control cases for image modality than AD cases. It is commonly agreed that imbalanced datasets adversely impact the performance of the classifiers as the learned model is biased towards the majority class to minimize the overall error rate. So, the oversampling is performed on a small number of instances. Also, under-sampling is performed to make balanced data because a single instance has many copies compared to other instances for the same class. The proposed system employs the oversampling method for AD, EMCI, and LMCI. The under-sampling technique is also applied to the NC class. All AD classes have 6,000 MRI images after resampling techniques. Consequently, there are now 24,000 images in the dataset. After that, the data is processed, normalized, and transformed into the proper format.
In the second stage, the skull is eliminated using the Brain Extraction Tool (BET), as depicted in Fig. 2. Third, the data normalization is performed, which means altering the pixel range or voxel intensity values. This seeks to delete some data variations, such as changing subject poses or differences in image contrast, to make detecting small differences easier. Data normalization methods include re-scaling data within the range [0, 1].

Figure 2: Skull removal using BET
Finally, data Augmentation is conducted. According to the limited availability of medical datasets, the dataset is expanded using typical data augmentation techniques like flipping, which flips images vertically or horizontally. As a result, the dataset was divided into 12,000 images for each class to comprise 48,000 images for all classes. The main motivations for utilizing data augmentation techniques are maximizing the dataset and solving the overfitting problem.
In this stage, the skull is removed from images by using the brain extraction tool (BET), as shown in Fig. 2. BET estimates the brain and non-brain threshold based on intensity, identifies the center of gravity of the head, identifies an initial sphere based on the gravity center, and extends the sphere tessellation until it reaches the edge of the brain [23,27].
Two stages of the fusion model were used: early and late. Each is used separately to enhance image sharpening, feature enhancement, and improved classification. The process of fused images is performed by using early fusion (Laplacian Re-Decomposition (LRD)) and late fusion (Canonical Correlation Analysis (CCA)) by fusing MRI and PET images. In the case of late fusion, the features are extracted first using VGG16 and then fused.
3.2.1 Early Fusion (Laplacian Re-Decomposition)
The multi-scaling transformation (MST) approach is a popular modeling paradigm for medical image fusion [6]. The MST methods include three stages: decomposition, selection of fusion rule, and reconstruction. First, the original images are broken down using MST tools into high-frequency sub-band (HSI) and low-frequency sub-band images (LSI). HSI primarily contains texture features of the source images, and LSI contains the background information; secondly, several fusion rules are adopted to fuse HSI and LSI; lastly, reverse decomposition operation is used to rebuild the fused outcome according to the decomposition process. The LRD is composed of three main parts: gradient-domain image enhancement (GDIE) [22,23], LP, and decision graph re-decomposition (DGR). To improve LRD detail extraction capabilities through the adaptive gradient, mapping is performed by GDIE. LP helps to split image features in a multi-scale fashion. Because of redundant and complementary information heterogeneity, overlapping and non-overlapping domain images are generated by establishing global decision graphs via DGR for better fusion results.
Furthermore, global decision graphs are used to help describe the logical relationship between GDR and IRS (m1–m14). The GDIE includes four main components and is the first phase of LRD: maximum local difference (MLD), interval division of feature information, remapping gradient feature, and convolution operation [22]. The second phase of LP splits the improved image of GDIE into HSI with edges and details and LSI with background information. Finally, the DGR can correctly classify HSI information that is redundant and complementary to HSI. In addition, DGR can decompose HSI to overlap images of the domain and non-overlapping images, which is conducive to the design fusion rules with less interphase interference and more targeted, as shown in Fig. 3.

Figure 3: Laplacian Re-Decomposition
Guide: The four components of GDIE are the MLD, division of feature information, convolution operation, and remapping features.
• MLD: in the window
where D (j, k) represents the value of MLD, and in every direction, Z(x) is the sum of all pixels.
• IDFI: The value of the threshold is chosen to divide edge information. This threshold has two steps, as presented by Eqs. (2) and (3).
(I) Arrange D (j, k) from higher to lower to make the 1-D array.
(II) The rate of array Y is calculated with a fixed length. When its value is below 0.1, MLD is taken as the threshold.
where k = (m × n)/l, l represents fixed length, V is the size of the array, and m × n is the total length.
• Adaptive HF Information Lifting Coefficient: Adaptive HF information lifting coefficient C (j, k) depends on MLD and fitting function Y1. Considering the fitting coordinates, Y1 is calculated as in Eq. (4) [28]:
where, α1 and α2 are the coefficients. Considering Y1, C (j, k) is calculated by Eq. (1):
• Gradient Re mapping Image Enhancement: The localized information of the gradient of the image is expressed as in Eq. (6) [28]:
where P (j, k), θ, and δ represent pixels of the source image, rows, and columns of g1, respectively.
Remapping g1 with C (j, k) and Y2 gives local template g2. The ranges of g1 and Y2 are (−1 to 1). The mapping function is 1 for better enhancement. The following relation represents these details:
The higher the value, the greater the enhancement. X (θ, δ) is the variable, and g2 is obtained by Eqs. (7) and (8) [28]:
The enhanced image is obtained by convoluting
3.2.2 LP Multi-Scale Decomposition
The Laplacian pyramid performs LSI and its decomposition. The LP decomposition algorithm is [28]:
where,
DGR separates the complementary and redundant HSI information. DGR decomposes HSI into images that are overlapping and non-overlapping. DGR uses global HSI decision graphs. The redundant information is separated into overlapping images by the first classifier, m5. Correspondingly, in the image of the non-overlapping domain, the second classifier (m6) stores complementary information.
3.3 Late Fusion (Feature Fusion)
Fusing feature sets is the procedure of concatenating a set of feature vectors to acquire a unique, robust descriptor, which provides more representative and relevant information than the input. It is worth noting that this fusion causes the problem of high dimensionality and can degrade the classification performance due to the “curse of dimensionality”. CCA is a learning scheme for calculating the linear relationship between two multidimensional variables, which seeks the projection by maximizing the correlation between two types of features. CCA is a multi-view feature fusion approach that aims to exploit and extract relevant features from different views. This step aims to fuse the previously extracted features to produce more informative discriminative features between the tested groups. For this purpose, the CCA-based feature fusion technique is used because it finds the associations between two sets of variables [29]. Obtaining the linear combinations helps discover this association that consequently enlarges the correlation between the two variable sets. Note that due to the different scales of the extracted features, each feature is normalized in the range [0 − 1] using Eq. (12) before fusing the features using the CCA technique.
Feature extraction defines a collection of data that can affect the performance of a classification model. An expert approach is used in traditional machine learning to extract a vector of features based on a certain domain. This preprocessing became inherent to the classification algorithm, extracting vectors from abstracts with DL. DL models are used in medical imaging systems to extract features automatically as pre-trained networks [30,31]. After several layers are removed, a pre-trained neural network is transformed into a feature extraction method. This modified network is used to configure a learning transfer procedure. Transfer learning enhances a new ML problem by transferring knowledge from a previously perfected equivalent task [32].
VGG16 [33] is the pre-trained CNN architecture utilized in this article to extract the feature. VGG16 architecture was introduced in 2014 by Karen Simonyan and Andrew Zisserman. AlexNet’s successor is VGG. VGGNet-16, as shown in Fig. 4, is made up of five convolutional and pooling layer blocks. Each of the first two blocks has two convolutional layers, followed by a max pooling layer. In comparison, the next three blocks each have three convolutional layers, followed by a max pooling layer. The 16 in VGG16 refers to the 16 weighted layers. It is built with a 16-layer network that includes convolutional and fully linked layers. It comprises 13 convolutional layers, two fully connected layers, and 1 SoftMax classifier layer. The convolutional layers’ filter dimension is 3 × 3 with a fully connected (Dense) layer of the VGG16. This layer extracts features by returning a feature vector of 4,096 dimensions for each image [32].

Figure 4: Pre-trained feature extraction VGG16
A crucial stage in the process of pattern recognition and visualization is feature extraction, which is the process of converting the data into numerical values. This crucial phase helps the model identify better accuracy. The processing becomes easier as a result. The most important characteristic of these massive data sets is that they contain many different variables. Large amounts of data can be extracted using the VGG16 feature extraction model, which also produces accurate findings and explores more features than traditional features because it depends on more layers for feature extraction. One of the most well-liked methods for extracting image features performs best when used as an aid in classification tasks. Consequently, feature extraction has been chosen to use the VGG16 model in the suggested work. The images have been input into the first layer of the VGG16 network for feature extraction. After that, the images go through several convolutional layers. The image is transmitted through the initial stack of two convolutions with a receptive area of 3 × 3 after the ReLU activation functions. There are 64 filters on each of these layers. While the stride value is always set to 1, the padding is always maintained at 1 pixel. This architecture maintains the full spatial resolution, and the output activation dimensions are the same as the source images. Since the window size is 2 × 2, the activations are routed to the pooling layer with a stride value of 2 pixels. After that, the size of the activations is reduced by half. The output is additionally transmitted to the convolutional layers in the second stage, which is passed on to the pooling layer and produces the output image. The convolutions and pooling layer’s final step are reached by continuing this process. After a stack of convolutions, a flattening layer is utilized between the three completely connected layers.
After features extraction, the calculated features contain useful information with strong representations and redundant information. Selecting a meaningful description of the input data and eliminating redundant components to achieve a compact data expression is a specific task in classification problems. PCA is a common dimension reduction technique. The main idea of PCA is to perform an orthogonal transformation to the basis of correlation eigenvectors and project them into the subspace expanded by the eigenvectors corresponding to the largest eigenvalues [34].
The proposed system based on VGG16 with XGB on AD images will be detailed in depth in this section. The VGG16 plays a critical role in extracting all the key features from an image. This pre-trained network was chosen to enable a more in-depth exploration of all pixels inside an image. The work’s final stage involves using XGB to train all extracted features. XGB, a highly effective and scalable ML technique for tree boosting, has been widely used in various domains to obtain state-of-the-art outcomes on a wide range of data difficulties. Since it was developed by Tianqi Chen et al., several key system and algorithmic optimizations have been made. Among these is a novel tree-learning approach, a theoretically justified weighted quantile sketch procedure, and parallel and distributed computing. As an ensemble learning technique, tree boosting converts many weak classifiers into a single strong classifier, resulting in a more accurate classification procedure [9].
The proposed system focus on constructing an AD CAD expert system with CNN (VGG16) and XGB. This section of the proposed system is separated into two subsections: evaluation metrics and results. In the section on evaluation metrics, the performance measures used are detailed in depth. In the results subsection, we introduce the outcomes of our proposed system and the entire suggested system on the dataset. Then, the system compares our proposed framework system to numerous state-of-the-art ML techniques in classification. The system uses a variety of performance measurements to present some tables to address the main idea. Also, the system shows an analytical comparison in the results subsection between the proposed system and different techniques.
The Alzheimer’s Disease Neuroimaging Initiative (ADNI) database [35] was employed for this work. The ADNI was founded in 2003 as a public-private partnership led by principal investigator Dr. Michael W. Weiner. ADNI’s primary goal has been to determine whether serial MRI, PET, other biological markers, and clinical and neuropsychological tests may be utilized to track the progression of MCI and early AD. The ADNI study was divided into three phases, which began in 2004, 2009, and 2011. ADNI-1 examined 800 participants, and each subsequent phase included new patients and patients who chose to continue participating in the research from the prior phase.
Data Acquisition. In this step, all training data from the ADNI dataset are collected in 2D, T1w MRI, and PET. DICOM-formatted medical image descriptors such as Coronal, Sagittal, and Axial are provided. The dataset includes 300 individuals separated into four categories. Each class comprises 75 patients and a total of 21 images and 816 scans. There are 5,764 images in the AD class, 5,817 in the EMCI class, 3,460 in the LMCI class, and 6,775 in the NC class. All medical data were retrieved in the 2D format of size 256 × 256 pixels.
Performance evaluation metrics are used to measure the classification model’s performance and investigate how a model works well to achieve the goal. The test dataset uses performance evaluation metrics to estimate the classification model’s performance and effectiveness, choosing the correct metrics. It is essential to evaluate the model performance, such as accuracy, sensitivity, and specificity. The proposed framework system utilized three different metrics to measure the performance, i.e., sensitivity (SEN), specificity (SPE), and accuracy [36]. The proposed framework takes into account different conditions. The experimental results are evaluated in terms of performance metrics: accuracy, recall, Specificity, and True Positive Rate (Sensitivity).
Results: Hyperparameter selection plays an essential role in fitting modern supervised ML algorithms. It controls the complexity and topology of the algorithms. Therefore, hyperparameters must be selected carefully before fitting ML models to a data set. People generally explain the hyperparameter importance based on understanding the machine learning algorithms and rank the importance by experience. However, this is not convincing, and the hyperparameter importance should not be universal. For example, the maximum depth of a decision tree model should be important when the data have interaction effects. Still, its importance is negligible if the data comes from an additive model. The settings of the classifiers were optimized to achieve the final results: for DT, the maximum depth of a tree was 2. For RF, the best number of trees was 60; for SVM, the maximum depth was 4, and the kernel gamma was 0.01. Also, all parts of the proposed system are implemented using the python language. The proposed system is developed on an i7/2.6 GHz processor and 8 GB RAM.
In Table 3, the MRI was used. In the evaluation and comparison of the approaches, four performance metrics are used. Also, as shown in Table 3, the PET image was used. The results also show that the proposed architectures are appropriate for fused images.

This section presents a comprehensive framework for the early detection of AD. This work uses five techniques: NB, DT, RF, SVM with linear kernel, and XGBoost. The hyperparameter of techniques presented for the classification algorithm is performed to induce classifiers. In the evaluation and comparison of the approaches, four performance measures are used. The results show that the proposed framework is appropriate. They also obtain a very promising accuracy of 98.06% for 2D multi-class AD stage classifications. As shown in Table 3, five classifiers are performed. The results describe that the proposed model is superior to NB, DT, RF, and SVM, with 98.06% accuracy in the case of CNN (VGG16). Also, the results describe that the proposed model is superior to the five ML techniques used in this chapter, with 96.98% accuracy in the case of using DWT.
Fig. 5 shows the results of the receiver operating characteristic (ROC) curves for five different classifiers. A ROC curve for the proposed work and comparison with other classifiers can be seen. The proposed system in cases of pre-trained VGG-16 and XGB has a higher ROC curve compared to Fig. 5, which is based on DWT as a feature extractor.

Figure 5: Comparison between (A) ROC curve for the performance evaluation of the proposed framework system using DWT and (B) ROC curve for the performance evaluation of our framework system using pre-trained VGG-16
Table 4 shows that CCA is used to fuse features after extraction from MRI, and PCA performs PET images using VGG16 and reduces features. In Table 3, our proposed framework achieved the highest ACC with 99.22%. In the evaluation and comparison of the approaches, four performance measures are used. The results show that the proposed framework is appropriate. They also obtained a promising accuracy of 99.22% compared to other techniques, as presented in Table 4. Also, the system compares VGG16 feature extraction and DWT, where VGG16 in our proposed work is superior to DWT.

Fig. 6 shows that the proposed system compares five ML techniques in the case of using single modality image MRI and PET. Each of them shares in the process of classification separately. Also, the early fusion between two modalities of MRI and PET images is performed using LRD. In comparison, late fusion is performed between two modalities of MRI and PET images using feature fusion CCA. The results show that the proposed framework based on pre-trained VGG16 and late fusion using CCA is superior to using a single modality and early fusion using LRD with ACC 99.22%, Spec. 96.54%, Sens. 99.54%, and DSC 99.67%. Also, Computational complexity is used to measure the computational difficulty of a mathematical function. There are two types of complexity: Time complexity, which is the amount of time it takes a given sequence of operations, and space complexity, which is the amount of memory needed for a given sequence of operations. The Computational Complexities of different ML Models as the following. First, the Computational Complexities time for KNN in the train is time complexity = O(k * n * m), while test time Complexity = O(n * m), and space complexity = O(n * m). Second, SVM train time complexity = O(n^2), while test time complexity = O(n′ * m), and space complexity = O(n * m). Third, DT train time complexity = O(n * log(n) * m), while test time complexity = O(m), and space complexity = O (depth of the tree). Finally, RF train time complexity = O(k′ * n * log(n) * m), Test Time Complexity = O(m * k′), and Space Complexity = O (k′ * depth of tree). NB Training Time Complexity = O(n * m), Test Time Complexity = O(m), Run-time Complexity = O(c * m). Where n = number of training examples, m = number of features, n′ = the number of support vectors, k = number of neighbors, k′ = the number of trees.
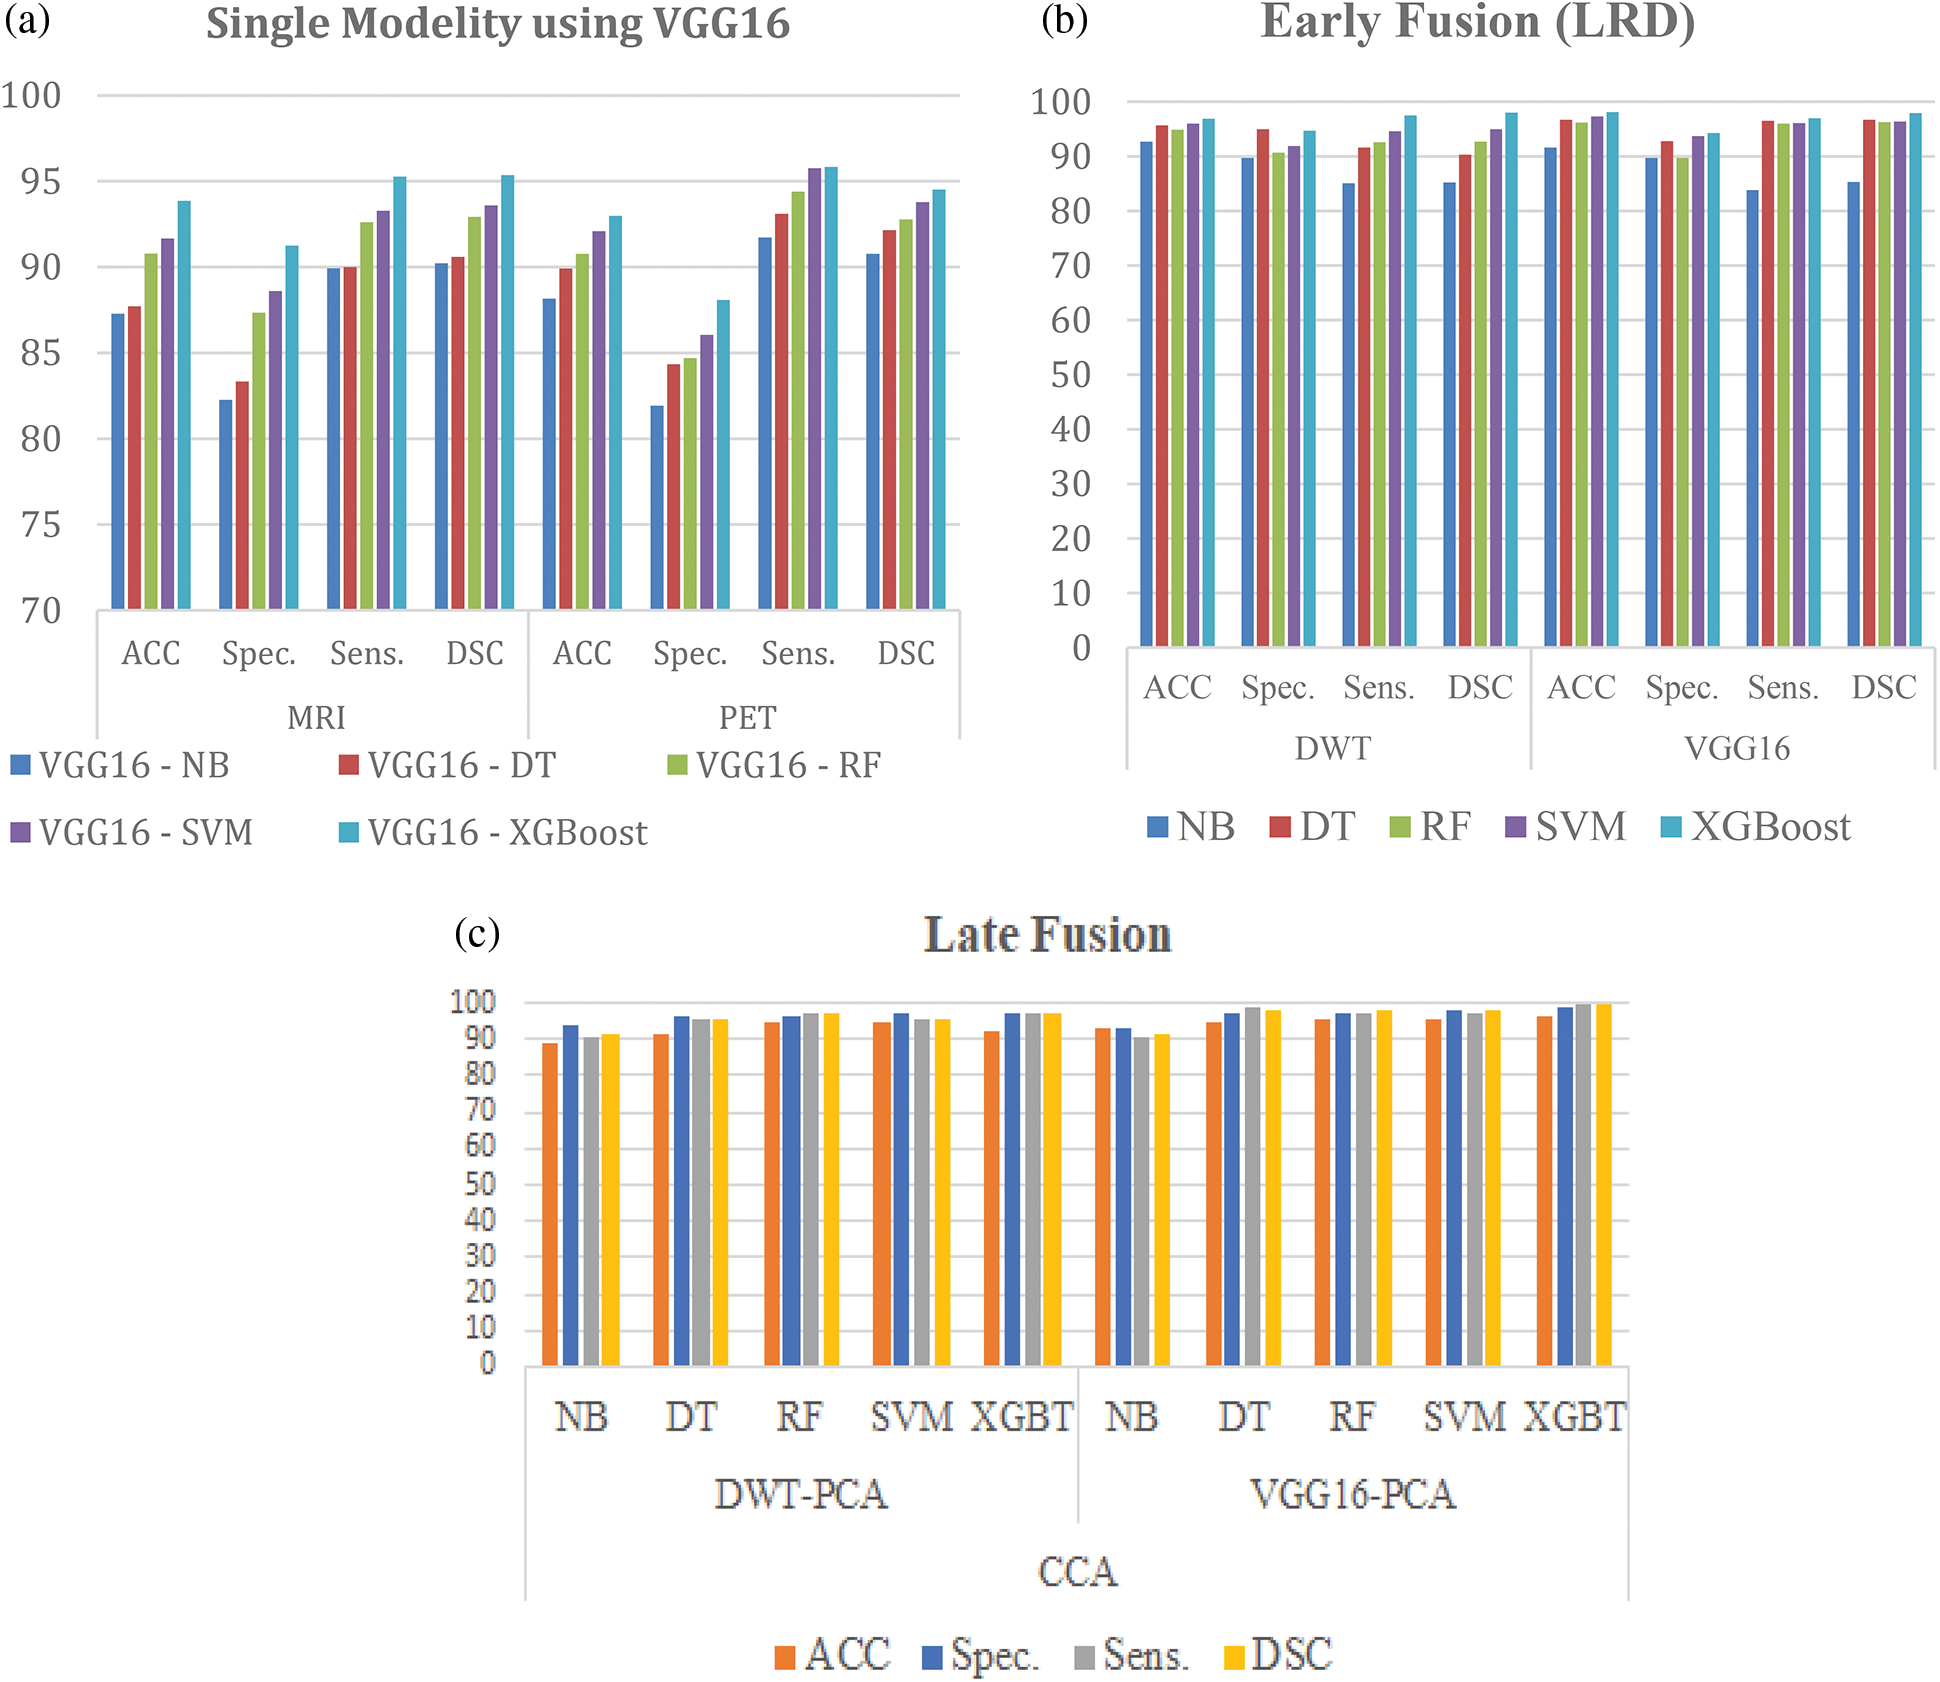
Figure 6: Comparison between (a) Single modality image, (b) Early fusion (LRD), and (c) Late fusion (CCA)
In Table 3, a comparison is made between the proposed framework and state-of-the-art models. Table 4 compares the medical image multiclass of AD stages classification. The proposed framework obtained the highest accuracy of 98.06%. Sahumbaiev et al. [39] obtained the second-highest accuracy of 88.31%, Helaly et al. [42] achieved the third-highest accuracy of 97%, and the lowest accuracy was achieved by Ruiz et al. [41]. Therefore, from the empirical results, the proposed framework has been demonstrated to consist of appropriate simple structures that reduce computing complexity and overfitting. It also demonstrates highly promising multi-class classification accuracy. Table 5 shows a comparison of the proposed framework with the state-of-the-art models.

The proposed system identifies this variability and differentiates between NC and MCI groups according to the imaging variability and variable neuropathology during AD progression. The model is based on a nontraditional feature extraction technique, VGG16. The VGG16 feature extraction model can extract a huge amount of data and results in good accuracy. It is one of the most popular image feature extraction techniques, which performs better if any DL model is applied for classification tasks. Hence, the VGG16 model has been chosen for feature extraction in the proposed work. The VGG16 model is implemented using fused MRI and PET scans. Various layers are utilized in the complete architecture of the proposed models’ designs to extract features. After the feature extraction step, the extracted features were given to the ensemble classifier, which classified the result into four categories: NC, EMCI, LMCI, and AD. The VGG16 contains 16 layers: convolution, input, dense, pooling, and output. Then a comparison was conducted with the proposed framework presented in Tables 3 and 4 with the comparison results. The XGB based on VGG16 as a feature extractor presented yields better results than other classifiers, compared to Tables 3 and 4. The proposed framework system enabled the study groups to succeed in providing discrimination power. Therefore, the proposed system presented superior results to the other classifiers. A high-bias classifier has proven that the DT has been prone to overfitting. This fact about DT can explain the RF results, which can overcome the problem by building a number of DTs. Finally, it could provide high-performance results because NB showed good performance with small datasets and was not affected by overfitting. The proposed fusion data system helps determine NC, EMCI, MCI, and AD diagnosis.
Basheera et al. [43] presented an approach in which the grey matter is extracted from brain voxels and is classified using CNN. The grey matter is separated as a CNN input. A Gaussian filter is used to improve the voxel. The algorithm for skull stripping is also used to delete irrelevant tissues from enhanced voxels. Then, the hybrid-enhanced independent component analysis segments the voxels. They carried out clinical assessments and reached 90.47% accuracy with their approach.
In addition, Lin et al. [44] presented a method that has been validated on standardized MRI data. In leave-one-out cross-validations, this method obtains an accuracy of 79.9% and an AUC of 86.1%. While maintaining a good balance between sensitivity and specificity, their method outperforms other state-of-the-art methods in accuracy and AUC. The presented CNN-based method for the prediction of MCI-to-AD conversion using only MRI data shows great promise.
With the vast growth in processing power and improved development of DL tools, DL-based frameworks for predicting neurological illnesses have become attractive. The following list of difficulties and related future perspectives:
• The supervised architecture has limitations because producing label data requires a lot of work, it is hard to scale, and it is difficult to choose the right bias levels. Unsupervised learning is not typically a choice taken into account for image analysis. Unsupervised architecture, however, creates a data-driven decision support system using the dataset in addition to learning features from it. Thus, problems relating to medical imaging can be resolved using unsupervised deep architecture.
• It is still difficult to predict neurological problems in real-time using imaging data. However, stream processing has been introduced for using a parallel computing approach to process large amounts of data.
• Constructing a bias-free neuroimaging dataset is difficult since learning systems have a history of producing computational artifacts. The issue can be reduced by incorporating a sizable dataset into the model, researching the relationship between extracted features, and fine-tuning the model’s parameters.
In the early stages of AD, diagnosis is difficult for various reasons, including that the disease manifests differently in each individual. The proposed model uses Laplacian Re-Decomposition for image fusion to help in the early diagnosis of AD, using data from two modalities: MRI and PET, in association with XGB, to classify the fused imaging into three categories, NC, MCI, and AD. The results proved the improvement in the competitive performance of the method. The proposed framework was superior to NB, DT, SVM, and RF. Furthermore, the dataset is augmented using techniques with simple data augmentation. In the future, the integration between medical images and genetic data should be performed to build a comprehensive system for early AD detection. Second, the image segmentation phase should be applied to highlight Alzheimer’s features for early detection prior to AD stage classifications rather than working on the whole image. Finally, it is intended to employ advanced approaches for data augmentation.
Funding Statement: This research was supported by the MSIT (Ministry of Science and ICT), Korea, under the ICT Creative Consilience Program (IITP-2021-2020-0-01821), supervised by the IITP (Institute for Information & communications Technology Planning & evaluation), and the National Research Foundation of Korea (NRF) grant funded by the Korea government (MSIT) (No. 2021R1A2C1011198).
Author Contributions: Conceptualization, HA and ME; methodology, HA, HS, S. E.-S., T. AD., and ME; formal analysis, HA, HS, and ME; investigation, HA, S. E.-S, T. AD., and ME; writing—original draft preparation, HA, HS, and ME; writing—review and editing, HA, T. AD., S. E.-S., HS, and ME; supervision, HS and ME; project administration, T. AD. and ME; All authors have read and agreed to the published version of the manuscript.
Conflicts of Interest: The authors declare that they have no conflicts of interest to report regarding the present study.
References
1. S. Gauthier, P. Rosa-Neto, J. A. Morais and C. Webster, World Alzheimer report 2021: Journey through the diagnosis of dementia, London, England: Alzheimer’s Disease International, Technical Report, pp. 1–314, 2021. [Google Scholar]
2. J. Albright and A. D. N. Initiative, “Forecasting the progression of Alzheimer’s disease using neural networks and a novel preprocessing algorithm,” Alzheimer’s & Dementia: Translational Research & Clinical Interventions, vol. 5, no. 1, pp. 483–491, 2019. [Google Scholar]
3. C. -C. Liu, T. Kanekiyo, H. Xu and G. Bu, “Apolipoprotein E and Alzheimer disease: Risk, mechanisms and therapy,” Nature Reviews Neurology, vol. 9, no. 2, pp. 106–118, 2013. [Google Scholar] [PubMed]
4. Y. Huang, J. Xu, Y. Zhou, T. Tong, X. Zhuang et al., “Diagnosis of Alzheimer’s disease via multi-modality 3D convolutional neural network,” Frontiers in Neuroscience, vol. 13, pp. 509, 2019. [Google Scholar] [PubMed]
5. L. Meng, X. Guo and H. Li, “Mri/ct fusion based on latent low rank representation and gradient transfer,” Biomedical Signal Processing and Control, vol. 53, no. 3, pp. 101536, 2019. [Google Scholar]
6. P. Ganasala and V. Kumar, “Multimodality medical image fusion based on new features in nsst domain,” Biomedical Engineering Letters, vol. 4, no. 4, pp. 414–424, 2014. [Google Scholar]
7. X. Li, X. Guo, P. Han, X. Wang, H. Li et al., “Laplacian redecomposition for multimodal medical image fusion,” IEEE Transactions on Instrumentation and Measurement, vol. 69, no. 9, pp. 6880–6890, 2020. [Google Scholar]
8. Y. Liu, S. Liu and Z. Wang, “A general framework for image fusion based on multi-scale transform and sparse representation,” Information Fusion, vol. 24, no. 2, pp. 147–164, 2015. [Google Scholar]
9. A. P. James and B. V. Dasarathy, “Medical image fusion: A survey of the state of the art,” Information Fusion, vol. 19, no. 3, pp. 4–19, 2014. [Google Scholar]
10. T. Abuhmed, S. El-Sappagh and J. M. Alonso, “Robust hybrid deep learning models for Alzheimer’s progression detection,” Knowledge-Based System, vol. 213, no. 4, pp. 106688, 2021. [Google Scholar]
11. Y. Yang, Y. Que, S. Huang and P. Lin, “Multiple visual features measurement with gradient domain guided filtering for multisensor image fusion,” IEEE Transactions on Instrumentation and Measurement, vol. 66, no. 4, pp. 691–703, 2017. [Google Scholar]
12. X. Ren, H. Guo, S. Li, S. Wang and J. Li, “A novel image classification method with CNN-XGBoost model.” In: C. Kraetzer, Y. Q. Shi, J. Dittmann, and H. Kim (Eds.) Digital Forensics and Watermarking. IWDW 2017. Lecture Notes in Computer Science, vol. 10431, Magdeburg, Germany, Cham: Springer, 2017. https://doi.org/10.1007/978-3-319-6418 [Google Scholar] [CrossRef]
13. Y. Mu and H. F. Gage, “Adult hippocampal neurogenesis and its role in Alzheimer’s disease,” Molecular Neurodegeneration, vol. 6, no. 1, pp. 1–9, 2011. [Google Scholar]
14. J. Islam and Y. Zhang, “Brain MRI analysis for Alzheimer’s disease diagnosis using an ensemble system of deep convolutional neural networks,” Brain Informatics, vol. 5, pp. 1–14, 2018. [Google Scholar]
15. K. A. Johnson, N. C. Fox, R. A. Sperling and W. E. Klunk, “Brain imaging in Alzheimer disease,” Cold Spring Harbor Perspectives in Medicine, vol. 2, no. 4, pp. a006213, 2012. [Google Scholar] [PubMed]
16. M. Soui, N. Mansouri, R. Alhamad, M. Kessentini and K. Ghedira, “Nsga-ii as feature selection technique and adaboostclassifier for covid-19 prediction using patient’s symptoms,” Nonlinear Dynamics, vol. 106, no. 2, pp. 1453–1475, 2021. [Google Scholar] [PubMed]
17. E. Miranda, M. Aryuni and E. Irwansyah, “A survey of medical image classification techniques,” in 2016 Int. Conf. on Information Management and Technology (ICIMTech), Bandung, Indonesia, pp. 56–61, 2016. [Google Scholar]
18. G. Litjens, T. Kooi, B. E. Bejnordi, A. A. A. Setio, F. Ciompi et al., “A survey on deep learning in medical image analysis,” Medical Image Analysis, vol. 42, no. 13, pp. 60–88, 2017. [Google Scholar] [PubMed]
19. A. Khan and M. Usman, “Early diagnosis of Alzheimer’s disease using machine learning techniques: A review paper,” in 2015 7th Int. Joint Conf. on Knowledge Discovery, Knowledge Engineering and Knowledge Management (IC3K), vol. 1, pp. 380–387, 2015. [Google Scholar]
20. S. A. Hassan and T. Khan, “A machine learning model to predict the onset of Alzheimer’s disease using potential cerebrospinal fluid (CSF) biomarkers,” International Journal of Advanced Computer Science and Applications, vol. 8, pp. 124–131, 2017. [Google Scholar]
21. P. Lodha, A. Talele and K. Degaonkar, “Diagnosis of Alzheimer’s disease using machine learning,” in 2018 Fourth Int. Conf. on Computing Communication Control and Automation (ICCUBEA), Pune, India, pp. 1–4, 2018. [Google Scholar]
22. V. S. Rallabandi, K. Tulpule, M. Gattu and A. D. N. Initiative, “Automatic classification of cognitively normal, mild cognitive impairment and Alzheimer’s disease using structural MRI analysis,” Informatics in Medicine Unlocked, vol. 18, no. 2, pp. 100305, 2020. [Google Scholar]
23. M. Hassan, S. Ali, H. Alquhayz and K. Safdar, “Developing intelligent medical image modality classification system using deep transfer learning and LDA,” Scientific Reports, vol. 10, no. 1, pp. 1–14, 2020. [Google Scholar]
24. S. H. Wang, P. Phillips, Y. Sui, B. Liu, M. Yang et al., “Classification of Alzheimer’s disease based on eight-layer convolutional neural network with leaky rectified linear unit and max pooling,” Journal of Medical Systems, vol. 42, pp. 1–11, 2018. [Google Scholar]
25. T. M. Alam, K. Shaukat, W. A. Khan, I. A. Hameed, L. A. Almuqren et al., “An efficient deep learning-based skin cancer classifier for an imbalanced dataset,” Diagnostics, vol. 12, no. 9, pp. 2115, 2022. [Google Scholar] [PubMed]
26. L. Devnath, S. Luo, P. Summons, D. Wang and K. Shaukat, “Deep ensemble learning for the automatic detection of pneumoconiosis in coal worker’s chest X-ray radiography,” Journal of Clinical Medicine, vol. 11, no. 18, pp. 5342, 2022. [Google Scholar] [PubMed]
27. P. Kalavathi and V. S. Prasath, “Methods on skull stripping of MRI head scan images—A review,” Journal of Digital Imaging, vol. 29, no. 3, pp. 365–379, 2016. [Google Scholar] [PubMed]
28. X. Li, X. Guo, P. Han, X. Wang, H. Li et al., “Laplacian redecomposition for multimodal medical image fusion,” IEEE Transactions on Instrumentation and Measurement, vol. 69, no. 9, pp. 6880–6890, 2020. [Google Scholar]
29. F. El-Gamal, M. Elmogy, A. Mahmoud, A. Shalaby, A. E. Switala et al., “A personalized computer-aided diagnosis system for mild cognitive impairment (MCI) using structural MRI (sMRI),” Sensors, vol. 21, no. 16, pp. 5416, 2021. [Google Scholar] [PubMed]
30. P. Angelov and E. Soares, “Towards explainable deep neural networks (xDNN),” Neural Networks, vol. 130, no. 10, pp. 185–194, 2020. [Google Scholar] [PubMed]
31. Y. Pathak, P. K. Shukla, A. Tiwari, S. Stalin and S. Singh, “Deep transfer learning based classification model for COVID-19 disease,” IRBM, vol. 43, no. 2, pp. 87–92 2022. [Google Scholar] [PubMed]
32. A. A. M. Teodoro, D. H. Silva, M. Saadi, O. D. Okey, R. L. Rosa et al., “An analysis of image features extracted by CNNs to design classification models for COVID-19 and non-COVID-19,” Journal of Signal Processing Systems, vol. 6, no. 7, pp. 1–13, 2021. [Google Scholar]
33. M. J. Ramesh, D. R. Manavalan and D. K. M. Prabusankarlal, “Feature extraction of ultrasound prostate image using modified VGG-19 transfer learning,” Turkish Journal of Computer and Mathematics Education (TURCOMAT), vol. 12, pp. 7597–7606, 2021. [Google Scholar]
34. F. Yang, Z. Ma and M. Xie, “Image classification with superpixels and feature fusion method,” Journal of Electronic Science and Technology, vol. 19, no. 1, pp. 100096, 2021. [Google Scholar]
35. ADNI Dataset: http://adni.loni.usc.edu (Last accessed: 20-04-2022). [Google Scholar]
36. S. Raj and S. Masood, “Analysis and detection of autism spectrum disorder using machine learning techniques,” Procedia Computer Science, vol. 167, no. 12, pp. 994–1004, 2020. [Google Scholar]
37. A. Payan and G. Montana, “Predicting Alzheimer’s disease: A neuroimaging study with 3D convolutional neural networks,” arXiv preprint arXiv:1502.02506, 2015. [Google Scholar]
38. S. Sarraf and G. Tofighi, “Classification of Alzheimer’s disease structural MRI data by deep learning convolutional neural networks,” arXiv preprint arXiv:1607.06583, 2016. [Google Scholar]
39. I. Sahumbaiev, A. Popov, J. Ramı́rez, J. M. Górriz and A. Ortiz, “3D-CNN HadNet classification of MRI for Alzheimer’s disease diagnosis,” in 2018 IEEE Nuclear Science Symp. and Medical Imaging Conf. Proc. (NSS/MIC), Sydney, NSW, Australia, pp. 1–4, 2018. [Google Scholar]
40. C. Ge, Q. Qu, I. Y. -H. Gu and A. S. Jakola, “Multiscale deep convolutional networks for characterization and detection of Alzheimer’s disease using MR images,” in 2019 IEEE Int. Conf. on Image Processing (ICIP), Taipei, Taiwan, pp. 789–793, 2019. [Google Scholar]
41. J. Ruiz, M. Mahmud, M. Modasshir, M. S. Kaiser and Alzheimer’s Disease Neuroimaging Initiative, f.t., “3D DenseNet ensemble in 4-way classification of Alzheimer’s disease,” In: M. Mahmud, S. Vassanelli, M. S. Kaiser, and N. Zhong (Eds.) Brain Informatics. BI 2020. Lecture Notes in Computer Science, vol. 12241, pp. 85–96, Padua, Italy, Cham: Springer, 2020. https://doi.org/10.1007/978-3-030-59277-6_8 [Google Scholar] [CrossRef]
42. H. A. Helaly, M. Badawy and A. Y. Haikal, “Deep learning approach for early detection of Alzheimer’s disease,” Cognitive Computation, vol. 14, no. 5, pp. 1711–1727, 2021. [Google Scholar] [PubMed]
43. S. Basheera and S. S. M. Ram, “Convolution neural network-based Alzheimer’s disease classification using hybrid enhanced independent component analysis based segmented gray matter of t2 weighted magnetic resonance imaging with clinical valuation,” Alzheimer’s & Dementia: Translational Research & Clinical Interventions, vol. 5, no. 1, pp. 974–986, 2019. [Google Scholar]
44. W. Lin, T. Tong, Q. Gao, D. Guo, X. Du et al., “Convolutional neural networks-based MRI image analysis for the Alzheimer’s disease prediction from mild cognitive impairment,” Frontiers in Neuroscience, vol. 12, pp. 777, 2018. [Google Scholar] [PubMed]
Cite This Article
 Copyright © 2023 The Author(s). Published by Tech Science Press.
This work is licensed under a Creative Commons Attribution 4.0 International License , which permits unrestricted use, distribution, and reproduction in any medium, provided the original work is properly cited.
 Downloads
 Citation Tools