
 Submit a Paper
 Propose a Special lssue
 Open Access
ARTICLE

Automated Leukemia Screening and Sub-types Classification Using Deep Learning
1 Department of Computer Science, COMSATS University Islamabad, 44000, Pakistan
2 Electrical Engineering Department, College of Engineering, Najran University, Najran, 61441, Saudi Arabia
3 Control, Automotive and Robotics Lab, National Center of Robotics and Automation (NCRA HEC), Mirpur, Pakistan Mirpur University of Science and Technology (MUST), Mirpur, Pakistan
4 Department of Computer Science, Virtual University of Pakistan, Lahore, 54000, Pakistan
5 Department of Clinical Laboratory Sciences, College of Applied Medical Sciences, Najran University, Najran, 61441, Saudi Arabia
6 Department of Information Systems, College of Computer Science and Information Systems, Najran University, Najran, 61441, Saudi Arabia
7 Department of Medical Laboratory Technology, Faculty of Applied Medical Sciences, University of Tabuk, Tabuk, Saudi Arabia
8 Department of Clinical Laboratory Sciences, College of Applied Medical Sciences, Taif University, P.O. Box 11099, Taif, 21944, Saudi Arabia
* Corresponding Author: Chaudhary Hassan Abbas Gondal. Email:
Computer Systems Science and Engineering 2023, 46(3), 3541-3558. https://doi.org/10.32604/csse.2023.036476
Received 01 October 2022; Accepted 28 December 2022; Issue published 03 April 2023
 View Full Text
 Download PDF
Abstract
Leukemia is a kind of blood cancer that damages the cells in the blood and bone marrow of the human body. It produces cancerous blood cells that disturb the human’s immune system and significantly affect bone marrow’s production ability to effectively create different types of blood cells like red blood cells (RBCs) and white blood cells (WBC), and platelets. Leukemia can be diagnosed manually by taking a complete blood count test of the patient’s blood, from which medical professionals can investigate the signs of leukemia cells. Furthermore, two other methods, microscopic inspection of blood smears and bone marrow aspiration, are also utilized while examining the patient for leukemia. However, all these methods are labor-intensive, slow, inaccurate, and require a lot of human experience and dedication. Different authors have proposed automated detection systems for leukemia diagnosis to overcome these limitations. They have deployed digital image processing and machine learning algorithms to classify the cells into normal and blast cells. However, these systems are more efficient, reliable, and fast than previous manual diagnosing methods. However, more work is required to classify leukemia-affected cells due to the complex characteristics of blood images and leukemia cells having much intra-class variability and inter-class similarity. In this paper, we have proposed a robust automated system to diagnose leukemia and its sub-types. We have classified ALL into its sub-types based on FAB classification, i.e., L1, L2, and L3 types with better performance. We have achieved 96.06% accuracy for subtypes classification, which is better when compared with the state-of-the-art methodologies.Keywords
Leukemia is a kind of blood cancer that is caused due to the overproduction of white blood cells (WBCs) by the bone marrow [1–3]. The human body needs platelets and red blood cells (RBCs) to be healthy. However, the overproduction of white blood cells (WBCs) lowers the bone marrow’s ability to produce normal blood cells, which leaves a person prone to anemia and infections. The abnormal production of WBCs spreads and affects different body parts, like lymph nodes, kidneys, spleen, liver, etc. [4]. In 2019, according to the national cancer institute statistics, 61,780 people were diagnosed with leukemia in the United States (U.S.) [5].
In contrast, 22,840 people died due to leukemia in the same year. While in 2020, the national cancer institute estimated that till now, 60,530 people had been diagnosed with leukemia, and unfortunately, 23,100 people lost their lives. These statistics show an exponential increase in the death rate due to this deadly disease. Hence, timely leukemia diagnosis following different resources and strategies is essential for a successful treatment. The treatment of leukemia depends on whether it is acute or chronic. The nature of acute leukemia is dangerous because it forms rapidly and becomes drastic with time. In comparison, the latter’s growth is comparatively slower and takes a long time to advance.
Acute and chronic leukemia can be further classified into two different types, which are Lymphocytic or myelogenous, based on the type of infected WBC. It is classified as myelogenous if the anomalous cells are monocytes or granulocytes and lymphocytic if anomalous cells are lymphocytes [6]. Hence, forming four most common types of leukemia which are 1) Acute lymphocytic leukemia (ALL) [7], 2) Acute myeloid leukemia [8] (AML) 3) Chronic lymphocytic leukemia [9] (CLL), and 4) chronic myeloid leukemia [10] (CML). In this research work, we deal with the diagnosis of ALL, the most severe type of leukemia, and its timely treatment depends on its accurate diagnosis. ALL is concerned with the abnormal growth of leukocytes (WBCs). The abnormal blood cells spread into the human body and directly affect the immune system and suppress the further production of normal cells (red blood cells (RBCs)) and platelets and hence become a significant cause of anemia. As stated by the French American British (FAB) classification [11], ALL is classified into three primary subtypes names L1, L2, and L3. L1 types of leukemia consist of small blood cells of regular nuclear shape with homogeneous chromatic. Mostly, 25–30 percent of adults are diagnosed with L1 leukemia. The blood cells of L2 leukemia are more significant than L1 blood cells and have shape dissimilarity. The shape of these blood cells and cytoplasm is not regular.
While L3 cells are normal (larger than L1) sized blood cells with indistinguishable shapes and consist of oval nuclei. Different methods are considered for diagnosing leukemia, like bone marrow aspiration [12], in which a sample of liquid is taken from the bones to examine the sign of leukemia and microscopic examination of blood samples. By utilizing these methods, medical professionals can diagnose the patient with leukemia; however, most of the existing methods are labor-exhaustive, time-devouring, and require professional experience to diagnose cancer efficiently. Contrary to the manual diagnosing system, our automated system will tackle the effort and time required to do manual diagnosing. Moreover, it will diminish the burden on doctors and medical professionals and helps in achieving accurate results as compared to the standard diagnosing method. Despite significant advances in medical science, microscope-based blood smear image examination for leukemia diagnosis remains the standard and, therefore, a reasonable scheme for diagnosing leukemia. However, this scheme is not fast enough and requires much effort to check each blood cell while examining the blood samples manually. This method is labor-intensive, and hence it is prone to human error, which can have devastating effects on the treatment of a patient. Because leukemia demands early and accurate diagnosis, a robust and efficient automated system is needed to screen leukemia, which can help achieve fast and accurate results without any medical professional’s enervation. These automated systems will assist doctors in treating leukemia patients more systematically.
In this research work, our contributions are enumerated below:
1. A robust automated system to diagnose leukemia and its subtypes have been proposed.
2. Acute Lymphoblastic Leukemia has been classified into its subtypes, i.e., L1, L2, and L3, with better performance.
3. Compared to standard methods, an end-to-end learning system has been developed by fusing CNN-based features with a machine-learning classifier without segmentation.
4. As compared to standard machine learning methods, better accuracy has been achieved by our proposed system without any need for segmentation.
5. A detailed result comparison of different deep learning frameworks has been performed on our dataset.
The rest of the paper is organized as follows. Section 2 presents the related work on existing leukemia detection techniques. Section 3 includes our proposed methodology. The detailed results and comparison are given in Section 4. While Section 5 includes the conclusion and future work.
With the advancements in diagnostic research, many researchers have been focusing on diagnosing diseases using advanced machine-learning techniques. These methods can be fully or semi-automated considering the approach used [13–16]. In the existing literature, ALL detection is done using binary classification and the classification of ALL into its subtypes. We present a comparison of these studies in Table 1.
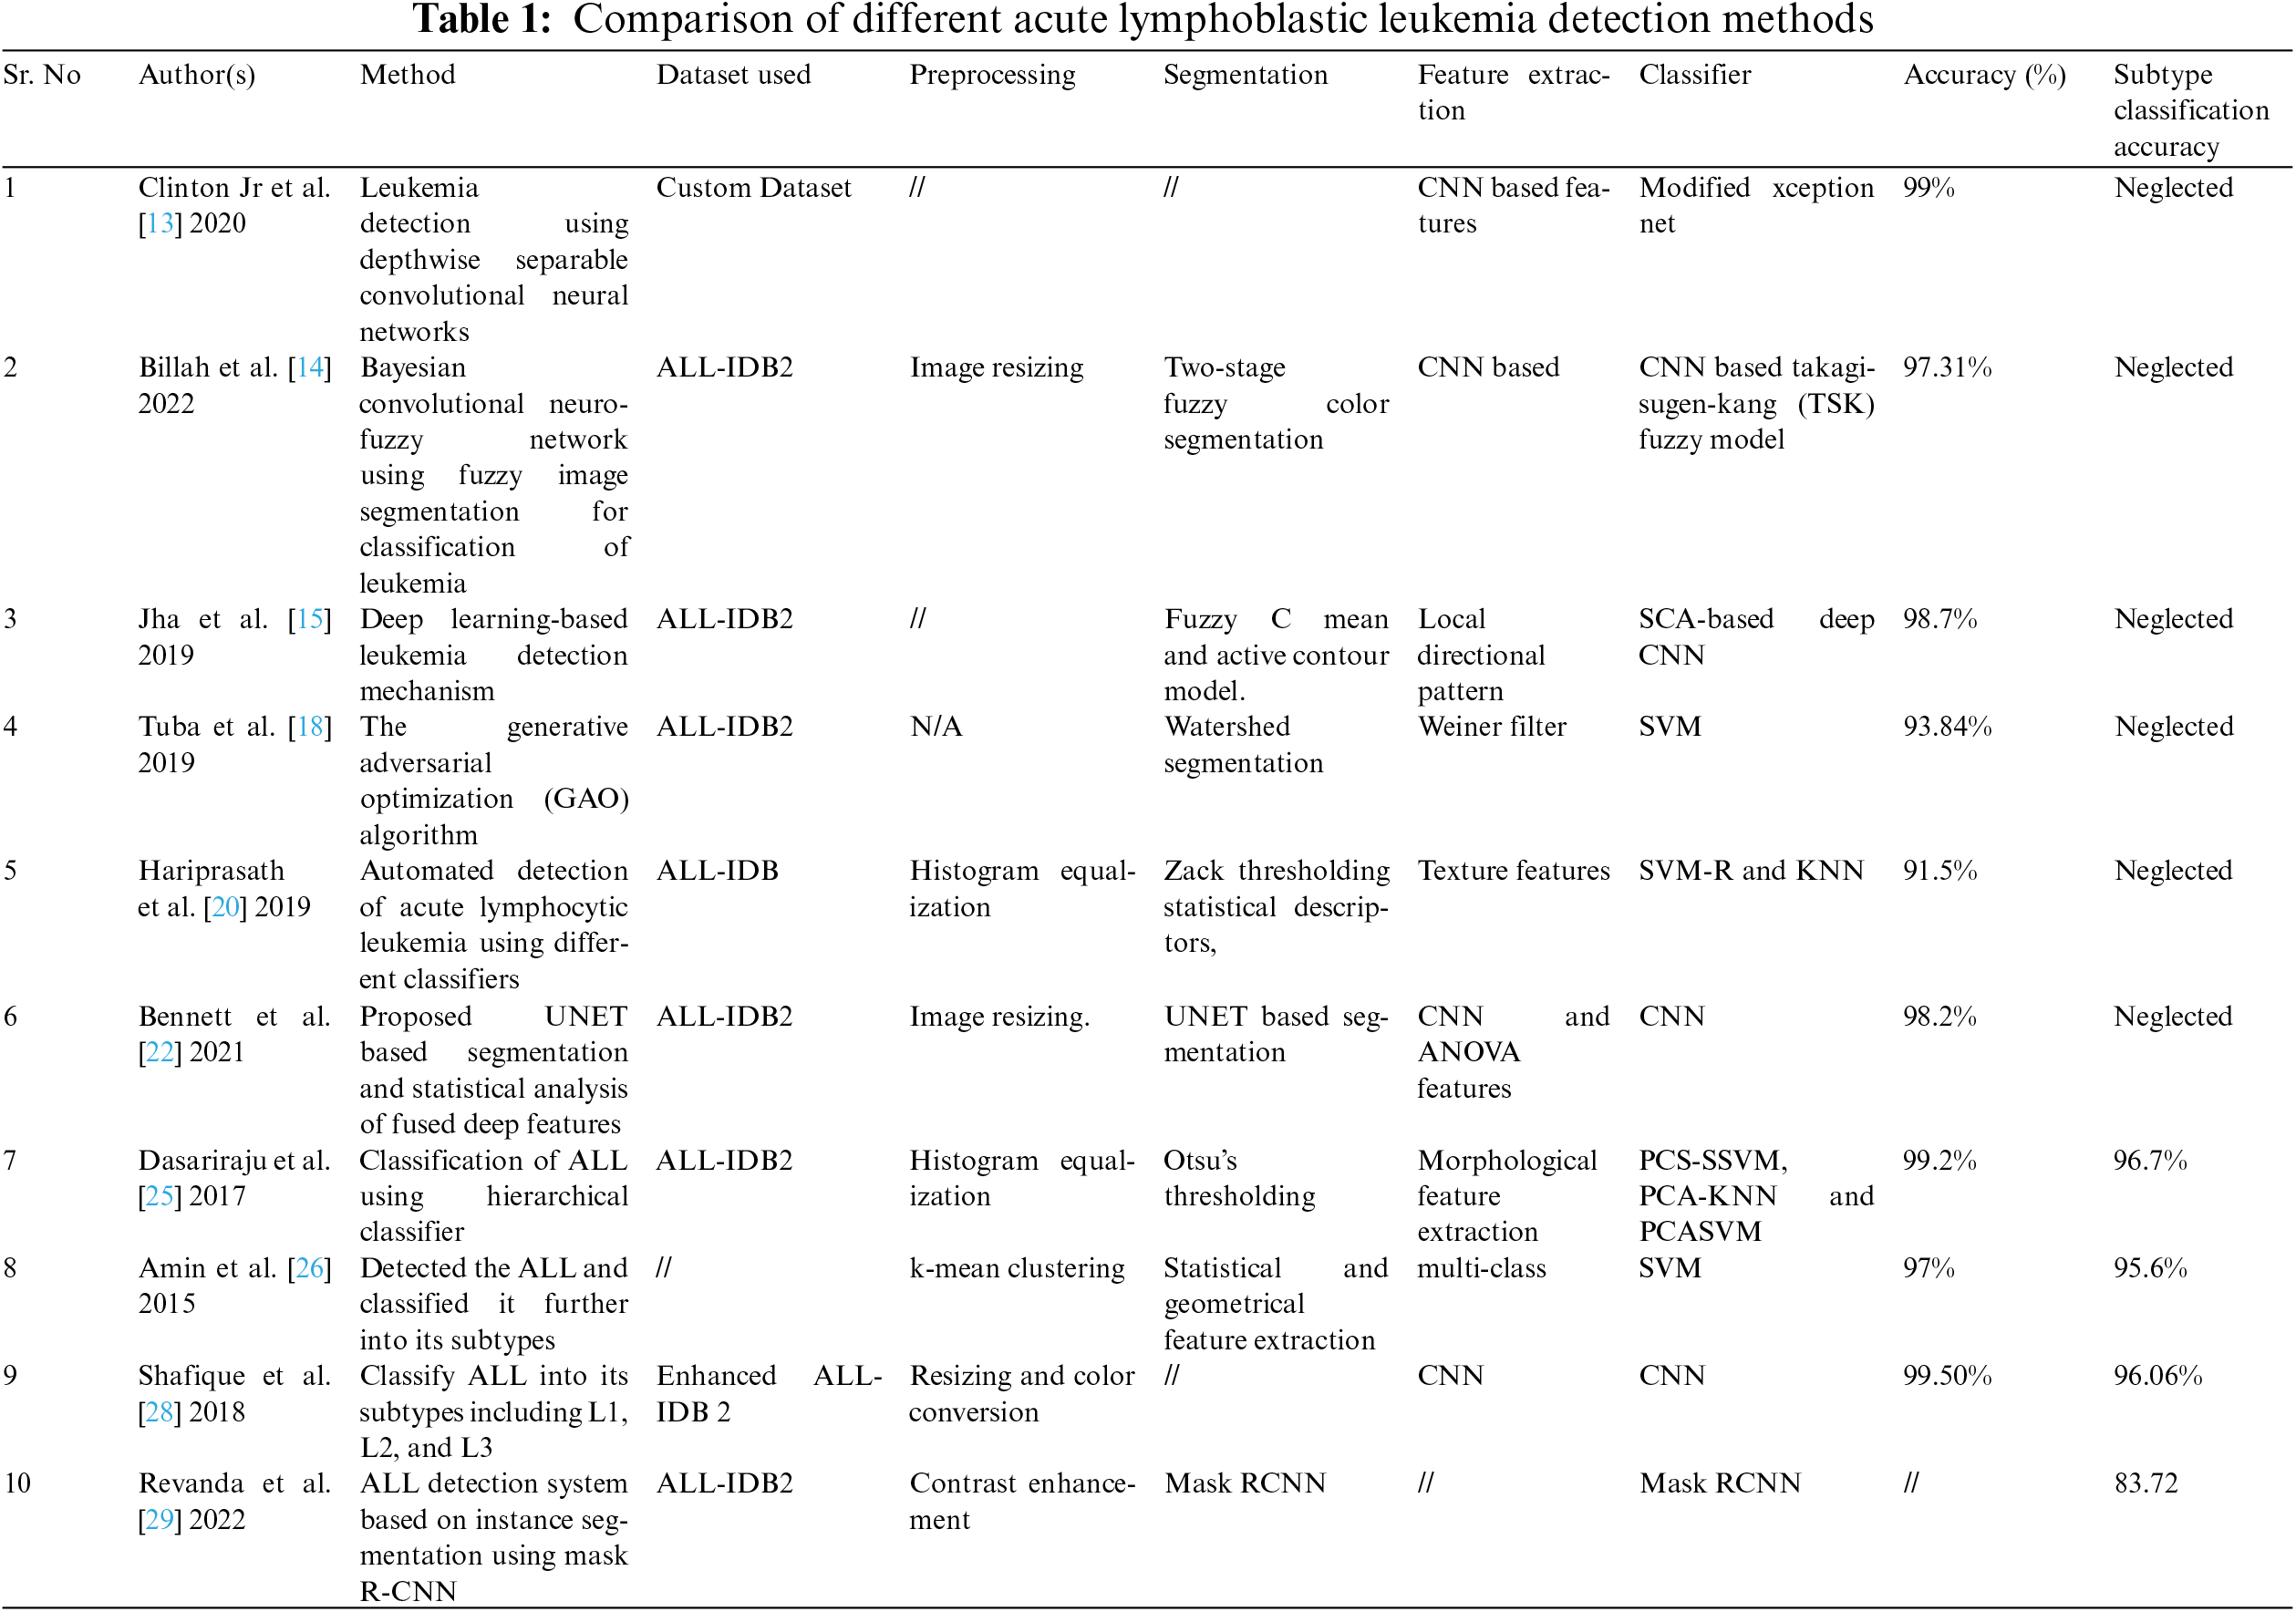
In our literature study, we have presented different machine-learning techniques which have been employed for the detection and classification of ALL cells. In the provided literature, we have presented different techniques and methods and discussed their pros and cons compared to the manual systems used to diagnose leukemia-affected cells. Compared to the manual ALL detection systems, the researchers have found computer-aided systems to be accurate, computationally efficient, and reliable. Table 1 has provided a detailed comparison of machine learning and deep learning techniques to diagnose ALL. The binary classification methods [15–27] presented in these research works do not consider ALL subtypes, which is very important for the accurate classification of ALL. In comparison, the studies considering the subtypes of ALL need to increase the classification accuracy by exploring a different combination of CNN and machine learning classifiers. Moreover, these methods need to be tuned to acquire more accurate results.
In this section, we provide a detailed methodology highlighting the main elements of this research work, as shown in Fig. 1.
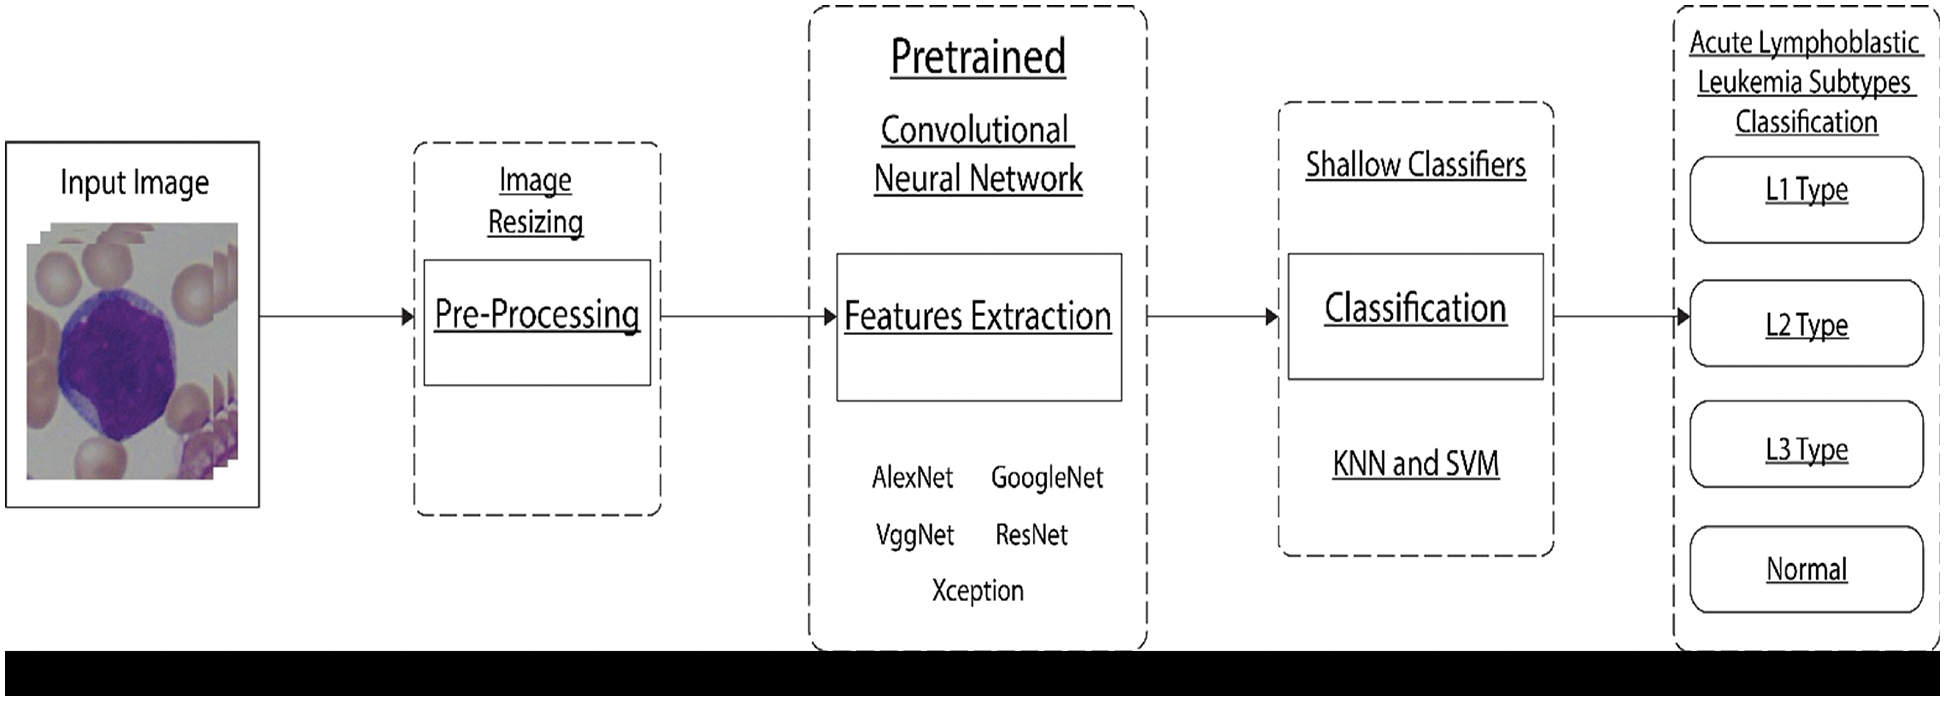
Figure 1: Proposed framework
We have utilized the enhanced ALL-IDB dataset, the improved version of the ALL-IDB dataset available online for the public [17]. The original dataset is split into two different versions, where the first version includes 108 images with multiple cells on a single image. From which 59 images are standard, whereas the remaining 49 images are from ALL affected patients. The resolution of images present in the first version of ALL IDB is 2592 × 1994. The second version of the dataset contains 260 images in which each image has a single cell that is either normal or ALL affected. The resolution of images present in the first version of ALL IDB is 2592 × 1994. In contrast, the second version has single-cell images of resolution 257 × 257 and 3 color channels. Different samples of images from the second version of ALL IDB are illustrated in Fig. 2. As we have seen in previous literature that subtypes of leukemia are mostly neglected while performing computer-aided diagnosing of leukemia. We have considered the subtype classification of ALL as per the French American British (FAB) technique [30]. They have classified leukemia-affected cells into three further subtypes, named L1 type, L2 type, and L3 type.
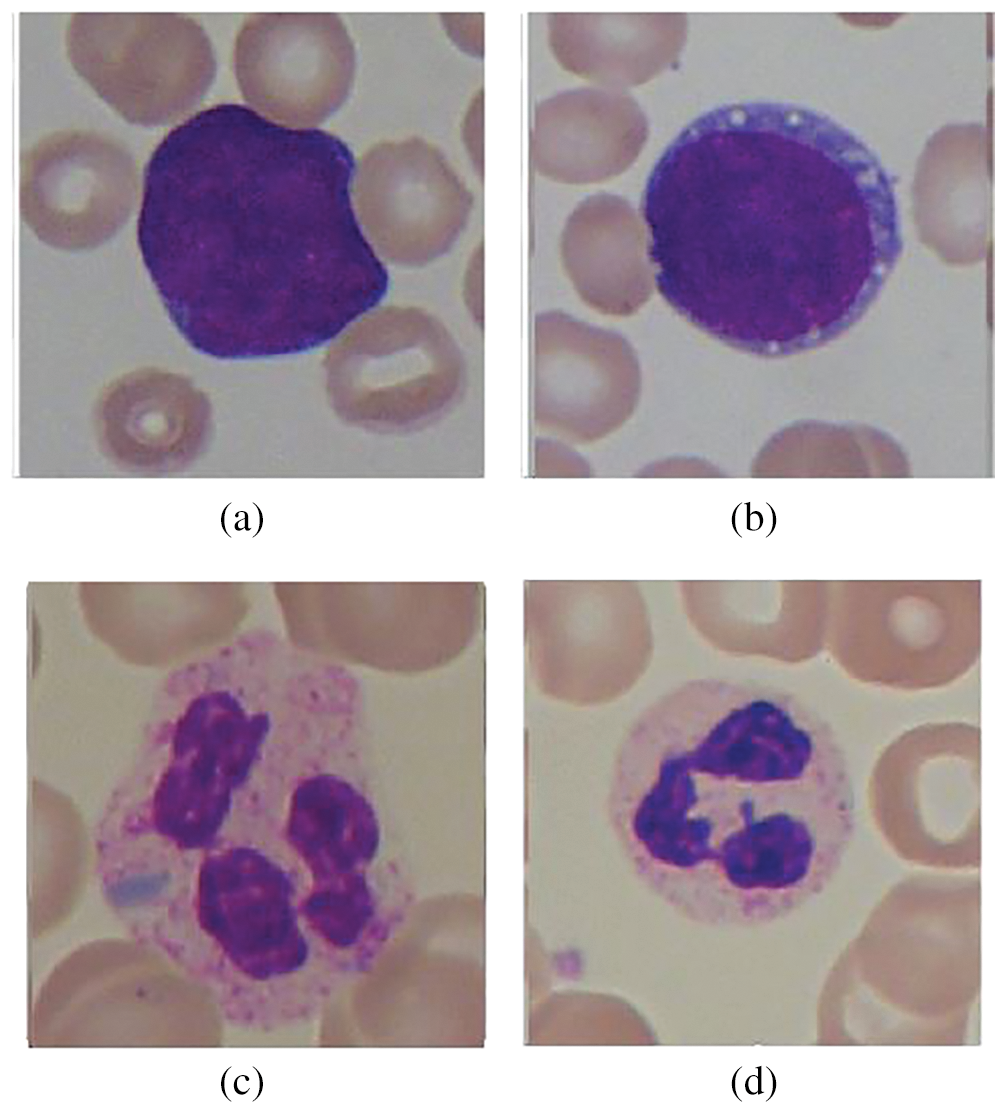
Figure 2: Samples from ALL-IDB dataset: (a) Leukemia cell, (b) Leukemia cell, (c) Normal cell, and (d) Normal cell
Samples from FAB-based classification are shown in Fig. 3. One of the main reasons to neglect these subtypes in previous literature is their complex visual features, as they have high inter-class similarity and intra-class variability. Due to these reasons, they are hard to classify compared to a simple binary classification of normal or affected cells. Hence, to tackle the subtypes classification problem, we have considered the enhanced version of the ALL-IDB-2 dataset, which has a single cell on each image. This dataset was already utilized by Shafique et al. [28], where each ALL-affected image has been labeled by an expert pathologist to its subtypes, i.e., L1 type, L2 type, and L3 type, as per FAB classification. This dataset is useful for classifying each image into leukemia subtype classification as this dataset was labeled and already utilized in the existing research. The selected dataset was split into training and evaluation sets with a split ratio of 70% for training and 30% for testing or evaluation.
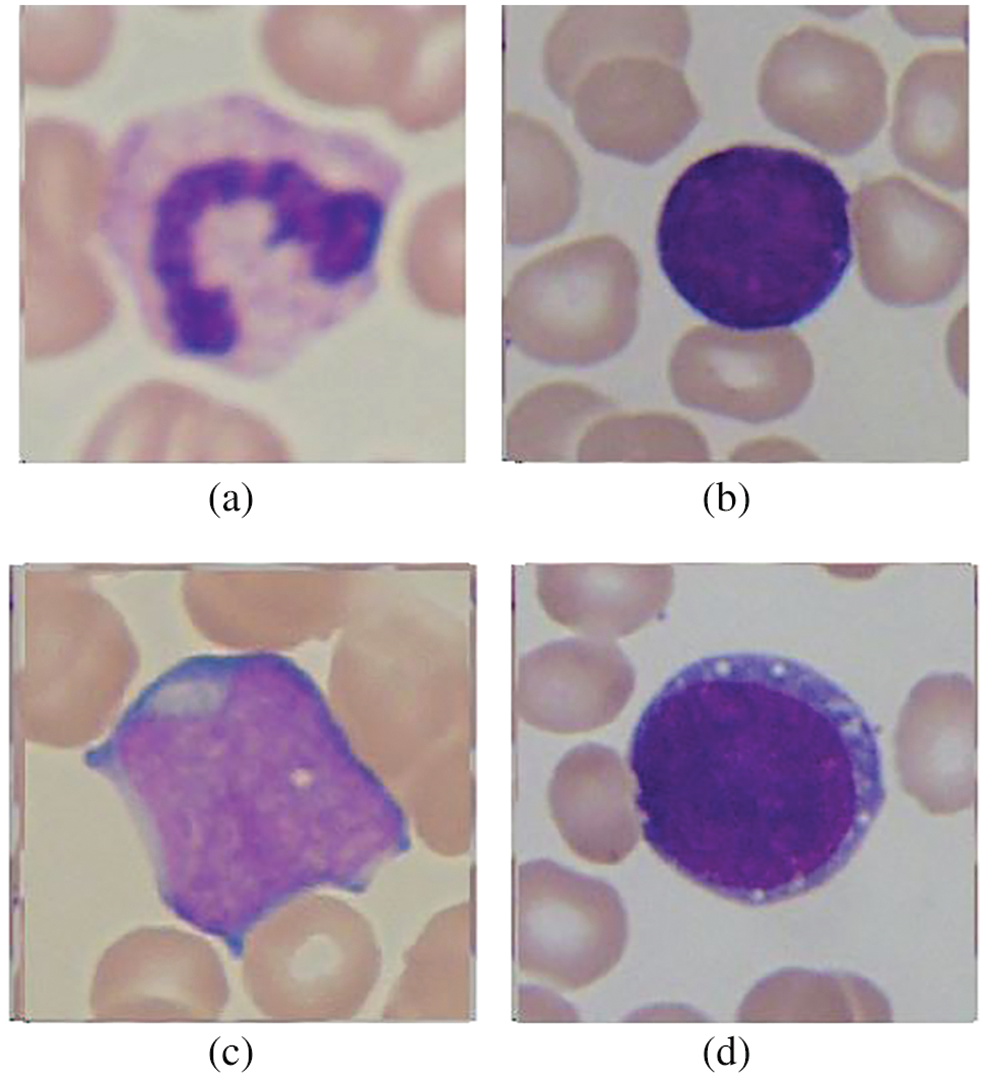
Figure 3: Subtypes classification according to FAB: (a) Normal cell, (b) L1 type cancer cell, (c) L2 type cancer cell, and (d) L3 type cancer cell
To achieve better accuracy, a smaller number of training samples should be avoided while performing model training because it may cause the model to overfit the data and not perform efficiently on unseen data. Therefore, to avoid overfitting problems and tackle fewer training samples data augmentation technique is applied over the training samples by performing rotation and mirroring of the images. Data augmentation is the most prevailing and straightforward technique to increase the training dataset without any expensive computation artificially. By applying this technique, the number of the training sample is considerably increased by 200%, which will help the model to attain better accuracy without overfitting. After data augmentation, the resultant images can be seen in Fig. 4.
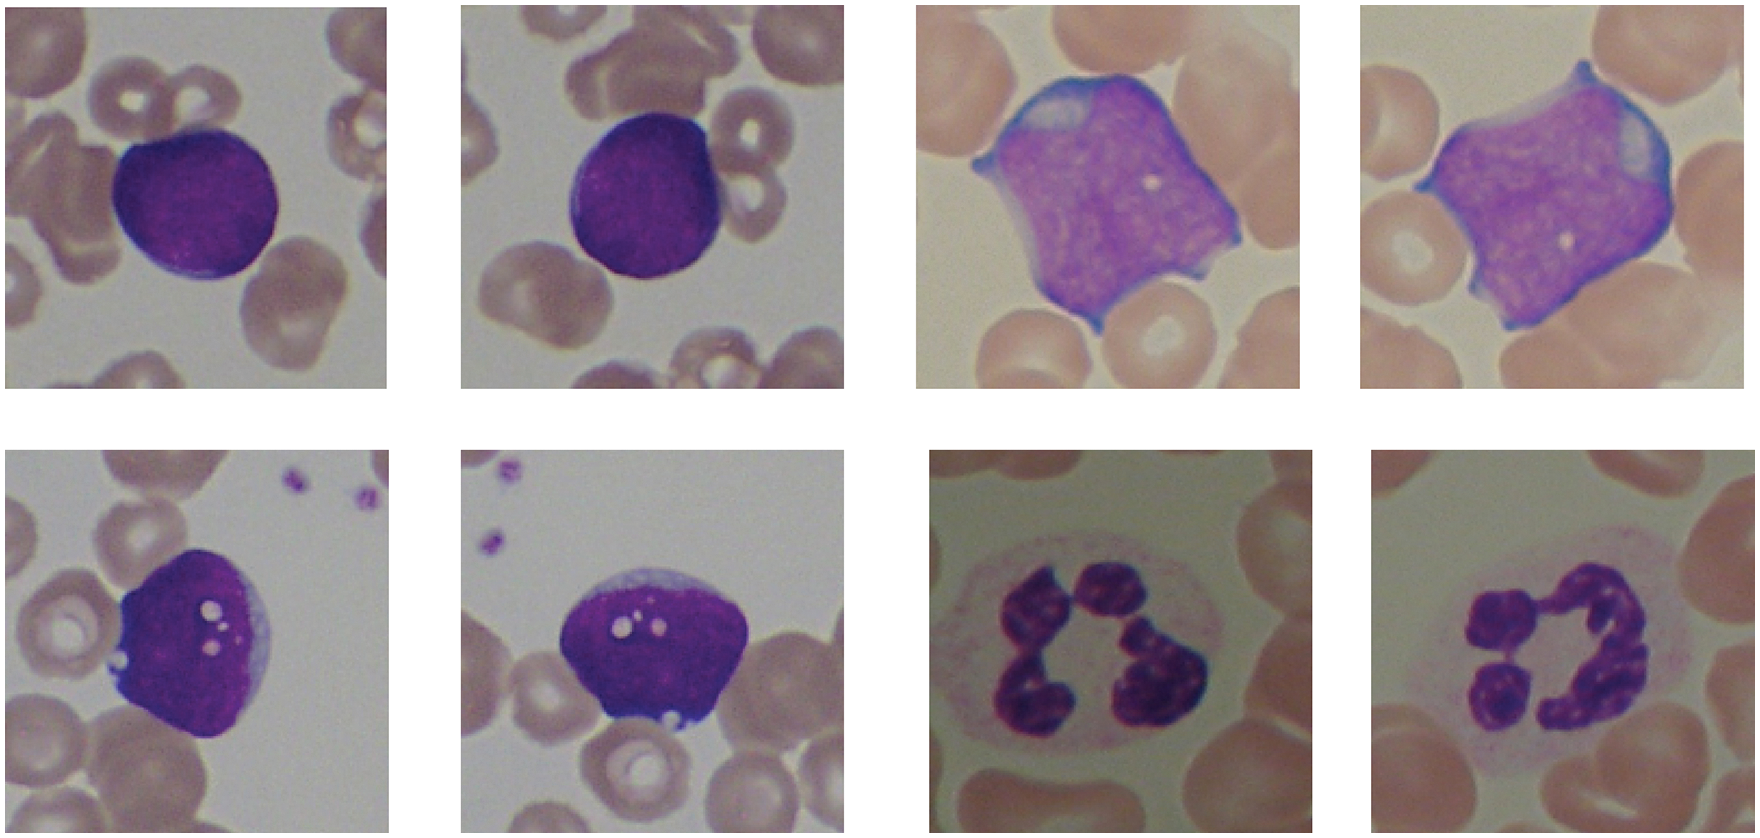
Figure 4: Image result after the data augmentation technique
ConvNets or CNN are widely used to perform image classification and object recognition tasks. They are becoming popular because they require lower preprocessing and no need for segmentation as compared to standard machine learning methods, which need to have manually engineered filters. CNN layers start from the input layer, which takes the image as input; after that number of convolution layers are used, which apply a different filter over those images to extract different features. These convolution layers are followed by an appropriate activation function that applies non-linear transformation over the images to generalize the features and add non-linearity to the network. There are lots of non-linear activation functions available, but the most widely used activation function is Rectified linear units (ReLU), which only output the function if it is positive; else, you will get a zero output. This activation function is shown in Eq. 1. Where f(x) is the function of input x which is input given to neurons.
Between convolutional layers of CNN, pooling layers are used, which significantly reduced the number of features and computation to avoid the chance of overfitting the data. Max pooling is the widely used layer in CNN which down-samples the data and increases the computation power of a CNN. The last fully connected layer is added, followed by softmax and classification layers responsible for classifying the images based on their respective features.
In this work, we have classified ALL by utilizing the concept of transfer learning. In transfer learning, a pre-trained CNN is employed as a feature extractor pre-trained on a large dataset with millions of images and high-level generic features for those natural images. These generic features will be useful for application to small datasets with the chance of better accuracy. This technique is computationally less expansive as compared to training CNN from scratch, which also requires a higher number of training images in the dataset. There are two different techniques for applying transfer learning, as mentioned by [25]. These are fine-tuning of the network and feature extraction from the last fully connected layer. In the fine-tuning of CNN, the high-level layers (which possess high-level features) are left freezing. Classification is carried out using softmax activation layers which output the probability of each class depending on the relevant features. In the second technique, the last fully connected layer of CNN is extracted. To perform the required classification, a machine learning classifier is applied to those features.
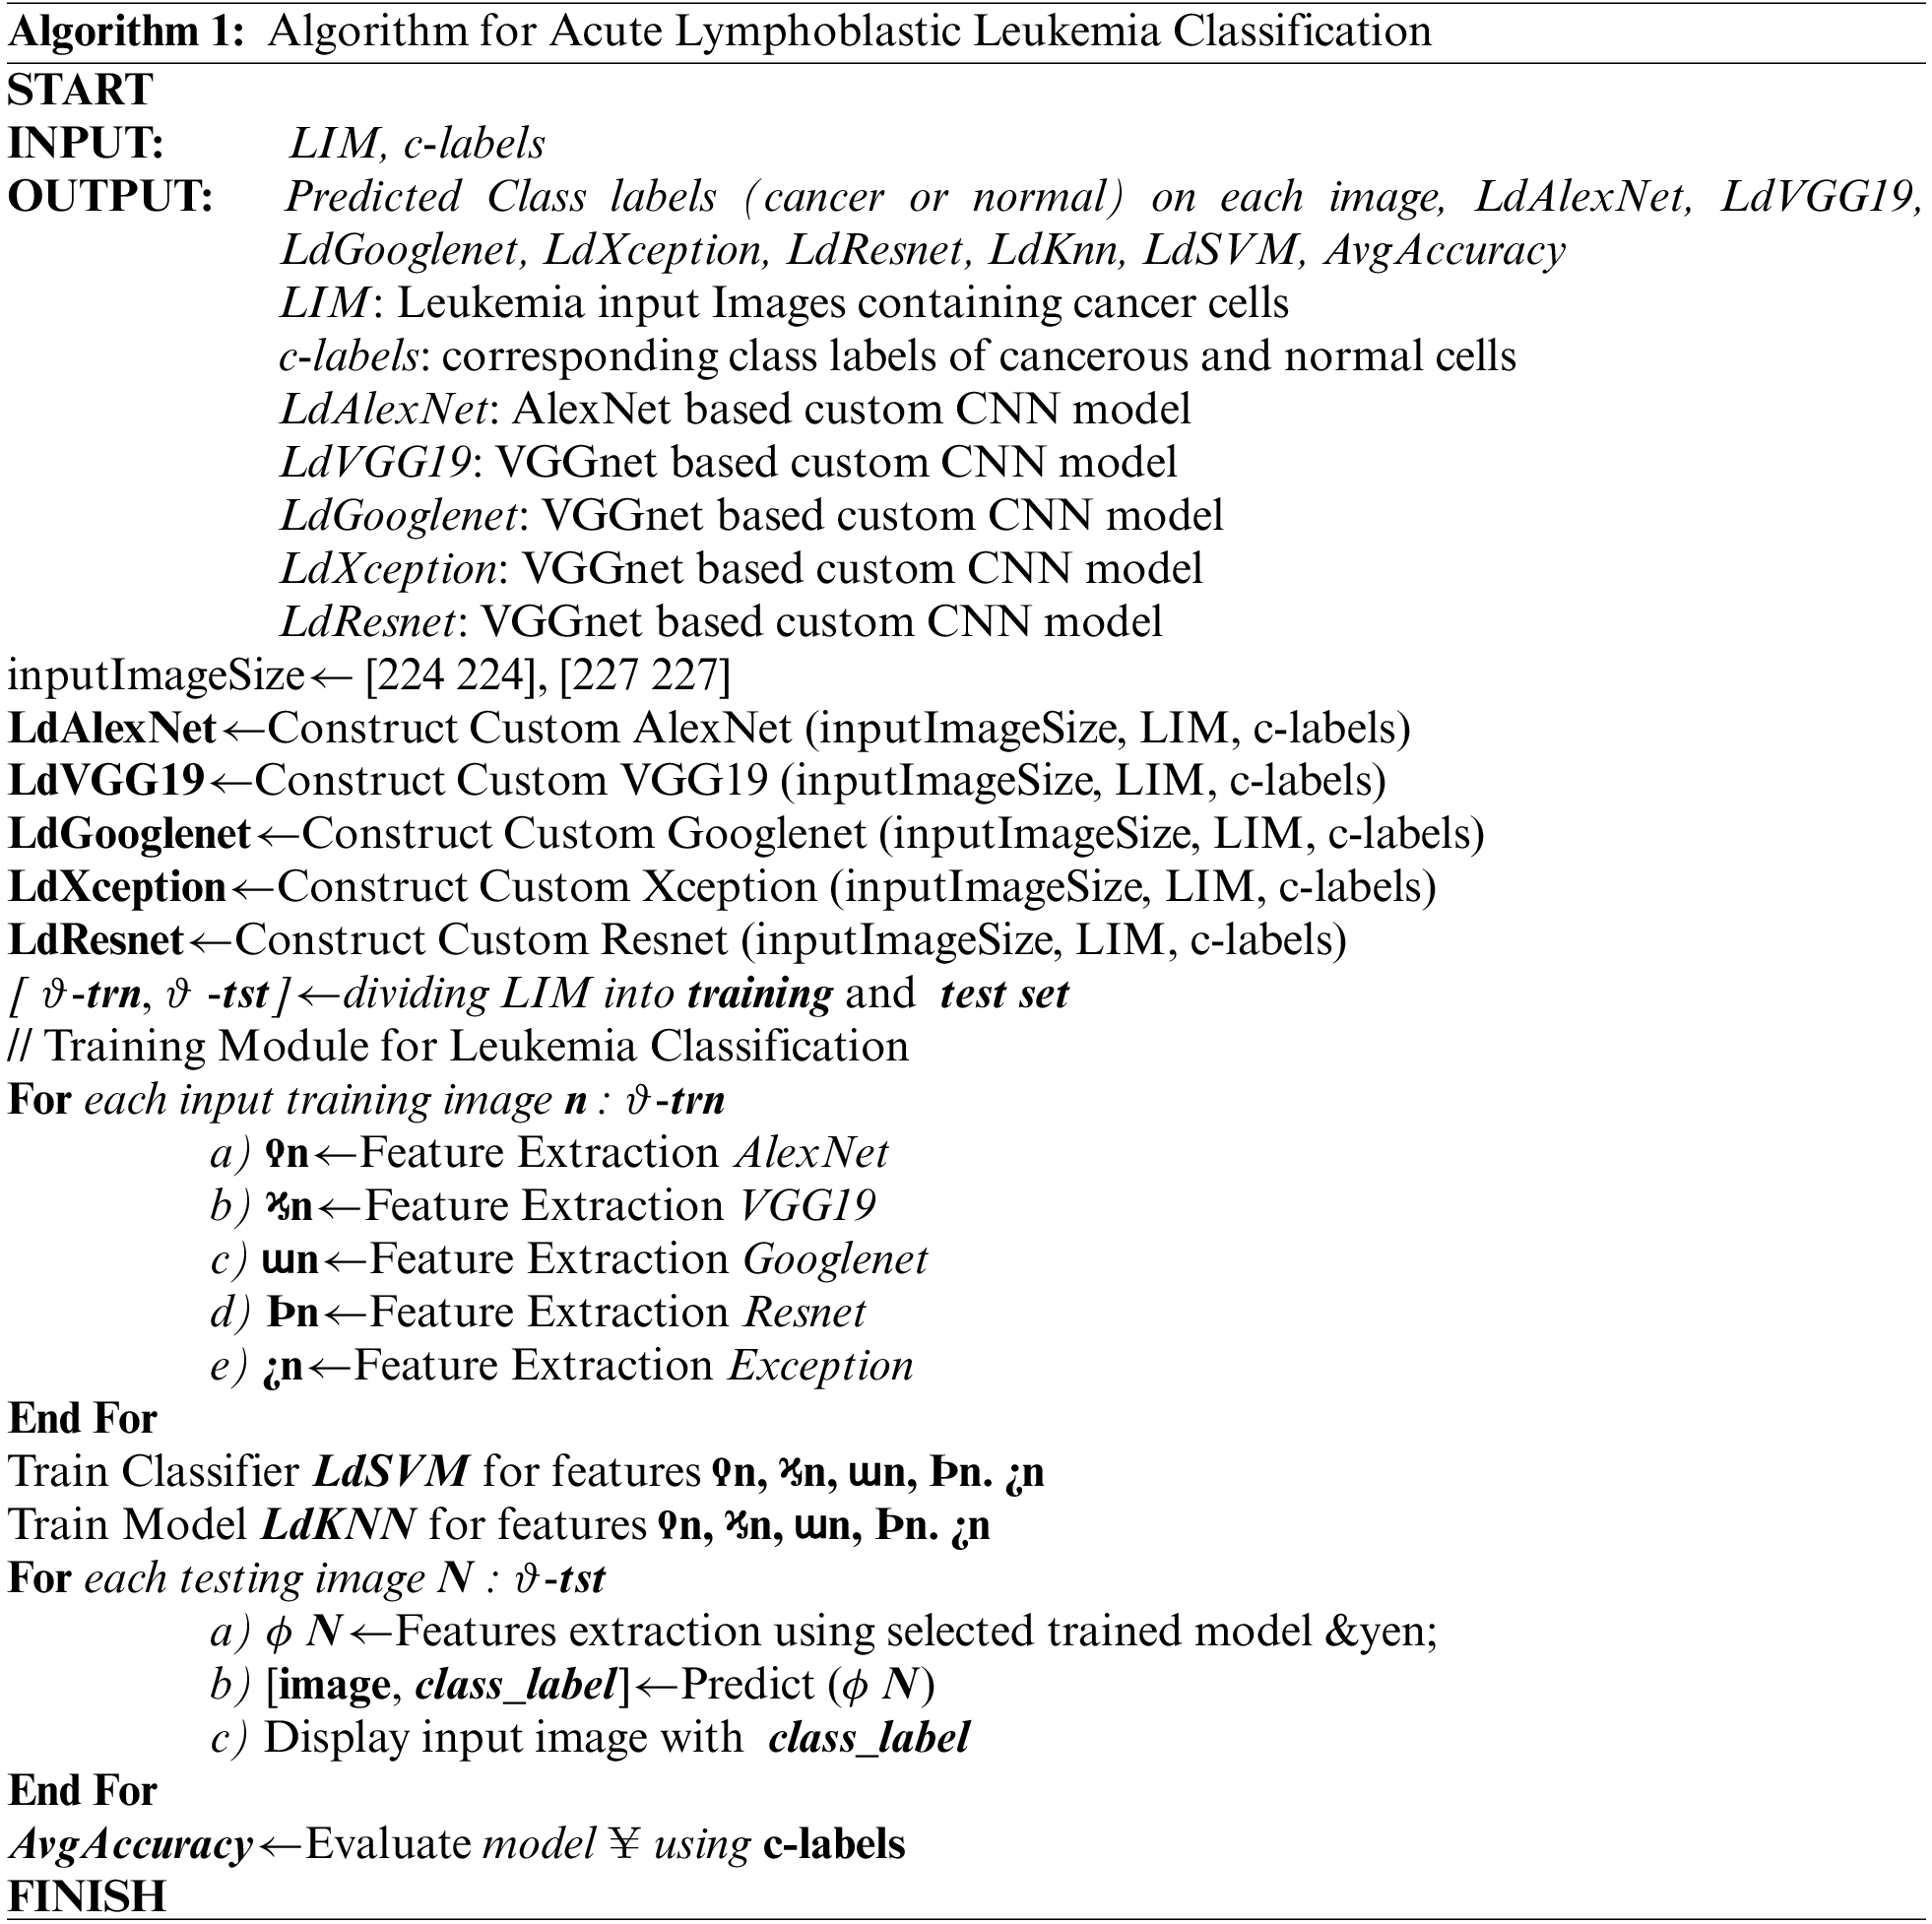
In this work, we have applied both transfer learning approaches to compare and analyze the best-performing technique for the classification of subtypes of ALL. Our proposed approach comprises CNN-based features and shallow classifiers, as depicted in Fig. 1, which directly extract features from input images without segmentation as compared to the state-of-the-art methods. Our proposed approach is presented in Algorithm. 1. A more detailed methodology and architecture of CNN are given in Fig. 5.
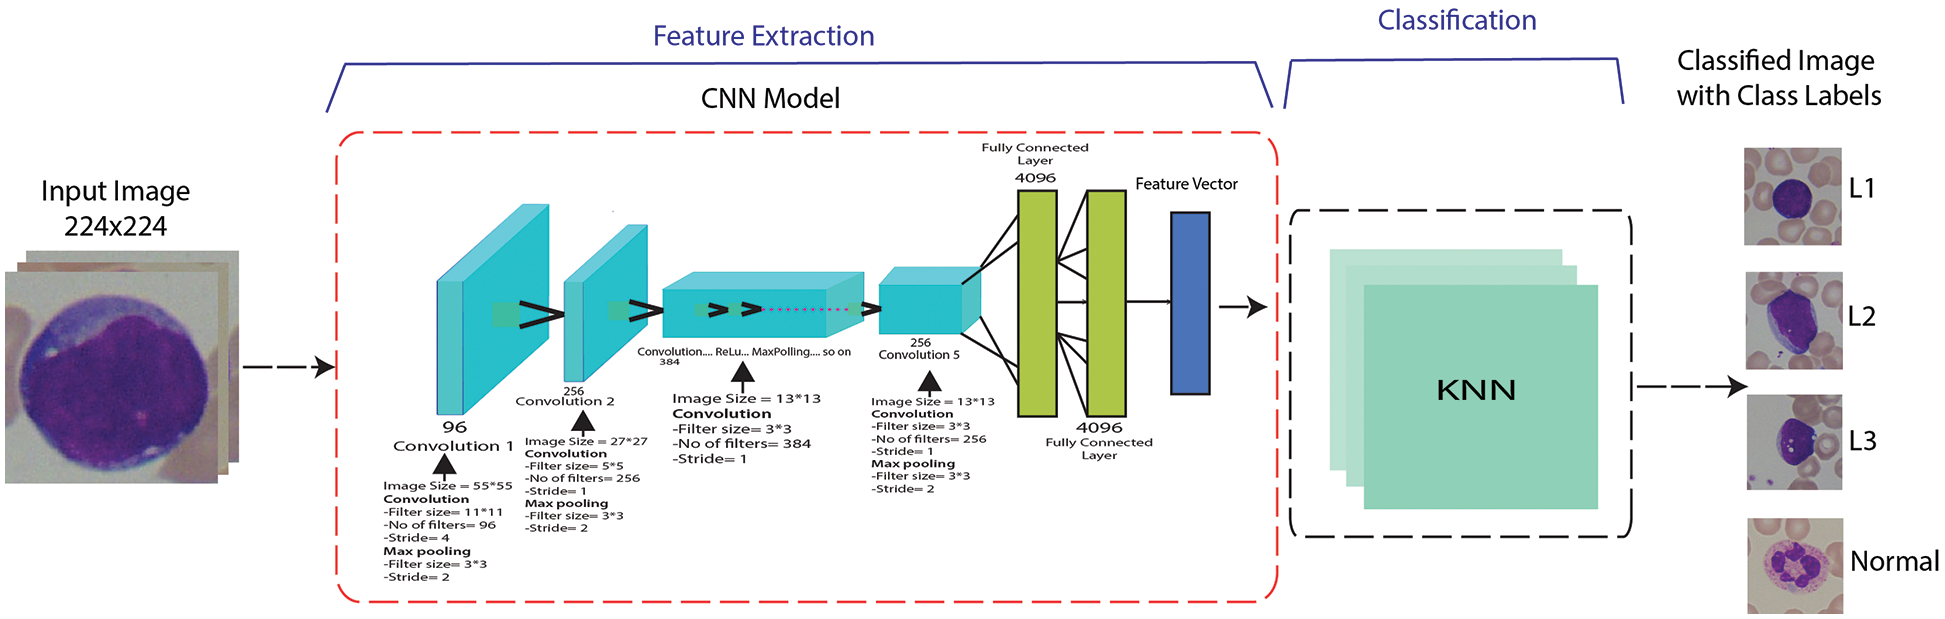
Figure 5: A proposed methodology for a fusion of CNN-based features and KNN classifier
Features extraction is a technique of fetching relevant information from a given problem to solve that problem efficiently. In terms of digital images, these relevant features can be shape-based, color-based features, etc., which can be utilized to differentiate between different objects in the images. In this work, we have utilized the concept of transfer learning for feature extraction, where we have used pre-trained deep convolutional neural networks to extract relevant features. These features include shape-based features, color, and texture features. After that, these features are given to shallow classifiers, including KNN and SVM, to differentiate between normal and leukemia-affected cells. Moreover, these features are also utilized for classifying subtypes of acute lymphoblastic leukemia, i.e., L1 type, L2 type, and L3 type, which was mostly neglected in state-of-the-art research. We have extracted the last fully connected layer of the already mentioned pre-trained DCNN from which a feature vector is given to the classifier for classification.
In machine learning, classification is a type of supervised learning which predicts the input image into an output label by utilizing different types of image features. In this work, we have deployed two different types of classifiers to perform ALL and its subtypes classification. These classifiers are given features from the last fully connected layer of CNN, which are given as input to our classifier, which classifies the input images into their respective classes.
SVM is a widely used supervised learning algorithm specifically deployed for binary classification problems. This Algorithm finds a maximum-margin hyperplane in high dimensional space to separate the two classes of data points. SVM can be utilized for both types of problems, including linear as well as non-linear problems. Where it has been found effective while performing classification tasks in high-dimensional space. In our study, the SVM classifier has been combined with CNN, where it gets input of feature vector from the last fully connected layers of a pre-trained CNN. Based on these features, we have performed the classification of normal and leukemia-affected cells by utilizing the SVM classifier.
KNN is also a supervised learning algorithm that is utilized for classification as well as regression problems. This Algorithm considers similar data points to be nearest to each other. This Algorithm is very useful when it is difficult to approximate the parametric probability of data points. Because KNN is a non-parametric algorithm and does not require any prior information about data distribution. Hence, KNN could and most likely ought to be one of the first options for a classification problem when there is almost no earlier information regarding the data distribution. In this work, we have utilized KNN in combination with CNN, where it gets a feature vector from the final fully connected layer of pre-trained CNN to carry out classification by utilizing those extracted features.
In this work, we have utilized different pre-trained convolutional neural network architectures, including AlexNet, VggNet, GoogLeNet, ResNet, and Xception, for extracting features. These features are given to our shallow classifiers, including SVM and KNN, to perform ALL classifications. The proposed approach is applied to our dataset having different color schemes, including Dataset version A where input images given to our model were RGB (Red, Green, and Blue) color images, Dataset version B having HSV (Hue, Saturation, and Value) color scheme images, Dataset version C having lab (L*a*b*) color scheme and Dataset version D where input images given to our model were YCbCr (Luminance, Chroma Blue, Chroma Red). Samples from these datasets are shown in Fig. 6. Different combinations of techniques applied to these datasets with their accuracy are shown in Table 2.
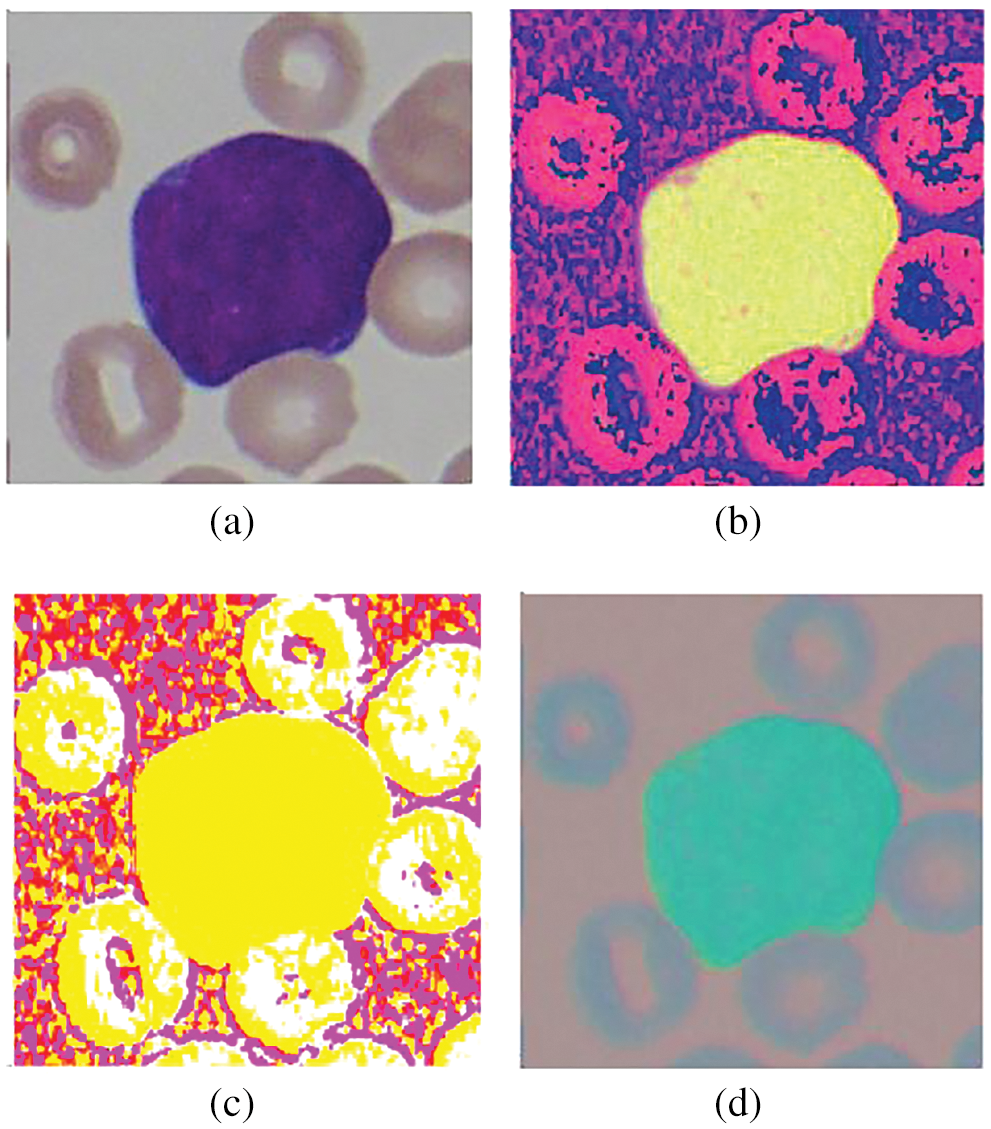
Figure 6: Dataset samples: (a) RGB, (b) HSV, (c) Lab, and (d) YCbCr
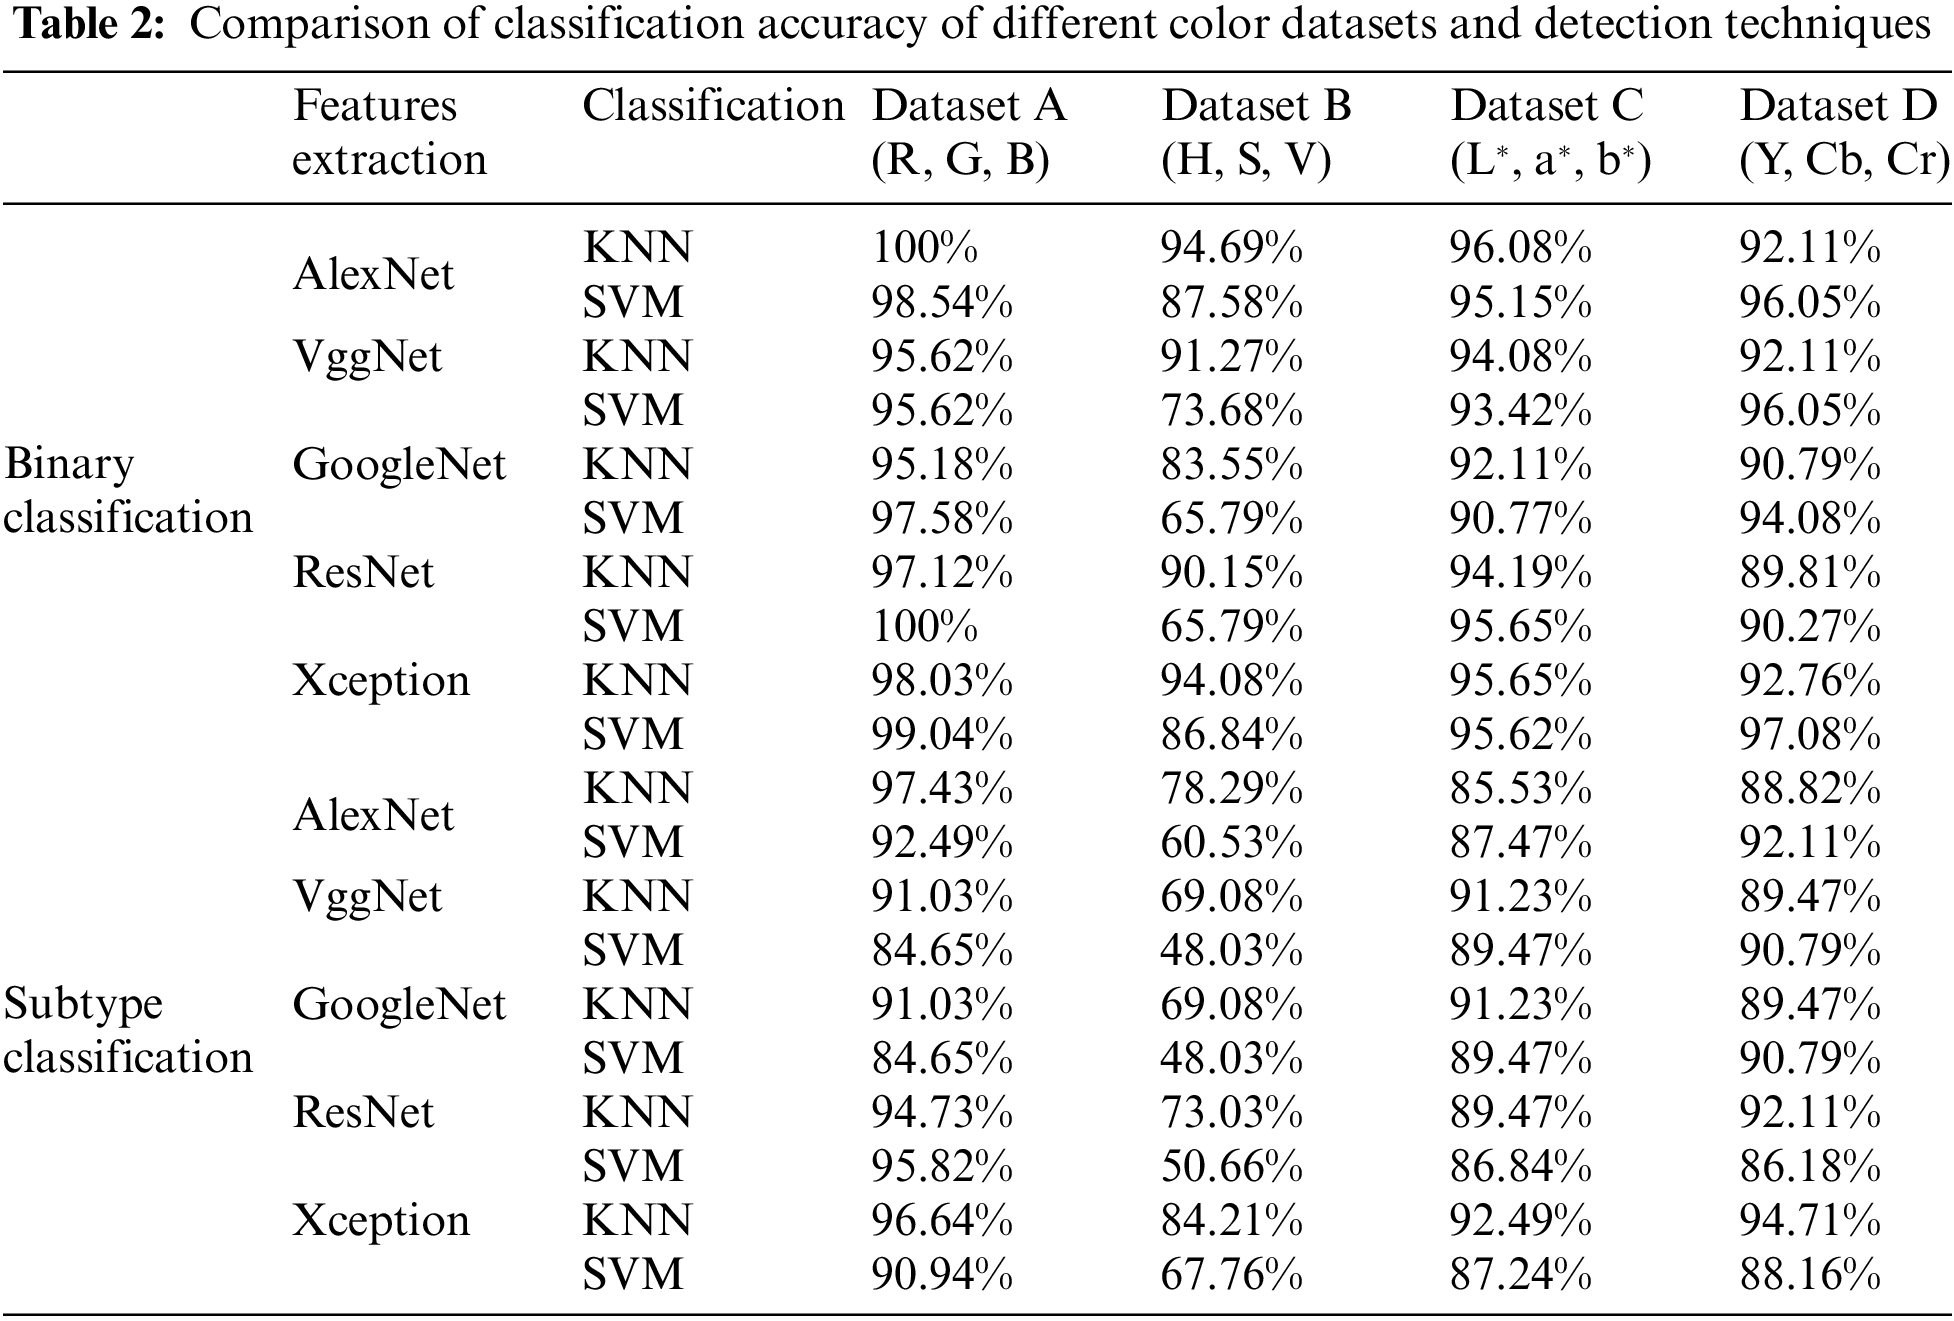
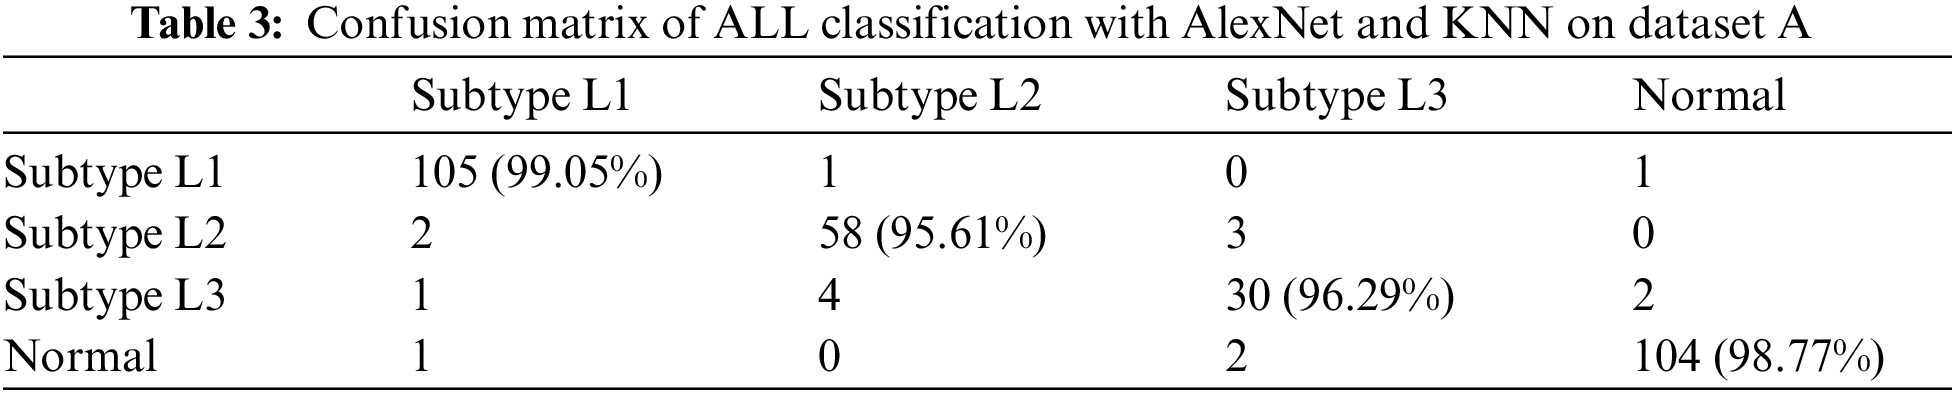
A different combination of techniques is applied to four different versions of datasets. From all the techniques, AlexNet-based features followed by the K nearest neighbor (KNN) classifier have outperformed all the other techniques in the table by attaining the highest accuracy for the classification of leukemia and its subtypes by utilizing the RGB color Dataset as shown in Table 3. If we talk about datasets, it can be seen that the RGB color scheme Dataset A has outperformed all other color schemes in terms of accuracy for leukemia detection as well as its subtypes classification. Other datasets and techniques have also performed well in detecting leukemia-affected cells, which shows that these techniques are independent of color schemes while detecting cancer.
We have also performed fine-tuning over the pre-trained convolutional neural networks to check their accuracy on the leukemia dataset. We have removed the last three layers of convolutional neural networks and fine-tuned them on our new dataset. These neural networks already have generic features of natural image databases. Which are helpful while exposing these networks to a new type of data [31,32]. For this purpose, we have utilized five famous convolutional neural networks, including AlexNet, VggNet, GoogleNet, ResNet, and Xception. We have performed both binary and subtypes classification of acute lymphoblastic leukemia. Result comparisons of these networks are given in Table 4.
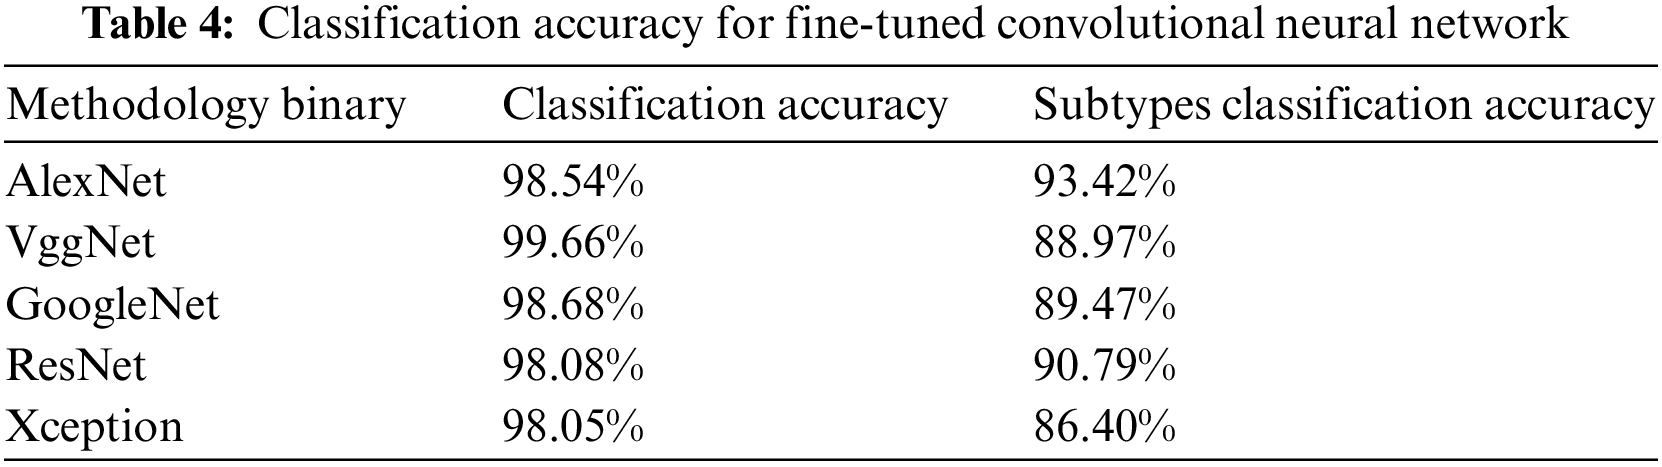
It can be seen that VggNet has outperformed other CNNs in terms of binary classification accuracy but gives a satisfactory performance on subtypes classification. Similarly, AlexNet has achieved third place while classifying leukemia into normal and blast cells but outperforms other CNNs in subtypes classification by attaining first place. The average performance comparison has been shown in Fig. 7. Where the performance result of each label has been visualized and compared as per their accuracy, sensitivity, specificity, and precision to verify which label performs well during the training process.
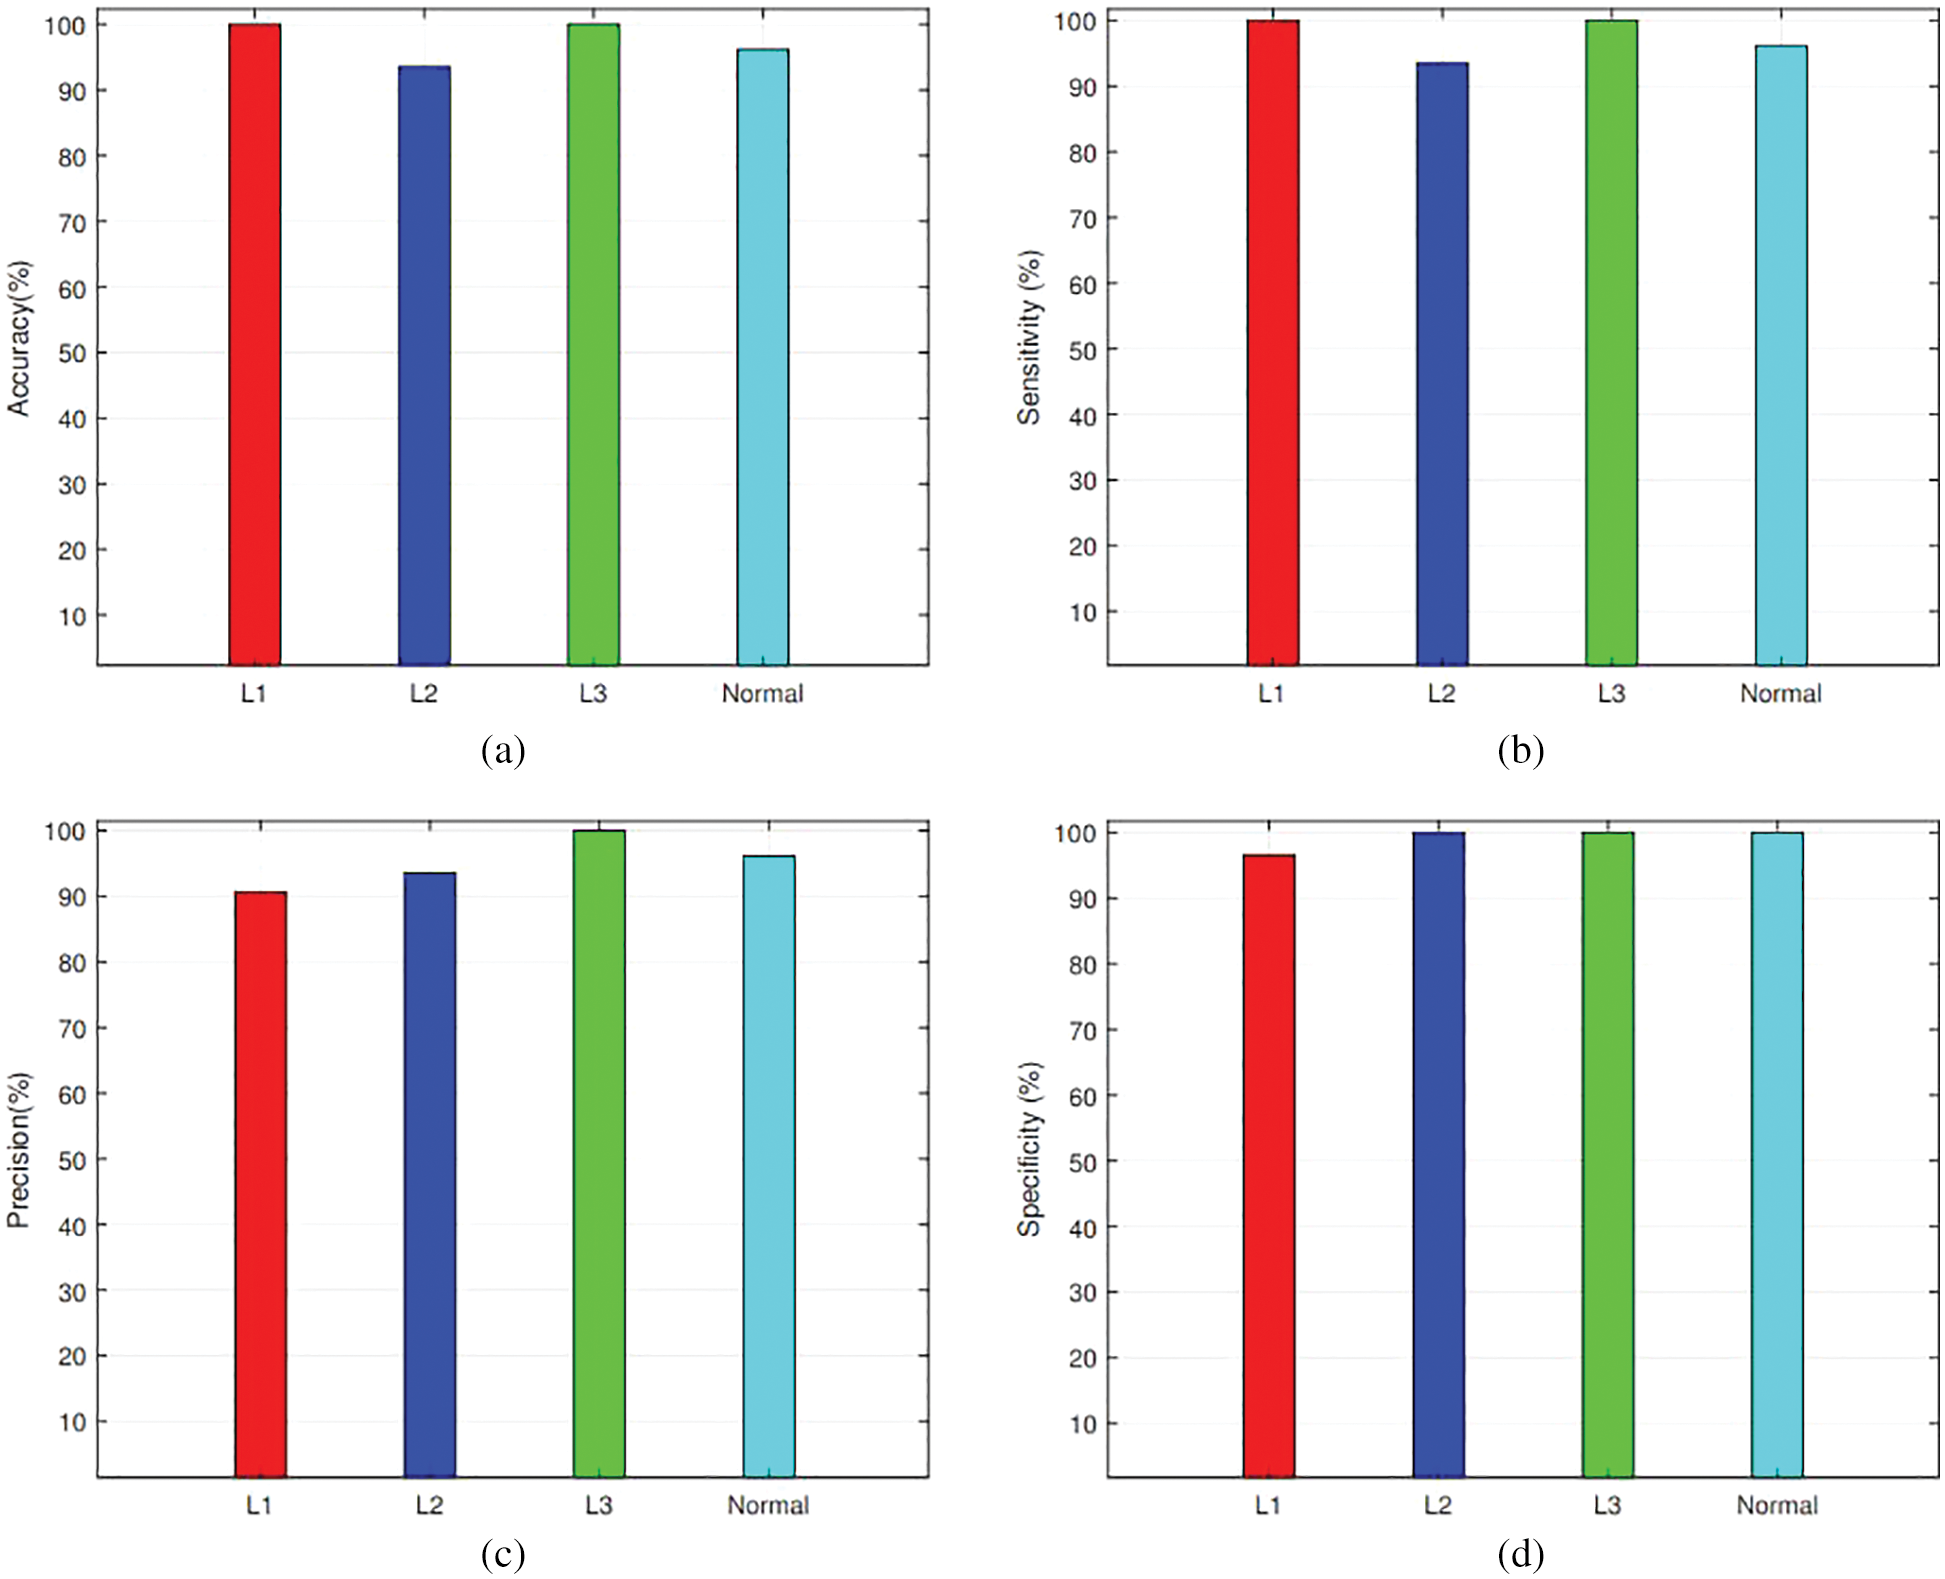
Figure 7: Average Performance Comparison for each class by utilizing AlexNet and KNN: (a) Accuracy, (b) Sensitivity, (c) Precision, and (d) Specificity
We have utilized a blend of CNNs and Shallow classifiers for the FAB-based subtypes classification of acute lymphoblastic leukemia. We have compared the performance of different CNN-based features followed by shallow classifiers. It can be seen from the results that features of AlexNet, which are given to the KNN classifier, have shown outstanding performance by achieving higher accuracy as compared to other techniques. Our proposed technique beats state-of-the-art methodologies and is more robust than the traditional techniques as it doesn’t require segmenting out the objects from the background to extract other techniques. Our proposed technique beats state-of-the-art methodologies and is more robust than the traditional techniques as it doesn’t require segmenting out the objects from the background to extract features efficiently. By implementing our proposed technique on four different color-based datasets, RGB color images have shown tremendous performance by achieving the highest accuracy among the other color types, i.e., 100% classification accuracy against binary classification and 97.43% accuracy against subtypes classification including L1 type, L2 type, L3 type and normal.
In this work, we proposed a CNN and a shallow classifier-based approach for the detection and classification of leukemia and its subtypes based on FAB classification. On the other hand, Amin et al. [26] presented a novel acute lymphoblastic leukemia classification technique where for preprocessing, they utilized histogram equalization to enhance the brightness issues in the dataset. After that, lymphocytes are extracted from the background by deploying a k-mean clustering algorithm which makes different clusters of white blood cells. Furthermore, different types of features, including shape-based, texture-based, and color-based feature vectors, are obtained from these white blood cells, which are classified into leukemia subtypes by utilizing a multi-class SVM (Support Vector Machine) algorithm. They have achieved an overall accuracy of 97% for binary classification and 95.6% for FAB-based subtypes classification of leukemia. Shafique et al. [28] presented a CNN architecture to perform automated classification of leukemia-affected cells into their subtypes. They have deployed modified AlexNet, which is fine-tuned on the enhanced ALL-IDB-2 dataset and achieved an accuracy of 99.5% for binary and 96.06% for subtypes classification. Our proposed methodology has performed significantly well and outperforms all the state-of-the-art approaches. We have compared our proposed approach with state-of-the-art classifiers, and the results are shown in Table 5.
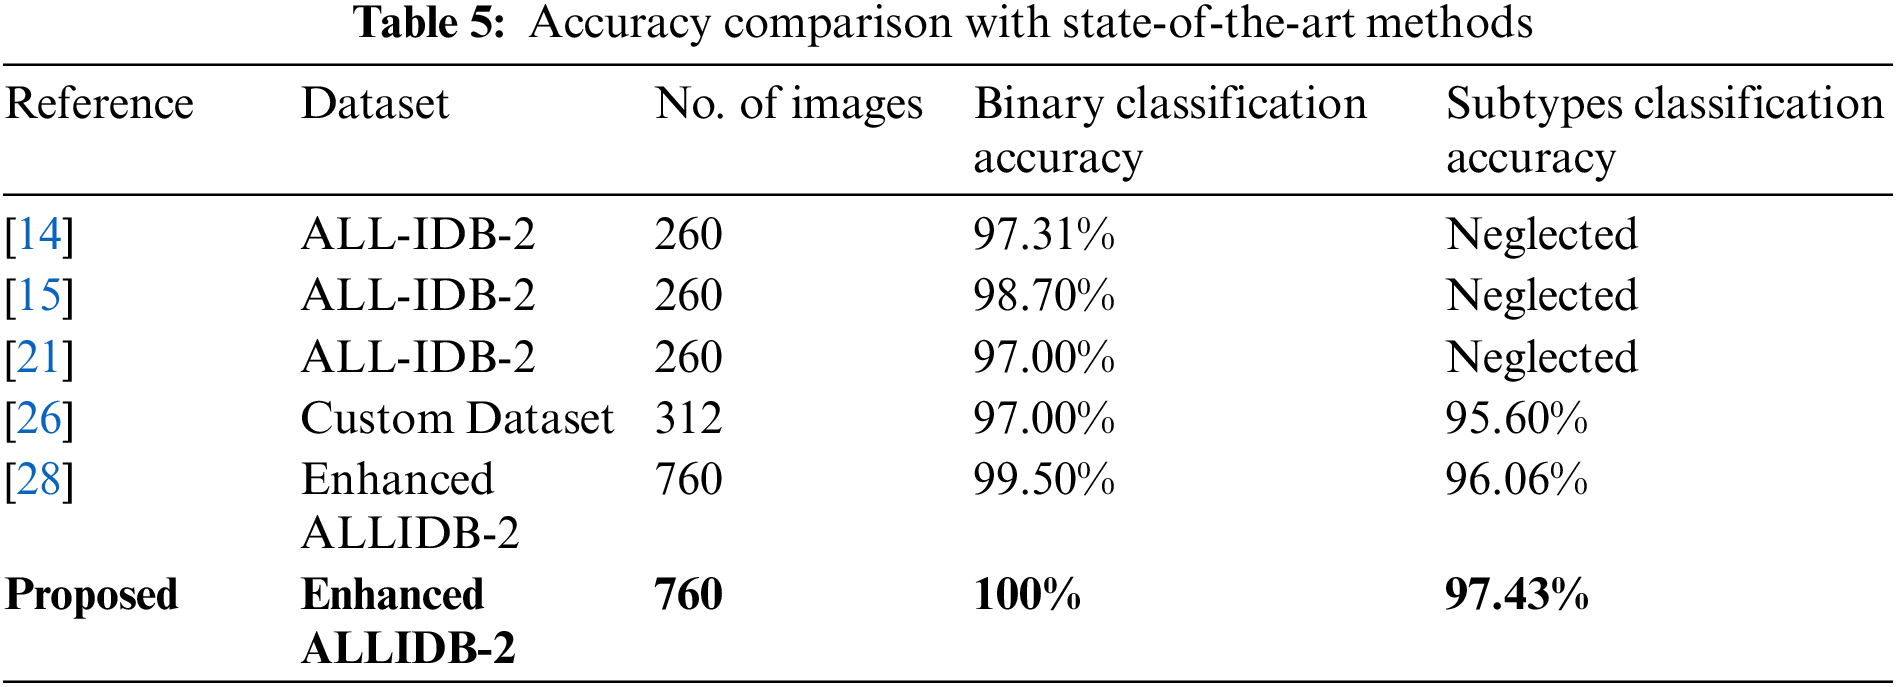
We have developed a robust automated system for the classification of leukemia and its subtypes by utilizing the concept of transfer learning with convolutional neural networks. We have discussed our proposed approach for leukemia classification. We have achieved an overall accuracy of 100% for leukemia binary classification and 97.43% for subtypes classification of acute lymphoblastic leukemia. It can be seen that our proposed approach has outperformed all the previous algorithms by accomplishing the highest accuracy among all of them.
In this study, we have deployed different types of pre-trained deep convolutional neural networks, including, AlexNet, VggNet, GoogleNet, ResNet, and Xception, followed by shallow classifiers, including support vector machine and k-nearest neighbor for early diagnosing of leukemia as well as its subtypes. One of the auspicious future directions can be the collection of larger datasets for leukemia on which we can train deep convolutional neural networks from scratch to perform end-to-end classification for its subtypes, which can enhance the capability of medical professionals to perform early diagnosing and treatment of acute lymphoblastic leukemia. Moreover, different types of leukemia, including chronic lymphoblastic leukemia, chronic myeloid leukemia, and acute myeloid leukemia, can also be considered to devise a full fledge blood cancer detection system.
Acknowledgement: The authors acknowledge the support from the Deanship of Scientific Research, Najran University. Kingdom of Saudi Arabia, for funding this work under the Research Collaboration funding program grant code number (NU/RC/SERC/11/7).
Funding Statement: The authors acknowledge the support from the Deanship of Scientific Research, Najran University. Kingdom of Saudi Arabia, for funding this work under the Research Collaboration funding program grant code number (NU/RC/SERC/11/7).
Conflicts of Interest: The authors declare that they have no conflicts of interest to report regarding the present study.
References
1. T. Terwilliger and M. Abdul-Hay, “Acute lymphoblastic leukemia: A comprehensive review and 2017 update,” Blood Cancer Journal, vol. 7, no. 6, pp. e577–e585, 2017. [Google Scholar] [PubMed]
2. S. P. Hunger and C. G. Mullighan, “Acute lymphoblastic leukemia in children,” New England Journal of Medicine, vol. 373, no. 16, pp. 1541–1552, 2015. [Google Scholar] [PubMed]
3. A. K. Schmaelter, M. Labopin, G. Socié, M. ItäläRemes and D. Blaise, “Inferior outcome of allogeneic stem cell transplantation for secondary acute myeloid leukemia in first complete remission as compared to de novo acute myeloid leukemia,” Blood Cancer Journal, vol. 10, no. 3, pp. 1–9, 2020. [Google Scholar]
4. N. N. Naufa and V. Sajith, “Automatic leukemia detection in human blood sample based on microscopic images using machine learning,” International Journal of Scientific Research, vol. 8, no. 12, pp. 216–220, 2020. [Google Scholar]
5. F. Bayón-Calderón, M. L. Toribio and S. González-García, “Facts and challenges in immunotherapy for T-cell acute lymphoblastic leukemia,” International Journal of Molecular Sciences, vol. 21, no. 20, pp. 7685–7699, 2020. [Google Scholar]
6. S. Gupta, C. Wang, E. A. Raetz, R. Schore, W. L. Salzer et al., “Impact of asparaginase discontinuation on outcome in childhood acute lymphoblastic leukemia: A report from the children’s oncology group,” Journal of Clinical Oncology, vol. 38, no. 17, pp. 1897–1915, 2020. [Google Scholar] [PubMed]
7. C. H. Pui, M. V. Relling and J. R. Downing, “Acute lymphoblastic leukemia,” New England Journal of Medicine, vol. 350, no. 15, pp. 1535–1548, 2004. [Google Scholar] [PubMed]
8. E. Papaemmanuil, M. Gerstung, L. Bullinger, V. I. Gaidzik and P. Paschka, “Genomic classification and prognosis in acute myeloid leukemia,” New England Journal of Medicine, vol. 374, no. 23, pp. 2209–2221, 2016. [Google Scholar] [PubMed]
9. A. W. Roberts, M. S. Davids, J. M. Pagel, B. S. Kahl, S. D. Puvvada et al., “Targeting BCL2 with venetoclax in relapsed chronic lymphocytic leukemia,” New England Journal of Medicine, vol. 374, no. 4, pp. 311–322, 2016. [Google Scholar] [PubMed]
10. A. Hochhaus, M. Baccarani, R. T. Silver, C. Schiffer, J. F. Apperley et al., “European leukemianet 2020 recommendations for treating chronic myeloid leukemia,” Leukemia, vol. 34, no. 4, pp. 966–984, 2020. [Google Scholar] [PubMed]
11. A. Shah, S. S. Naqvi, K. Naveed, N. Salem, M. A. U. Khan et al., “Automated diagnosis of leukemia: A comprehensive review,” IEEE Access, vol. 9, no. 2, pp. 132097–132124, 2021. [Google Scholar]
12. N. Boissel and A. Baruchel, “Acute lymphoblastic leukemia in adolescent and young adults: Treat as adults or as children,” Blood, The Journal of the American Society of Hematology, vol. 132, no. 4, pp. 351–361, 2018. [Google Scholar]
13. L. P. Clinton Jr., K. M. Somes, Y. Chu and F. Javed, “Acute lymphoblastic leukemia detection using depthwise separable convolutional neural networks,” SMU Data Science Review, vol. 3, no. 2, pp. 4–15, 2020. [Google Scholar]
14. M. E. Billah and F. Javed, “Bayesian convolutional neural network-based models for diagnosis of blood cancer,” Applied Artificial Intelligence, vol. 36, no. 1, pp. 20116881–20116903, 2022. [Google Scholar]
15. K. K. Jha and H. S. Dutta, “Mutual information based hybrid model and deep learning for acute lymphocytic leukemia detection in single cell blood smear images,” Computer Methods and Programs in Biomedicine, vol. 179, no. 1, pp. 104987–104999, 2019. [Google Scholar] [PubMed]
16. J. Rawat, A. Singh, H. S. Bhadauria and J. Virmani, “Computer aided diagnostic system for detection of leukemia using microscopic images,” Procedia Computer Science, vol. 70, no. 2, pp. 748–756, 2015. [Google Scholar]
17. R. D. Labati, V. Piuri and F. Scotti, “All-IDB: The acute lymphoblastic leukemia image database for image processing,” in 18th IEEE Int. Conf. on Image Processing, Brussels, Belgium, pp. 2045–2048, 2011. [Google Scholar]
18. M. Tuba and E. Tuba, “Generative adversarial optimization (GOA) for acute lymphocytic leukemia detection,” Studies in Informatics and Control, vol. 28, no. 3, pp. 245–254, 2019. [Google Scholar]
19. K. R. Kavitha, A. Gopinath and M. Gopi, “Applying improved svm classifier for leukemia cancer classification using FCBF,” in Int. Conf. on Advances in Computing, Communications and Informatics (ICACCI), Manipal, India, pp. 61–66, 2017. [Google Scholar]
20. S. Hariprasath, T. Dharani, S. Mohammad and N. Bilal, “Automated detection of acute lymphocytic leukemia using blast cell morphological features,” in 2nd Int. Conf. on Advances in Science & Technology (ICAST), Bahir Dar, Ethiopia, pp. 20–25, 2019. [Google Scholar]
21. R. Thirunavukarasu, R. Gnanasambandan, M. Gopikrishnan and V. Palanisamy, “Towards computational solutions for precision medicine based big data healthcare system using deep learning models: A review,” Computers in Biology and Medicine, vol. 3, no. 2, pp. 106020–106035, 2022. [Google Scholar]
22. J. M. Bennett, D. Catovsky, M. Daniel, G. Flandrin, D. A. G. Galton et al., “Proposals for the classification of the acute leukaemias french-american-british (fab) cooperative group,” British Journal of Haematology, vol. 33, no. 4, pp. 451–458, 1976. [Google Scholar] [PubMed]
23. E. Kotei and R. Thirunavukarasu, “Computational techniques for the automated detection of mycobacterium tuberculosis from digitized sputum smear microscopic images: A systematic review,” Progress in Biophysics and Molecular Biology, vol. 4, no. 1, pp. 300–311, 2022. [Google Scholar]
24. S. Mishra, B. Majhi and P. K. Sa, “Texture feature based classification on microscopic blood smear for acute lymphoblastic leukemia detection,” Biomedical Signal Processing and Control, vol. 47, no. 1, pp. 303–311, 2019. [Google Scholar]
25. S. Dasariraju, M. Huo and S. McCalla, “Detection and classification of immature leukocytes for diagnosis of acute myeloid leukemia using random forest algorithm,” Bioengineering, vol. 7, no. 4, pp. 120–135, 2020. [Google Scholar] [PubMed]
26. M. M. Amin, S. Kermani, A. Talebi and M. G. Oghli, “Recognition of acute lymphoblastic leukemia cells in microscopic images using k-means clustering and support vector machine classifier,” Journal of Medical Signals and Sensors, vol. 5, no. 1, pp. 49–65, 2015. [Google Scholar] [PubMed]
27. V. Shankar, N. Chaitra, M. M. Deshpande and S. A. Hassan, “Automatic detection of acute lymphoblastic leukemia using image processing,” in IEEE Int. Conf. on Advances in Computer Applications (ICACA), Coimbatore, Tamilnadu, India, pp. 186–189, 2016. [Google Scholar]
28. S. Shafique and S. Tehsin, “Acute lymphoblastic leukemia detection and classification of its subtypes using pretrained deep convolutional neural networks,” Technology in Cancer Research & Treatment, vol. 17, no. 1, pp. 1–7, 2018. [Google Scholar]
29. A. R. Revanda, C. Fatichah and N. Suciati, “Classification of acute lymphoblastic leukemia on white blood cell microscopy images based on instance segmentation using mask R-CNN,” International Journal of Intelligent Engineering and Systems, vol. 1, no. 1, pp. 99–114, 2022. [Google Scholar]
30. S. Mohapatra, D. Patra and S. Satpathy, “An ensemble classifier system for early diagnosis of acute lymphoblastic leukemia in blood microscopic images,” Neural Computing and Applications, vol. 24, no. 7, pp. 1887–1904, 2014. [Google Scholar]
31. S. S. Al-jaboriy, N. N. A. Sjarif, S. Chuprat and W. M. Abduallah, “Acute lymphoblastic leukemia segmentation using local pixel information,” Pattern Recognition Letters, vol. 125, no. 1, pp. 85–90, 2019. [Google Scholar]
32. R. R. Putri, E. P. Mandyartha and A. S. Indrawanti, “Automatic identification of acute lymphoblastic leukemiaon blood cell an image using geometric features,” IOP Conference Series: Materials Science and Engineering, vol. 462, no. 1, pp. 012018–012030, 2019. [Google Scholar]
Cite This Article
 Copyright © 2023 The Author(s). Published by Tech Science Press.
This work is licensed under a Creative Commons Attribution 4.0 International License , which permits unrestricted use, distribution, and reproduction in any medium, provided the original work is properly cited.
 Downloads
 Citation Tools