
 Submit a Paper
 Propose a Special lssue
 Open Access
ARTICLE

Milling Fault Detection Method Based on Fault Tree Analysis and Hierarchical Belief Rule Base
1 School of Computer Science and Information Engineering, Harbin Normal University, Harbin 150025, China
2 High-Tech Institute of Xi’an, Xi’an, Shanxi, 710025, China
* Corresponding Author: Wei He. Email:
Computer Systems Science and Engineering 2023, 46(3), 2821-2844. https://doi.org/10.32604/csse.2023.037330
Received 30 October 2022; Accepted 17 February 2023; Issue published 03 April 2023
 View Full Text
 Download PDF
Abstract
Expert knowledge is the key to modeling milling fault detection systems based on the belief rule base. The construction of an initial expert knowledge base seriously affects the accuracy and interpretability of the milling fault detection model. However, due to the complexity of the milling system structure and the uncertainty of the milling failure index, it is often impossible to construct model expert knowledge effectively. Therefore, a milling system fault detection method based on fault tree analysis and hierarchical BRB (FTBRB) is proposed. Firstly, the proposed method uses a fault tree and hierarchical BRB modeling. Through fault tree analysis (FTA), the logical correspondence between FTA and BRB is sorted out. This can effectively embed the FTA mechanism into the BRB expert knowledge base. The hierarchical BRB model is used to solve the problem of excessive indexes and avoid combinatorial explosion. Secondly, evidence reasoning (ER) is used to ensure the transparency of the model reasoning process. Thirdly, the projection covariance matrix adaptation evolutionary strategies (P-CMA-ES) is used to optimize the model. Finally, this paper verifies the validity model and the method's feasibility techniques for milling data sets.Keywords
Milling is a highly efficient machine processing method. Milling uses a milling cutter to machine the surface of an object. The types of milling are table, cantilever, ram, gantry, etc. And are usually performed on milling or boring machines [1]. In conventional milling operations, the milling cutter in a milling machine moves perpendicular to its axis; thus, it allows the removal of excess material from the workpiece around the tool. Milling machines are very versatile; they manufacture various shapes and sizes of parts, and many machining operations can be performed on them [2]. Milling tools are necessary to perform these tasks, and milling is essential to produce quality parts [3]. During the milling process, milling cutter wear and shaft vibration fault are the leading causes of milling faults. Fault to measure fault on time may lead to abnormal suspension of the process, resulting in waste of raw materials or even damage to the milling machine [4].
Many researchers have conducted experiments on milling fault detection. Li et al. [5] proposed an early flutter detection method based on variational mode decomposition and power spectrum entropy difference, which can be applied to different milling situations. Ninevski et al. [6] proposed a new computational method for detecting wear and damage of milling cutters and fully tested it on real industrial datasets, successfully demonstrating the technique’s effectiveness for wear detection of milling cutters in actual industrial production and showing the potential of the technical process. Shi et al. [7] proposed a new method for chattering detection based on ordered neuron long-and short-time memory (ON-LSTM) and population-based training (PBT). Mei et al. [8] proposed a milling chatter detection method based on singular spectrum analysis. The technique performs milling experiments under different cutting forces and uses adaptive feature analysis and unique particular value entropy to obtain the required data for the experiments. Sener et al. [9] proposed a groove milling chatter detection method based on vibration data features. In this experiment, the DMLP algorithm is trained using a fast Fourier transform (FFT) in the context of a deep learning-depth multi-layer perceptron (DMLP). Some time-domain signals are selected as the algorithm input. Dun et al. [10] proposed an unsupervised method consisting of unmarked measured dynamic signals to diagnose the chattering stability of milling, a technique with the advantages of being independent of measurement errors and robustness. Chen et al. [11] proposed a novel multifractal formalism to detect chattering during milling. The feasibility of the proposed method was verified by performing dynamic detection and classification evaluation under different cutting conditions. Gao et al. [12] proposed a sensitive feature dataset and Mahalanobis-Taguchi system using sensor signals. It is found that the method can quickly detect vibration patterns. Madhusudana et al. [13] used acoustic signals and a decision tree for fault detection of the milling system and applied decision tree technology to feature extraction. Madhusudana et al. [14] also introduced a decision tree and Bayesian algorithm for fault detection of the milling system, and experiments verified its effectiveness. Qiao et al. [15] proposed a second-order stochastic resonance method based on fractional derivative enhancement for automatic fault detection. Experimental results show that this method not only restrains multi-scale noise but also increases the benefit of noise. Jafarzadeh and Panda et al. [16,17] have performed some research in the field of network-on-chip and photonic integrated circuits.
The comprehensive analysis of the above literature shows that the current milling fault detection methods mainly fall into the following primary categories: (1) White box model. The white box model is the actual operation of the system to build a fault detection model, such as a decision tree [18]. It does not depend on the data sample, but because of the complex structure of the model and the bad operating environment, it often cannot guarantee the high precision of the model. (2) Black box model. It is data-driven, such as deep belief networks [19] and variational autoencoders [20]. The accuracy of the black box model depends on a large amount of observation data, which is not interpretable in the modeling process. This approach has the following problems. On the one hand, the model cannot achieve high accuracy in the case of small sample data. In the whole life cycle of the system, it is difficult to collect many milling fault samples and even more challenging to collect data samples under different fault modes or milling tools. On the other hand, most of the existing milling fault detection methods are tested based on chatter and noise [21]. Affected by noise, the input information is often uncertain. Most existing fault detection methods cannot deal with uncertainty well. (3) Grey box model. It can effectively integrate the model mechanism with the observed data. The model mechanism constructs the model, and the model parameters are modified and optimized by the data, such as belief rule base [22] and evidence reasoning [23].
The black and white box models are unsuitable for milling fault detection. This is because the black box model cannot guarantee the interpretability of the model, while the white box model cannot guarantee the high precision of the model. To ensure the accuracy of the milling fault detection model and have modeling interpretability, the grey box model is selected for milling fault detection. The proposed model is based on the belief rule base, which belongs to the grey box model. In 2006, the belief rule base (BRB) based on evidence reasoning (ER) and expert systems was proposed by Yang et al. [24]. At present, BRB has been widely used in fault diagnosis [25], risk assessment [26], clinical reasoning [27], and other fields.
In the actual fault detection of the milling system, BRB has an excellent ability to deal with small sample data and uncertain information, but there are still some things that could be improved. First, the modeling process of BRB needs to accurately tease out the logical relationship between different milling fault detection indicators, resulting in the inaccuracy of the initial model construction. This does not guarantee the interpretability of milling system modeling. Second, for multi-index or even redundant fault detection problems, the traditional BRB model is prone to combinatorial explosion problems. This will significantly affect the efficiency of the milling system fault detection and the fault detection results. Third, BRB relies on the subjective construction of expert knowledge for initial modeling. BRB is an expert system, and the structure of the initial model determines the accuracy and interpretability of the milling fault detection model. However, the model cannot be modeled effectively due to the complex structure of the milling system and the uncertainty of prerequisite attribute data due to noise.
A milling system fault detection method based on fault tree analysis (FTA) and hierarchical BRB (FTBRB) is proposed to solve the above three problems. FTBRB adopts a fault tree and hierarchical approach to design its modeling process. The FTBRB model can embed fault tree analysis mechanism into the BRB expert knowledge base, which can well sort out the logical relationship between different milling fault detection indexes. More importantly, FTBRB applies a hierarchical approach to the fault detection of milling systems. Hierarchical BRB is composed of several sub-rule bases and adopts a bottom-up model. First, the indicators at the bottom are combined, and then the mixed results are used as the input of the next layer. Hierarchical BRB can reduce the number of rules and avoid the explosion of combined rules [28,29].
The main contributions of the fault detection method based on fault tree analysis and hierarchical BRB proposed in this paper are as follows. (1) The initial hierarchical BRB model is established by FTA, and the FTA mechanism is embedded into the hierarchical BRB expert knowledge base, solving the problem of constructing an expert knowledge base for milling fault detection methods. (2) A new hierarchical BRB-based fault detection model is constructed. The inference process of the model is interpretable, and an optimization algorithm can improve the model’s accuracy. The model can guarantee accuracy of the model even with small sample data and has high practicality.
The main structure of this paper is as follows. In the first part, the fault detection model of the milling system is analyzed and discussed, and a milling fault detection method based on fault tree analysis and hierarchical BRB is proposed. In the second part, based on the study of the disadvantages of traditional BRB, the problems encountered in establishing a hierarchical BRB model in the milling system are put forward. The third part briefly introduces the hierarchical BRB model of the milling system. In the fourth part, experimental verification and comparison are carried out. The fifth part summarizes the thesis.
2.1 Traditional BRB Modeling Process
BRB is composed of a series of belief rules, and its form in the rule
The contents in the set of referential input values in FTA are as follows: the set of referential values of basic events is denoted by
BRB’s modeling process is divided into three parts: analysis of the research content mechanism, setting referential points and referential values, build the initial belief table. The details are described as follows.
(1) Research Content Mechanism Analysis
Aiming at the fault detection and diagnosis of the milling system, we must first determine the cause and result of the failure of the milling system. In this case, this article can select the grounds of the fault as follows: material issue, cutting depth issue, excessive use time, DC fault, AC fault, machine feeding fault, knife wear, and shaft vibration fault. The fault result is a milling fault.
(2) Set Referential Points and Values
Determine the referential points and values for the fault cause and set the referential points and values corresponding to the fault result. The referential point is generally the location where most points are concentrated and contains the upper and lower bounds of the value range. The setting of referential value sets can be expressed as follows. Where
(3) Building the Belief Table
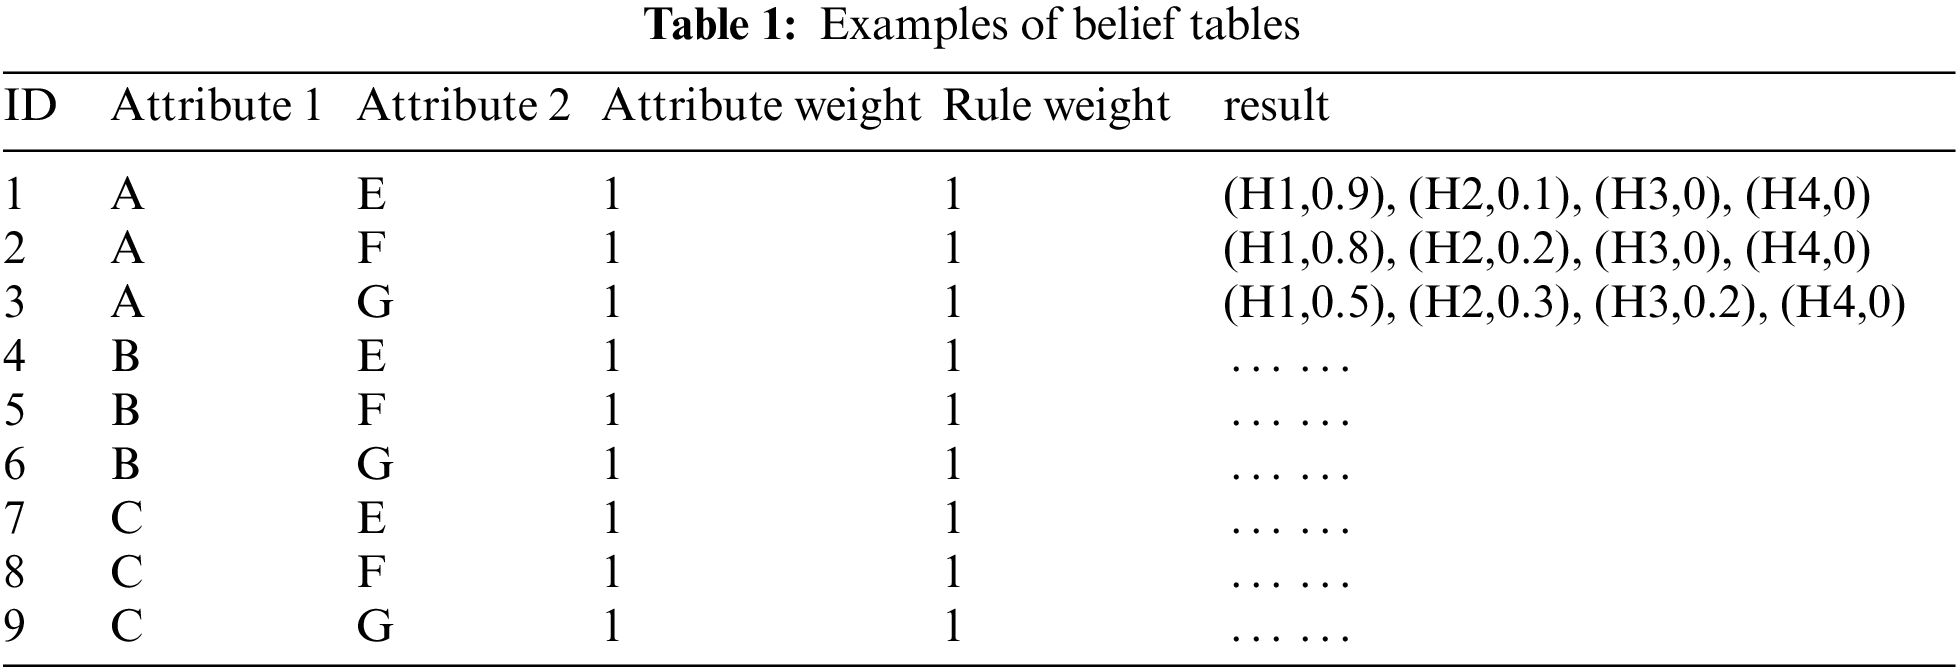
BRB combines rules in the form of a Cartesian product. The constructed belief table includes attribute weights, rule weights, belief levels, etc. Assume that attribute 1 has three reference points, A, B and C, and attribute 2 has three reference points, E, F and G. The corresponding belief table is shown in Table 1.
Expert knowledge affects the accuracy and interpretability of the model. From the above discussion, the BRB’s initial modeling strongly depends on expert knowledge. Therefore, how complete the expert knowledge base is to build a reasonable modeling process is significant.
The following problems must be solved to build the BRB model for the milling fault detection method:
(1) How to Integrate the Fault Tree Mechanism into the Hierarchical BRB
First, the problem of integrating the fault tree mechanism into the hierarchical BRB expert knowledge base must be addressed. In hierarchical BRB, the relationship between input and output is expressed by some belief rules, which experts usually decide based on empirical knowledge (with data from the system model) [30]. However, when applying the hierarchical BRB model in milling fault detection methods, it is difficult to embed expert knowledge into the model of the milling fault detection method. To achieve the combination of FTA and hierarchical BRB, it is necessary to address the correspondence between the inputs and outputs of each indicator and event. Therefore, this correspondence is described by Eq. (3).
where
(2) How to Construct a Reasonable Hierarchical BRB Model and Optimize it
Eq. (4) shows the solution to this problem.
After designing a reasonable and adequate hierarchical BRB model, the model’s accuracy has yet to be secured. This paper uses the P-CMA-ES algorithm to optimize the model and ensure accuracy.
3 Construction and Inference of the FTBRB Model
As a standard method in fault detection, fault tree analysis is a directional “tree” that describes the causal relationship of accidents and is one of the critical analysis methods in system safety engineering. BRB is also widely used in system safety engineering, such as risk assessment, fault detection, and health status assessment. Mapping fault tree analysis to BRB is equivalent to providing a method transformation idea. This not only provides more methods for milling fault diagnosis but also leverages the advantages of both. The overall structure diagram of the proposed model is given below in Fig. 1.
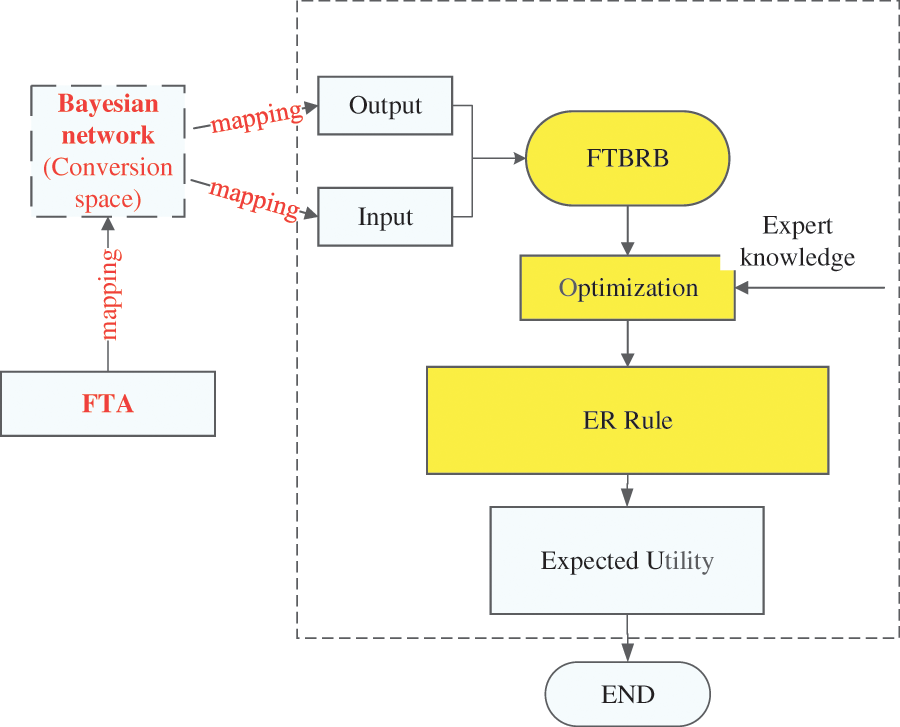
Figure 1: The overall structure of the FTBRB model
3.1 BRB Modelling Process of Milling Fault Detection Method
3.1.1 Analysis of FTA and BRB Conversion Mechanism
A fault tree connects a unit fault to a system fault, a particular tree logic diagram, and uses it to represent the relationship between unit faults and system faults. The inputs and outputs of the milling fault tree are described using logic gates and prescribed events. The empirical knowledge of experts constitutes the belief rule base, and these rules define the inputs and outputs of the BRB model. Therefore, it is not possible to combine FTA and BRB, but some method is needed to embed the FTA of the milling system into the hierarchical BRB model as a way to convert between FTA and BRB [31].
Constructing a fault tree in a bottom-up manner makes it possible to gradually analyze the causes and combinations of causes that may lead to the failure of top-level events and clarify the relationship between faults and events. When primary data are available, the probability of top-level events and the importance of events can be calculated [32,33]. The most vital causes of milling faults are tool wear and shaft vibration fault. The milling fault detection method fault tree is shown in Fig. 2.
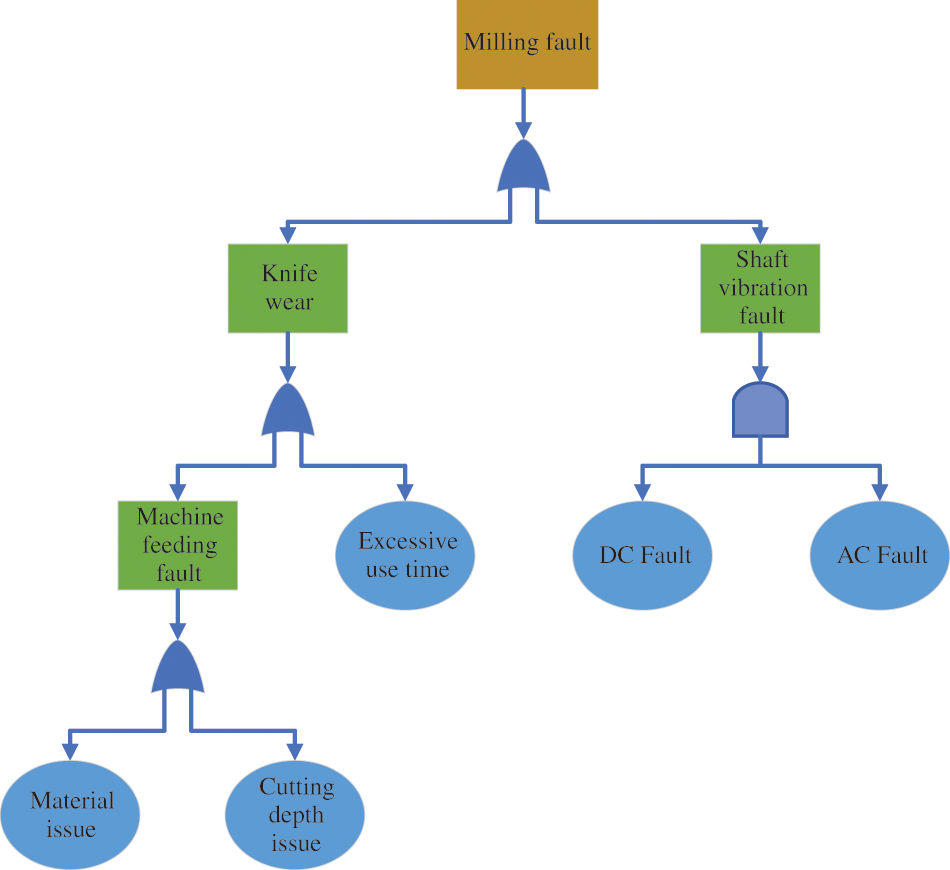
Figure 2: Milling fault detection method fault tree analysis structure diagram
➢ Correspondence between FTA and Bayesian Networks
Experts give the belief rules in BRB based on experience, and each government has its belief level to represent various types of unsure information. The Bayesian network can be used to perform probabilistic inference and is constructed by domain experts. There is a correspondence between the Bayesian network and the fault tree [34]. The transformation relationship between the fault tree and the Bayesian network is as follows: (1) The bottom event in the fault tree corresponds to the parent node in the Bayesian network; (2) The top event in the fault tree corresponds to the child nodes in the Bayesian network; (3) Logical gates in the fault tree correspond to conditional probability tables of nodes in Bayesian networks.
The mapping relationship between different logic gates and conditional probabilities can be expressed in Tables 2 and 3 below. When coupling strength is used, the “and” gate can be represented as the dependent probability table shown in Table 2, and the “or” gate can be represented as the conditional probability table shown in Table 3.
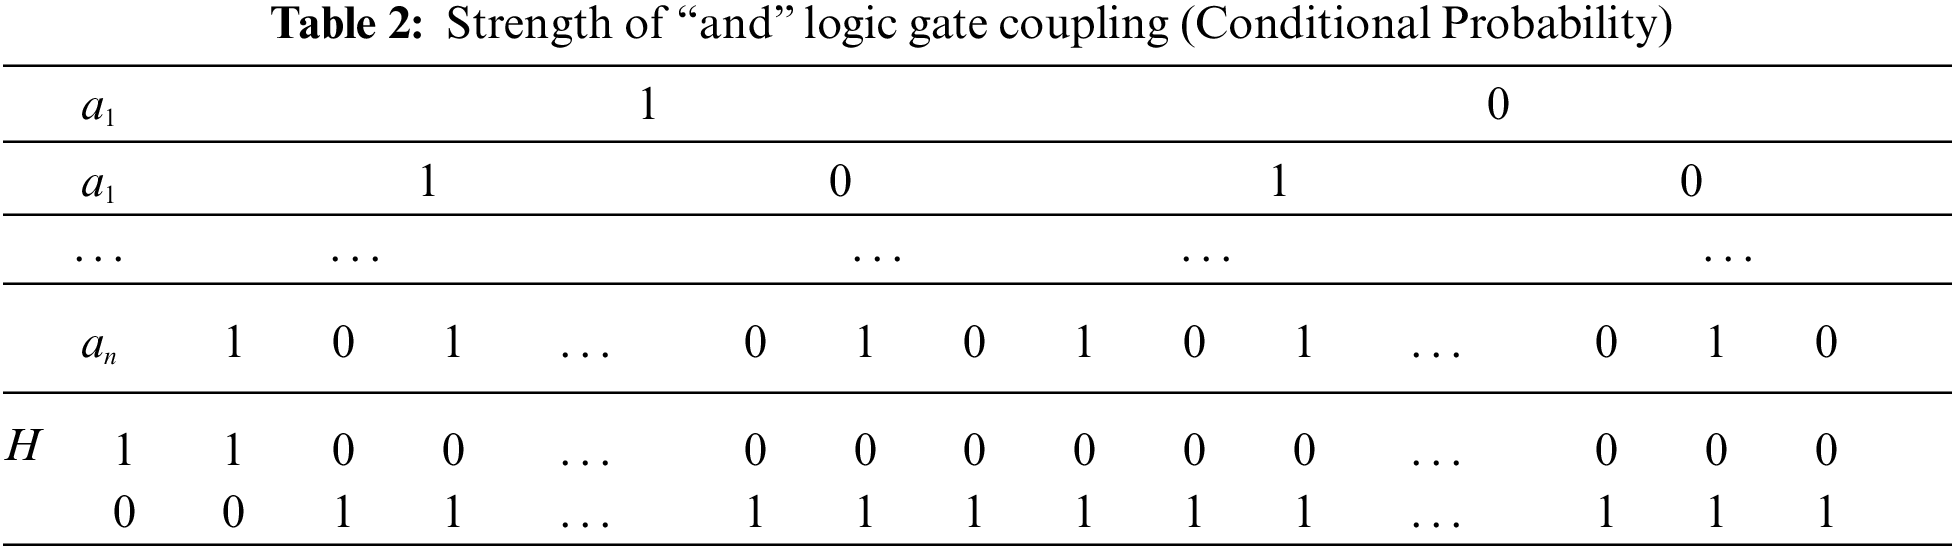
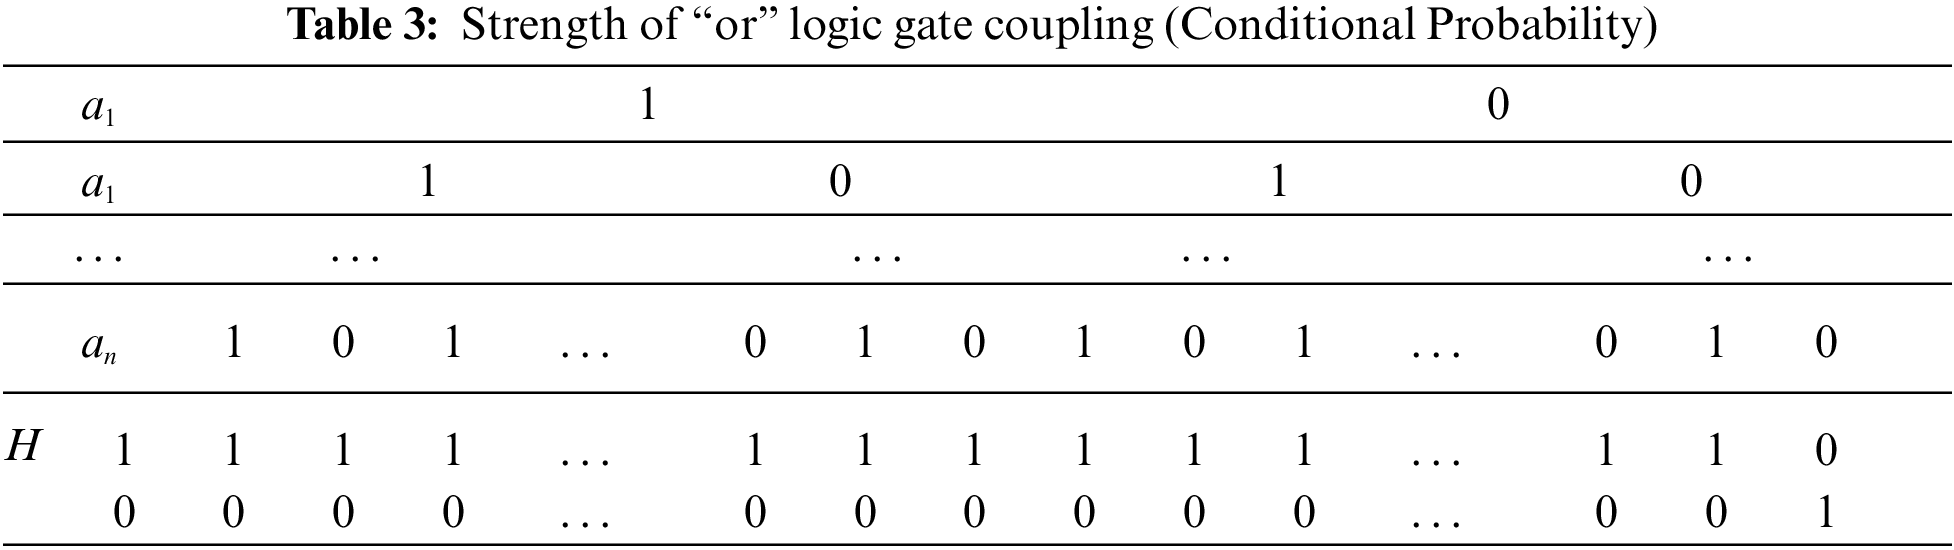
From the conditional probability table with the gate, it is clear that the top event of the output is 1 when all the input bottom events of the FTA are 1. If one bottom event is 0, then the m event probability of the output is 0. The conditional probability table of the “or” gate shows that the output top event is 0 only when all the input bottom events of the FTA are 0. If one bottom event is 1, then the output top event probability is 1. This is just the opposite of the “and” gate.
The arrow directions of different nodes in the Bayesian network correspond to the input and output of logic gates in the FTA. This process can be described as follows:
where
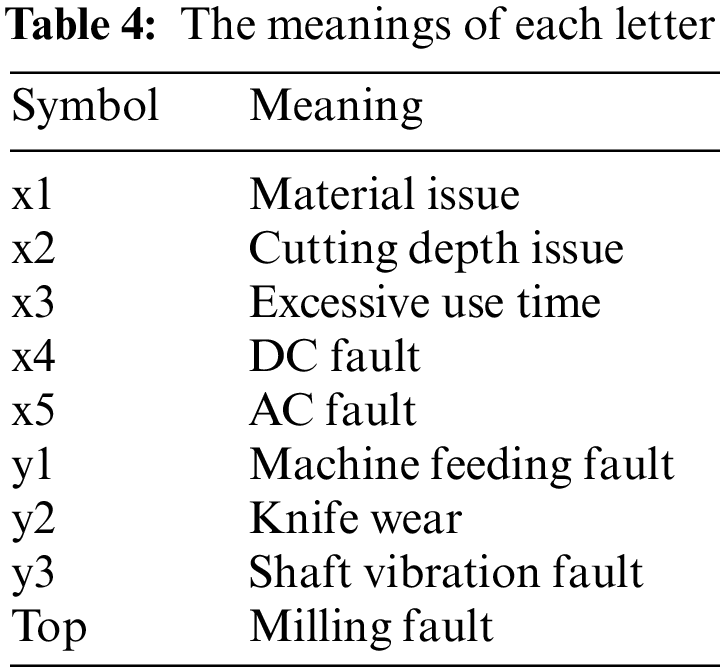
The milling fault tree uses logic gates to connect events and express the logical relationship between faults. In this paper, the fault tree only involves the “with” gate and the “or” gate. For the “and” gate, an output event occurs when all input events occur; for the “or” gate, an output event occurs whenever at least one of the input events occurs [35]. To clearly express the relationship between the milling fault tree and the Bayesian network, Fig. 3 is given, and the meaning of each symbol is explained in Table 4.
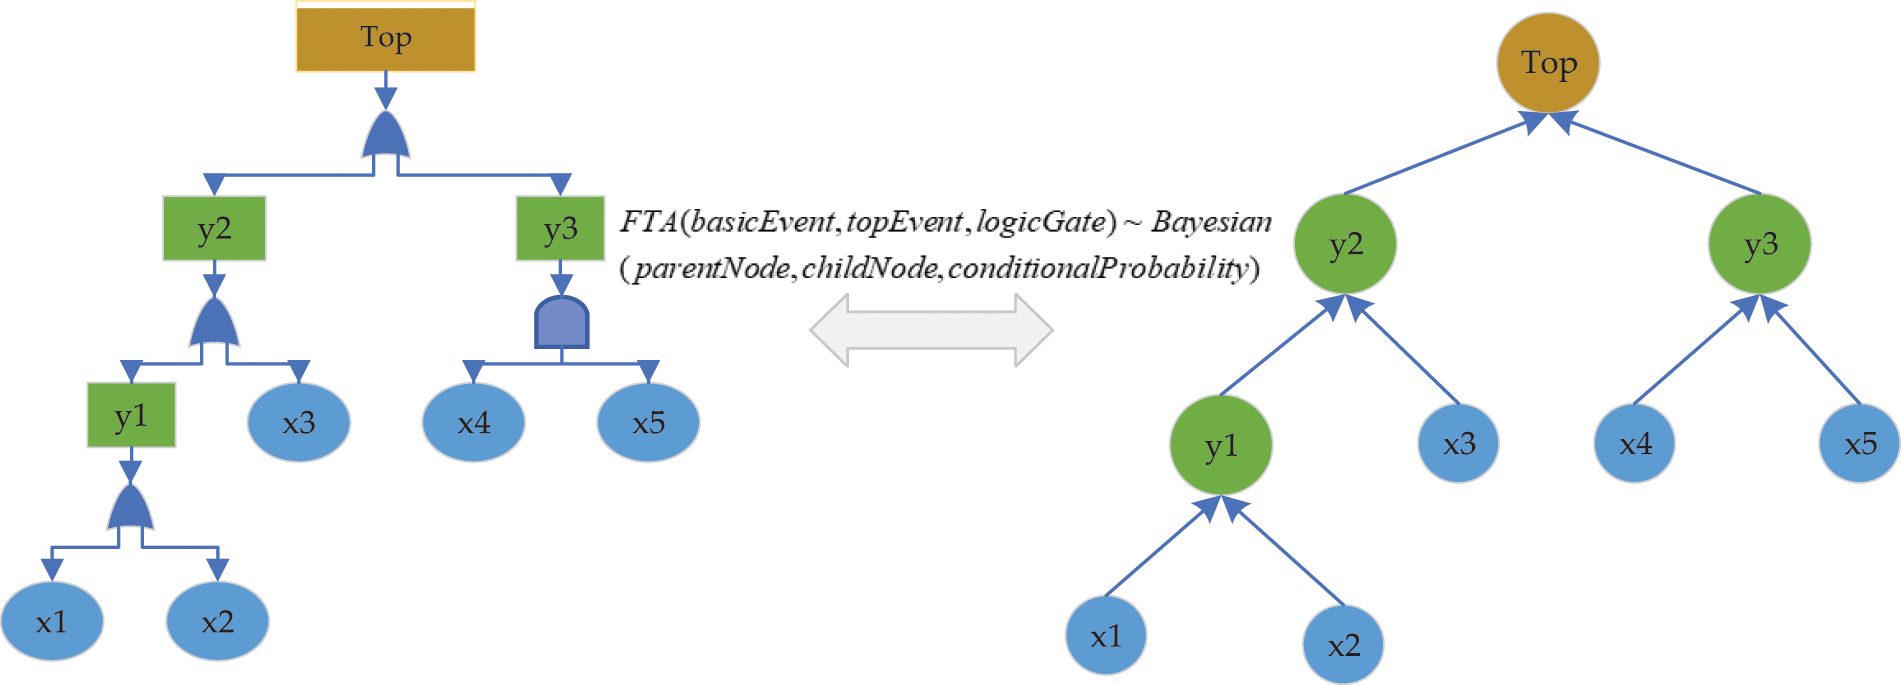
Figure 3: The conversion of the FTA and bayesian networks diagram
Both fault tree and Bayesian network have the function of inference. Generally, the fault tree is analyzed from the bottom upwards, and we can also obtain the path of the basic event and intermediate event to the top event [36,37]. However, let’s build it from the top. This allows us to analyze the top event step by step to find the primary and intermediate events that trigger the full event and thus capture the cause or combination of reasons that lead to the top event. This allows for a more comprehensive analysis of the causes of faults. The Bayesian network not only combines these functions but allows for quantitative analysis.
Table 4, y1, y2, y3, and Top represent four fault types. The proposed model can be output as a series of belief distributions, through which the results can be evaluated as different levels of support.
➢ Correspondence between Bayesian Networks and BRB
The BRB knowledge base consists of several belief rules constructed by experts based on their experience, and its inference engine is ER. The literature [38] shows that Bayesian inference can be correlated with ER, which assigns weight to reliable but uncertain information and describes the inference relationship between Bayesian and ER rules [38]. As a result, it is known that conditional probability can be regarded as the belief level when individual events have mutually independent conditions. Therefore, it can be concluded that Bayesian inference converts to ER inference and the inference engine of BRB are ER, which is one of the contents in BRB. Therefore, Bayesian inference and BRB inference can be converted to produce a mapping relationship. Bayesian inference can transform ER to BRB, and the BRB belief can be derived from the conditional probability in the Bayesian network. The mapping relationship between the Bayesian network and BRB is as follows: (1) The input of BRB corresponds to the parent node in the Bayesian network; (2) The Bayesian inference can transform ER to BRB; (3) The belief of BRB can be derived from the conditional probability in the Bayesian network; and (4) BRB belief rules correspond to Bayesian conditional probability distributions. This process can be described as follows:
where
After the above analysis of the conversion theory of FTA to the Bayesian network and the conversion theory of the Bayesian network and BRB, the conversion mode of FTA to BRB can be obtained as follows: (1) The bottom event or basic event of FTA corresponds to the input of the prerequisite attribute of BRB; (2) The top event of FTA corresponds to the resulting output of BRB; (3) The logic gate in FTA corresponds to the belief rule of BRB. The complete transformation theory diagram is shown in Fig. 4.
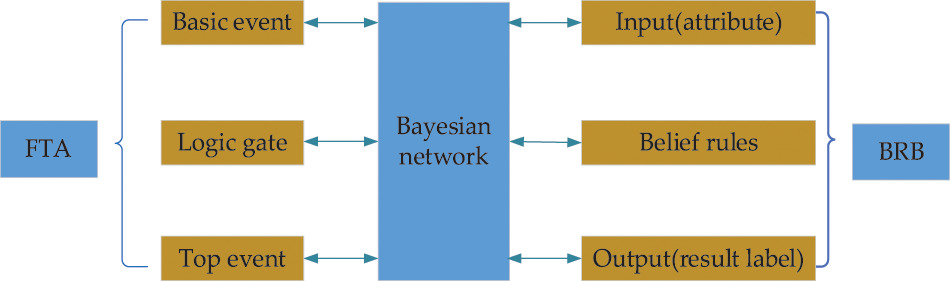
Figure 4: Milling fault detection method fault tree analysis structure diagram
In the milling fault detection method, a logic block diagram (fault tree) is combined to analyze the factors that may fail during the experiment, such as material problems, depth of cut problems, and excessive use time processes. Fault tree analysis determines the critical factors that cause faults by calculating the probability of failure for each event. It thus determines how to enhance the reliability of the system next. Integrating FTA into the hierarchical BRB model is a critical and challenging point in the modeling process.
3.1.2 Conversion Rules from FTA to Hierarchical BRB
From the above analysis, it is clear that the logical gates in the FTA correspond to the conditional probability distributions of the corresponding nodes in the Bayesian network. The related co-analyses of the FTA and BRB conversion mechanism conversion rules are added for different logic gates. This section describes the conversion rules from FTA to hierarchical BRB.
(1) Probabilistic Representation of the Conversion Rule Corresponding to Different Logic Gates
(2) Describe the BRB Belief Rule and the Corresponding Rule Activation Weight of the Logic Gate
In BRB, the importance of attributes is expressed by attribute weights, and the importance of rules is described by rule weight [39]. This section describes the conversion rules corresponding to different logic gates and the activation rule weights corresponding to the conversion rules.
➢ In the “and” logic gate, the expression of the BRB belief rule is as follows.
The above letters are described in detail in Eq. (1). It should be noted that the corresponding symbols under the “and” logic gate are
where
➢ In the "and" logic gate, the expression of the BRB belief rule is as follows.
In the “or” gate case, the activation weight is calculated. The matching rule-matching degree is calculated as shown in Eq. (10). The corresponding symbol under the “or” logic gate is
3.1.3 Construction of the Hierarchical BRB Model
How to build a reasonable hierarchical BRB model is the focus of this paper. BRB is an expert system with evidence reasoning (ER) as the reasoning machine, which can be applied to the complex nonlinear relationship between input and output. The BRB has good performance in dealing with small sample data. Therefore, using BRB models in milling fault detection methods is effective [40,41]. However, milling fault detection methods are composed of complex and too many indicators, and the problem of combinatorial explosion quickly arises when applying BRB for modeling, which affects the final results of experiments. Therefore, hierarchical BRB models are usually used to avoid this situation. The hierarchical BRB model is constructed from the bottom layer, and the basic event is combined as input. The output generates the combined result (intermediate event), which is then used as input for the next layer, and the layers have recurred until the top event is output. Layered BRB models the experiment based on the overall structure, making the investigation more efficient. Compared with the traditional BRB, the hierarchical BRB effectively reduces the redundant rules and avoids combinatorial explosion.
The rules in hierarchical BRB are as follows.
The hierarchical BRB model of the milling fault detection method can be divided into three layers and four subsystems. The output of the basic event of the bottom subsystem can be used as input to the next layer of subsystems. The bottom input event of the first subsystem is the material and depth of cut, and the machine feed fault is output through the “and” gate. The machine feed fault and time of use are inputs to the second subsystem, and the output is tool wear through the “and” gate. The third subsystem has a DC fault and an AC fault as input events, and a shaft vibration fault is an output through the “or” gate. Finally, tool wear and shaft vibration faults are output through the “and” gate for milling faults. The hierarchical BRB can peel down the milling faults in layers to eliminate the cause of the fault and find the event or component causing the milling fault. The milling fault detection hierarchical model is shown in Fig. 5.
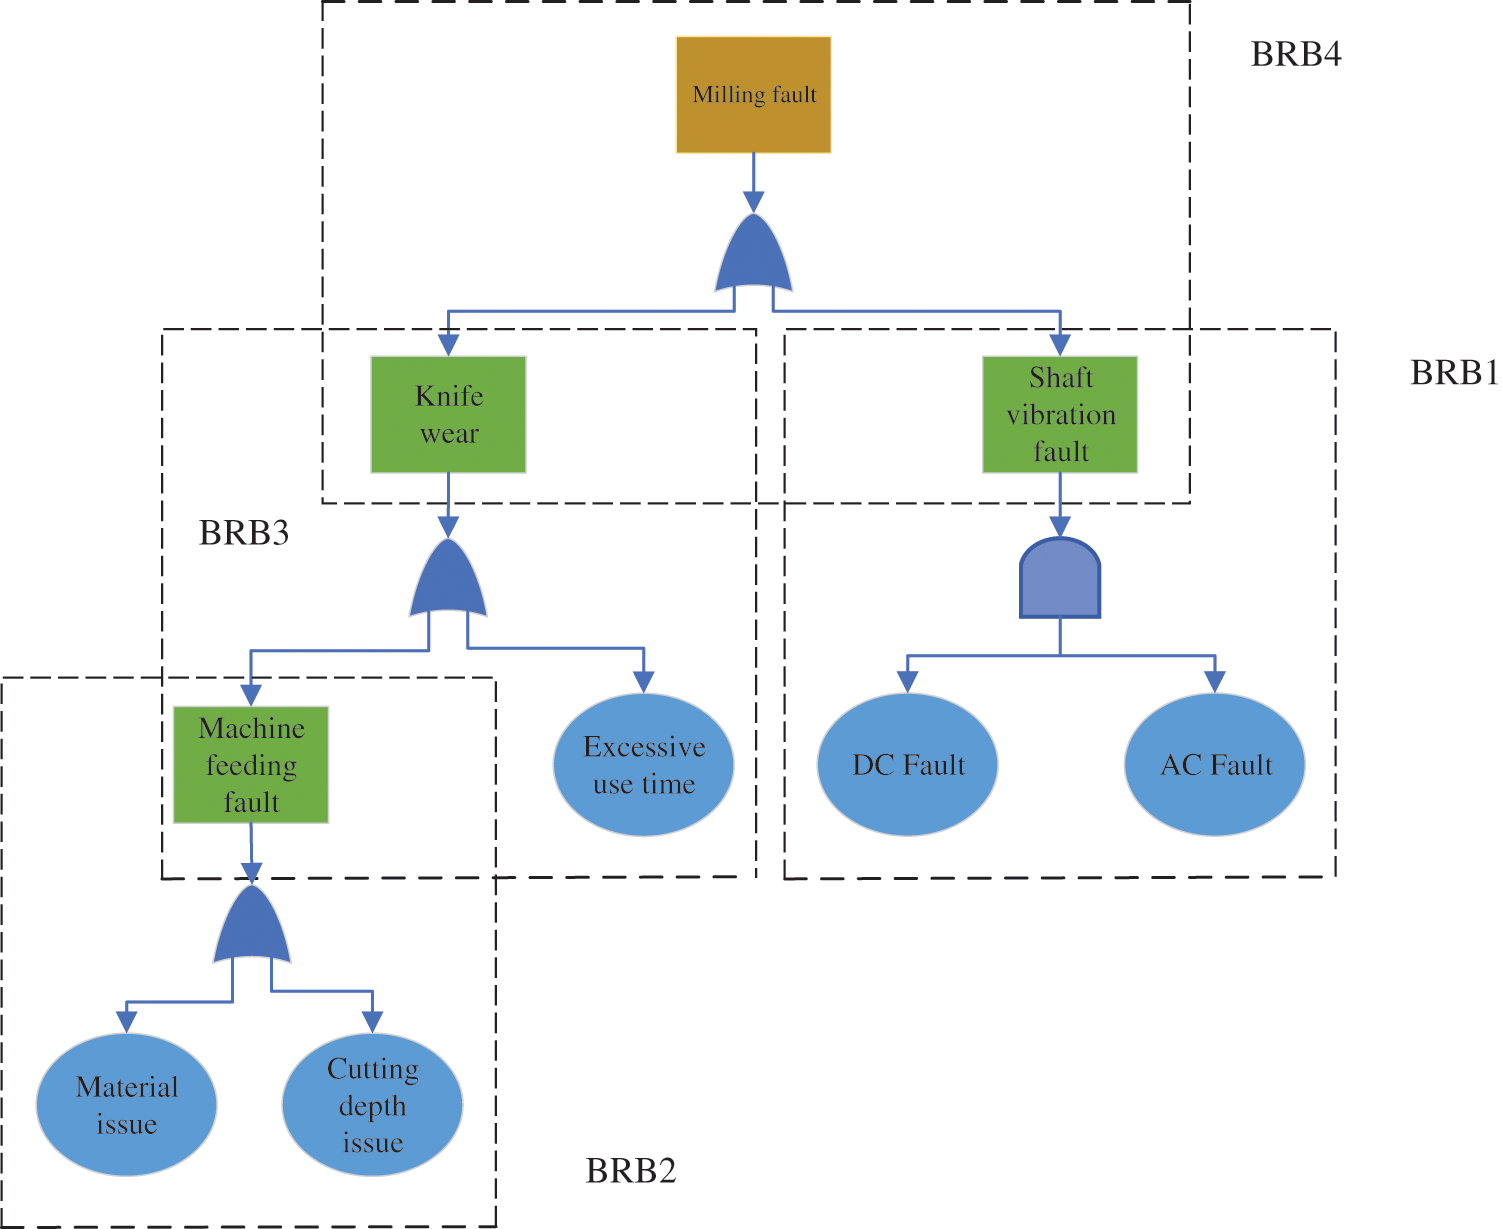
Figure 5: Milling fault detection hierarchy model
3.2 BRB Reasoning Process of Milling Fault Detection Method
Based on the above analysis, a hierarchical BRB model of the milling fault detection method was developed. A Bayesian network is used to connect the FTA with the BRB. Since ER is the reasoning machine of BRB, ER can reason about each subsystem in the BRB model to obtain the result of milling fault detection. The output of the hierarchical BRB model is converted from the input information through the “and” gate and the “or” gate. The inference process is as follows.
Step 1 Initialization. Construct the belief level of the initial rule from the expert knowledge base.
Step 2 Calculate the match between input values and referential values. The calculation formula can be found in Eq. (10).
Step 3 Calculate the activation weights of the rules. The calculation formula in “and” gates is shown in Eq. (11). The calculation formula in the “or” gate is shown in Eq. (13).
Step 4 Calculate the belief level of the milling fault detection method results.
where
Step 5 Output obtained from the utility formula.
where
3.3 Model Optimization of BRB for Milling Fault Detection Method
This part introduces the BRB model for milling fault detection, shown in Fig. 6.
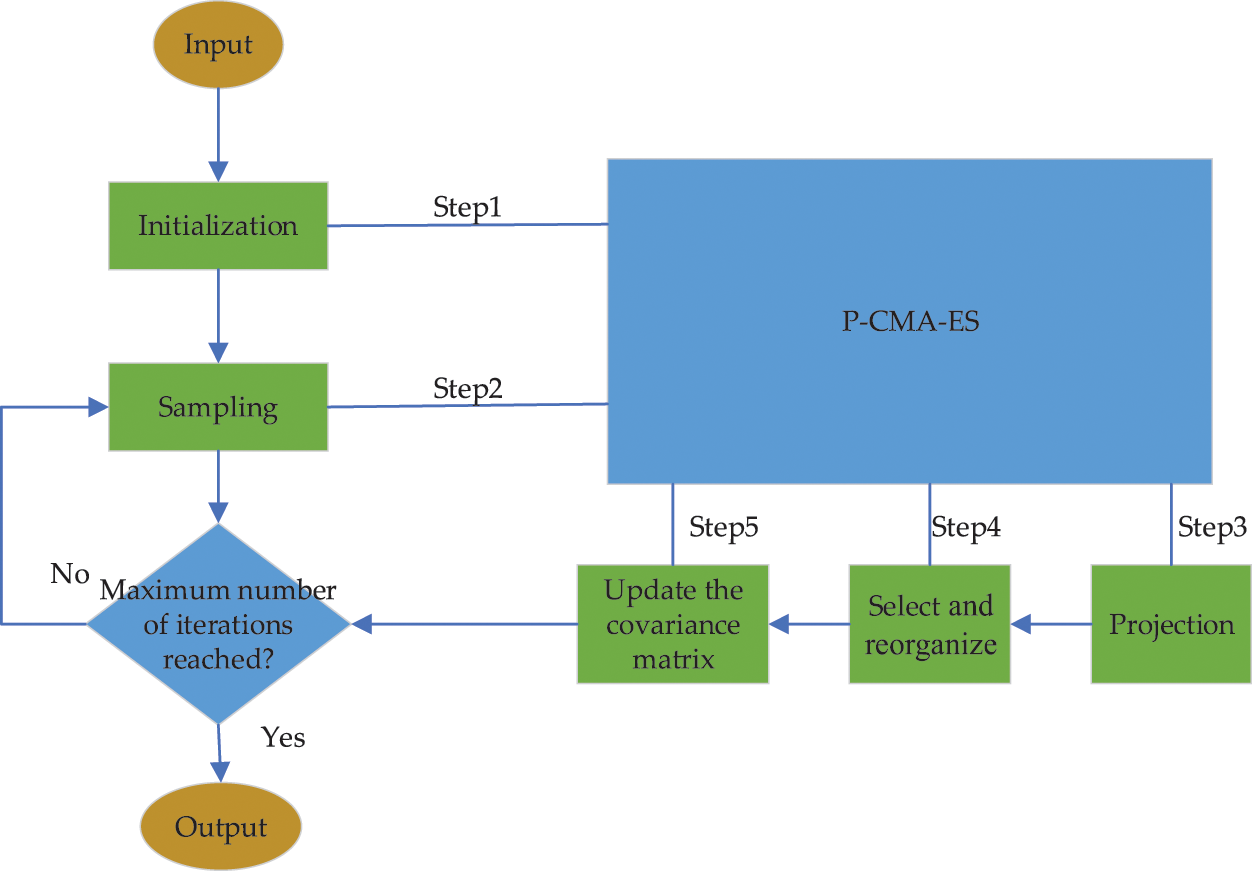
Figure 6: BRB model optimization process
During the experiments, the initial parameters of the hierarchical BRB model were given empirically by the experts, so uncertainties still existed. Therefore, further optimization of the initial data is required after the BRB process. To make the results obtained by the milling fault detection method more accurate, this section uses the P-CMA-ES algorithm to optimize the parameters [42,43]. The P-CMA-ES parameter optimization mechanism is introduced below.
where
The above equation represents the average error of the prediction results. Where
Step 1 The setting of initial parameters
Step 2 Sampling
Calculate the expected value of the solution of the optimal subgroup, that is, its average value, and the result is usually distributed. The calculation is as follows.
In the
Step 3 Projection
where
Step 4 Select and reorganize.
The optimal subgroup is filtered, and the solution set is calculated. The weight of the
Step 5 Update the covariance matrix.
where
The P-CMA-ES algorithm is an improved algorithm based on the original CMA-ES algorithm, which is an excellent global optimization algorithm. In this paper, this algorithm can successfully solve the constraint problems in the BRB model and effectively optimize the experimental results [44].
Fault detection has an essential application in milling faults. Experts and scholars have valued the reliability of the data, and many experts and scholars have tested mills for defects in terms of parts, but only some have profiled the data. In a milling system, many factors can cause the system to malfunction, such as usage time, feed rate, and the degree of wear on the tool’s face. Therefore, when a milling system fails, it is challenging to determine which component or parts have failed. While FTA has traceability, the FTA method is used to obtain the failure factors and a summary of the data it collects; hierarchical BRB can analyze conflicting data, describe the global uncertainty and ensure the reliability of the data. Therefore, a process-traceable and result-interpretable model can be obtained by combining FTA and hierarchical BRB to construct a model through the transformation mechanism. In this way, in experiments, it is possible to trace the fault factors from the fault perspective and to study which faults may be caused by the fault factors.
To verify the effectiveness and performance of the above hierarchical BRB, this section uses the shaft vibration sub-fault tree in milling faults as the object of study. When DC or AC power fails, shaft vibration may die in this part. Selecting the correct dataset is also an essential part of the experiment, and a suitable dataset can better demonstrate the experimental results. The data set used for the experiments was collected from the laboratory platform of the literature [45]. To display the effectiveness of the milling fault detection method based on fault tree analysis and belief rule base, a milling dataset with eight attributes is investigated in this paper, which includes material, depth of cut, machine feed fast and slow, time, axis vibration fault, tool damage degree, DC and AC. One hundred sixty-seven data items are included in the dataset, of which 120 are training samples and 47 are test samples. The detailed fault detection indicators and fault types are shown in Table 2. The data are normalized after the initial parameters are selected when training the dataset.
In this subsection, a case study is selected for presentation. As a typical complex electromechanical system, the overall health status of the milling system is closely related to the level of several components. FTBRB, as a general fault detection and diagnosis model, is also applicable to the fault detection of the overall milling system. However, the difference in the fault detection and diagnosis process is mainly reflected in the following two aspects: (1) The model structure is more complex. Before the FTBRB model is used to evaluate the health status of the overall milling system, it is necessary to distinguish different faults and fault indicator levels. The fault detection and diagnosis system, as shown in Fig. 5, is described hierarchically. On this basis, the initial BRB model of the overall milling system is constructed based on expert knowledge and practical management experience. (2) The model has more parameters to be optimized. As the number of fault indicators in the fault detection index system of the overall milling system increases, the number of parameters to be optimized in the FTBRB model will also increase. Maintaining model interpretability across a wider range of indicators is also a focus of subsequent research.
4.1 Establishment of FTBRB Model for Milling Fault Detection
4.1.1 Construction of Hierarchical BRB Model
A preliminary sub-fault tree for shaft vibration faults was constructed in the above manner to clarify the logical relationships between inputs and outputs and the root cause of shaft vibration faults. The sub-fault tree for the shaft vibration fault is shown in Fig. 5. A small portion of the box in Fig. 5 was selected as a case study for this experiment. In Fig. 5, the DC Fault and AC Fault as the BRB inputs correspond to the FTA’s bottom event. Shaft vibration fault acts as the output of the BRB, corresponding to the top event in the FTA. These attributes and results were normalized to between 0 and 1 in the experiment to represent the failure probability of the bottom event and the occurrence probability of the top event.
4.1.2 Constructing the Initial Belief Rule Base
The initial values in the hierarchical BRB are constructed through the expert knowledge base with the following construction rule. The probability of fault occurrence is evaluated as the belief level of class, the belief level of course where
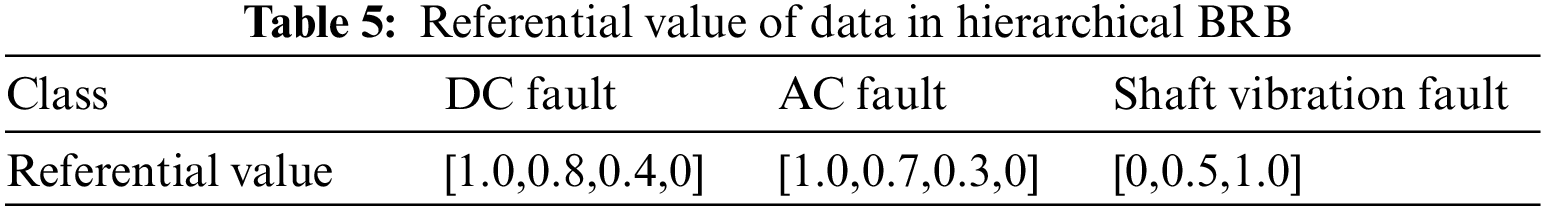
4.1.3 Setting the Referential Point and Value of the Referential Point
When constructing the hierarchical BRB model, it is necessary to set appropriate referential values. To ensure that the program can run successfully and efficiently, four referential points and referential values are set for each attribute in this paper, as shown in Table 5. The two prerequisite attributes’ corresponding referential levels represent high, medium, and low levels. The corresponding referential levels are excellent, medium, and poor, which reflect the probability of failure. The following is an example. In BRB2, the DC Fault and AC Fault are used as two basic events and prerequisite attributes for the input of the FTBRB model. The shaft vibration fault is used as the top event and as the FTBRB model’s output label.
4.2 Training and Optimization of FTBRB Model for Milling Fault Detection
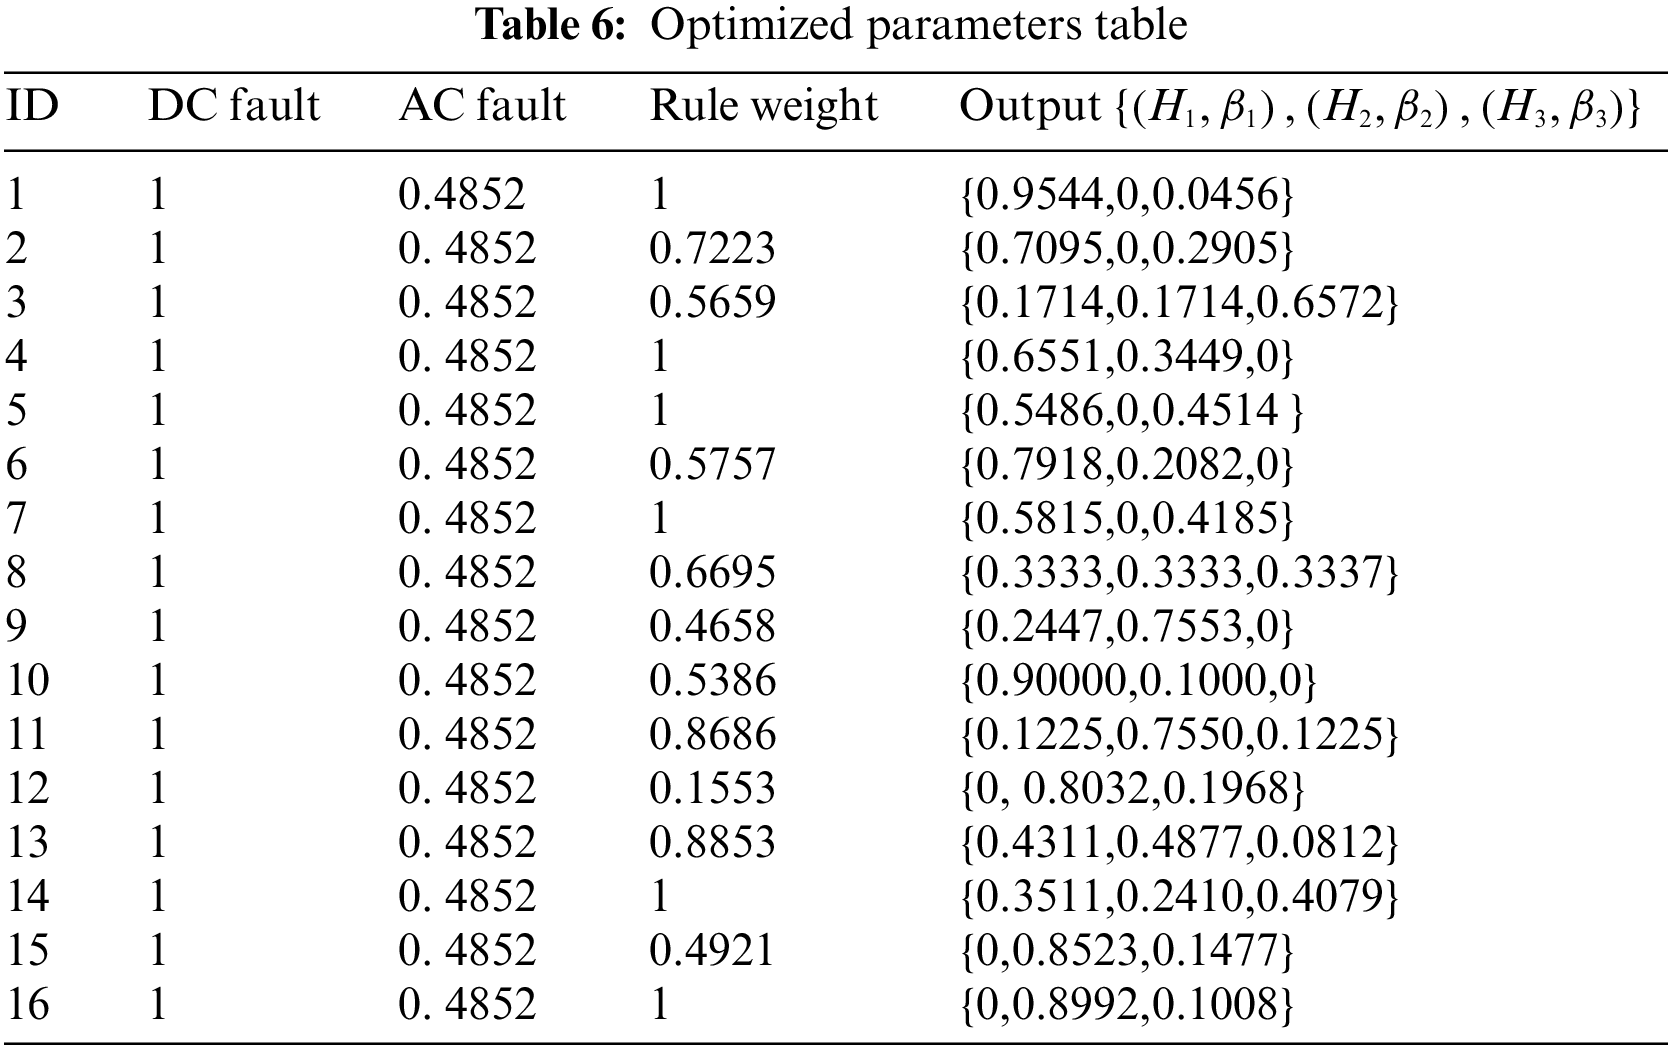
4.2.1 Optimization of FTBRB Model Parameters and Results
The initial parameters of the hierarchical BRB model are given by experts, who need to be clearer and more knowledgeable. When using the initial hierarchical BRB model for milling fault detection, it may be influenced by the surrounding environment and reduce the evaluation accuracy of the model. Therefore, the initial parameters need to be adjusted, and the output accuracy of the milling fault detection model needs to be optimized. This experiment uses the P-CMA-ES optimization algorithm to make the initial parameters more reasonable and the experimental results more accurate. The optimized parameters are shown in Table 6, where the rule weight denotes the optimized rule weight, and the Output denotes the optimized belief level.
4.2.2 Experimentally Fitted Images
The milling dataset is used to validate the experimental data, and DC and AC are used as the model’s inputs. A comparison of the experiments' actual values and the constructed model's output is given in Fig. 7.
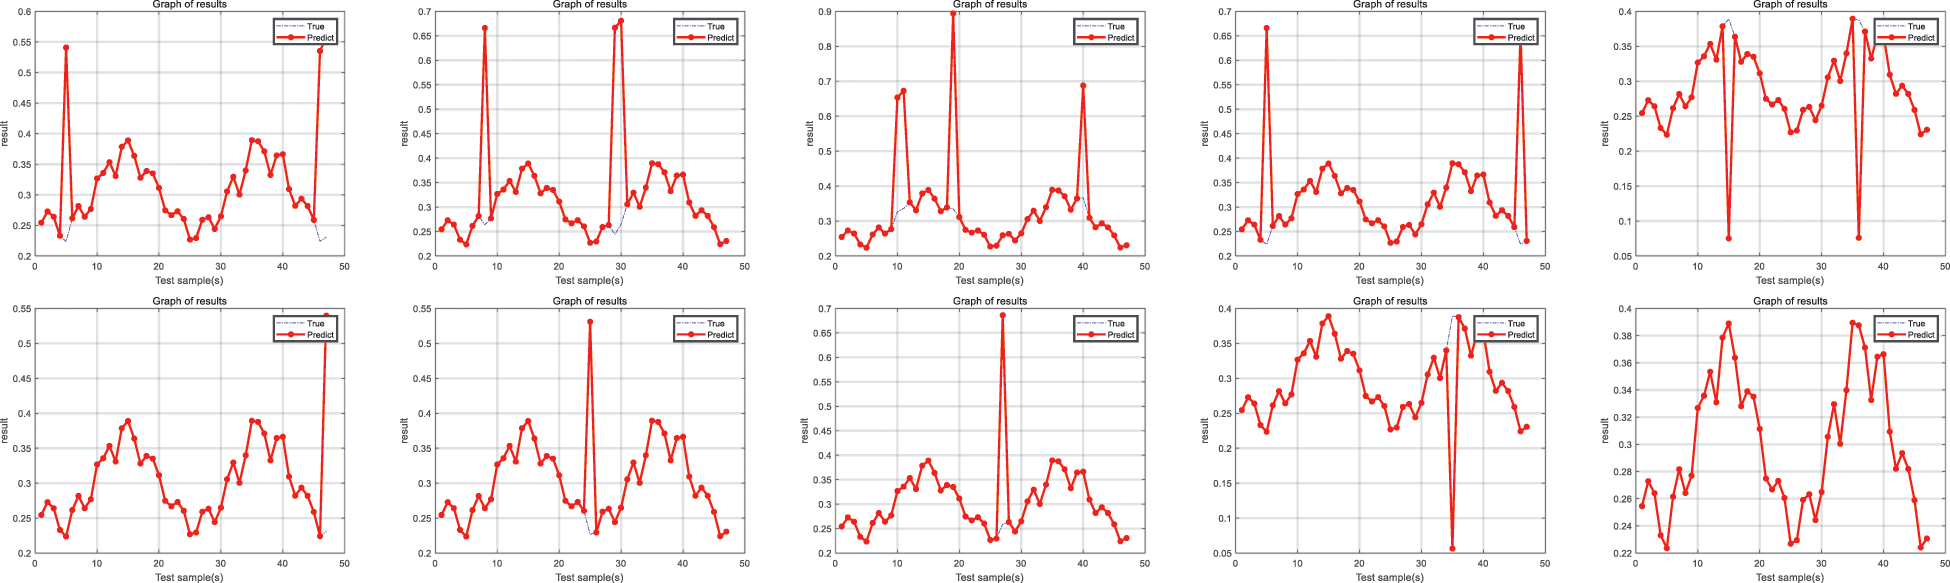
Figure 7: Comparison of the fundamental values and the output values of the constructed model
As seen in Fig. 7, the actual results of this experiment are in good agreement with the predicted results. The fluctuation range of the experimental accuracy can be obtained through the investigation. The accuracy of this experiment reaches 96.17%, which indicates that the new method proposed in this paper successfully achieves the desired results and shows that the hierarchical BRB model established at this time works well.
Comparative experiments were conducted to demonstrate the proposed method's advantages; more comparative. In this part, backpropagation neural networks (BPNNs), extreme learning machines (ELMs), and radial basis functions (RBFs) were selected as three other groups of comparison experiments. The fitted images of these three comparison experiments were drawn, and the average accuracies of the experimental results of these methods were 86.81%, 83.62%, and 82.23%, respectively.
The results of the comparison experiments show that the average accuracy of the experimental results of the ELM, BPNN, and RBF methods is low reasonable, which are 86.81%, 86.32%, and 82.23%, respectively. However, although ELM, BPNN, and RBF can detect milling faults, the proposed method in this paper still needs to be interpreted. The accuracy of the new method proposed in this paper is more guaranteed when applied to milling fault detection. Meanwhile, it is shown that the hierarchical BRB model achieves good results. Ten experimental fitted images of BPNN, ELM, and RBF are demonstrated in Figs. 8–10.
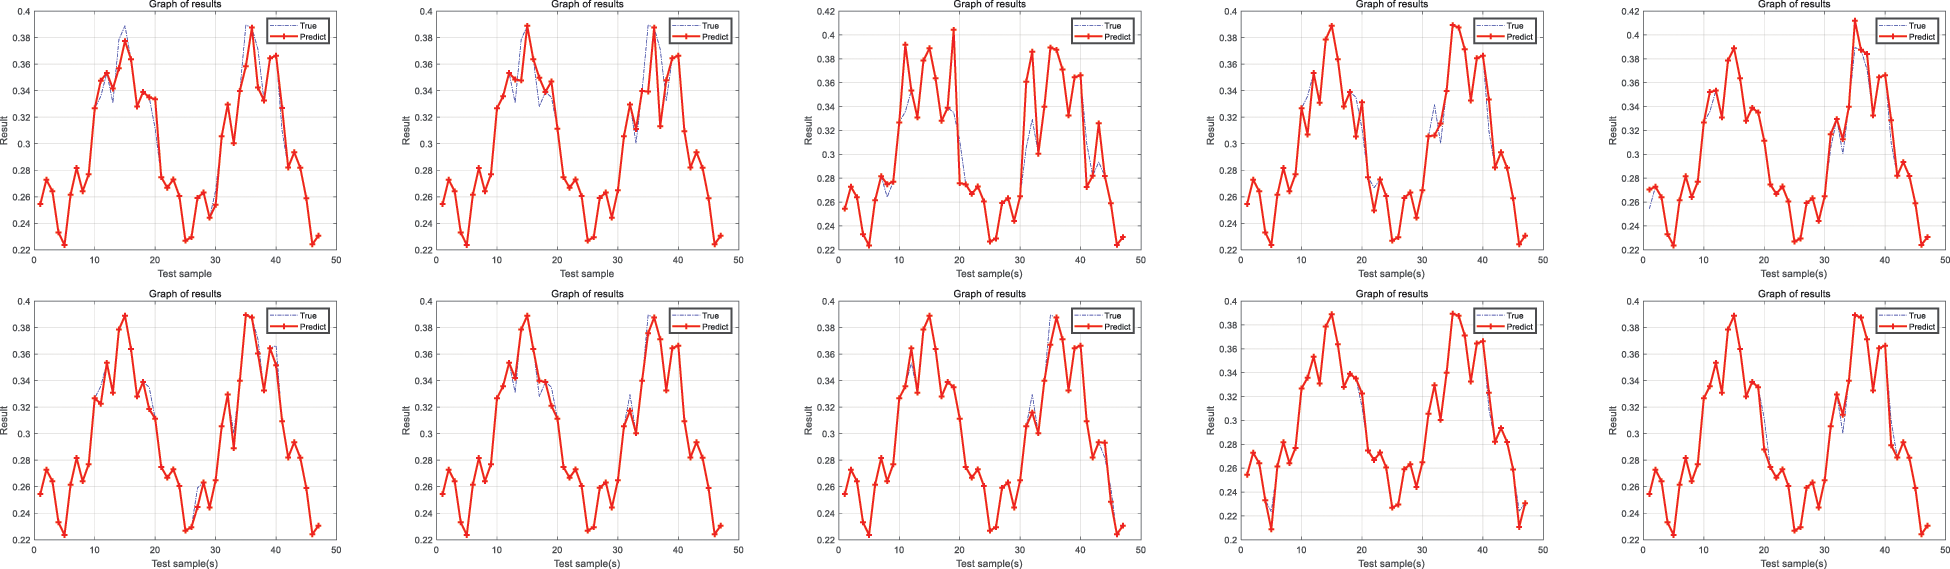
Figure 8: BPNN experimental fit image
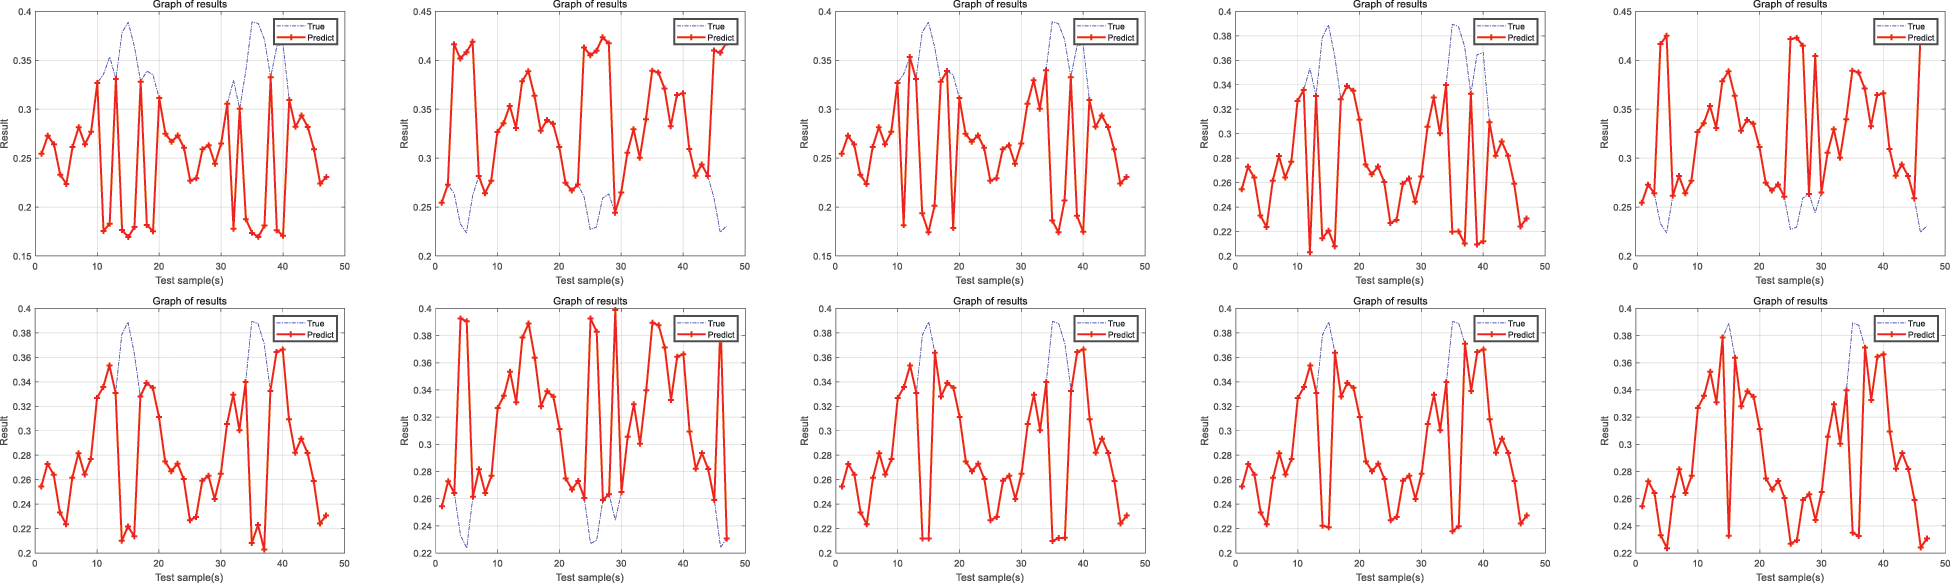
Figure 9: ELM experimental fit image
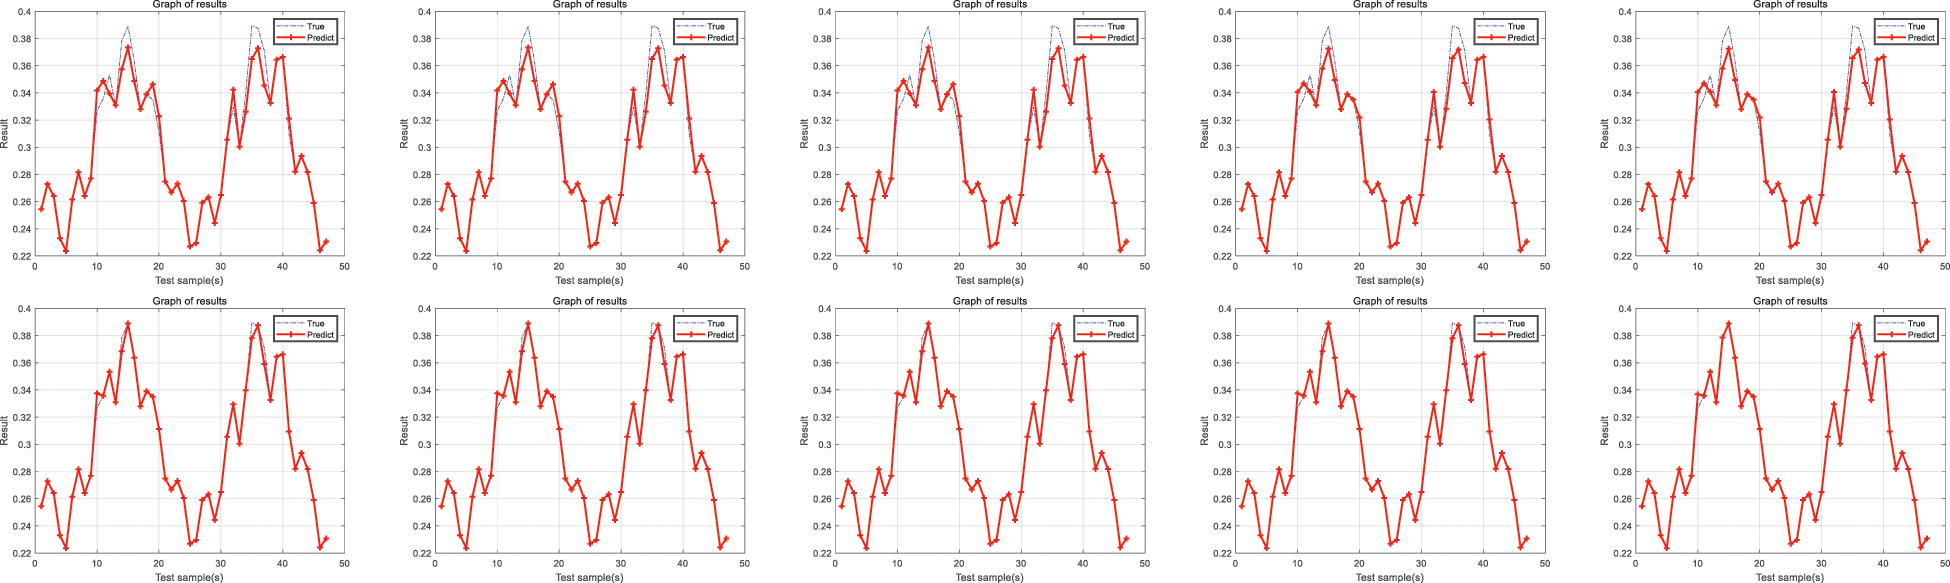
Figure 10: RMF experimental fit image
The BPNN method was performed for ten experiments, and the average accuracy obtained was 86.81%.
The ELM method was performed for ten experiments, and the average accuracy obtained was 83.67%.
The RMF method was performed for ten experiments, and the average accuracy obtained was 86.81%. To show the comparison results more intuitively and model reflect the FTBRB model’s advantages, the accuracy of each model is presented in Table 7. The prediction curves are combined to make the comparison more intuitive, as shown in Fig. 11.
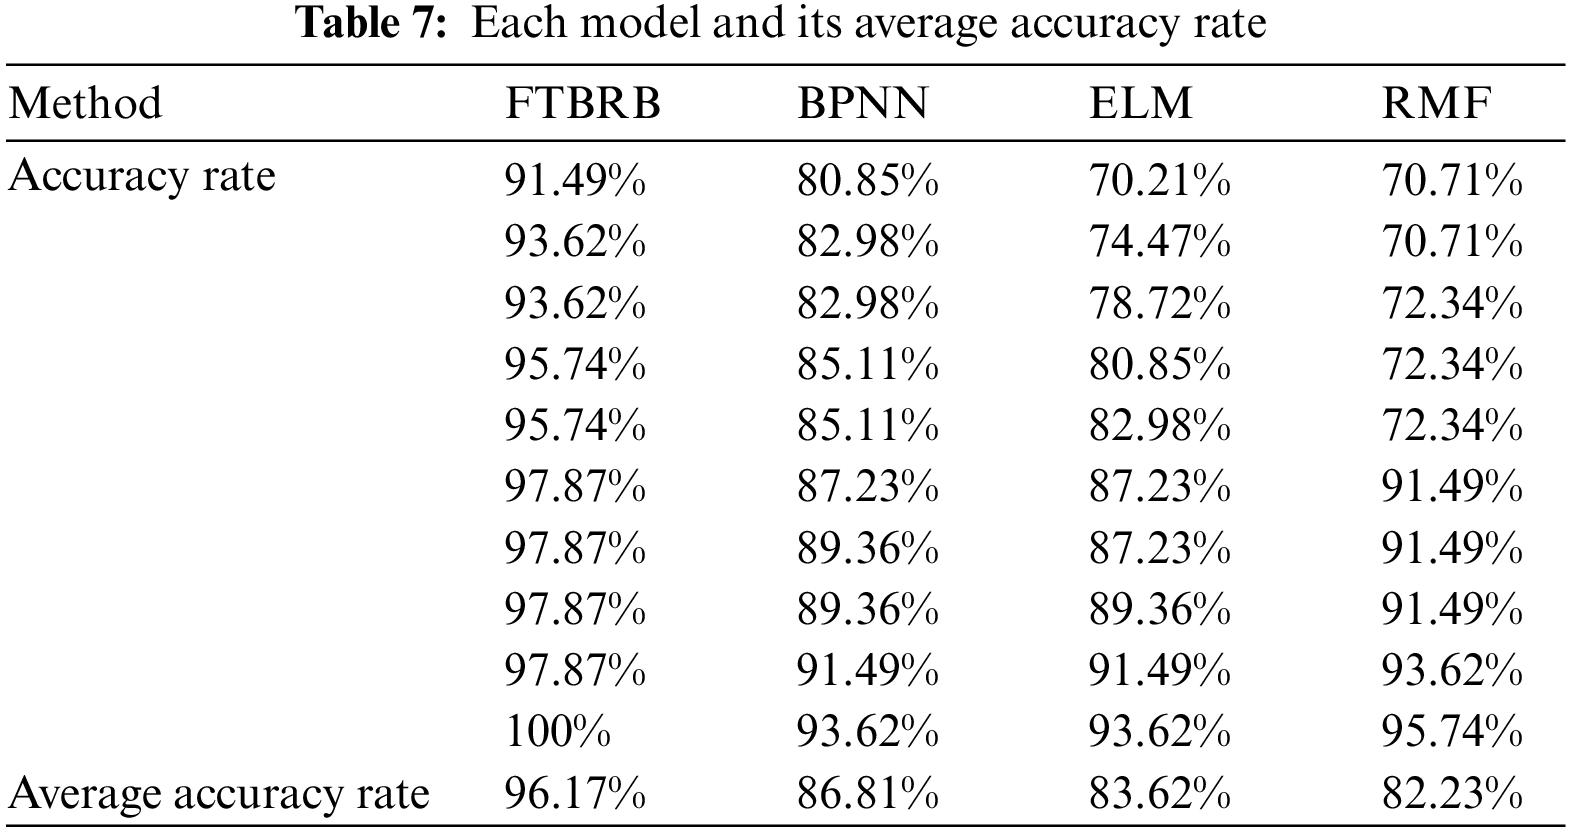
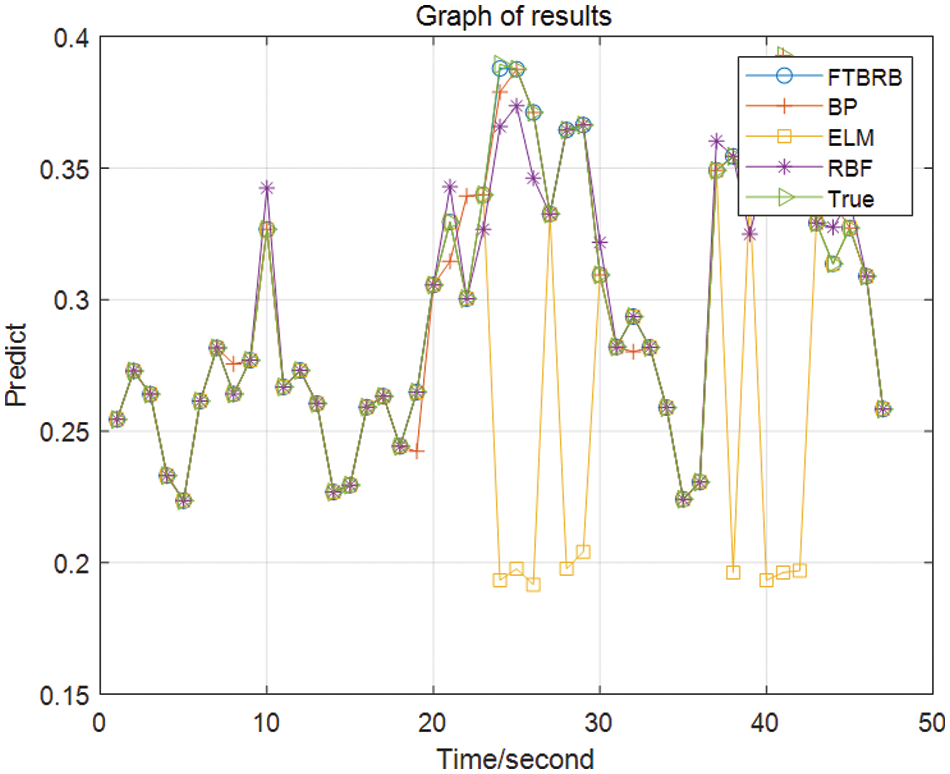
Figure 11: Prediction curve comparison image
This experiment demonstrates the feasibility of applying the hierarchical BRB in combination with FTA for milling fault detection. Three comparative experiments verify the superiority of using the hierarchical BRB model. The accuracy of the method described in this paper is improved when compared with the BPNN, ELM, and RBF methods. More notably, the accuracy of the models used in these three methods reached approximately 90%, while the accuracy of the model proposed in this paper still improved. Thus, it can be inferred that among the four methods applied to milling fault detection proposed in this paper, the basic fault tree analysis and the hierarchical BRB milling fault detection method achieved more satisfactory results in the experiments. The experimental results outperform the other three methods regarding image fit and detection accuracy, proving this experiment’s feasibility.
The FTBRB model proposed in this paper has a better image fit and higher accuracy than the three models in the comparison experiments for the following reasons. First, the FTBRB model introduces a fault tree and an expert knowledge base, which can better trace the faults and solve model uncertainty, which the other three models cannot. Second, the FTBRB model can ensure the high accuracy of the model with small samples, while the accuracy of data-driven BPNN, ELM, and RBF models depends on the data samples. Third, the modeling and inference process of the FTBRB model is transparent and explainable. The FTBRB embeds the FTA mechanism into the hierarchical BRB model, making the modeling process more reasonable. In contrast, the inference process of data-driven ELM, BPNN, and RBF models must be interpretable. Fourth, the FTBRB model can handle qualitative and quantitative information, while the data-driven BPNN, ELM, and RBF models cannot handle qualitative information.
The experiments conducted in this paper have achieved the expected results. The comparative experiments demonstrate the feasibility and effectiveness of embedding the FTA into the hierarchical BRB model. Therefore, the milling fault detection method based on fault tree analysis and hierarchical BRB can be applied to reality, and good feedback can be obtained.
A new fault detection model based on fault tree analysis (FTBRB) is proposed for the problem of complex modeling of the milling fault detection model. The model accurately sorts out the logical relationships among the fault indicators of the milling system and embeds its mechanism into the expert knowledge base of the BRB. This is crucial to improve the accuracy of the milling fault detection model.
The FTBRB model achieves better results regarding model accuracy and inference interpretability. (1) FTBRB extends the expert knowledge base by FTA, which improves the ability of the model to describe the problem and applies to the case of small sample data; (2) the model is constructed based on BRB and described by if-then rules, which can trace the cause of the fault, and the results are interpretable; (3) the FTBRB model uses the training sample data to achieve the optimization of parameters, which ensures the accuracy the model’s; (4) unlike traditional data-driven methods, the model has high accuracy.
When the number of milling fault indicators and referential points increases substantially, it may cause the problem of the complex network structure of the FTBRB model. Based on the FTBRB model proposed in this paper, future research can also be conducted in the following two aspects. (a) Research on the theoretical transformation of fuzzy fault trees and interval BRBs. (b) Research on milling fault diagnosis based on interpretable BRB.
Funding Statement: This work was supported in part by the Natural Science Foundation of China under Grant 62203461 and Grant 62203365, in part by the Postdoctoral Science Foundation of China under Grant No. 2020M683736, in part by the Teaching reform project of higher education in Heilongjiang Province under Grant Nos. SJGY20210456 and SJGY20210457, in part by the Natural Science Foundation of Heilongjiang Province of China under Grant No. LH2021F038, and in part by the graduate academic innovation project of Harbin Normal University under Grant Nos. HSDSSCX2022-17, HSDSSCX2022-18 and HSDSSCX2022-19, in part by the Foreign Expert Project of Heilongjiang Province under Grant No. GZ20220131.
Author Contributions: X.C. and M.L. contributed equally to this work. Conceptualization, X.C. and M.L.; methodology, X.C. and M.L.; writing—original draft preparation, M.L.; software, X.C.; validation, X.C., M.L. and W.H.; formal analysis, X.C. and M.L; investigation, H.Z.; data curation, H.Z.; writing review and editing, X.C. and W.H.; visualization, M.L.; supervision, W.H. and H.Z. All authors have read and agreed to the published version of the manuscript.
Conflicts of Interest: The authors declare they have no conflicts of interest to report regarding the present study.
References
1. P. Y. Hao, D. L. Zhu, L. B. Yan, Q. S. Qin, Y. D. Cui et al., “Milling chatter detection with WPD and power entropy for Ti-6Al-4V thin-walled parts based on multi-source signals fusion,” Mechanical Systems and Signal Processing, vol. 177, no. 1, pp. 109225, 2022. https://doi.org/10.1016/j.ymssp.2022.109225 [Google Scholar] [CrossRef]
2. D. L. Zhu and F. C. Liu, “Recent progress of chatter prediction, detection and suppression in milling,” Mechanical Systems and Signal Processing, vol. 143, pp. 106840, 2020. https://doi.org/10.1016/j.ymssp.2020.106840 [Google Scholar] [CrossRef]
3. P. Y. Hao, D. L. Zhu, L. B. Yan, Y. T. Ren, Z. J. Zhao et al., “Stiffness design and multi-objective optimization of machine tool structure based on biological inspiration,” Journal of Vibration and Control, vol. 7, pp. 107754632210858, 2022. https://doi.org/10.1177/10775463221085858 [Google Scholar] [CrossRef]
4. D. L. Zhu, L. B. Yan, L. Y. Wang, C. Y. Dun, J. Ma et al., “Inspection of blade profile and machining deviation analysis based on sample points optimization and NURBS knot insertion,” Thin-Walled Structures, vol. 162, pp. 107540, 2021. https://doi.org/10.1016/j.tws.2021.107540 [Google Scholar] [CrossRef]
5. H. X. Li, K. S. Wan, W. X. Huang and J. Hong, “Milling chatter detection based on VMD and difference of power spectral entropy,” The International Journal of Advanced Manufacturing Technology, vol. 111, no. 7, pp. 2051–2063, 2020. [Google Scholar]
6. D. Ninevski, J. Thaler, P. O'Leary, T. Klunsner, M. Mucke et al., “Computational methods for the detection of wear and damage to milling tools,” Journal of Manufacturing Processes, vol. 82, pp. 78–87, 2022. https://doi.org/10.1016/j.jmapro.2022.07.030 [Google Scholar] [CrossRef]
7. F. Shi, R. H. Cao, K. Y. Wang, Y. B. Feng and F. Y. Ding, “Chatter detection in high-speed milling processes based on ON-LSTM and PBT,” The International Journal of Advanced Manufacturing Technology, vol. 111, no. 11, pp. 3361–3378, 2020. [Google Scholar]
8. G. Y. Mei, R. Mo, B. H. Sun and K. Bu, “Chatter detection in milling based on singular spectrum analysis,” The International Journal of Advanced Manufacturing Technology, vol. 95, no. 9, pp. 3475–3486, 2018. [Google Scholar]
9. B. Sener, G. Serin, U. M. Gudelek, M. A. Ozbayoglu and O. H. Unver, “Intelligent chatter detection in milling using vibration data features and deep multi-layer perceptron,” in Proc. of 2020 IEEE Int. Conf. on Big Data (Big DataElectr Network, Atlanta, GA, USA, pp. 4759–4768, 2020. https://doi.org/10.1109/BigData50022.2020.9378223 [Google Scholar] [CrossRef]
10. C. Y. Dun, D. L. Zhu, B. L. B. Yan and H. S. Wang, “A chatter detection method in milling of thin-walled TC4 alloy workpiece based on auto-encoding and hybrid clustering,” Mechanical Systems and Signal Processing, vol. 158, no. 1, pp. 107755, 2021. https://doi.org/10.1016/j.ymssp.2021.107755 [Google Scholar] [CrossRef]
11. Y. Chen, Z. H. Li, L. Hou, J. X. Bu, G. S. Ye et al., “Chatter detection for milling using novel p-leader multifractal features,” Journal of Intelligent Manufacturing, vol. 33, no. 1, pp. 121–135, 2022. [Google Scholar]
12. N. H. Gao, D. H. Shen, L. Yu, L. Y. Wang, Y. R. Li et al., “Milling chatter detection system based on multi-sensor signal fusion,” IEEE Sensors Journal, vol. 21, no. 22, pp. 25243–25251, 2021. [Google Scholar]
13. K. C. Madhusudana, H. Kumar and S. Narendranath, “Fault diagnosis of face milling tool using decision tree and sound signal,” Materials Today: Proceedings, vol. 5, no. 5, pp. 12035–12044, 2018. [Google Scholar]
14. K. C. Madhusudana, S. Budati, N. Gangadhar, H. Kumar and S. Narendranath, “Fault diagnosis studies of face milling cutter using machine learning approach,” Journal of Low Frequency Noise, Vibration and Active Control, vol. 35, no. 2, pp. 128–138, 2016. [Google Scholar]
15. J. Z. Qiao, A. Elhattab, D. X. Shu and B. C. He, “A second-order stochastic resonance method enhanced by fractional-order derivative for mechanical fault detection,” Nonlinear Dynamics, vol. 106, no. 1, pp. 707–723, 2021. [Google Scholar]
16. N. Jafarzadeh, A. Jalili, J. A. Alzubi, K. Rezaee, Y. Liu et al., “A novel buffering fault-tolerance approach for network on chip (NoC),” IET Circuits Devices & Systems, vol. 12, no. 12, pp. 15, 2022. https://doi.org/10.1049/cds2.12127 [Google Scholar] [CrossRef]
17. T. Panda, C. K. Patra, A. J. Alzubi, K. N. Barpanda and G. Palai, “Analytical studies on FBG based SOI structure for realization of optical interconnect,” Optik, vol. 193, no. Octeber, pp. 162979, 2019. https://doi.org/10.1016/j.ijleo.2019.162979 [Google Scholar] [CrossRef]
18. V. A. S. Hernández, R. Monroy, A. M. Medina-Pérez, O. Loyola-Gonzalez and F. Herrera, “A practical tutorial for decision tree induction: Evaluation measures for candidate splits and opportunities,” ACM Computing Surveys (CSUR), vol. 54, no. 1, pp. 18, 2021. [Google Scholar]
19. Y. Z. Fang, K. Roy, J. Mares, C. W. Sham, S. B. Chen et al., “Deep learning-based axial capacity prediction for cold-formed steel channel sections using deep belief network,” Structures, vol. 33, no. 7–8, pp. 2792–2802, 2021. https://doi.org/10.1016/j.istruc.2021.05.096 [Google Scholar] [CrossRef]
20. Y. X. Bie, S. Leglaive, X. Alameda-Pineda and L. Girin, “Unsupervised speech enhancement using dynamical variational autoencoders,” IEEE-ACM Transactions on Audio, Speech, and Language Processing, vol. 30, pp. 2993–3007, 2022. https://doi.org/10.1109/TASLP.2022.3207349 [Google Scholar] [CrossRef]
21. K. S. Wan, H. X. Li, J. Y. Yin and J. Hong, “Milling chatter detection by multi-feature fusion and Adaboost-SVM,” Mechanical Systems and Signal Processing, vol. 156, no. 2, pp. 107671, 2021. https://doi.org/10.1016/j.ymssp.2021.107671 [Google Scholar] [CrossRef]
22. L. L. Chang, M. L. Zhang, C. Fu and W. Y. Chen, “Transparent digital twin for output control using belief rule base,” IEEE Transactions on Cybernetics, vol. 52, no. 10, pp. 10364–10378, 2021. [Google Scholar]
23. S. Y. Xu and Y. X. Zhuang, “Container shipping scheduling method based on the evidence reasoning approach in fluctuating CCFI and BDI cycle,” Mathematical Problems in Engineering, vol. 2022, no. 99, pp. 3997361, 2022. https://doi.org/10.1155/2022/3997361 [Google Scholar] [CrossRef]
24. B. J. Yang, J. Liu, J. Wang, S. H. Sii and W. H. Wang, “Belief rule-base inference methodology using the evidential reasoning approach-RIMER,” IEEE Transactions on Systems, Man, and Cybernetics-Part A: Systems and Humans, vol. 36, no. 2, pp. 266–285, 2006. [Google Scholar]
25. L. M. Chen, J. Z. Zhou, C. B. Zhang, Y. G. Hu and Y. Cao, “A novel combination belief rule base model for mechanical equipment fault diagnosis,” Chinese Journal of Aeronautics, vol. 35, no. 5, pp. 158–178, 2022. [Google Scholar]
26. L. G. Kong, L. D. Xu, R. Body, B. J. Yang, K. Mackway-Jones et al., “A belief rule-based decision support system for clinical risk assessment of cardiac chest pain,” European Journal of Operational Research, vol. 219, no. 3, pp. 564–573, 2012. [Google Scholar]
27. L. G. Kong, L. D. Xu, B. X. Liu and B. J. Yang, “Applying a belief rule-base inference methodology to a guideline-based clinical decision support system,” Expert Systems, vol. 26, no. 5, pp. 391–408, 2009. [Google Scholar]
28. F. Aminravan, R. Sadiq, M. Hoorfar, J. Rodriguez and H. Najjaran, “Multi-level information fusion for spatiotemporal monitoring in water distribution networks,” Expert Systems with Applications, vol. 42, no. 7, pp. 3813–3831, 2015. [Google Scholar]
29. Y. Y.Yang, X. Y. Li and W. Y. Chen, “A belief rule-based inference model for prediction of R&D project success,” in Proc. of Data Science and Knowledge Engineering for Sensing Decision Support, Belfast, Ireland, vol. 11, pp. 389–396, 2018. [Google Scholar]
30. Y. X. Cheng, S. S. Liu, W. He, P. Zhang, B. Xu et al., “A model for flywheel fault diagnosis based on fuzzy fault tree analysis and belief rule base,” Machines, vol. 10, no. 2, pp. 73, 2022. [Google Scholar]
31. S. S. Xue, G. X. Li and F. X. Wang, “Fault diagnosis of multi-state gas monitoring network based on fuzzy Bayesian net,” Personal and Ubiquitous Computing, vol. 23, no. 3, pp. 573–581, 2019. [Google Scholar]
32. H. J. Pang, K. J. Dai and Y. Li, “An intelligent fault analysis and diagnosis system for electromagnet manufacturing process based on fuzzy fault tree and evidence theory,” Mathematics, vol. 10, no. 9, pp. 1437, 2022. [Google Scholar]
33. W. Q. Li, Y. R. Long, H. Chen and H. J. Geng, “Low purchase willingness for battery electric vehicles: Analysis and simulation based on the fault tree model,” Sustainability, vol. 9, no. 5, pp. 809, 2017. [Google Scholar]
34. H. C. Zhang, F. Fang, P. B. Zhao, X. Zhen, N. C. Hu et al., “Study on fault diagnosis method and application of automobile power supply based on fault tree-Bayesian network,” Security and Communication Networks, vol. 2022, no. 5, pp. 4046966, 2022. https://doi.org/10.1155/2022/4046966 [Google Scholar] [CrossRef]
35. T. J. Xu, M. Yang and G. S. Li, “Hardware reliability analysis of a coal mine gas monitoring system based on fuzzy-FTA,” Applied Sciences, vol. 11, no. 22, pp. 10616, 2021. [Google Scholar]
36. H. W. Li and Z. G. Liu, “Dynamic reliability analysis approach based on fault tree and new process capability index,” Quality and Reliability Engineering International, vol. 38, no. 2, pp. 800–816, 2022. [Google Scholar]
37. J. G. Jiang, J. H. Yuan, V. P. Li and P. Li, “A new approach to fuzzy dynamic fault tree analysis using the weakest n-dimensional t-norm arithmetic,” Chinese Journal of Aeronautics, vol. 31, no. 7, pp. 1506–1514, 2018. [Google Scholar]
38. B. J. Yang and L. D. Xu, “A study on generalizing Bayesian inference to evidential reasoning,” in Proc. of Belief Functions: Theory and Applications, England, St Hughs Coll, Oxford, vol. 8764, pp. 180–189, 2014. [Google Scholar]
39. A. Zhang, F. Gao, M. Yang and H. W. Bi, “A new rule reduction and training method for extended belief rule base based on DBSCAN algorithm,” International Journal of Approximate Reasoning, vol. 119, pp. 20–39, 2020. https://doi.org/10.1016/j.ijar.2019.12.016 [Google Scholar] [CrossRef]
40. S. Sachan, B. J. Yang, L. D. Xu, E. D. Benavides and Y. Li, “An explainable AI decision-support-system to automate loan underwriting,” Expert Systems with Applications, vol. 144, no. 9, pp. 113100, 2020. https://doi.org/10.1016/j.eswa.2019.113100 [Google Scholar] [CrossRef]
41. H. L. Yang, J. Liu, F. F. Ye, M. Y. Wang, C. Nugent et al., “Highly explainable cumulative belief rule-based system with effective rule-base modelling and inference scheme,” Knowledge-Based Systems, vol. 240, no. 9, pp. 107805, 2022. https://doi.org/10.1016/j.knosys.2021.107805 [Google Scholar] [CrossRef]
42. Y. G. Hu, J. Z. Zhou, H. C. Hu, C. B. Zhang, G. Z. Zhou et al., “Hidden behavior prediction of complex system based on time-delay belief rule base forecasting model,” Knowledge-Based Systems, vol. 203, no. 6, pp. 106147, 2020. https://doi.org/10.1016/j.knosys.2020.106147 [Google Scholar] [CrossRef]
43. P. Han, W. He, Y. Cao, M. Y. Li and Y. Y. Zhang, “Deep belief rule based photovoltaic power forecasting method with interpretability,” Scientific Reports, vol. 12, no. 1, pp. 14467, 2022. [Google Scholar] [PubMed]
44. C. Sun, H. R. Yang, W. He and L. H. Zhu, “A novel belief rule base expert system with interval-valued references,” Scientific Reports, vol. 12, no. 1, pp. 6786, 2022. [Google Scholar] [PubMed]
45. C. B. Zhang, J. X. Yin, L. Z. Wang, J. Z. Zhou, L. Y. Zhang et al., “Fault diagnosis of CNC servo system based on belief rule base,” Vibration Measurement and Diagnosis, vol. 33, no. 4, pp. 694–700, 2013. [Google Scholar]
Cite This Article
 Copyright © 2023 The Author(s). Published by Tech Science Press.
This work is licensed under a Creative Commons Attribution 4.0 International License , which permits unrestricted use, distribution, and reproduction in any medium, provided the original work is properly cited.
 Downloads
 Citation Tools