
 Submit a Paper
 Propose a Special lssue
 Open Access
ARTICLE

Spotted Hyena Optimizer Driven Deep Learning-Based Drug-Drug Interaction Prediction in Big Data Environment
1 Engineering College, Al-Kitab University, Kirkuk, Iraq
2 Information Technology Department, Technical College of Informatics-Akre, Duhok Polytechnic University, Duhok, Iraq
3 Computer Science Department, College of Science, Nawroz University, Duhok, Iraq
4 Energy Engineering Department, Technical College of Engineering, Duhok Polytechnic University, Duhok, Iraq
* Corresponding Author: Subhi R. M. Zeebaree. Email:
Computer Systems Science and Engineering 2023, 46(3), 3831-3845. https://doi.org/10.32604/csse.2023.037580
Received 09 November 2022; Accepted 09 February 2023; Issue published 03 April 2023
 View Full Text
 Download PDF
Abstract
Nowadays, smart healthcare and biomedical research have marked a substantial growth rate in terms of their presence in the literature, computational approaches, and discoveries, owing to which a massive quantity of experimental datasets was published and generated (Big Data) for describing and validating such novelties. Drug-drug interaction (DDI) significantly contributed to drug administration and development. It continues as the main obstacle in offering inexpensive and safe healthcare. It normally happens for patients with extensive medication, leading them to take many drugs simultaneously. DDI may cause side effects, either mild or severe health problems. This reduced victims’ quality of life and increased hospital healthcare expenses by increasing their recovery time. Several efforts were made to formulate new methods for DDI prediction to overcome this issue. In this aspect, this study designs a new Spotted Hyena Optimizer Driven Deep Learning based Drug-Drug Interaction Prediction (SHODL-DDIP) model in a big data environment. In the presented SHODL-DDIP technique, the relativity and characteristics of the drugs can be identified from different sources for prediction. The input data is preprocessed at the primary level to improve its quality. Next, the salp swarm optimization algorithm (SSO) is used to select features. In this study, the deep belief network (DBN) model is exploited to predict the DDI accurately. The SHO algorithm is involved in improvising the DBN model’s predictive outcomes, showing the novelty of the work. The experimental result analysis of the SHODL-DDIP technique is tested using drug databases, and the results signified the improvements of the SHODL-DDIP technique over other recent models in terms of different performance measures.Keywords
Drug repositioning is a potential technique for identifying new utility for existing drugs [1]. There exist many drug repositioning techniques; forecasting drug-drug interactions (DDIs) are a helpful method for exploring the pharmacologic function of drugs, which can be used to identify effective drugs for new treatment [2,3]. DDI refers to drug mixtures’ clinical and pharmacological responses, dissimilar to the familiar effect of utilizing one drug separately [4]. In certain circumstances, DDIs may lead to adverse drug reactions (ADR), a serious health risk that affects the patient’s health condition and may cause death [5,6]. Thus, DDI recognition is becoming crucial before the medical use of drugs compiling many drugs to cure severe illnesses such as tumours, AIDS, and so on. Tuns out to be a common and promising method in the modern era [7]. This is because utilizing many drugs to cure a disease increases treatment efficiency, and various drugs can manage a diverse part of the treatment process [8,9]. Thus, the significance of forecasting DDIs in human health was huge. Organizations and Researchers worldwide have used ample money and time to find DDI pairs utilizing several In Vitro and In Vivo experimental approaches [10]. The experimental technique to determine DDI can be extremely slow, demanding more money and time. Such techniques generally lead to low throughput, resulting in certain communications going unnoticed [11]. Since this process was extremely expensive and slow, it was impossible to find large compounds of drugs.
Conventional experimental techniques, like identifying transporter-based communications, were time-consuming and costly [12]. Also, just a few DDIs can be found during drug development, whereas many DDIs were reported after drug approval and discovered in post-marketing surveillance. In the meantime, computing methods render a promising alternative for finding effective DDIs on a large scale for further screening and grabbed much more interest from both industry and academia [13]. DDIs are determined as an attributed graph, in which nodes signify drugs and edges denote reported communications. There were attributes linked with nodes and edges. Node attributes were from drug profiles, like targets, chemical structures, pathways, enzymes, and side effects, whereas edge attributes will describe DDI types [14]. Individuals often adopted feature-based machine learning (ML) and pattern-related approaches in the initial days. Still, techniques related to patterns need the annotator to have some field knowledge, and the main disadvantage of this technique is that it can be both inefficient and time-consuming [15]. Deep learning (DL) is the most commonly implemented and effective technique to solve this issue.
Zhang et al. [16] present the implementation and construction of the knowledge graph based on the DL method. The relationship extraction and entity recognition are performed on the text of the social networking dataset. Next, the graph database is utilized to construct the knowledge graph (KG) and store medical knowledge. A DDI predictive model can be developed by integrating KG and bidirectional long short-term memory (Bi-LSTM) with attention. The multiple DDI resources are incorporated with the help of KG, and later they are converted into vectors by the knowledge representation module HolE. Lastly, the implicit feature of DDI is extracted through BiLSTM, and DDI is recognized by Softmax classification. Hung et al. [17] developed a machine learning (ML) method for predicting the outcome of interaction amongst drugs utilized for Paget’s treatment and osteoporosis that assist in mitigating the cost and time for enforcing the better integration of medication in medical practice. The presented method gathered DDI data from the DrugBank dataset about Paget diseases and osteoporosis. Next, chemical features are extracted from the simplified molecular-input line-entry system (SMILES) of determining drug pairs communicating with one another. Lastly, an ML algorithm was executed to learn the extracted feature.
Noor [18] designs a data-driven model to conduct knowledge-driven data analysis, which integrates the enrichment analysis and semantic inference system for identifying possible ADE mechanisms. The architecture has been exploited for ranking mechanisms based on the relevance for DDI and also to classify ADE depending on the number of DDI mechanisms association recognized through enrichment analysis. Chen et al. [19] derived two signed graph filtering-oriented neural networks (SGFNN) that incorporate signed graph structure and drug node attribute. Furthermore, we utilized the end-to-end architecture for learning DDI, whereby a discriminator and the SGFNN are collectively trained under a problem-specific loss function. The experiment outcome on two predictive issues shows that the architecture could improve considerably compared to the baseline. Su et al. [20] developed a novel architecture named KG2ECapsule which explicitly modelled the multi-relational DDI dataset relying on a biomedical knowledge graph in an end-to-end manner. Firstly, it produces a higher-quality negative sample according to an average number of head and tail entities for all the relations to reduce the false-negative sample to a certain range. Then, KG2ECapsule refines the representation of an entity by recursively broadcasting the embedding from the attention-related receptive field of the entities. Feature selection methods can be used to improve the performance of the ML classification model [21–25].
This study designs a new Spotted Hyena Optimizer Driven Deep Learning based Drug-Drug Interaction Prediction (SHODL-DDIP) model in a big data environment. In the presented SHODL-DDIP technique, the relativity and characteristics of the drugs can be identified from different sources for prediction. The input data is preprocessed at the primary level to improve its quality. Next, the salp swarm optimization algorithm (SSO) is used to select features. In this study, the deep belief network (DBN) model is exploited to predict the DDI accurately. The SHO algorithm is involved in improvising the DBN model’s predictive outcomes. The experimental result analysis of the SHODL-DDIP technique is tested using drug databases.
2 The Proposed DDI Prediction Model
In this study, an automated SHODL-DDIP model has been developed to predict DDI in a big-data environment. In the presented SHODL-DDIP technique, the relativity and characteristics of the drugs can be identified from different sources for prediction. Fig. 1 depicts the workflow of the SHODL-DDIP approach.
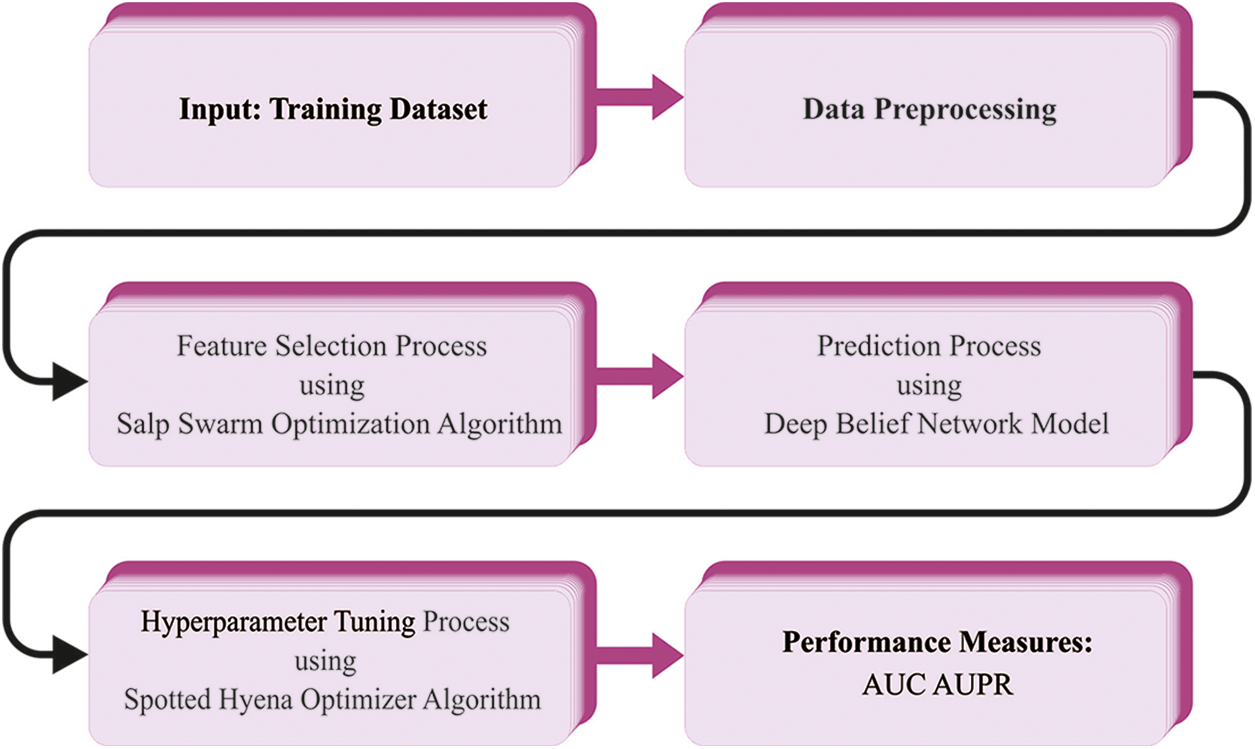
Figure 1: Workflow of SHODL-DDIP approach
Standard text cleaning and preprocessing processes were executed on sentences involving but unrestricted to lemmatization. All drugs are discussed in a sentence labelled to communicate with others. The number of drug pairs (DP) in a sentence can be evaluated below:
where n specifies the number of drugs in a sentence, drug blinding has been employed, in which every drug name can be allotted to the label. Afterwards, the processed sentence was given to the method for detecting and classifying DDI. At Word Embedding, all words can be transformed into real value vectors. This word mapping into a matrix is done through Word2Vec and embedding the dataset utilizing the extract of PubMed comprising the drugs.
2.2 SSO-Based Feature Selection
Here, the SSO algorithm is used for the optimal selection of features. The SSO is a newly presented technique simulated by the forging and swarming performance of salps (aquatic organisms) [26]. The salps procedure chain for foraging and navigating in seas and oceans. As with other SI techniques, the SSO technique depended upon the arbitrary initialization of populations with an existing count of individuals (solutions). To assist the search, the salps separate themselves into 2 types followers and leaders. The leader was a primary salp from the chain (optimum solution) that pilots follower drive. All the swarms X contain n salps and are determined in
The swarms’ purpose is to define the food source (optimum solution) from the whole searching space. Next mathematical process of salps chain with upgrade principle of leader position:
whereas the leader position was represented by
The position of the
The fitness function (FF) employed in the presented method was modelled to maintain a balance among the number of selected features in all solutions (min) and classifier accuracy (max) acquired through such selected features. Eq. (6) signifies the FF for evaluating solutions.
Here
2.3 Optimal DBN-Based DDI Prediction Process
The DBN model is used at this stage to predict the DDI proficiently. The DBN approach contains four layers of pre-training RBM and resultant layers (Softmax Regression) [27]. The parameter can be projected by a trained approach previously employing DBN for classifying and representing assaults. The DBN trained is categorized as pre-train for presenting and fine-tuning for classifiers. At the same time, the resulting DBN is transmitted to inputted Softmax Regression and comprised in DBN, which includes stacked RBM. Primarily, DBN was training to reconfigure untagged training databases and therefore executed unsupervised. Edata [.] and Emodel [.] can be expectations of possibilities.
During this case, three techniques (Eqs. (7)–(9)) primarily comprised in classical DBN network, the second term can only be indirectly obtained. At the same time, it can be possible in distribution which is studied utilizing the DBN. Gibb’s sampling was utilized to calculate this probability. But, this approach is time-consuming and is utilized in real-time. The contrastive divergence (CD) system was utilized to determine optimum solutions, a fast-learning technique. A trained sample can be employed to finish the Markov chain’s beginning. Afterwards, instances are obtained, and then
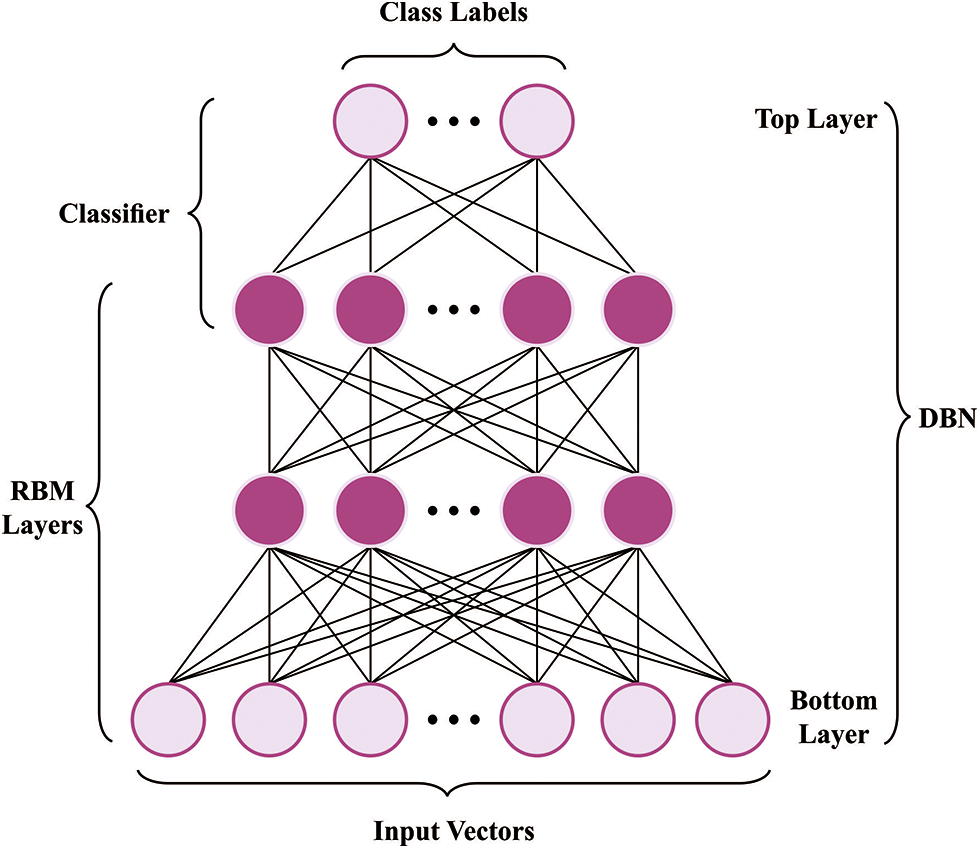
Figure 2: Architecture of DBN
During this work, for training, stacked RBM layer-wise to generate DBN, b, and W parameters can be upgraded dependent upon CD-1.
In this formula,
The stages of executing greedy layer-wise trained processes to every layer of DBN can be provided.
A primary RBM trained, the data appropriate to
While the trained set
In Eq. (11),
The SHO algorithm is involved in hyperparameter tuning to improve the predictive outcomes of the DBN model. The presented SHO method comprises four major stages stimulated by the natural behavior of spotted hyenas [28]. They are attacking, searching, encircling, and hunting for prey that is mathematically formulated below.
The better solution was regarded as the target prey to encircle the prey, and the other spotted hyenas or searching agents upgraded the location based on the optimum solution as follows:
whereas
where, Iteration
The hunting phase makes a cluster of the optimum solution against the better searching agent and upgrades the position of other searching agents:
whereas
In Eq. (21),
whereas
The proposed model is simulated using Python 3.6.5 tool on PC i5-8600k, GeForce 1050Ti 4 GB, 16 GB RAM, 250 GB SSD, and 1 TB HDD. The parameter settings are given as follows: learning rate: 0.01, dropout: 0.5, batch size: 5, epoch count: 50, and activation: ReLU. In this section, the DDI prediction results of the SHODL-DDIP model are investigated on four datasets. The class distribution of the datasets is given in Table 1 and Fig. 3.
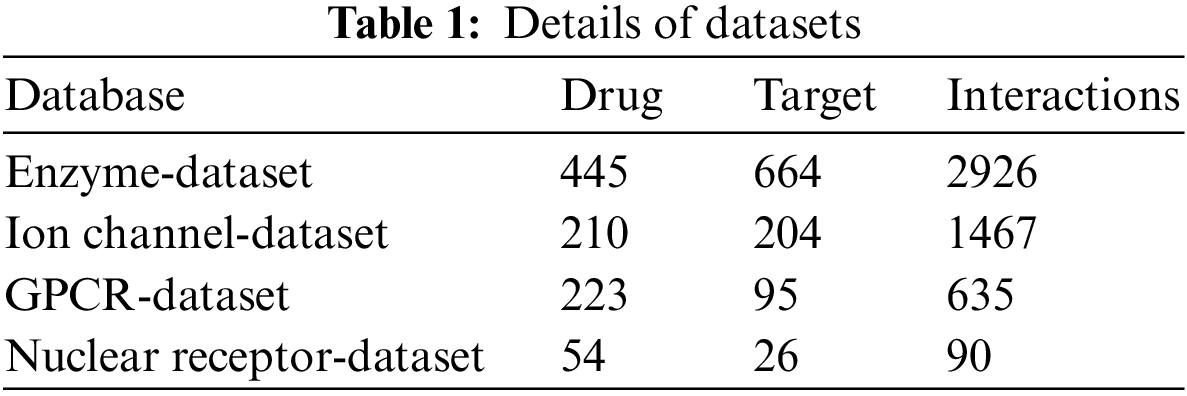
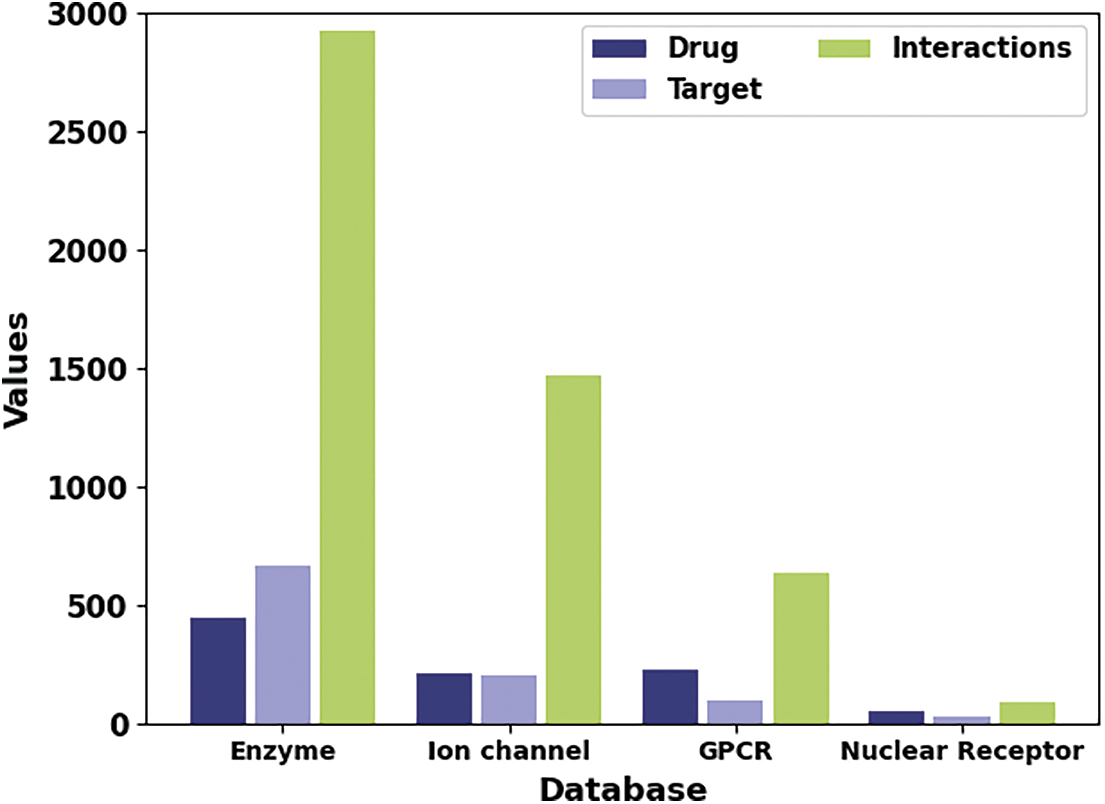
Figure 3: Dataset details
In Table 2 and Fig. 4, the performance of the SSODL-DDIP approach under unlabelled and labelled samples on top k% values is given. The outcomes exhibited that the SSODL-DDIP method has effectively labelled the samples. For instance, on the enzyme dataset with the top 10% samples, the SHODL-DDIP model has properly identified 384 samples from 28969 unlabeled samples.
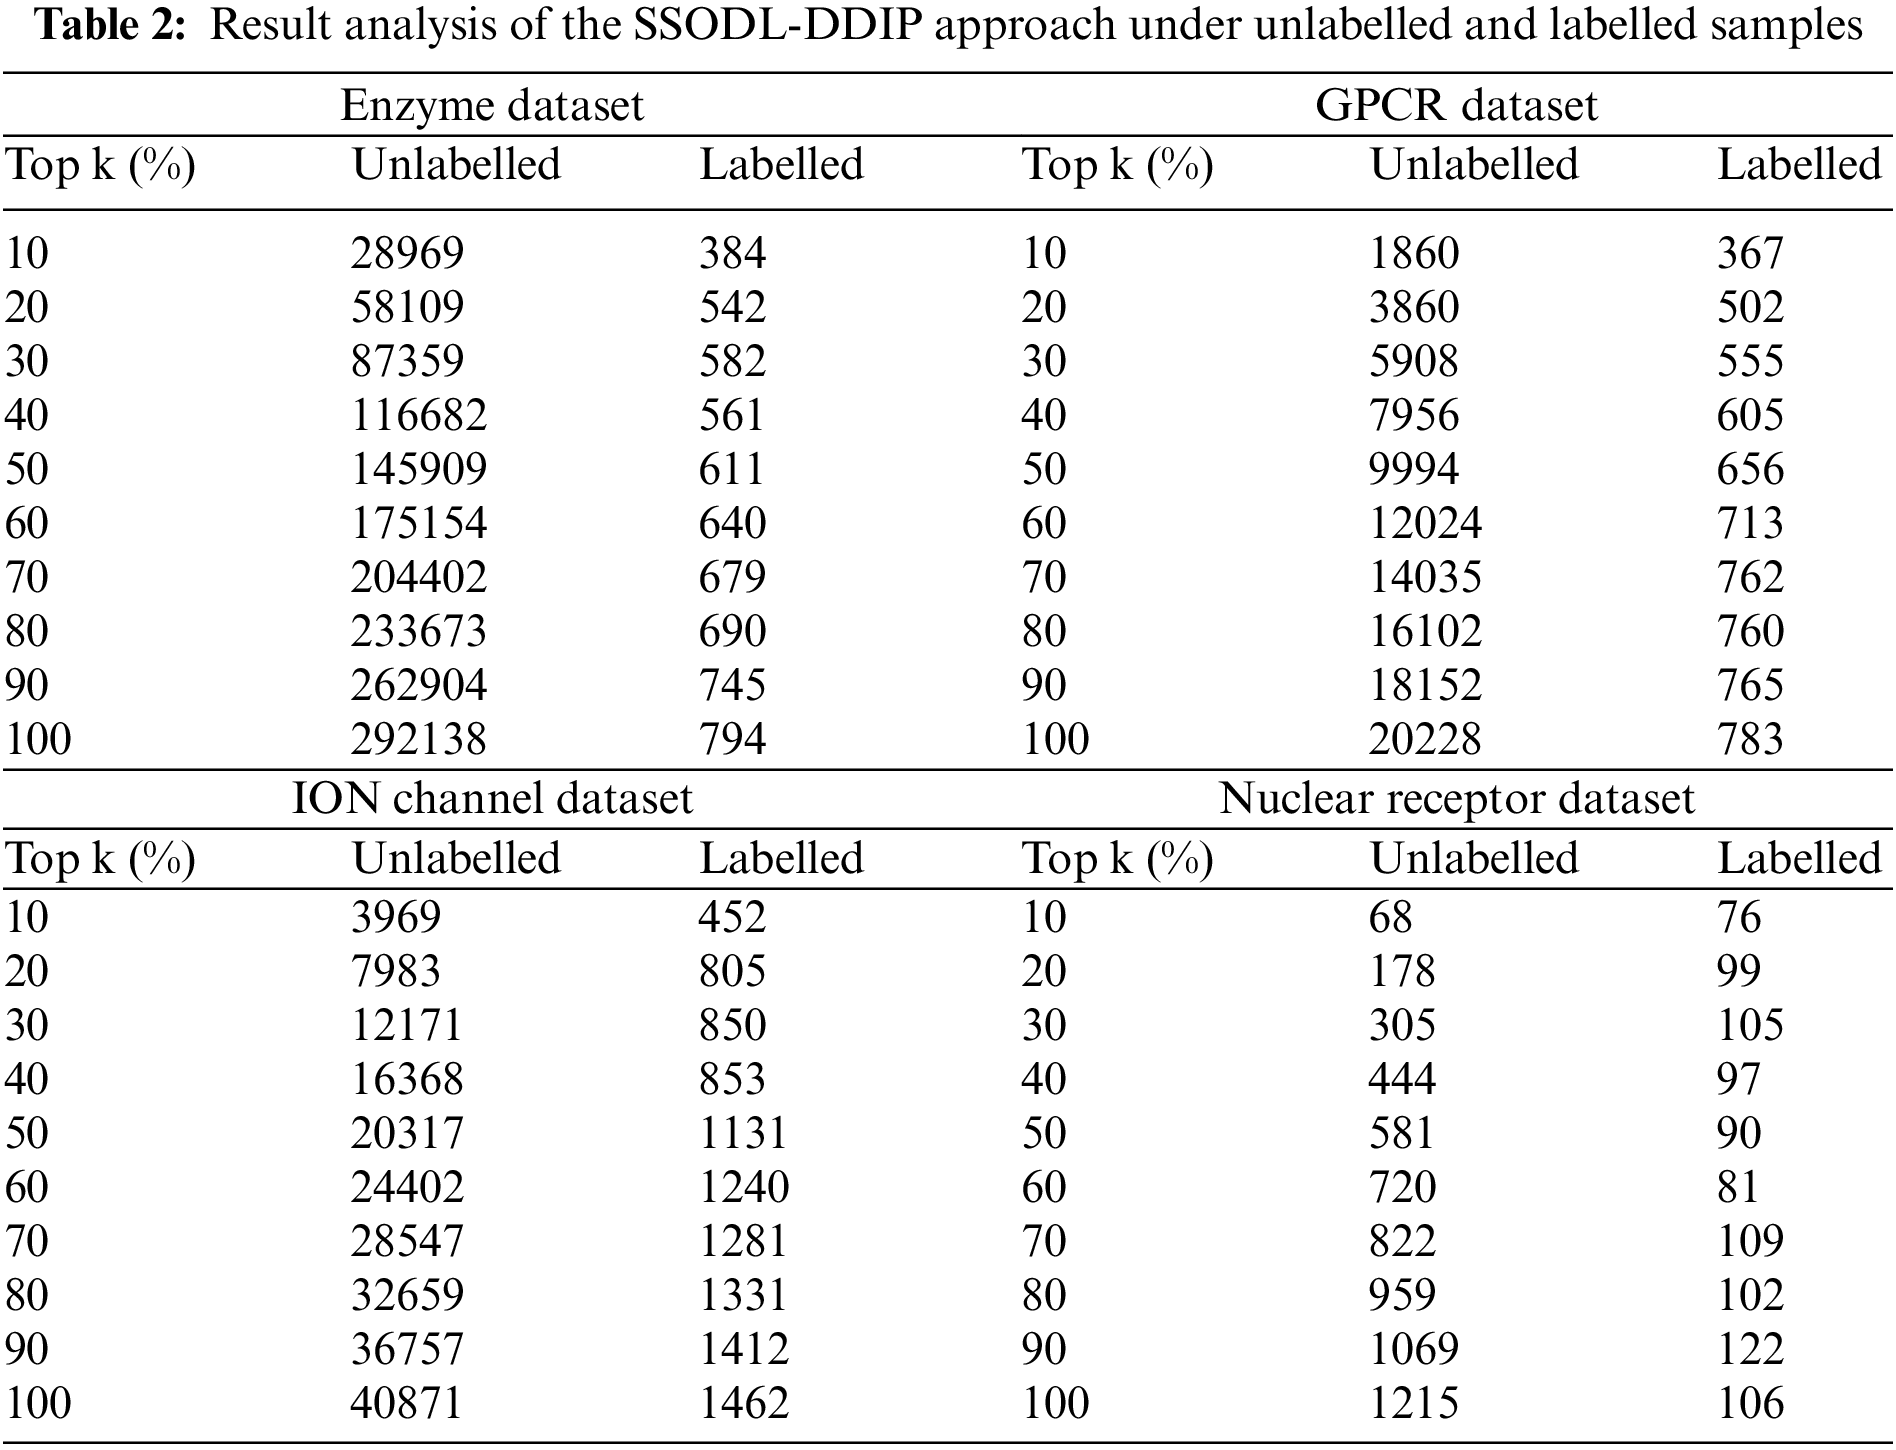
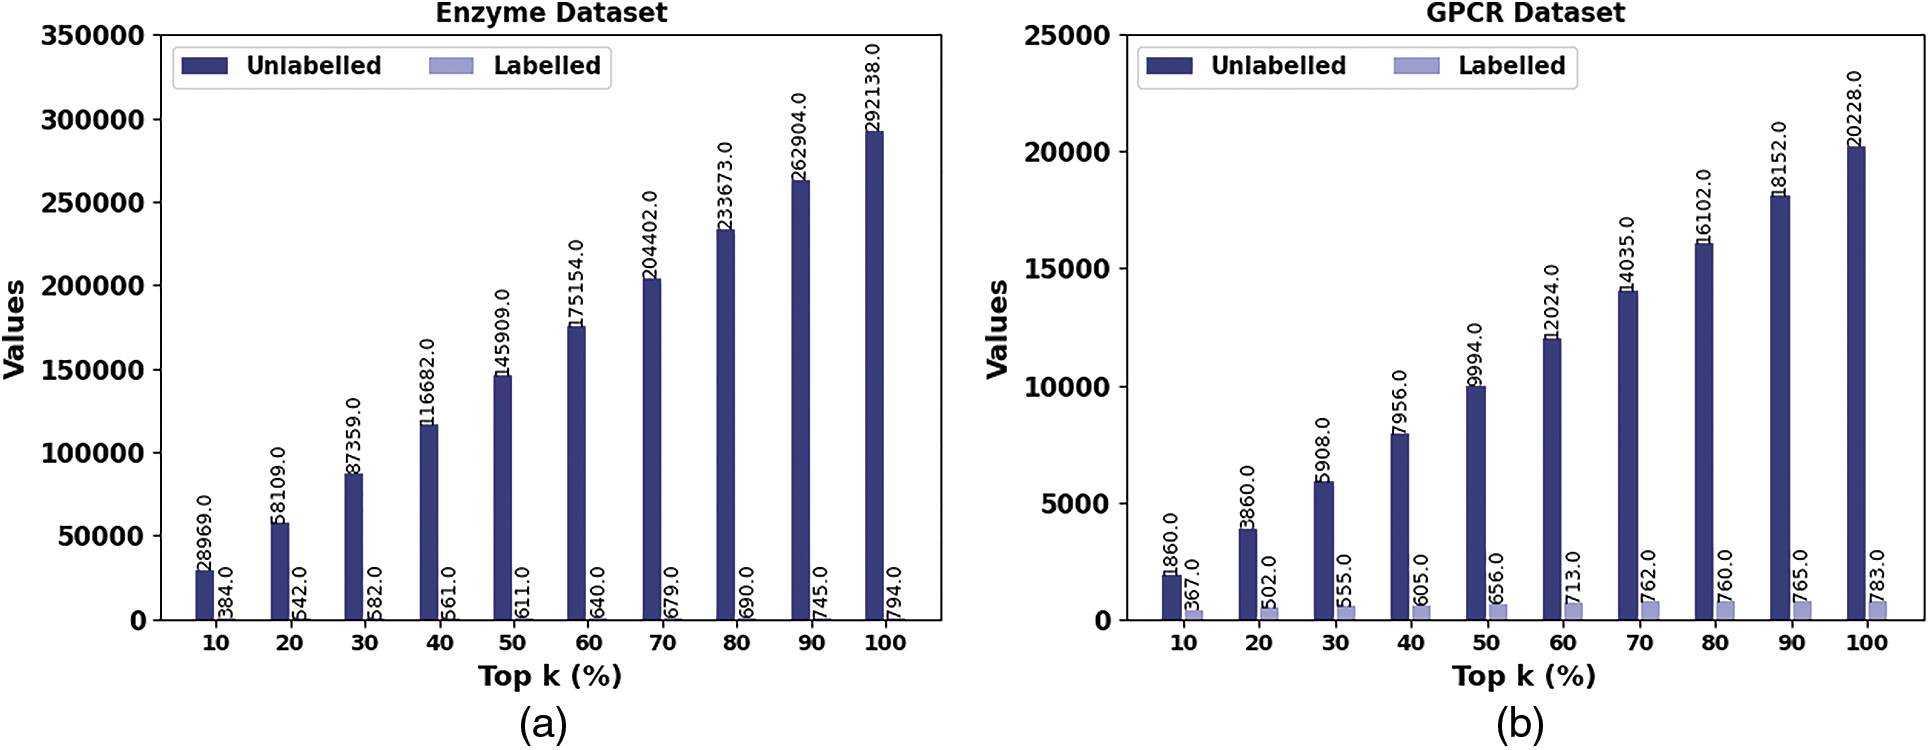
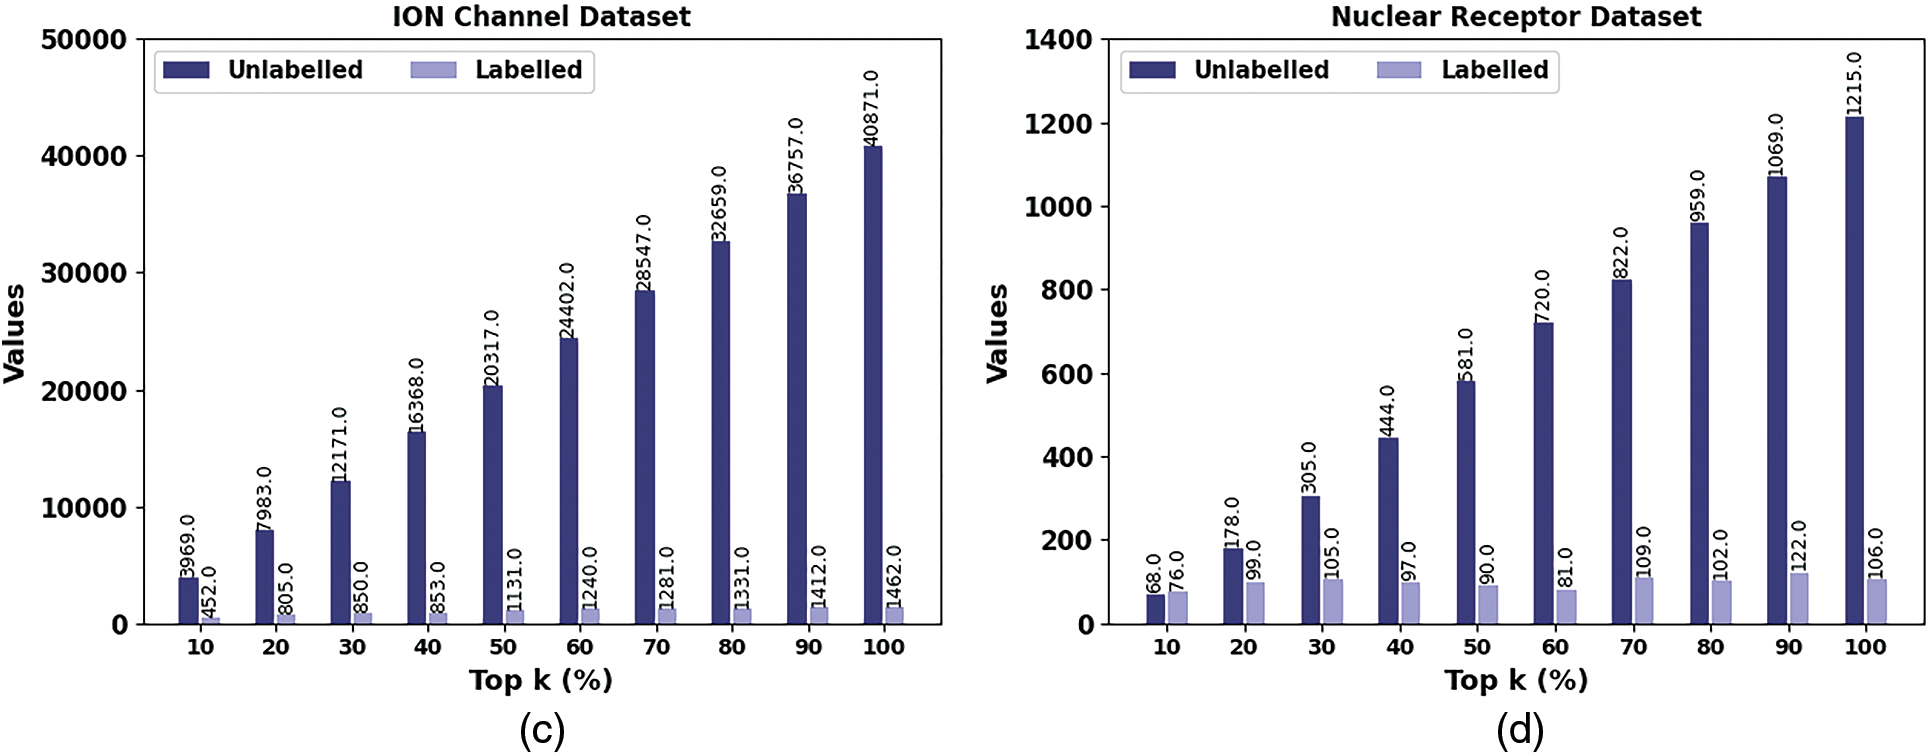
Figure 4: Result analysis of SHODL-DDIP system (a) Enzyme, (b) GPCR, (c) ION, and (d) Nuclear receptor
In addition, on the GPCR dataset with the top 10% samples, the SHODL-DDIP model has properly identified 367 samples from 1860 unlabeled samples. Also, on the ION dataset with the top 10% samples, the SHODL-DDIP method has properly identified 452 samples from 3969 unlabeled samples. Furthermore, on the nuclear receptor dataset with the top 10% samples, the SHODL-DDIP technique has properly identified 76 samples from 68 unlabeled samples. At last, on the nuclear receptor dataset with the top 100% samples, the SHODL-DDIP method has properly identified 106 samples from 1215 unlabeled samples.
Table 3 and Fig. 5 report the AUC and AUPR analysis of the SHODL-DDIP model. The results show the SHODL-DDIP method has enhanced values of AUC and AUPR under different CV_Seed values. For instance, on the enzyme dataset with 3201 CV_SEED, the SHODL-DDIP model has obtained AUC and AUPR of 94.55% and 61.92%, respectively. Moreover, on the GPCR dataset with 3201 CV_SEED, the SHODL-DDIP method has acquired AUC and AUPR of 88.67% and 64.08%, correspondingly. Concurrently, on the ION dataset with 3201 CV_SEED, the SHODL-DDIP approach has acquired AUC and AUPR of 85.11% and 62.50%, correspondingly. Additionally, on the nuclear receptor dataset with 3201 CV_SEED, the SHODL-DDIP method has gained AUC and AUPR of 93.27% and 76.49%, respectively.
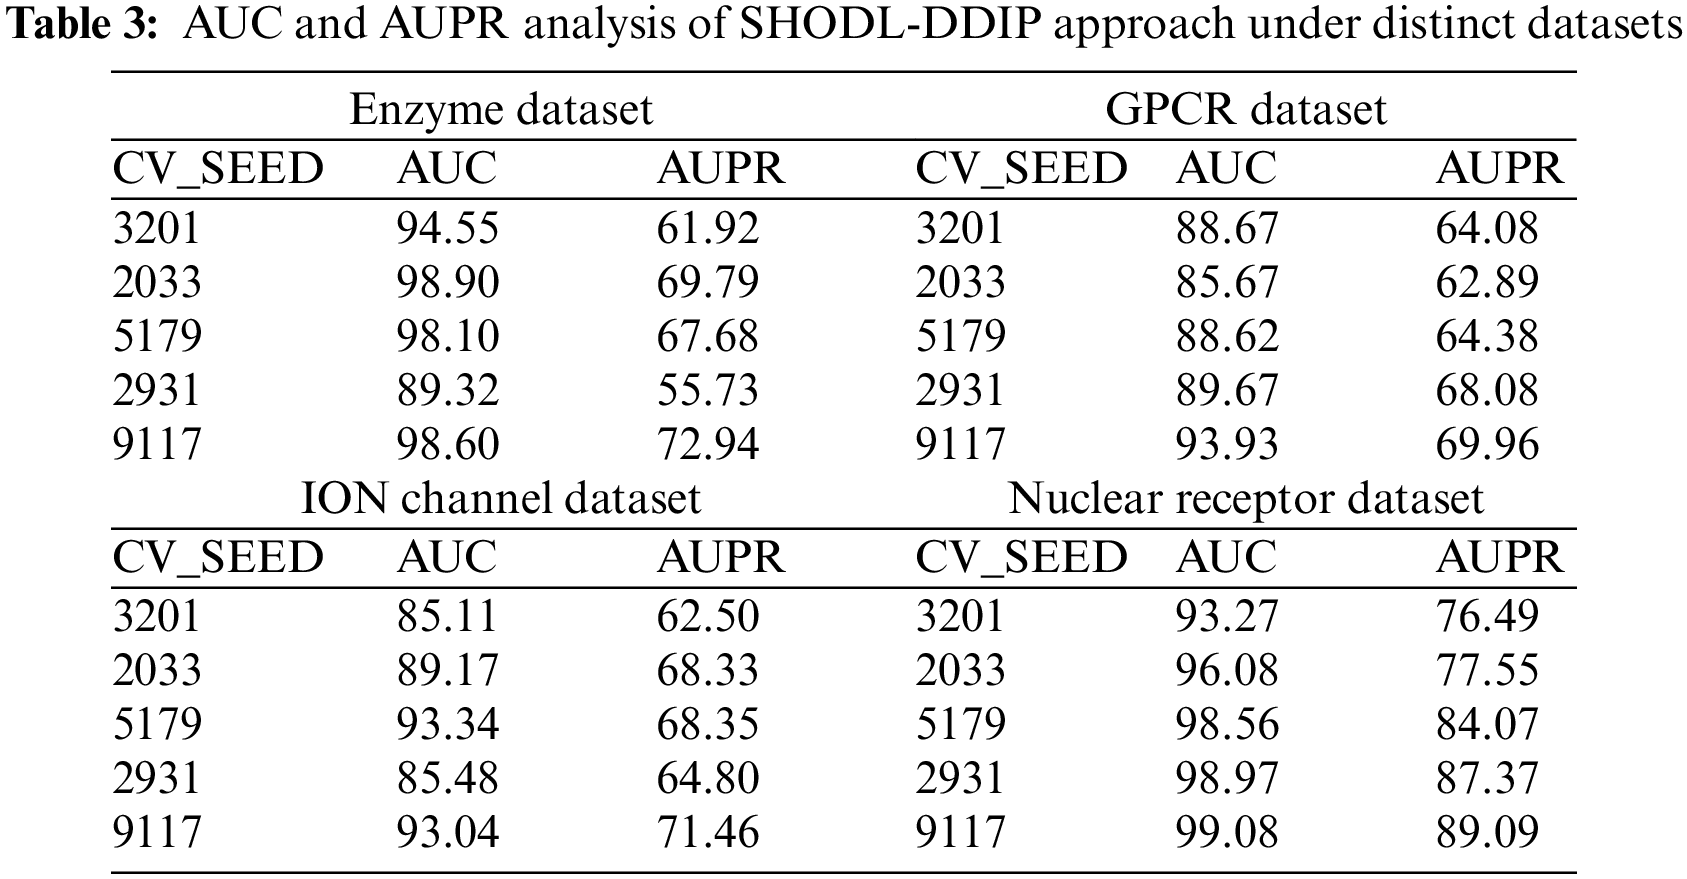
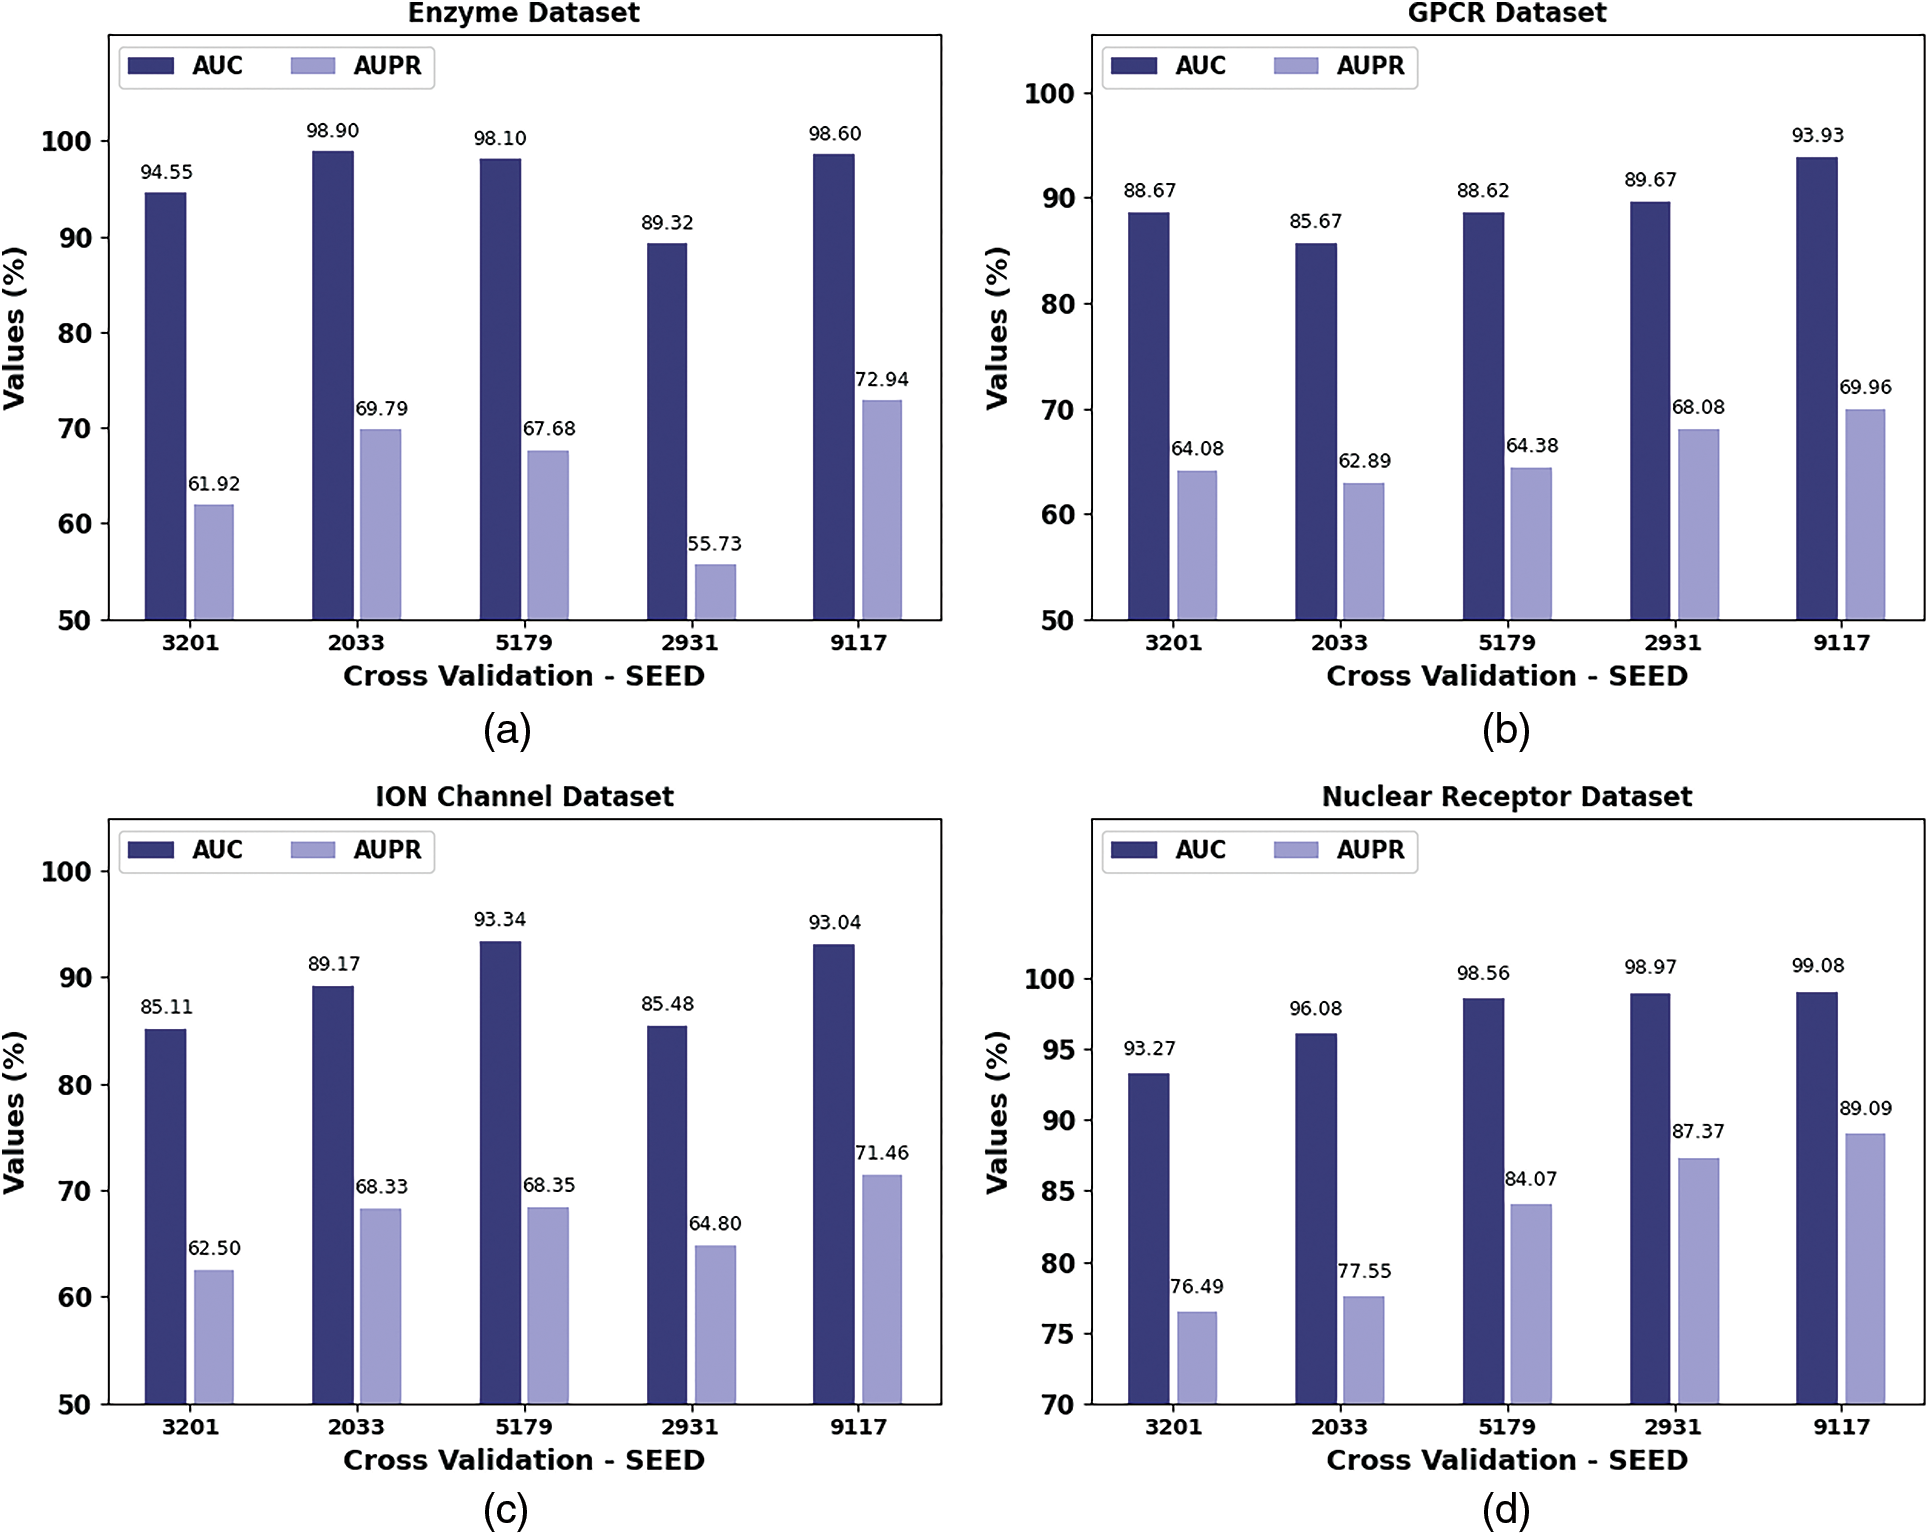
Figure 5: AUC and AUPR analysis of SHODL-DDIP system (a) Enzyme, (b) GPCR, (c) ION, and (d) Nuclear receptor
Table 4 and Fig. 6 show a comparative AUC study of the SHODL-DDIP model on four datasets. The figure exhibited that the SHODL-DDIP method has reached improved values of AUC under each dataset. For instance, on the enzyme dataset, the SHODL-DDIP model has gained an increased AUC of 98.90%, whereas the UDTPP, Bi-gram PSSM, Nearest Neighbour, IFB Model, KBMF2K, DBSI, and DTIP-ORNN models have reported reduced AUC of 86.76%, 94.79%, 89.51%, 84.52%, 82.77%, 80.29%, and 96.53% respectively. Meanwhile, on the GPCR dataset, the SHODL-DDIP methodology has attained an increased AUC of 93.93%. In contrast, the UDTPP, Bi-gram PSSM, Nearest Neighbour, IFB Model, KBMF2K, DBSI, and DTIP-ORNN techniques have reported reduced AUC of 87.15%, 89.47%, 88.53%, 81.48%, 85.89%, 80.19%, and 92.22% correspondingly. Eventually, on the ION dataset, the SHODL-DDIP approach has acquired an increased AUC of 93.34%, whereas the UDTPP, Bi-gram PSSM, Nearest Neighbour, IFB Model, KBMF2K, DBSI, and DTIP-ORNN methods have reported reduced AUC of 77.49%, 87.98%, 85.08%, 73.33%, 80.30%, 73.33%, and 80.51% correspondingly.
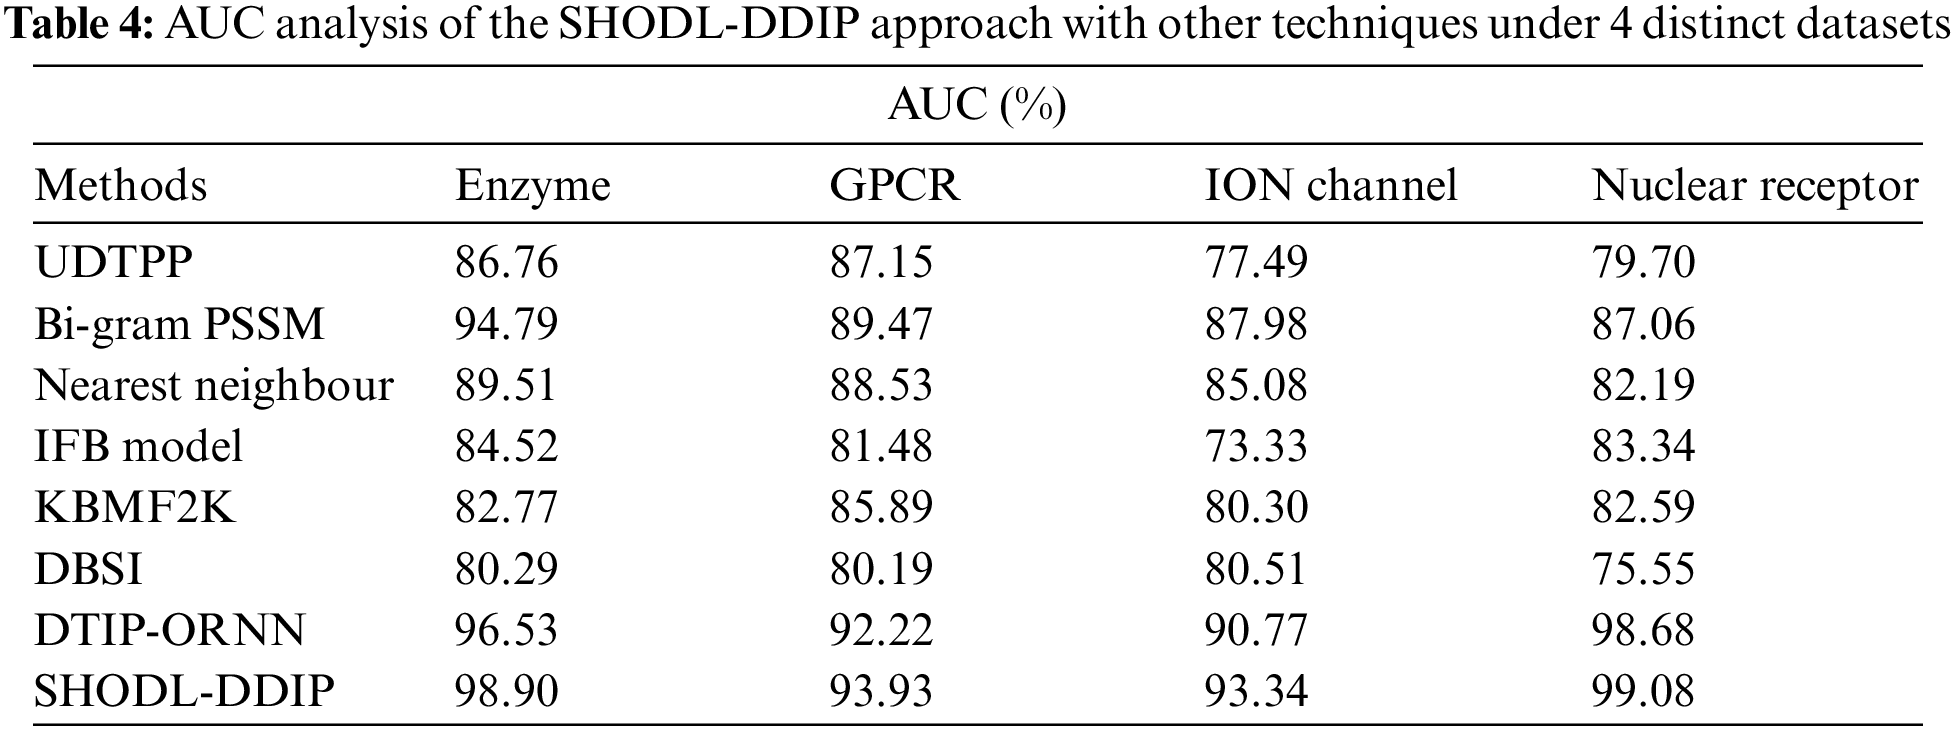
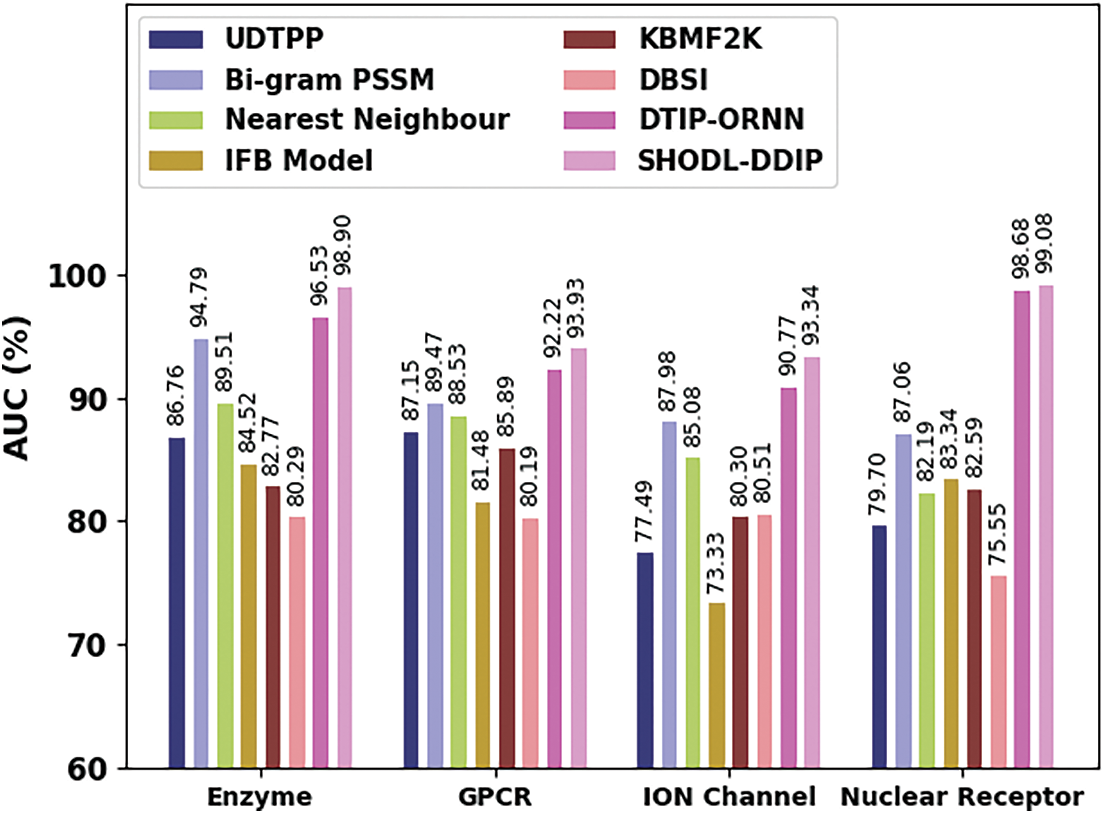
Figure 6: AUC analysis of the SHODL-DDIP approach with other techniques
Table 5 and Fig. 7 show a comparative AUPR study of the SHODL-DDIP method on four datasets. The outcomes show the SHODL-DDIP method has reached improved values of AUPR under each dataset. For example, on the enzyme dataset, the SHODL-DDIP method has acquired an increased AUPR of 72.94%, whereas the BLM, SELF-BLM, PULBLM-3, PULBLM-5, PULBLM-7, and DTIP-ORNN approaches have reported reduced AUPR of 56.56%, 63.04%, 67.13%, 67.34%, 66.75%, and 70.19% correspondingly.
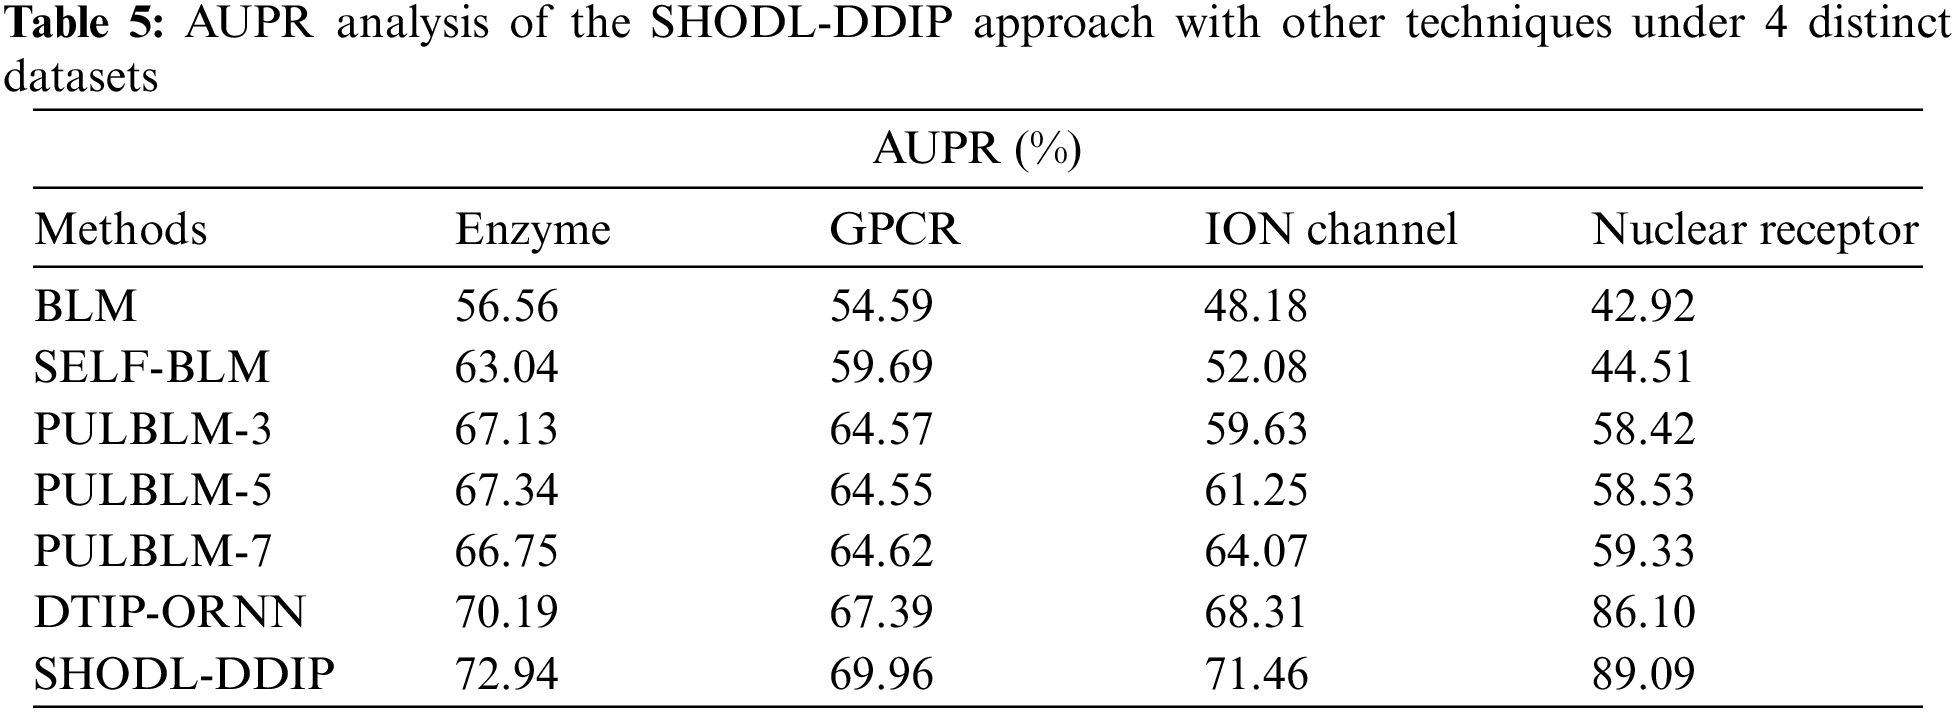
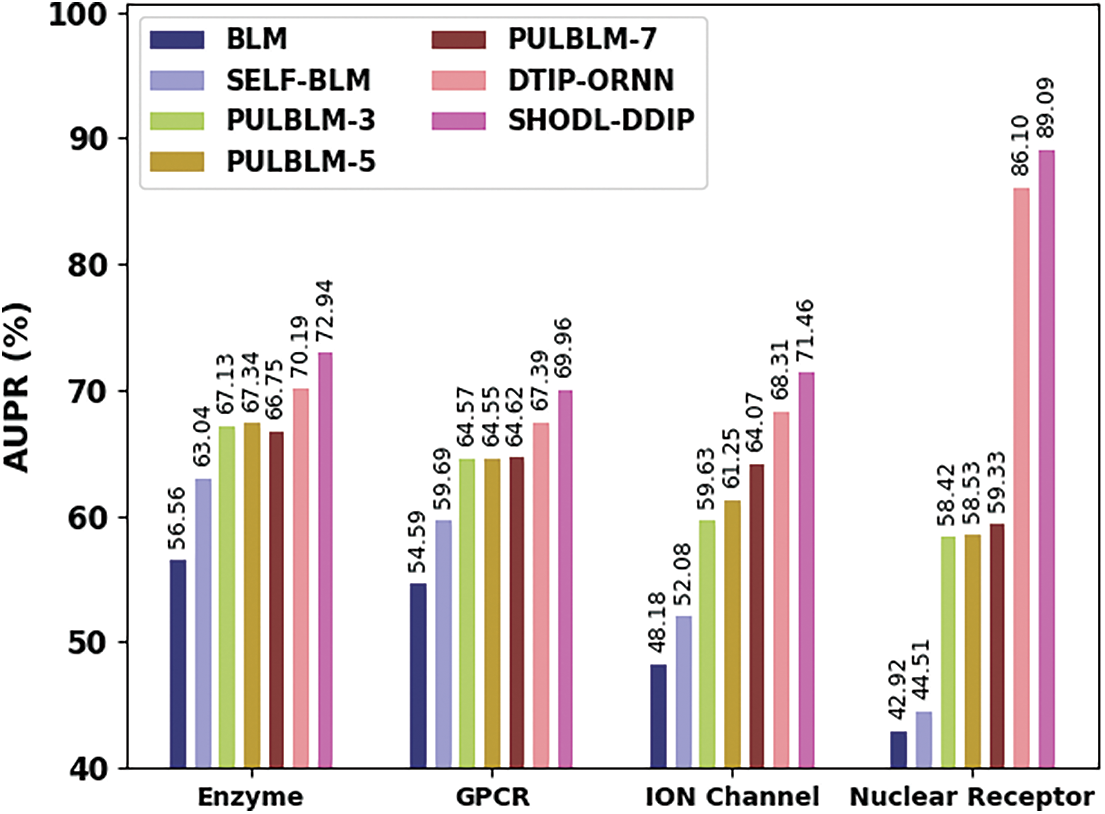
Figure 7: AUPR analysis of SHODL-DDIP approach with other techniques
In the meantime, on the GPCR dataset, the SHODL-DDIP algorithm has gained an increased AUPR of 69.96%, whereas the BLM, SELF-BLM, PULBLM-3, PULBLM-5, PULBLM-7, and DTIP-ORNN approaches have reported reduced AUPR of 54.59%, 59.69%, 64.57%, 64.55%, 64.62%, and 67.39% correspondingly. Parallelly, on the ION dataset, the SHODL-DDIP technique has attained an increased AUPR of 71.46%, whereas the BLM, SELF-BLM, PULBLM-3, PULBLM-5, PULBLM-7, and DTIP-ORNN methods have reported reduced AUPR of 48.18%, 52.08%, 59.63%, 61.25%, 64.07%, and 68.31% correspondingly.
In this study, an automated SHODL-DDIP model has been developed to predict DDI in big data environments. In the presented SHODL-DDIP technique, the relativity and characteristics of the drugs can be identified from different sources for prediction. The input data is preprocessed at the primary level to improve its quality. Next, the SSO algorithm is used for the optimal selection of features. To predict the DDI accurately, in this study, the DBN model is exploited. The SHO algorithm is involved in improvising the DBN model’s predictive outcomes. The experimental result analysis of the SHODL-DDIP technique is tested using drug databases, and the results signified the improvements of the SHODL-DDIP technique over other recent models in terms of different performance measures. In future, a hybrid DL model can be employed for improved predictive performance.
Funding Statement: The authors received no specific funding for this study.
Conflicts of Interest: The authors declare that they have no conflicts of interest to report regarding the present study.
References
1. J. Akram, A. Z. Kouzani and M. A. P. Mahmud, “Using adaptive sensors for optimized target coverage in wireless sensor networks,” Sensors, vol. 22, no. 3, pp. 1083, 2022. [Google Scholar] [PubMed]
2. A. Tahir, J. Akram, M. Adil, S. Ali, A. Z. Kouzani et al., “Automatic target detection from satellite imagery using machine learning,” Sensors, vol. 22, no. 3, pp. 1147, 2022. [Google Scholar] [PubMed]
3. R. Cai, M. Liu, Y. Hu, B. L. Melton, M. E. Matheny et al., “Identification of adverse drug-drug interactions through causal association rule discovery from spontaneous adverse event reports,” Artificial Intelligence in Medicine, vol. 76, pp. 7–15, 2017. [Google Scholar] [PubMed]
4. D. Huang, Z. Jiang, L. Zou and L. Li, “Drug–drug interaction extraction from biomedical literature using support vector machine long short term memory networks,” Information Sciences, vol. 415–415, pp. 100–109, 2017. [Google Scholar]
5. S. I. Khan, Z. Qadir, Y. S. Kiani, A. Z. Kouzani, M. A. P. Mahmud et al., “Insights into the mobility pattern of Australians during COVID-19,” Sustainability, vol. 13, no. 17, pp. 9611, 2021. [Google Scholar]
6. F. Li, M. Zhang, G. Fu, D. Ji et al., “A neural joint model for entity and relation extraction from biomedical text,” BMC Bioinformatics, vol. 18, no. 1, pp. 198, 2017. [Google Scholar] [PubMed]
7. K. M. Romagnoli, S. D. Nelson, L. Hines, P. Empey, R. D. Boyce et al., “Information needs for making clinical recommendations about potential drug-drug interactions: A synthesis of literature review and interviews,” BMC Medical Informatics and Decision Making, vol. 17, no. 1, pp. 21, 2017. [Google Scholar] [PubMed]
8. S. I. Khan, N. Anum, Z. Qadir, A. Z. Kouzaniand, M. A. P. Mahmud et al., “Post-flood risk management and resilience building practices: A case study,” Applied Sciences, vol. 11, no. 11, pp. 4823, 2021. [Google Scholar]
9. A. Raihani and N. Laachfoubi, “Extracting drug-drug interactions from biomedical text using a feature-based kernel approach,” Journal of Theoretical & Applied Information Technology, vol. 55, pp. 23–30, 2015. [Google Scholar]
10. H. Wu, Y. Xing, W. Ge, X. Liu, J. Zou et al., “Drug-drug interaction extraction via hybrid neural networks on biomedical literature,” Journal of Biomedical Informatics, vol. 106, pp. 103432, 2020. [Google Scholar] [PubMed]
11. C. Park, J. Park and S. Park, “AGCN: Attention-based graph convolutional networks for drug-drug interaction extraction,” Expert Systems with Applications, vol. 30, pp. 113538, 2020. [Google Scholar]
12. Z. H. Ren, Z. H. You, C. Q. Yu, L. P. Li, Y. J. Guan et al., “A biomedical knowledge graph-based method for drug–drug interactions prediction through combining local and global features with deep neural networks,” Briefings in Bioinformatics, vol. 23, no. 5, pp. bbac363, 2022. [Google Scholar] [PubMed]
13. B. Sivakumar, “Drug interaction prediction using various methods to reduce adverse effects,” in 6th Int. Conf. on Trends in Electronic., Informatics (ICOEI), Tirunelveli, India, pp. 123–127, 2022. [Google Scholar]
14. P. M. Savitha and M. P. Rani, “A comprehensive survey of ai methods to predict adverse drug-drug interactions,” in Computational Vision and Bio-Inspired Computing, Advances in Intelligent Systems and Computing Book Series, Singapore: Springer, vol. 1420, pp. 495–511, 2022. [Google Scholar]
15. B. Duan, J. Peng and Y. Zhang, “IMSE: Interaction information attention and molecular structure based drug drug interaction extraction,” BMC Bioinformatics, vol. 23, no. 7, pp. 1–16, 2022. [Google Scholar]
16. S. Zhang, C. Yu and C. Xu, “Integrating knowledge graph and bi-lstm for drug-drug interaction predication,” in Int. Conf. on Intelligent Computing ICIC 2022: Intelligent Computing Theories and Application, Lecture Notes in Computer Science Book Series, Cham, Springer, vol. 13393, pp. 763–771, 2022. [Google Scholar]
17. T. N. K. Hung, N. Q. K. Le, N. H. Le, L. V. Tuan, T. P. Nguyen et al., “An AI-based prediction model for drug-drug interactions in osteoporosis and paget’s diseases from smiles,” Molecular Informatics, vol. 41, no. 6, pp. 2100264, 2022. [Google Scholar]
18. A. Noor, “A Data-driven medical decision framework for associating adverse drug events with drug-drug interaction mechanisms,” Journal of Healthcare Engineering, vol. 2022, pp. 1–7, 2022. [Google Scholar]
19. M. Chen, W. Jiang, Y. Pan, J. Dai, Y. Lei et al., “SGFNNs: Signed graph filtering-based neural networks for predicting drug–drug interactions,” Journal of Computational Biology, vol. 29, no. 10, pp. 1104–1116, 2022. [Google Scholar] [PubMed]
20. X. Su, Z. H. You, D. S. Huang, L. Wang, L. Wong et al., “Biomedical knowledge graph embedding with capsule network for multi-label drug-drug interaction prediction,” IEEE Transactions on Knowledge and Data Engineering, 2022. https://doi.org/10.1109/TKDE.2022.3154792 [Google Scholar] [CrossRef]
21. M. Sharma and N. Romero, “Future prospective of soft computing techniques in psychiatric disorder diagnosis,” EAI Endorsed Transactions on Pervasive Health and Technology, vol. 4, no. 15, pp. 159798, 2018. [Google Scholar]
22. M. Sharma, G. Singh, and R. Singh, “Design of GA and ontology based NLP frameworks for online opinion mining,” Engineering, vol. 13, no. 2, pp. 159–165, 2019. [Google Scholar]
23. P. Monga, M. Sharma, and S. K. Sharma, “A comprehensive meta-analysis of emerging swarm intelligent computing techniques and their research trend,” Journal of King Saud University-Computer and Information Sciences, vol. 34, no. 10, pp. 9622–9643, 2022. [Google Scholar]
24. S. S. Vinod Chandra and H. S. Anand, “Nature inspired meta heuristic algorithms for optimization problems,” Computing, vol. 104, no. 2, pp. 251–269, 2022. [Google Scholar]
25. S. Arora, M. Sharma and P. Anand, “A novel chaotic interior search algorithm for global optimization and feature selection,” Applied Artificial Intelligence, vol. 34, no. 4, pp. 292–328, 2020. [Google Scholar]
26. S. I. Khan, S. M. Qaisar and R. B. Pachori, “Automated classification of valvular heart diseases using FBSE-EWT and PSR based geometrical features,” Biomedical Signal Processing and Control, vol. 73, pp. 103445, 2022. [Google Scholar]
27. A. Alissa, K. Shaiba, H. Gaddah, A. Yafoz, A. Alsini et al., “Feature subset selection hybrid deep belief network based cybersecurity intrusion detection model,” Electronics, vol. 11, no. 19, pp. 3077, 2022. [Google Scholar]
28. G. Dhiman and V. Kumar, “Spotted hyena optimizer for solving complex and non-linear constrained engineering problems,” in Harmony Search and Nature Inspired Optimization Algorithms, Advances in Intelligent Systems and Computing Book Series, Singapore: Springer, vol. 741, pp. 857–867, 2018. [Google Scholar]
Cite This Article
 Copyright © 2023 The Author(s). Published by Tech Science Press.
This work is licensed under a Creative Commons Attribution 4.0 International License , which permits unrestricted use, distribution, and reproduction in any medium, provided the original work is properly cited.
 Downloads
 Citation Tools