
 Submit a Paper
 Propose a Special lssue
 Open Access
ARTICLE

Feature Selection with Deep Reinforcement Learning for Intrusion Detection System
1
Department of Computer Science and Engineering, SRM Institute of Science and Technology, Ramapuram, Chennai, 600089, India
2
Department of Computing Technologies, SRM Institute of Science and Technology, Kattankulathur, Chennai, 603203, India
* Corresponding Author: S. Priya. Email:
Computer Systems Science and Engineering 2023, 46(3), 3339-3353. https://doi.org/10.32604/csse.2023.030630
Received 30 March 2022; Accepted 12 May 2022; Issue published 03 April 2023
 View Full Text
 Download PDF
Abstract
An intrusion detection system (IDS) becomes an important tool for ensuring security in the network. In recent times, machine learning (ML) and deep learning (DL) models can be applied for the identification of intrusions over the network effectively. To resolve the security issues, this paper presents a new Binary Butterfly Optimization algorithm based on Feature Selection with DRL technique, called BBOFS-DRL for intrusion detection. The proposed BBOFSDRL model mainly accomplishes the recognition of intrusions in the network. To attain this, the BBOFS-DRL model initially designs the BBOFS algorithm based on the traditional butterfly optimization algorithm (BOA) to elect feature subsets. Besides, DRL model is employed for the proper identification and classification of intrusions that exist in the network. Furthermore, beetle antenna search (BAS) technique is applied to tune the DRL parameters for enhanced intrusion detection efficiency. For ensuring the superior intrusion detection outcomes of the BBOFS-DRL model, a wide-ranging experimental analysis is performed against benchmark dataset. The simulation results reported the supremacy of the BBOFS-DRL model over its recent state of art approaches.Keywords
The advancement in the internet and communication domain has led to a greater rise in the size of the network and the corresponding data. By virtue of this, peculiar attacks are being arisen and have become a very big challenge for network security in detecting intrusions accurately. In addition to this, the prevalence of intruders with a motive to commence several attacks inside the network cannot be neglected [1]. An intrusion detection system (IDS) is single effective tool that keeps on preventing the network from probable intrusions by analyzing the traffic of the network, to assure its secrecy, integrity, and availability. In the cyber security domain, the IDS is absolutely necessary for attaining a solid line of defense in opposition to cyber intrusions. The digital planet becomes the primary supplement to the physical globe due to the worldwide use of computer networking and availability of programs and services that made it easy to establish users’ jobs in a short span of time at a lower cost [2]. A system is regarded as secure if these 3 principles of computer security that is, Confidentiality, Integrity, and Availability (CIA), are satisfied in a successful manner. Hackers always attempt to breach these principle matters, with each and every attack type having its own refined manner and assuming a very serious hazard to computer networking [3].
IDS is considered a network in a security management system widely used for the purpose of detecting network intrusions [4]. In order to get adapted to the fastest growth of network technologies and network security identification in various forms of outline, the generalization capability of the classifier requires an additional improvement, specifically in identifying unknown attacks. In order to develop an effective IDS model, a huge quantity of data is essential for training and testing purposes [5]. The low-quality and inappropriate information discovered in data may be removed after collecting the statistical properties matters from their observable attributes and components [6]. Thus presenting a deep interpretation of the existing dataset is important for IDS research.
In spite of massive efforts done by the researchers, IDS is still facing a challenge in betterment of detection accuracy while decreasing invalid alarm rates and noticing novel intrusions [7,8]. In recent times, machine learning (ML) and deep learning (DL)-based IDS systems are deployed as possible solutions to identify intrusions across the network effectively. The application zones of new methodologies to boost the performing task of IDSs are very important factor in current data networks with an increased hazard of cyber-attacks [9]. These kinds of attacks impact a high risk on network services which are important from a social end economical point of view [10]. In this work, we presented novel application zones of various in-depth reinforcement learning (DRL) algorithms for deducting intrusion.
In [11], a new network intrusion detection (ID) technique integrated with group convolutional was presented for improving the generalized performance of model. The fundamental classification utilizes group convolutional with symmetric infrastructure rather ordinary convolution neural network (CNN) that is trained by cyclic cosine annealing rate of learning. Al-Daweri et al. [12] examine the comprehensive analysis of relevance of the features from the KDD99 and UNSW-NB15 datasets. In 3 approaches are utilized such as rough-set theory (RST), back propagation neural network (BPNN), and discrete variant of cuttlefish algorithm (D-CFA). Primary, the dependence ratio amongst the feature and the class has been computed, utilizing the RST. Secondary, all the features from the data sets developed an input to the BPNN, for measuring its capability to classifier tasks concerned all the classes. Tertiary, feature selection (FS) procedure is executed on several runs for indicating the frequency of selective of all the features. Kotecha et al. [13] examine the UNSW-NB15 Data set as presently most of optimum representatives of modern attack and suggested many methods. Ahmad et al. [14] relate the several approaches for developing a network IDS. An optimal feature was chosen in the data set dependent upon the correlation amongst the features. In addition, it can be present the AdaBoost based method to network ID dependent upon these chosen features and existing their brief functionality and performance. The authors in [15] presented a promising hybrid feature selection (HFS) with ensemble classification that effectively chooses relevant features and offers consistent attack classifier.
This paper presents a new Binary Butterfly Optimization algorithm based on Feature Selection with DRL technique, called BBOFS-DRL for intrusion detection. The proposed BBOFS-DRL model initially designs the BBOFS algorithm based on the traditional butterfly optimization algorithm (BOA) to elect feature subsets. Besides, DRL model is employed for the proper identification and classification of intrusions that exist in the network. Furthermore, beetle antenna search (BAS) technique is applied to tune the DRL parameters for enhanced intrusion detection efficiency. For ensuring the superior intrusion detection outcomes of the BBOFS-DRL model, a wide-ranging experimental analysis is performed against benchmark dataset.
In this article, a new BBOFS-DRL model has been developed for accurate recognition of intrusions in the network. The BBOFS-DRL model initially designed the BBOFS algorithm based on the BOA to elect feature subsets. Besides, DRL model is employed for the proper identification and classification of intrusions that exist in the network. Furthermore, BAS technique is applied to tune the DRL parameters for enhanced intrusion detection efficiency. Fig. 1 illustrates the block diagram of BBOFS-DRL technique.

Figure 1: Block diagram of BBOFS-DRL technique
At the preliminary level, the BBOFS-DRL model initially designed the BBOFS algorithm based on the BOA to elect feature subsets [16]. BOA is a novel Metaheuristic optimization method projected by Arora and Singh in 2019 simulates the mating and nectar search behaviors of butterflies. In BOA, it is considered that butterfly generates some concentration of fragrance. The fragrance is related to objective function of the solution:
whereas
Now
The expression of local searching is shown below:
Here
In which
Now MaxIter denotes the maximal amount of iterations. Fig. 2 illustrates the flowchart of BOA.

Figure 2: Flowchart of BOA
Different from the standard BOA, in which the solution is upgraded in the searching region towards constant valued location, in the BBOFS, the searching region is modelled as
According to the aforementioned, the fitness function (FF) to define solution in the condition completed to obtain a balance amongst the two objectives in the following:
2.2 Process Involved in DRL Based Classification
Next to FS process, the DRL model is employed for the proper identification and classification of intrusions that exist in the network [17]. The DRL is a significant model of machine learning that aims at finding an optimum approach to acquire the predictable return by training an agent. Markov Decision Process (MDP) is an elementary theoretic structure to resolve the problem of DRL. In the communication procedure, the agent observes the state
The agent's work is to improve the policy for taking actions to exploit the predictable return. The return in step
whereas
2.3 Hyperparameter Optimization
In the final stage, the BAS technique is applied to tune the DRL parameters for enhanced intrusion detection efficiency.
For optimizing the effectiveness of the DRL approach, the hyper parameter tuning procedure is implemented by the use of BAS technique. This technique is an optimization method that mimics beetle forage behaviour. As soon as beetle forages, it employs left and right antennas to intellect the odour concentration of food. Once the odour concentration attained over the left antennas are greater, it flies to the left via the strong odour concentration; then, it flies to the right. It can be shown in the following:
In which
Among others,
Among others,
The proposed model is simulated using MATLAB tool. This section inspects the experimental validation of the BBOFS-DRL model using NSL-KDD dataset and UNSW-NB-15 dataset. The results are elaborated in the following sections.
3.1 Result Analysis of NSL-KDD Dataset
The NSL-KDD dataset includes 41 features with five class labels such as Normal, DoS, Probe, remote-to-local (R2L), and user-to-root (U2R). The proposed BBOFS technique has chosen a set of 24 features.
Fig. 3 investigates the confusion matrices of the BBOFS-DRL model with 70% of training set (TRS) and 20% of testing set (TSS) on NSL-KDD dataset. With 70% of TRS, the NSL-KDD dataset has determined 53616 samples into Normal class, 13183 samples into denial of service (DoS), 33363 samples into Probe, 140 samples into User to Root (U2R), and 2550 samples under Remote to Local User (R2L) class. In addition, with 30% of TSS, the NSL-KDD dataset has determined 22881 samples into Normal class, 5606 samples into DoS, 14465 samples into Probe, 60 samples into U2R, and 1083 samples under R2L class.

Figure 3: Confusion matrix of BBOFS-DRL technique on NSL-KDD dataset
Table 1 reports detailed IDS outcomes of the BBOFS-DRL model on the test NSL-KDD dataset. The experimental outcomes implied that the BBOFS-DRL model has accomplished enhanced performance on 70% of TRS and 30% of TSS under NSL-KDD dataset. With 70% of TRS, the BBOFS-DRL model has offered average
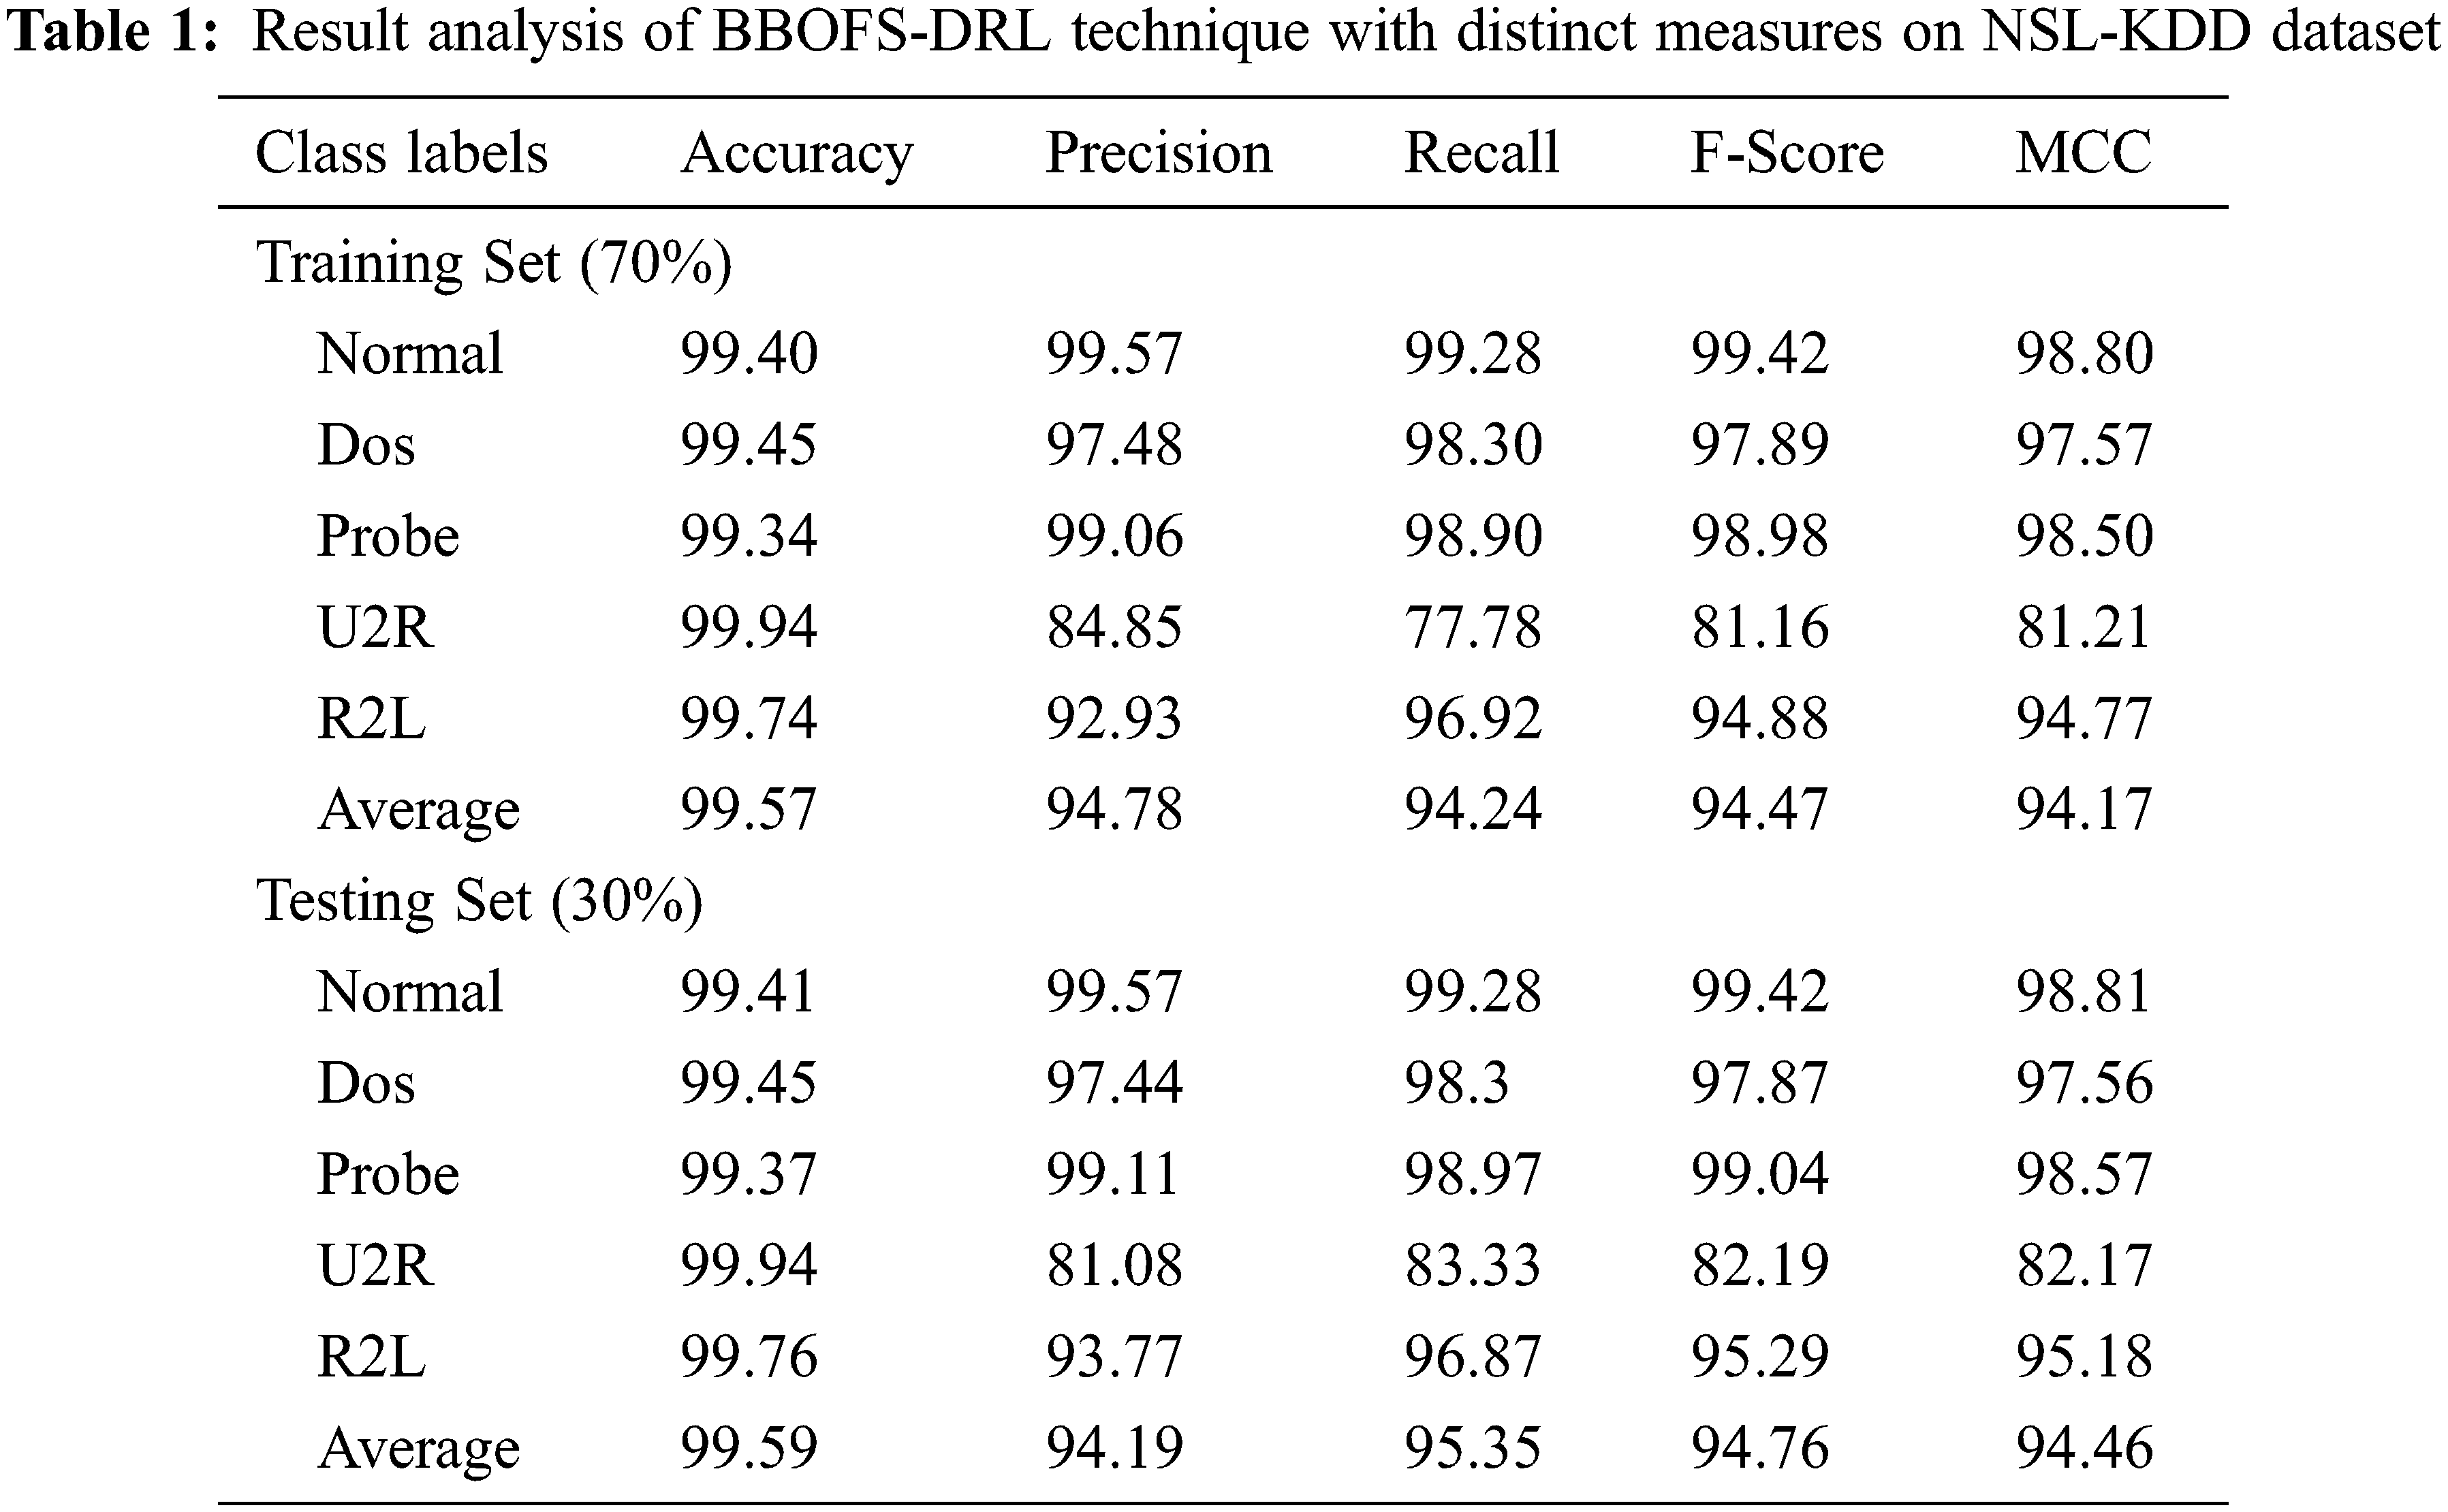
Fig. 4 illustrates the precision-recall investigation of the BBOFS-DRL model on NSL-KDD dataset. The figure indicated that the BBOFS-DRL model has accomplished maximum precision-recall values on the distinct class labels.

Figure 4: Precision-recall analysis of BBOFS-DRL method on NSL-KDD dataset
Fig. 5 demonstrates the training accuracy (TA) and validation accuracy (VA) offered by the BBOFS-DRL model NSL-KDD dataset. The figure indicated that the BBOFS-DRL model has provided closer TA and VA values with an increase in epoch count. It is observable that the VA is certainly higher than TA.

Figure 5: TA and VA analysis of BBOFS-DRL method on NSL-KDD dataset
Fig. 6 validates the training loss (TL) and validation loss (VL) provided by the BBOFS-DRL model NSL-KDD dataset. The figure designated that the BBOFS-DRL model has delivered lower TL and VL with an increase in epoch count. It is noticeable that the VL is definitely lower compared to TL.

Figure 6: TL and VL analysis of BBOFS-DRL method on NSL-KDD dataset
Table 2 and Fig. 7 report a comparative study of the BBOFS-DRL model with recent models interms of different measures on NSL-KDD dataset. The outcomes demonstrated that the decision tree (DT), random forest (RF), and support vector machine (SVM) models have accomplished poor performance with minimal classification results. Followed by, the CNN-Bagging and CNN-Adaboost models have gained slightly enhanced classifier results. In line with, the GCNSE model has reached reasonable performance with
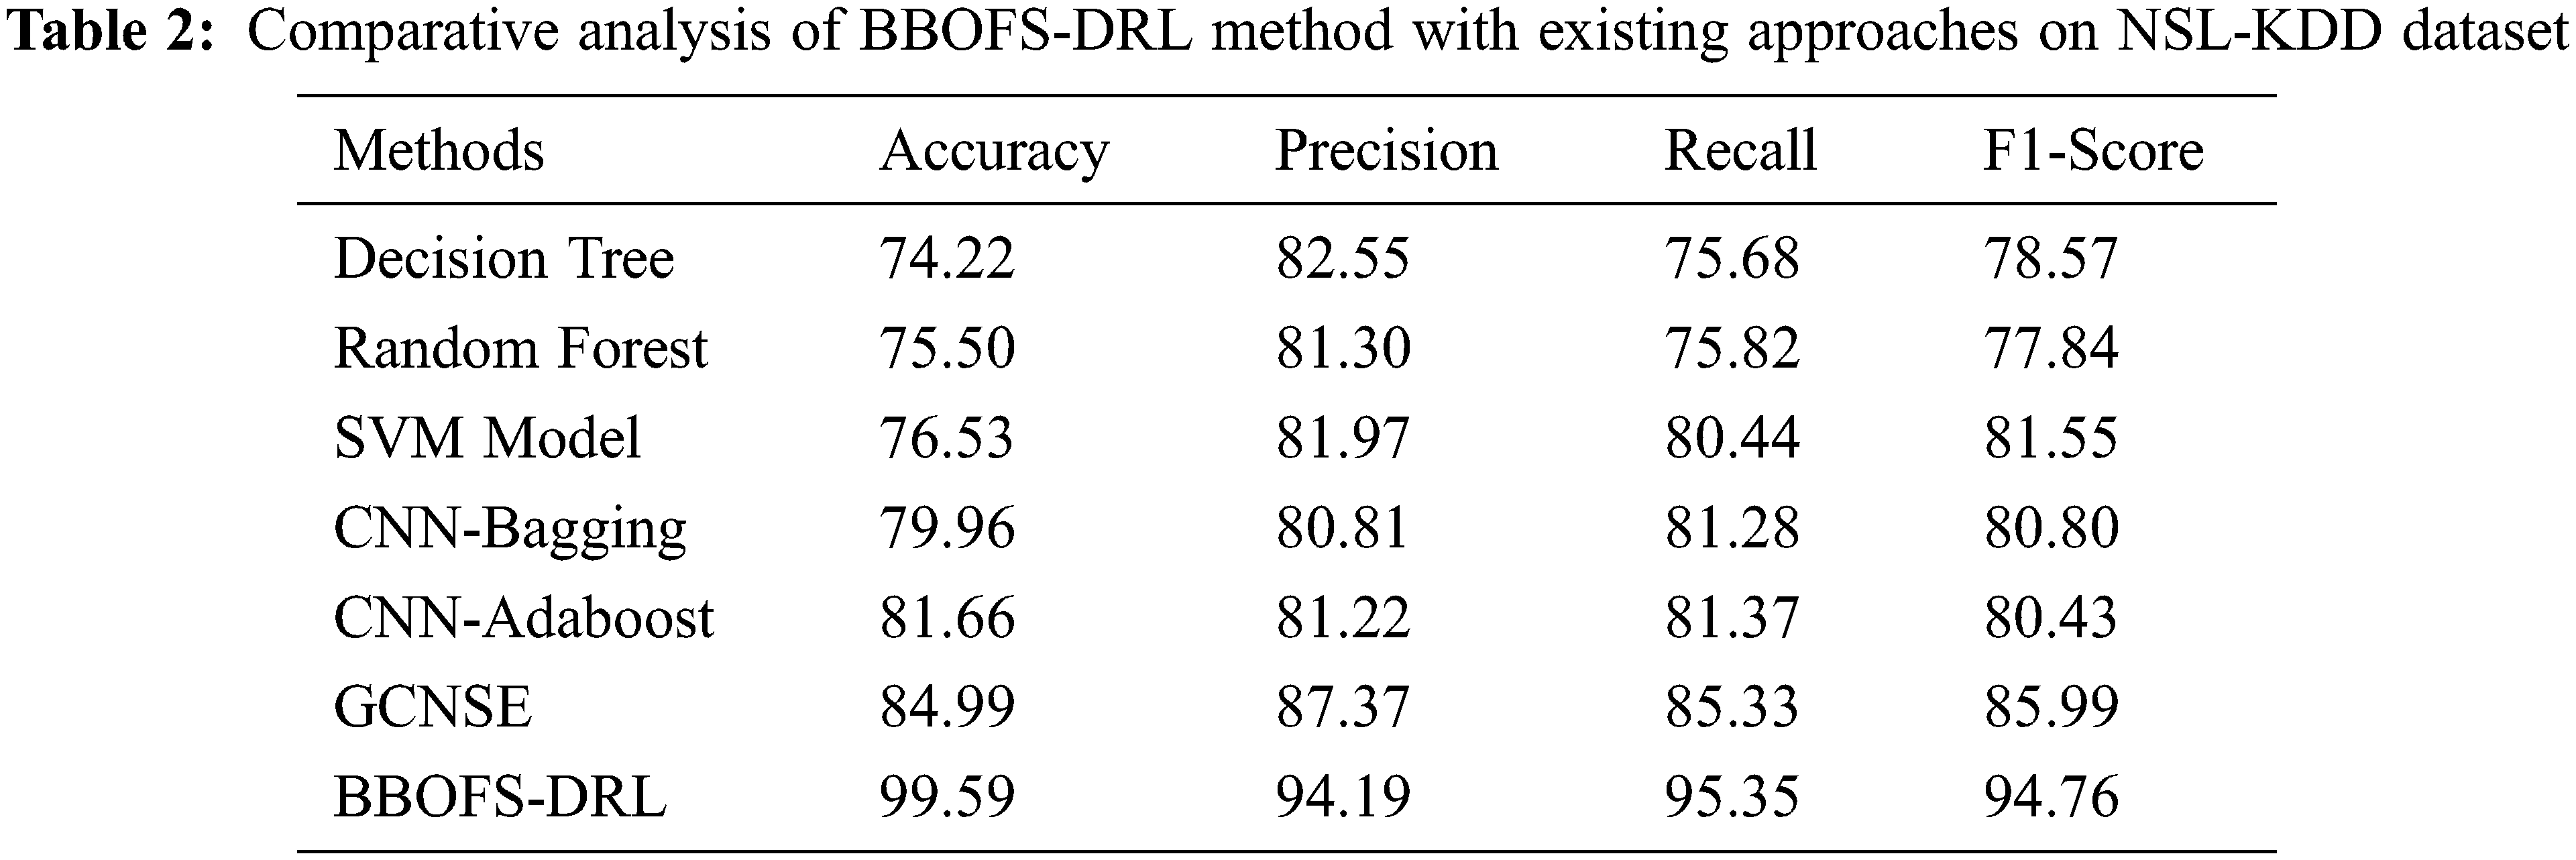

Figure 7: Comparative analysis of BBOFS-DRL method on NSL-KDD dataset
3.2 Result Analysis of UNSW-NB-15 Dataset
The test UNSW-NB-15 dataset comprises 42 features and ten classes, namely Generic, Normal, Analysis, Shellcode, Exploits, Reconnaissance, Fuzzers, Worms, DoS, and Backdoors. Among the available 42 features, the BBOFS technique has chosen 27 features.
Fig. 8 examines the confusion matrices of the BBOFS-DRL model with 70% of TRS and 20% of TSS on UNSW-NB-15 dataset. With 70% of TRS, the UNSW-NB-15 dataset has determined 64579 samples into Normal class, 1562 samples into Backdoor, 1800 samples into Analysis, 16960 samples into Fuzzers, 1022 samples into Shellcode, 9663 samples into Reconnaissance, 31085 samples into Exploits, 11258 samples into DoS, 114 samples into Worms, and 40953 samples under Generic class. Also, with 30% of TSS, the UNSW-NB-15 dataset has determined 27872 samples into Normal class, 667 samples into Backdoor, 856 samples into Analysis, 7139 samples into Fuzzers, 414 samples into Shellcode, 4189 samples into Reconnaissance, 13122 samples into Exploits, 4958 samples into DoS, 40 samples into Worms, and 17487 samples under Generic class.

Figure 8: Confusion matrix of BBOFS-DRL technique on UNSW-NB-15 dataset
Table 3 defines a detailed IDS outcome of the BBOFS-DRL approach on the test UNSW-NB-15 dataset. The experimental outcomes implied that the BBOFS-DRL model has accomplished enhanced performance on 70% of TRS and 30% of TSS under UNSW-NB-15 dataset. With 70% of TRS, the BBOFS-DRL model has offered average
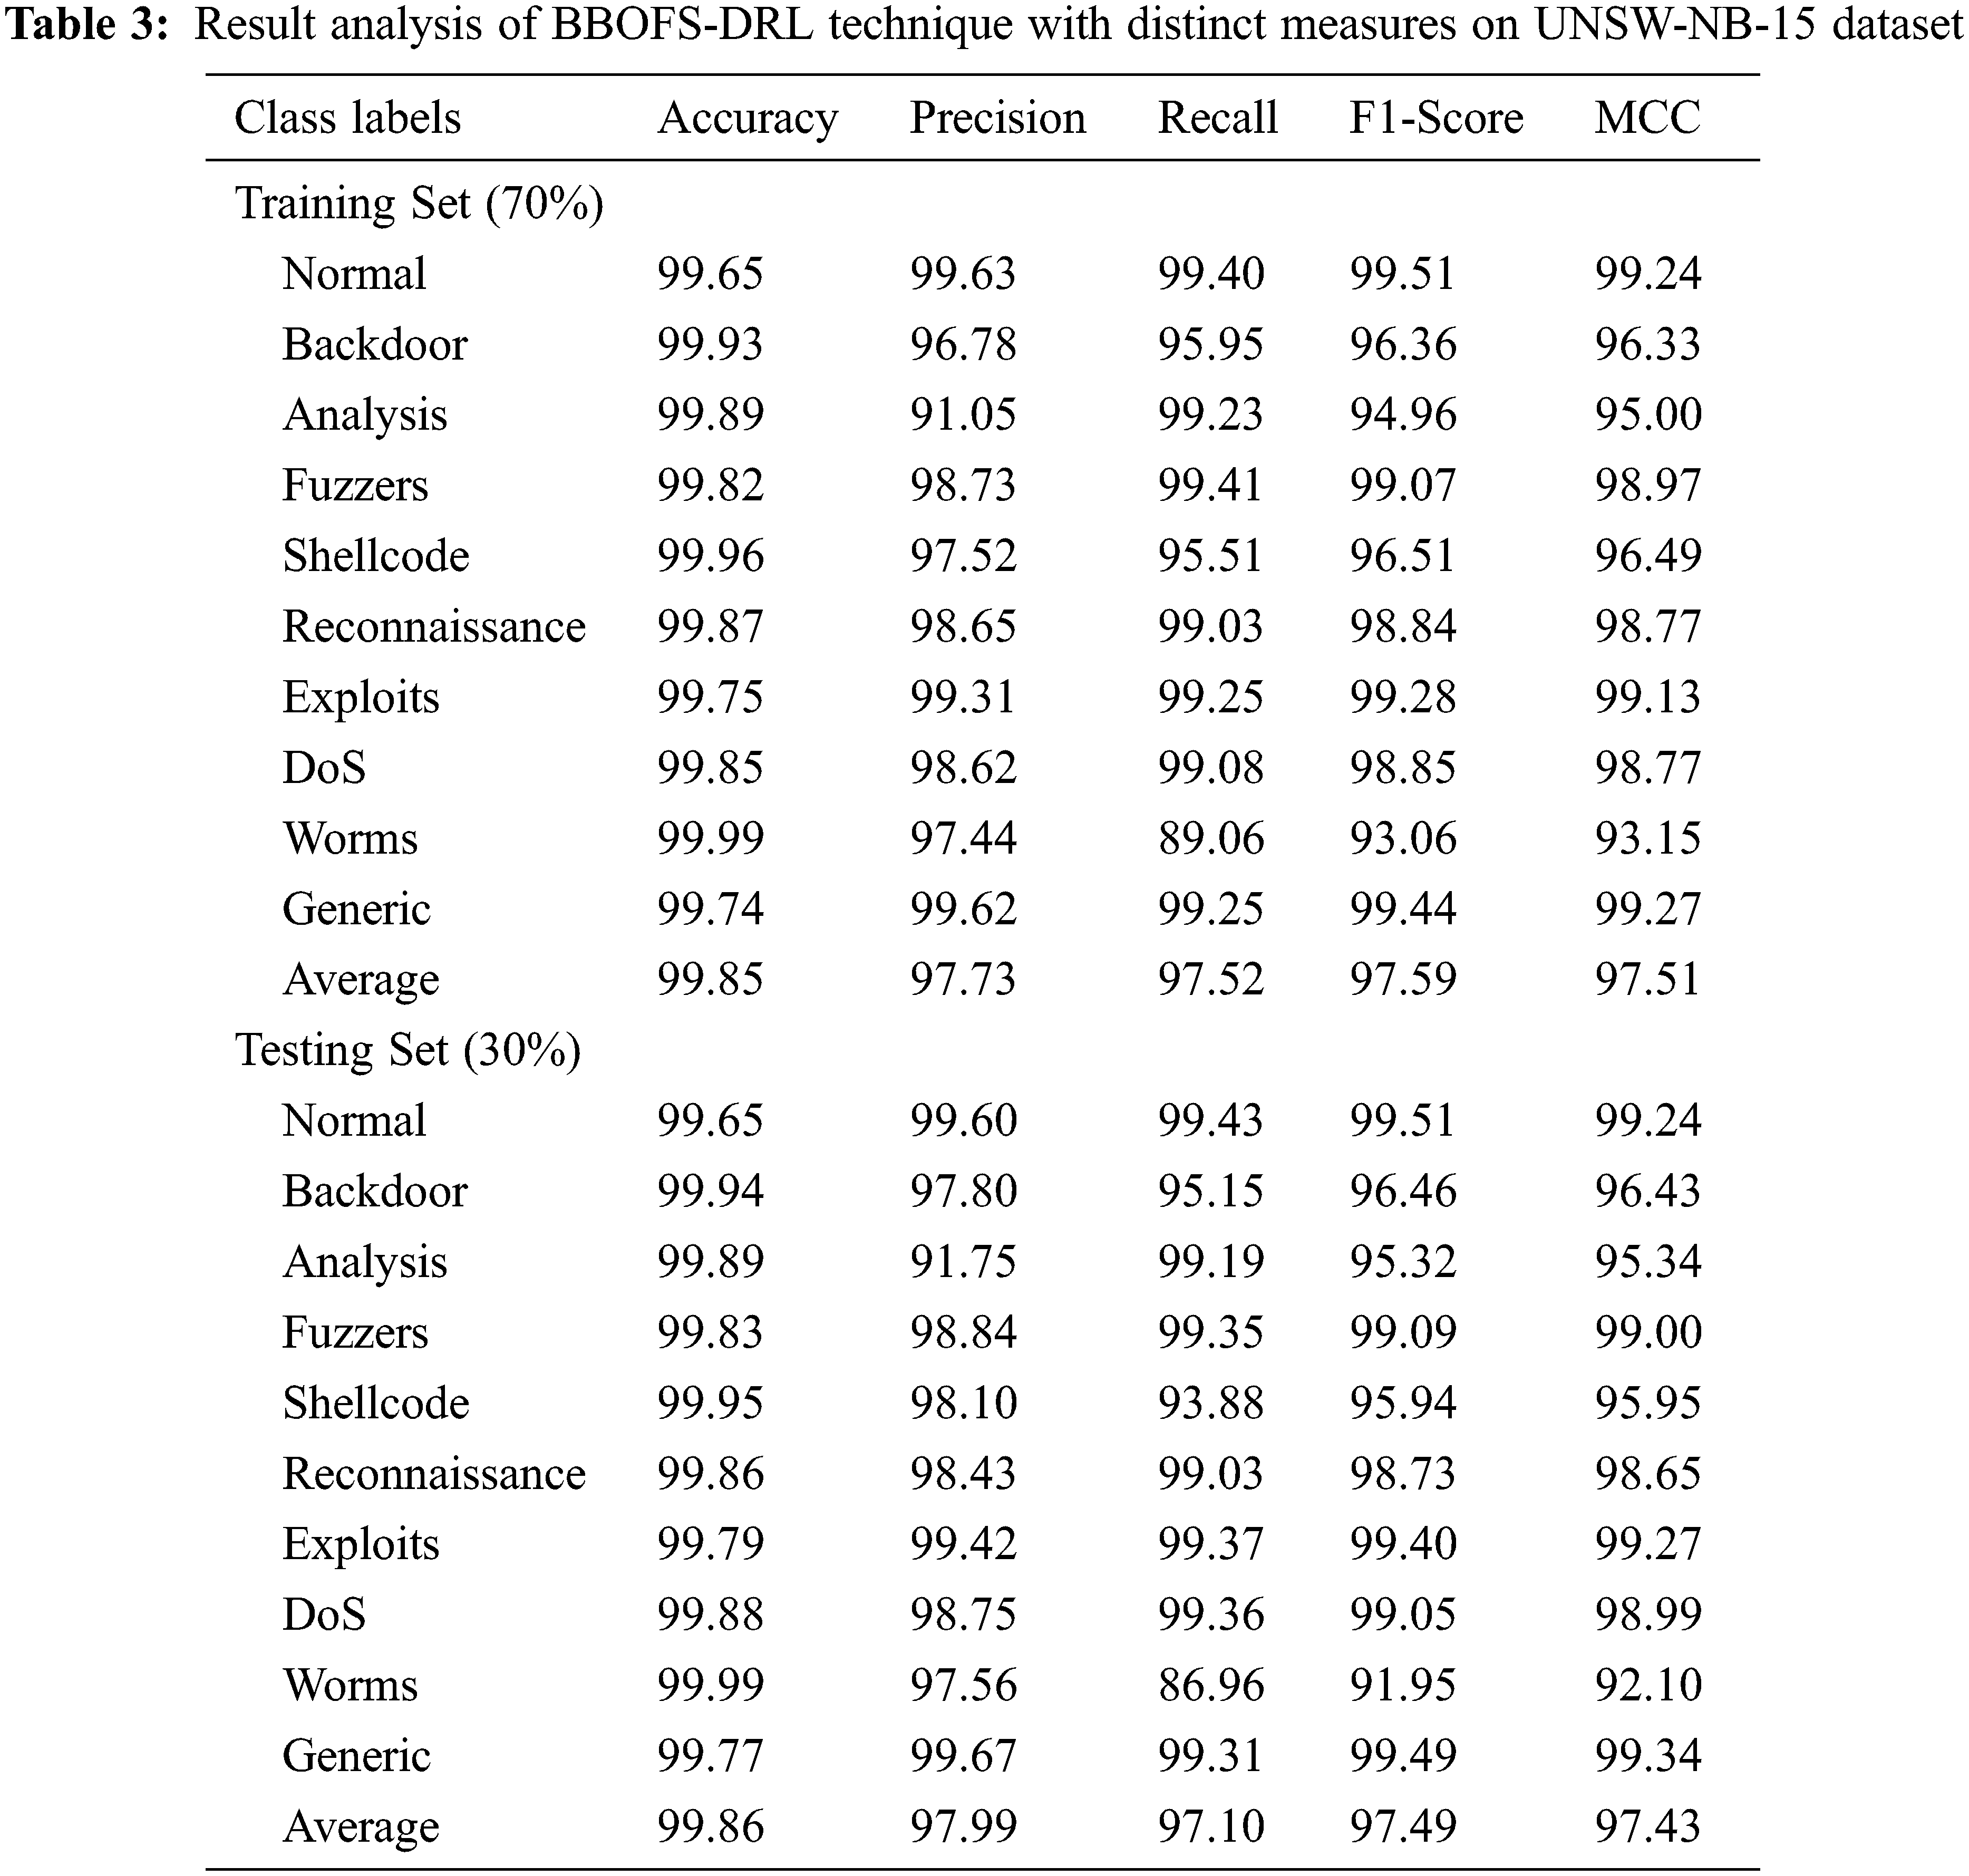
Fig. 9 depicts the precision-recall investigation of the BBOFS-DRL model on UNSW-NB-15 dataset. The figure indicated that the BBOFS-DRL model has accomplished maximum precision-recall values on the distinct class labels.

Figure 9: Precision-recall analysis of BBOFS-DRL method on UNSW-NB-15 dataset
Fig. 10 validates the TA and VA offered by the BBOFS-DRL approach on UNSW-NB-15 dataset. The figure indicated that the BBOFS-DRL model has provided closer TA and VA values with an increase in epoch count. It is observable that the VA is certainly higher than TA.

Figure 10: TA and VA analysis of BBOFS-DRL method on UNSW-NB-15 dataset
Fig. 11 demonstrates the TL and VL provided by the BBOFS-DRL methodology on UNSW-NB-15 dataset. The figure designated that the BBOFS-DRL model has delivered lower TL and VL with an increase in epoch count. It can be noticeable that the VL is definitely lower compared to TL.

Figure 11: TL and VL analysis of BBOFS-DRL method on UNSW-NB-15 dataset
Table 4 and Fig. 12 report a comparative study of the BBOFS-DRL model with recent models in terms of different measures on UNSW-NB-15 dataset. The outcomes demonstrated that the DT, RF, and SVM models have accomplished poor performance with minimal classification results. Afterward, the CNN-Bagging and CNN-Adaboost methods have gained slightly enhanced classifier results. Also, the GCNSE model has reached reasonable performance with
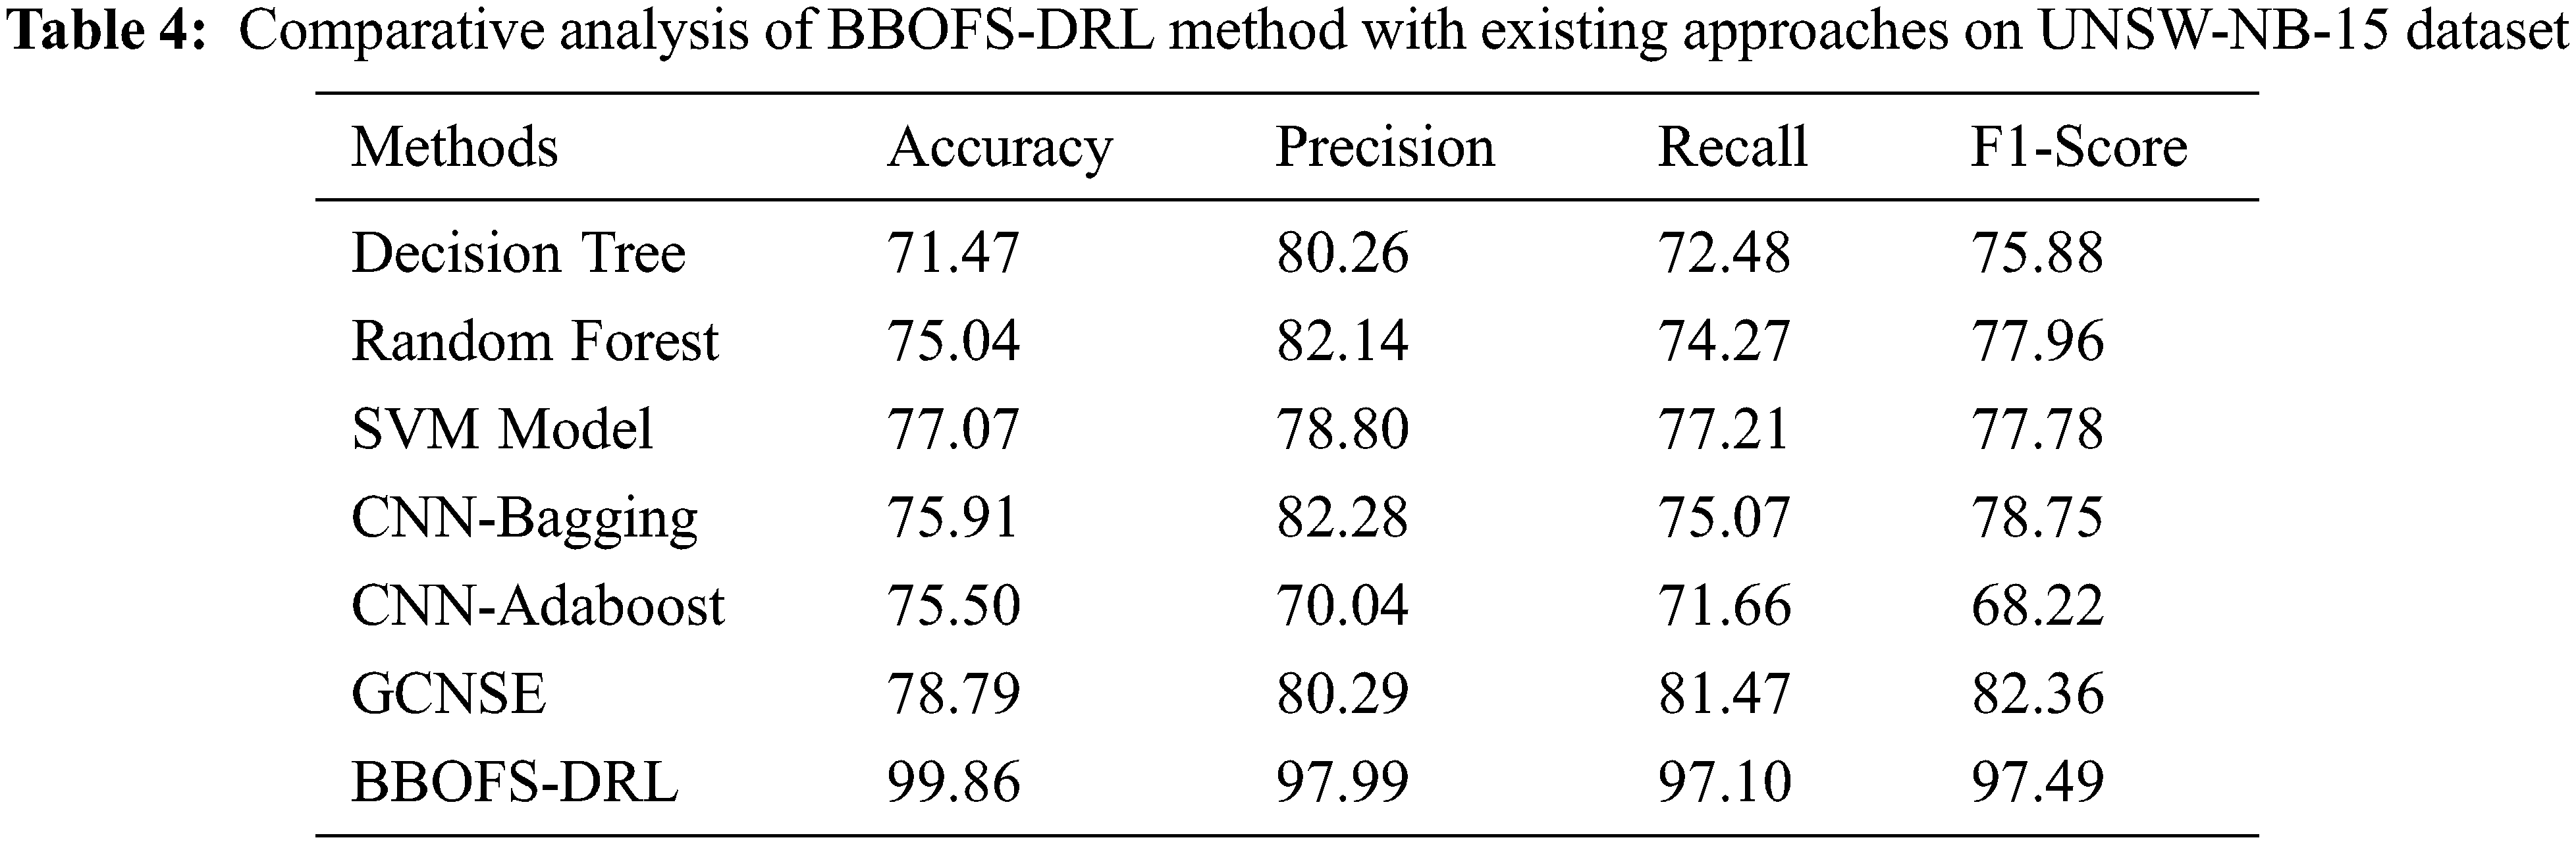

Figure 12: Comparative analysis of BBOFS-DRL method on UNSW-NB-15 dataset
In this article, a new BBOFS-DRL model has been developed for accurate recognition of intrusions in the network. The BBOFS-DRL model initially designed the BBOFS algorithm based on the BOA to elect feature subsets. Besides, DRL model is employed for the proper identification and classification of intrusions that exist in the network. Furthermore, BAS technique is applied to tune the DRL parameters for enhanced intrusion detection efficiency. For ensuring the superior intrusion detection outcomes of the BBOFS-DRL model, a wide-ranging experimental analysis is performed against benchmark dataset. The simulation results reported the supremacy of the BBOFS-DRL model over its recent state of art approaches. Thus, the BBOFS-DRL technique can be utilized for ensuring security. In future, outlier detection models can be integrated into the BBOFS-DRL model to improve its overall efficiency.
Funding Statement: The authors received no specific funding for this study.
Conflicts of Interest: The authors declare that they have no conflicts of interest to report regarding the present study.
References
1. H. Liu and B. Lang, “Machine learning and deep learning methods for intrusion detection systems: A survey,” Applied Sciences, vol. 9, no. 20, pp. 4396, 2019. [Google Scholar]
2. Z. Ahmad, A. S. Khan, C. W. Shiang, J. Abdullah and F. Ahmad, “Network intrusion detection system: A systematic study of machine learning and deep learning approaches,” Transactions on Emerging Telecommunications Technologies, vol. 32, no. 1, pp. e4150, 2021. [Google Scholar]
3. W. Sun, X. Chen, X. R. Zhang, G. Z. Dai, P. S. Chang et al., “A multi-feature learning model with enhanced local attention for vehicle re-identification,” Computers, Materials & Continua, vol. 69, no. 3, pp. 3549–3560, 2021. [Google Scholar]
4. W. Sun, G. C. Zhang, X. R. Zhang, X. Zhang and N. N. Ge, “Fine-grained vehicle type classification using lightweight convolutional neural network with feature optimization and joint learning strategy,” Multimedia Tools and Applications, vol. 80, no. 20, pp. 30803–30816, 2021. [Google Scholar]
5. M. A. Rahman, A. T. Asyhari, L. S. Leong, G. B. Satrya, M. H. Tao et al., “Scalable machine learning-based intrusion detection system for IoT-enabled smart cities,” Sustainable Cities and Society, vol. 61, no. 1, pp. 102324, 2020. [Google Scholar]
6. S. Rawat, A. Srinivasan, V. Ravi and U. Ghosh, “Intrusion detection systems using classical machine learning techniques vs integrated unsupervised feature learning and deep neural network,” Internet Technology Letters, vol. 5, no. 1, pp. e232, 2022. [Google Scholar]
7. G. Kocher and G. Kumar, “Machine learning and deep learning methods for intrusion detection systems: Recent developments and challenges,” Soft Computing, vol. 25, no. 15, pp. 9731–9763, 2021. [Google Scholar]
8. G. D. C. Bertoli, L. A. P. Júnior, O. Saotome, A. L. D. Santos, F. A. N. Verri et al., “An end-to-end framework for machine learning-based network intrusion detection system,” IEEE Access, vol. 9, pp. 106790–106805, 2021. [Google Scholar]
9. E. Alhajjar, P. Maxwell and N. Bastian, “Adversarial machine learning in Network Intrusion Detection Systems,” Expert Systems with Applications, vol. 186, no. 2, pp. 115782, 2021. [Google Scholar]
10. K. Sethi, R. Kumar, N. Prajapati and P. Bera, “Deep reinforcement learning based intrusion detection system for cloud infrastructure,” in 2020 Int. Conf. on COMmunication Systems & NETworkS (COMSNETS), Bengaluru, India, pp. 1–6, 2020. [Google Scholar]
11. A. Wang, W. Wang, H. Zhou and J. Zhang, “Network intrusion detection algorithm combined with group convolution network and snapshot ensemble,” Symmetry, vol. 13, no. 10, pp. 1814, 2021. [Google Scholar]
12. M. S. A. Daweri, K. A. Z. Ariffin, S. Abdullah and M. F. E. M. Senan, “An analysis of the kdd99 and unsw-nb15 datasets for the intrusion detection system,” Symmetry, vol. 12, no. 10, pp. 1666, 2020. [Google Scholar]
13. K. Kotecha, R. Verma, P. V. Rao, P. Prasad, V. K. Mishra et al., “Enhanced network intrusion detection system,” Sensors, vol. 21, no. 23, pp. 7835, 2021. [Google Scholar] [PubMed]
14. I. Ahmad, Q. E. Ul Haq, M. Imran, M. O. Alassafi and R. A. AlGhamdi, “An efficient network intrusion detection and classification system,” Mathematics, vol. 10, no. 3, pp. 530, 2022. [Google Scholar]
15. E. Jaw and X. Wang, “Feature selection and ensemble-based intrusion detection system: An efficient and comprehensive approach,” Symmetry, vol. 13, no. 10, pp. 1764, 2021. [Google Scholar]
16. S. Arora and S. Singh, “Butterfly optimization algorithm: A novel approach for global optimization,” Soft Computing, vol. 23, no. 3, pp. 715–734, 2019. [Google Scholar]
17. P. Dong, Z. M. Chen, X. W. Liao and W. Yu, “A deep reinforcement learning (DRL) based approach for well-testing interpretation to evaluate reservoir parameters,” Petroleum Science, vol. 19, no. 1, pp. 264–278, 2022. [Google Scholar]
18. Z. Zhu, Z. Zhang, W. Man, X. Tong, J. Qiu et al., “A new beetle antennae search algorithm for multi-objective energy management in microgrid,” in 2018 13th IEEE Conf. on Industrial Electronics and Applications (ICIEA), Wuhan, pp. 1599–1603, 2018. [Google Scholar]
Cite This Article
 Copyright © 2023 The Author(s). Published by Tech Science Press.
This work is licensed under a Creative Commons Attribution 4.0 International License , which permits unrestricted use, distribution, and reproduction in any medium, provided the original work is properly cited.
 Downloads
 Citation Tools