
 Submit a Paper
 Propose a Special lssue
 Open Access
ARTICLE

Chicken Swarm Optimization with Deep Learning Based Packaged Rooftop Units Fault Diagnosis Model
1 Department of Electronics and Instrumentation Engineering, B. S. Abdur Rahman Crescent Institute of Science and Technology, Chennai, 600048, India
2 Department of Computer Science and Engineering, University Institute of Engineering and Technology (UIET), Guru Nanak University, Hyderabad, India
3 Department of Electrical Engineering, College of Engineering, Jouf University, Saudi Arabia
4 Department of Computer Science and Engineering, Vignan’s Institute of Information Technology, Visakhapatnam, 530049, India
5 Department of Computer Science and Engineering, Sejong University, Seoul, 05006, Korea
6 Seculayer Company, Ltd., Seoul, 04784, Korea
* Corresponding Author: Jinsang You. Email:
Computer Systems Science and Engineering 2023, 47(1), 221-238. https://doi.org/10.32604/csse.2023.036479
Received 01 October 2022; Accepted 17 February 2023; Issue published 26 May 2023
 View Full Text
 Download PDF
Abstract
Rooftop units (RTUs) were commonly employed in small commercial buildings that represent that can frequently do not take the higher level maintenance that chillers receive. Fault detection and diagnosis (FDD) tools can be employed for RTU methods to ensure essential faults are addressed promptly. In this aspect, this article presents an Optimal Deep Belief Network based Fault Detection and Classification on Packaged Rooftop Units (ODBNFDC-PRTU) model. The ODBNFDC-PRTU technique considers fault diagnosis as a multi-class classification problem and is handled using DL models. For fault diagnosis in RTUs, the ODBNFDC-PRTU model exploits the deep belief network (DBN) classification model, which identifies seven distinct types of faults. At the same time, the chicken swarm optimization (CSO) algorithm-based hyperparameter tuning technique is utilized for resolving the trial and error hyperparameter selection process, showing the novelty of the work. To illustrate the enhanced performance of the ODBNFDC-PRTU algorithm, a comprehensive set of simulations are applied. The comparison study described the improvement of the ODBNFDC-PRTU method over other recent FDD algorithms with maximum accuracy of 99.30% and TPR of 93.09%.Keywords
Fault detection and diagnostic (FDD) models have gained significant interest in the area of space-conditioning equipment as an approach to reducing energy consumption and refrigerant emissions and providing more reliable comfort. Air conditioning equipment utilizes a substantial amount of energy in the United States. In commercial buildings, mostly medium-sized and small buildings, packaged rooftop unit (RTU) system becomes the most typical type of air-conditioning system. RTUs were employed in 46% of all commercial buildings and serve over 60% of commercial building floor space in the United States [1–3]. The main energy utilization linked with RTUs was beyond 2.6 quads yearly. Thus, a minor enhancement in efficacy or part load functioning of such units could cause important minimizations of carbon emissions and energy utility [4]. Apart from discovering methods for improving the part load performances, there is a necessity to improve the persistence of RTU functions. For instance, an air-side economizer could offset an important fraction of the cooling necessities in dry and mild weather conditions [5,6]. But several researchers proved that a substantial fraction of economists has control over RTUs that do not work as envisioned [7]. Along with the operational perplexities with air-side economists, several researchers stated issues with the refrigerant-side functioning as well. Fig. 1 showcases the sample infrastructure of RTU.

Figure 1: Sample structure of RTU in a commercial building
Though the advanced controller grants a substantial development in part load efficacy, it does not assure the persistence of functions [8–10]. To ensure persistence, there comes a necessity for automatic fault detection and diagnosis (AFDD) [11]. RTU diagnoses (refrigerant-side and air-side) were typically positioned offline through a collection of data from the RTUs, which were compiled for framing automatic mechanisms or utilizing retrofit packages [12]. Diagnosis utilizing offline approaches [13] was of limited utility because many RTUs do not install every sensor essential for diagnosis, particularly a refrigerant-side diagnosis. Using a retrofit monitoring and diagnostics package could ease the sensor’s complexities [14]. But it is costly to install an AFDD method [15]. To meet the cost, DOE has funded the expansion of a low-cost monitoring and diagnostic approach [16]. The low-cost method minimizes the requirement to sense by utilizing 2 (outdoor-air temperature and unit power) or 3 sensors. The low-cost approach could identify the degradations in RTU operations over time; however, it contains confines in detecting the real cause of the fault [17].
Many FDD techniques formulated for packaged air conditioners are rule related means a set of professional rules which is based on the physical traits of the mechanism were implemented to measure data [18,19]. Rules are implemented for functioning parameters like observable conduct or suction superheat [9]. Several rule-related FDD tools were effective, but there comes a challenge. A common difficulty for the FDD techniques is differentiating unfaulted and faulted operations in unusual operating circumstances. Typical rule-related approaches imply an exceeded threshold, and choosing this threshold suitably becomes difficult [20,21].
Zhang et al. [22] formulated a new analysis method that broadly assesses sensor fault on sensor choosing and FDD accuracy. Monte Carlo simulations can be implemented for dealing with many stochastic sensor inaccuracies and offer probabilistic scrutiny fallouts of the effect of sensor inaccuracies on FDD accuracy and sensor selection. This method emphasizes the net effect of the fault state over a complete sensor set. The advanced method is utilized for operation stage sensors maintenance and prior-stage sensor model. Bezyan et al. [23] introduce a new technique for diagnosing and detecting many faults in the air handling unit (AHU) of the HVAC mechanism of an institutional building during heating seasons. The presented algorithm guides the search for faults through the operation flow and information among sensors. Support vector regression (SVR) methods, advanced from the building automation system (BAS) trend dataset, forecasted air temperatures of 2 targeted sensors in normal functioning circumstances without familiar issues.
Woradechjumroen et al. [24] devise a new fault-detecting approach for fault HVAC functions based on issues in repetitive functions and the excess energy utility of the refrigeration mechanism. Four steps were advanced as a new unfavourable communication approach for identifying abnormal HVAC functions related to identifying energy signs. Zonal and outdoor air temperatures (OAT and ZAT) were used to specify common area functions for rooftop units (RTUs). An FD method was projected related to RTU outliers utilizing plots of ZAT and OAT vs. the refrigeration method’s energy utilisation related to fixed 10% changes from the indoor relative humidity range. Rogers et al. [25] offer a technique for obtaining chief functioning parameters for air conditioning systems (system efficiency, airflow rate, refrigerant mass flow, and cooling capacity) in a way, i.e., more suitable for the residential sectors. The devised air-side sensing approach needs fewer sensors and is an important benefit for residential split mechanisms due to the necessity of no outdoor unit sensor.
Granderson et al. [26] offer a primary public dataset with ground-truth data on the absence and presence of constructing faults. This data spans a range of seasons and operational circumstances and involves many construction systems kinds. In [27], the difficulty of the VAV technique demonstrating is dispersed with hierarchical modelling structure, and system level to element scale FDD strategy for VAV mechanisms utilizing integrated quantitative, residual, and qualitative methods was advanced. The 3 layers of the modelling structure, like the component layer, system layer, and unit layer, adopt distinct modelling and FD approaches for improving the FDD’s reliability and accuracy.
This study presents an Optimal Deep Belief Network based Fault Detection and Classification on Packaged Rooftop Units (ODBNFDC-PRTU) model. The ODBNFDC-PRTU technique considers fault diagnosis a multi-class classification problem and is handled using DL models. For fault diagnosis in RTUs, the ODBNFDC-PRTU model exploits the deep belief network (DBN) classification model, identifying seven distinct types of faults. At the same time, the chicken swarm optimization (CSO) algorithm-based hyperparameter tuning technique is utilized for resolving the trial-and-error hyperparameter selection process. A comprehensive set of simulations is implemented to depict the improved performances of the ODBNFDC-PRTU method.
The rest of the study is organized as follows. Section 2 offers the proposed model, and Section 3 discusses the performance validation. Finally, Section 4 draws the concluding remarks.
In this study, a new ODBNFDC-PRTU model was introduced to identify and classify faults in PRTUs. The ODBNFDC-PRTU approach considers fault diagnosis as a multi-class classification problem and is handled using DL models. For fault diagnosis in RTUs, the ODBNFDC-PRTU model uses the DBN classification model, which identifies seven distinct types of faults. At the same time, the CSO algorithm-based hyperparameter tuning technique is utilized for resolving the trial-and-error hyperparameter selection process.
Faults in RTU methods are separated into 2 classes: soft faults and hard failures. The hard failures take place rudely and reason RTU to stop operating. The soft faults reduce system efficiency; however, they allow the continued function of the method. Hard failures like compressor failure often occur from RTU methods and are costly to repair [28]. But, it can be simply identified and analyzed with an inexpensive sensor. For the sample, the compressor failure is simply identified and detected by verifying a compressor’s outlet and inlet temperatures. The hard failures were classically produced by extended function periods with soft faults. The concentration of this examination is on detecting and diagnosing the subsequent soft faults: (i) evaporator airflow reduction (EA), (ii) refrigerant undercharge (UC), (iii) non-condensable gas (NC), (iv) refrigerant overcharge (OC), (v) compressor valve leakage (VL), (vi) liquid-line restriction (LL), and (vii) condenser airflow reduction (CA).
2.2 Fault Detection and Classification
In this study, the DBN method was employed to detect and classify faults. Based on biological neural networks, a DBN is a probability generation module that has been proposed [29]. The DBN infers the sampling distribution for the input dataset based on the joint likelihood distribution. The whole network generates an inherent feature dataset with maximal probability by fine-tuning the weight coefficients between the network layers. Fig. 2 showcases the infrastructure of DBN, which is generally composed of a classifier and restricted Boltzmann machine (RBM) a. A classifier is a crucial component in accomplishing fault detection in a DBN. In this study, different kinds of faults should be identified. Consequently, an RBM and a Softmax classification are selected to construct the DBN. Unlike the conventional binary classifiers, a Softmax classification is preferable for classifying many conflicting events.

Figure 2: Structure of DBN
If
RBM is an undirected graph method that is utilized for resolving the value of the variable
The RBM task was utilised to fit the input-trained dataset, design the optimum parameter
Whereas
The aim is to resolve the optimum variable
Because the sample count of T was identified, the partial derivative of the logarithmic likelihood function for the connection weight
In Eq. (4),
The CSO technique was utilised in this work for optimal modification of the hyperparameters related to the DBN method. The concept for the basic CSO algorithm is shown in the following [30]:
1) Chicken swarm comprises distinct groups. Each group has a pair of hen, chick, and dominant roosters.
2) According to the fitness value estimated for individuals in this chicken swarm, an individual with a good fitness value is applied as a rooster, whereas some individuals with poor fitness value are applied as a chick. Other individuals are applied as hens.
3) Given that the several roosters in a chicken swarm as
4) Afterwards, for each G iteration, the individual is re-determined based on the fitness value and is applied as a rooster. An individual is applied as a hen, and other individuals are applied as a chick.
5) Within each population group, the hen follows the rooster to discover food and compete arbitrarily with other individuals for food. An individual with a better fitness value in the population is more likely to receive food.
Chicks, roosters, and hens in the chicken swarm utilize different position upgrading equations, and it is shown in the following
Consider R represents the individual rooster,
Now,
Here,
Here, m denotes the chick mother indices in
The CSO system grows a fitness function (FF) for accomplishing higher classifier performances. It explains a positive numeral for representing optimal performances of candidate results. The minimized classifier error rate was supposed to be that FF is providing in Eq. (12).
This section assesses the performance of the ODBNFDC-PRTU method utilizing a dataset comprising 2851 samples under eight classes, as illustrated in Table 1.

Fig. 3 emphasizes the confusion matrices generated by the ODBNFDC-PRTU algorithm on applied data. With the entire dataset, the ODBNFDC-PRTU approach identified 382 instances under the UC class, 508 instances under the OC class, 521 instances under the VL class, 329 instances under the LL class, 394 instances under the CA class, 357 instances under EA, 238 instances under NC, and 26 instances under NF. Additionally, with 70% of training (TR) data, the ODBNFDC-PRTU approach has identified 274 instances under the UC class, 351 instances under the OC class, 362 instances under the VL class, 228 instances under the LL class, 278 instances under the CA class, 247 instances under EA, 165 instances under NC, and 18 instances under NF. Moreover, with 30% of Testing (TS) data, the ODBNFDC-PRTU algorithm has identified 108 instances under the UC class, 157 instances under the OC class, 159 instances under the VL class, 101 instances under the LL class, 116 instances under the CA class, 110 instances under EA, 73 instances under NC, and 8 instances under NF.


Figure 3: Confusion matrices of ODBNFDC-PRTU approach (a) entire dataset, (b) 70% of TR data, and (c) 30% of TS data
Table 2 and Fig. 4 demonstrate the overall results of the ODBNFDC-PRTU approach on the entire dataset. The experimental values inferred from the ODBNFDC-PRTU algorithm have obtained enhanced results under each class. For instance, in UC class, the ODBNFDC-PRTU model has offered


Figure 4: Average analysis of the ODBNFDC-PRTU approach under the entire dataset
Table 3 and Fig. 5 illustrate detailed results of the ODBNFDC-PRTU algorithm on 70% of TR data. The experimental values denoted by the ODBNFDC-PRTU approach have gained enhanced results under each class. For example, in UC class, the ODBNFDC-PRTU technique has presented


Figure 5: Average analysis of ODBNFDC-PRTU approach under 70% of TR data
Table 4 and Fig. 6 portray the overall results of the ODBNFDC-PRTU approach on 30% of TS data. The experimental values implicit in the ODBNFDC-PRTU technique have reached enhanced results under each class. For example, in UC class, the ODBNFDC-PRTU approach has presented
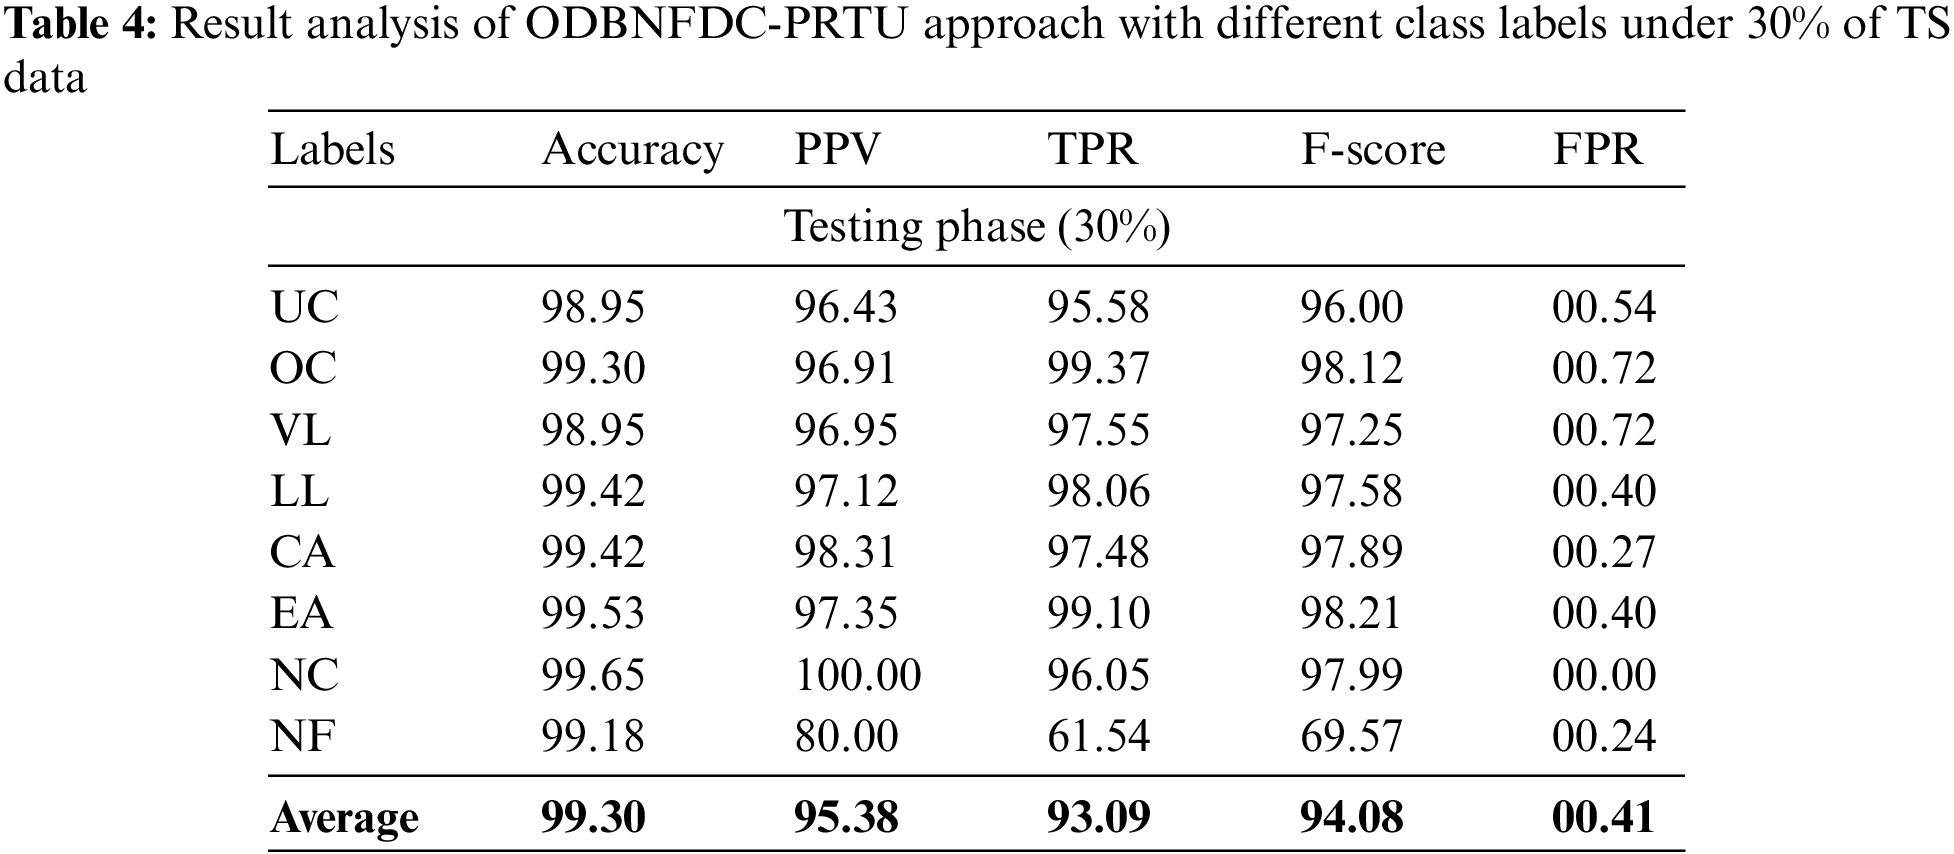

Figure 6: Average analysis of ODBNFDC-PRTU approach under 30% of TS data
The training accuracy (TRA) and validation accuracy (VLA) reached by the ODBNFDC-PRTU methodology on the test dataset is shown in Fig. 7. The experimental outcome represents the ODBNFDC-PRTU algorithm has acquired maximum values of TRA and VLA. Seemingly the VLA is greater than TRA.

Figure 7: TRA and VLA analysis of ODBNFDC-PRTU methodology
The training loss (TRL) and validation loss (VLL) obtained by the ODBNFDC-PRTU approach on the test dataset were depicted in Fig. 8. The experimental result indicated the ODBNFDC-PRTU method had exhibited least values of TRL and VLL. Particularly, the VLL is lesser than TRL.

Figure 8: TRL and VLL analysis of ODBNFDC-PRTU methodology
A clear precision-recall analysis of the ODBNFDC-PRTU algorithm on the test dataset is depicted in Fig. 9. The figure signifies the ODBNFDC-PRTU technique has resulted in enhanced values of precision-recall values in all classes.

Figure 9: Precision-recall analysis of ODBNFDC-PRTU methodology
A brief ROC analysis of the ODBNFDC-PRTU method on the test dataset is depicted in Fig. 10. The outcomes represented the ODBNFDC-PRTU algorithm exemplified its ability to categorize distinct classes on the test dataset.

Figure 10: ROC analysis of ODBNFDC-PRTU methodology
Table 5 reports an overall comparison study of the ODBNFDC-PRTU model with recent models interms of
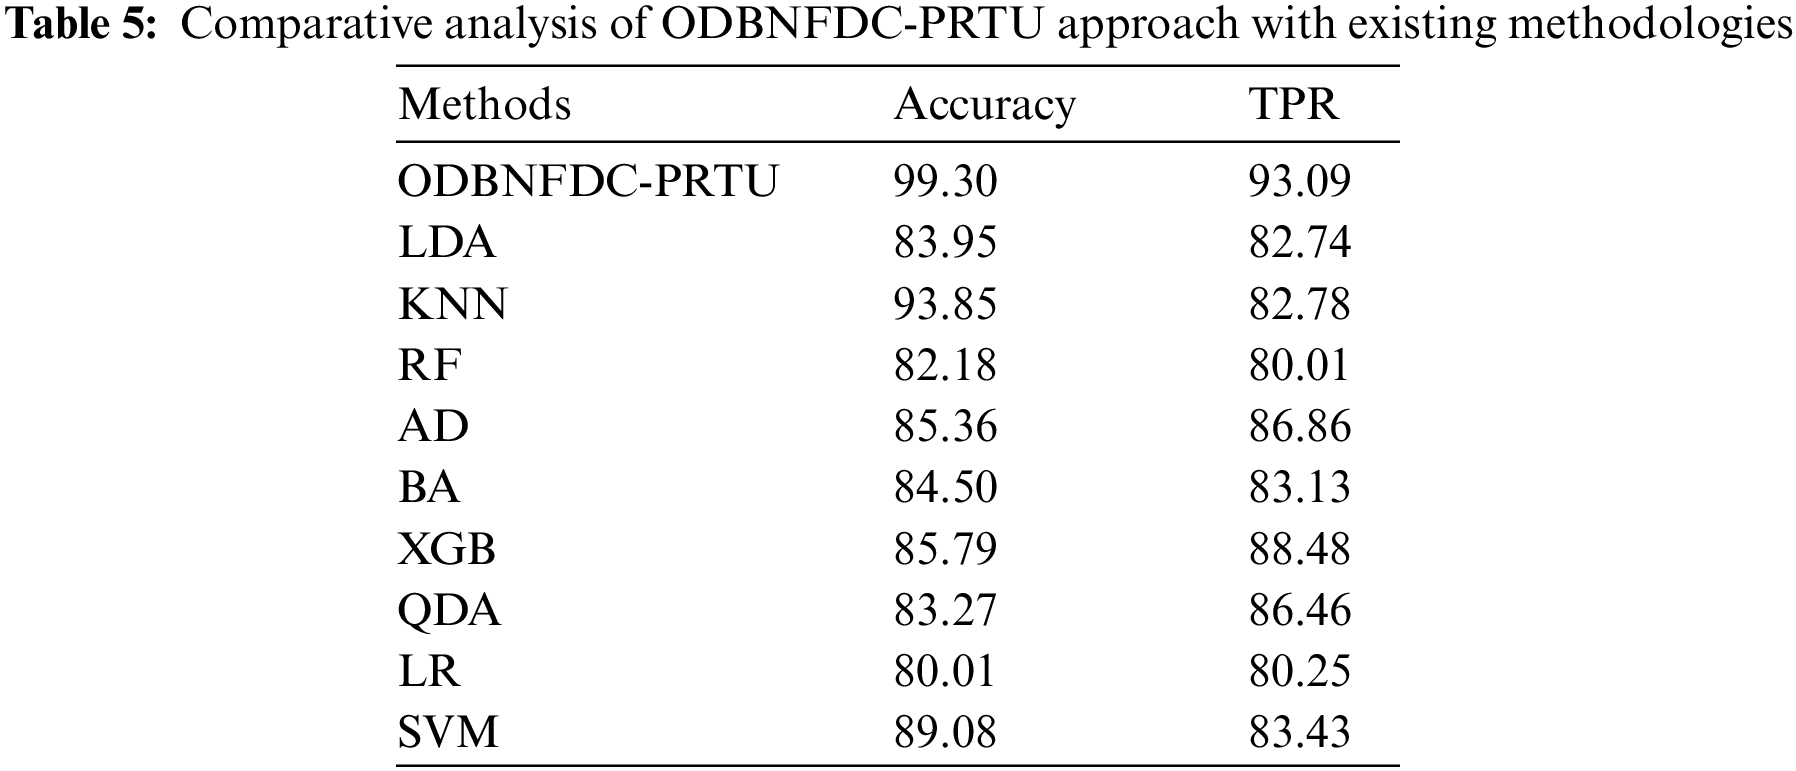

Figure 11:
Fig. 12 validates a brief TPR study of the ODBNFDC-PRTU approach with existing techniques. The figure implied the LR and RF algorithms have exhibited poor results with minimum TPR of 80.25% and 80.01% correspondingly. Next, the QDA, LDA, BA, AD, and XGB models have resulted in slightly enhanced TPR of 86.46%, 82.74%, 83.13%, 86.86%, and 88.48%, correspondingly. Then, the SVM algorithm acquired a considerable TPR of 83.43%. Although the KNN approach has gained a reasonable TPR of 82.78%, the ODBNFDC-PRTU technique has exposed enhanced results with a minimal TPR of 93.09%.

Figure 12: TPR analysis of ODBNFDC-PRTU approach with existing methodologies
From these results and discussion, it is assumed that the ODBNFDC-PRTU model has accomplished enhanced performance over other models.
In this paper, a new ODBNFDC-PRTU technique was introduced for the identification and classification of faults in PRTUs. The presented ODBNFDC-PRTU technique considered fault diagnosis as a multi-class classification problem and is handled by the use of DL models. For fault diagnosis in RTUs, the ODBNFDC-PRTU model makes use of the DBN classification model, which identifies seven distinct types of faults. At the same time, the CSO algorithm-based hyperparameter tuning technique is utilized for resolving the trial-and-error hyperparameter selection process. For showing the enriched performances of the ODBNFDC-PRTU model, a comprehensive set of simulations is applied. The comparison study reported the improvement of the ODBNFDC-PRTU technique over other recent FDD methodologies with maximum accuracy of 99.30% and TPR of 93.09%. In future, data handling and feature selection algorithms are incorporated to enhance the classification results.
Funding Statement: This work was supported by Institute of Information & communications Technology Planning & Evaluation (IITP) grant funded by the Korea government (MSIT) (No. 2020-0-00107, Development of the technology to automate the recommendations for big data analytic models that define data characteristics and problems).
Conflicts of Interest: The authors declare that they have no conflicts of interest to report regarding the present study.
References
1. G. Lin, M. Pritoni, Y. Chen and J. Granderson, “Development and implementation of fault-correction algorithms in fault detection and diagnostics tools,” Energies, vol. 13, no. 10, pp. 2598, 2020. [Google Scholar]
2. A. Rafati, H. R. Shaker and S. Ghahghahzadeh, “Fault detection and efficiency assessment for hvac systems using non-intrusive load monitoring: A review,” Energies, vol. 15, no. 1, pp. 341, 2022. [Google Scholar]
3. J. Hou and A. Zhu, “Fake online review recognition algorithm and optimisation research based on deep learning,” Applied Mathematics and Nonlinear Sciences, vol. 7, no. 2, pp. 861–874, 2022. [Google Scholar]
4. Y. Zheng, X. Hu, and H. Sun, “Research on motion control for a mobile robot using learning control method,” Applied Mathematics and Nonlinear Sciences, vol. 6, no. 1, pp. 227–234, 2021. [Google Scholar]
5. H. Hu, X. Huang, M. A. Suhaim, and H. Zhang, “Comparison of compression estimations under the penalty functions of different violent crimes on campus through deep learning and linear spatial autoregressive models,” Applied Mathematics and Nonlinear Sciences, vol. 7, no. 1, pp. 739–750, 2022. [Google Scholar]
6. S. Liu, C. -V. Spiridonidis, and M. A. Khder, “Cognitive computational model using machine learning algorithm in artificial intelligence environment,” Applied Mathematics and Nonlinear Sciences, vol. 7, no. 1, pp. 803–814, 2022. [Google Scholar]
7. Y. Zhong, G. Ruan, E. Abozinadah, and J. Jiang, “Least-squares method and deep learning in the identification and analysis of name-plates of power equipment,” Applied Mathematics and Nonlinear Sciences, vol. 7, no. 1, pp. 103–112, 2022. [Google Scholar]
8. C. Mattera, J. Quevedo, T. Escobet, H. Shaker and M. Jradi, “A method for fault detection and diagnostics in ventilation units using virtual sensors,” Sensors, vol. 18, no. 11, pp. 3931, 2018. [Google Scholar] [PubMed]
9. W. V. Payne, J. Heo and P. A. Domanski, “A data-clustering technique for fault detection and diagnostics in field-assembled air conditioners,” International Journal of Air-Conditioning and Refrigeration, vol. 26, no. 02, pp. 1850015, 2018. [Google Scholar]
10. Y. Li and Z. O’Neill, “A critical review of fault modeling of HVAC systems in buildings,” Building Simulation, vol. 11, no. 5, pp. 953–975, 2018. [Google Scholar]
11. R. Dasgupta, A. Sakzad, and C. Rudolph, “Cyber attacks in transactive energy market-based microgrid systems,” Energies, vol. 14, no. 4, pp. 1137, 2021. https://doi.org/10.3390/en14041137 [Google Scholar] [CrossRef]
12. J. Li, X. Shao and R. Sun, “A DBN-based deep neural network model with multitask learning for online air quality prediction,” Journal of Control Science and Engineering, vol. 2019, pp. 1–9, 2019. https://doi.org/10.1155/2019/5304535 [Google Scholar] [CrossRef]
13. H. B. Salau, A. M. Aibinu, Z. Wang, A. J. Onumanyi, E. N. Onwuka et al. “An optimized routing algorithm for vehicle ad-hoc networks,” Engineering Science and Technology, an International Journal, vol. 22, no. 3, pp. 754–766, 2019. [Google Scholar]
14. J. I. Z. Chen and S. Smys, “Optimized dynamic routing in multimedia vehicular networks,” Journal of Information Technology, vol. 2, no. 3, pp. 174–182, 2020. [Google Scholar]
15. P. Kaushal, M. Khurana and K. R. Ramkumar, “A systematic review of swarm intelligence algorithms to perform routing for vanets communication,” ECS Transactions, vol. 107, no. 1, pp. 5027, 2022. [Google Scholar]
16. K. Ghosh, S. Roy and P. K. Das, “I-min: An intelligent fermat point based energy efficient geographic packet forwarding technique for wireless sensor and ad hoc networks,” International Journal on Applications of Wireless Ad hoc Networks and Sensor Networks, vol. 2, no. 2, pp. 34–44, 2010. [Google Scholar]
17. I. V. Pustokhina, D. A. Pustokhin, T. Vaiyapuri, D. Gupta, S. Kumar et al., “An automated deep learning based anomaly detection in pedestrian walkways for vulnerable road users safety,” Safety Science, vol. 142, pp. 105356, 2021. [Google Scholar]
18. M. A. Mohamed, A. Hajjiah, K. A. Alnowibet, A. F. Alrasheedi, E. M. Awwad et al., “A secured advanced management architecture in peer-to-peer energy trading for multi-microgrid in the stochastic environment,” IEEE Access, vol. 9, pp. 92083–92100, 2021. [Google Scholar]
19. T. Chen and S. Bu, “Realistic peer-to-peer energy trading model for microgrids using deep reinforcement learning,” in 2019 IEEE PES Innovative Smart Grid Technologies Europe (ISGT-Europe), Bucharest, Romania, pp. 1–5, September 2019. [Google Scholar]
20. D. Qiu, Y. Ye, D. Papadaskalopoulos and G. Strbac, “Scalable coordinated management of peer-to-peer energy trading: A multi-cluster deep reinforcement learning approach,” Applied Energy, vol. 292, pp. 116940, 2021. [Google Scholar]
21. F. Jamil, N. Iqbal, Imran, S. Ahmad and D. Kim, “Peer-to-peer energy trading mechanism based on blockchain and machine learning for sustainable electrical power supply in smart grid,” IEEE Access, vol. 9, pp. 39193–39217, 2021. [Google Scholar]
22. L. Zhang and M. Leach, “Evaluate the impact of sensor accuracy on model performance in data-driven building fault detection and diagnostics using monte carlo simulation,” Building Simulation, vol. 15, no. 5, pp. 769–778, 2022. [Google Scholar]
23. B. Bezyan and R. Zmeureanu, “Detection and diagnosis of dependent faults that trigger false symptoms of heating and mechanical ventilation systems using combined machine learning and rule-based techniques,” Energies, vol. 15, no. 5, pp. 1691, 2022. [Google Scholar]
24. D. Woradechjumroen and T. Leephakpreeda, “Fault detection involving unfavorable interaction effects to enhance the fault diagnostics of refrigeration systems in commercial supermarkets,” Journal of the Brazilian Society of Mechanical Sciences and Engineering, vol. 43, no. 5, pp. 1–15, 2021. [Google Scholar]
25. A. Rogers, F. Guo and B. Rasmussen, “Uncertainty analysis and field implementation of a fault detection method for residential HVAC systems,” Science and Technology for the Built Environment, vol. 26, no. 3, pp. 320–333, 2019. [Google Scholar]
26. J. Granderson, G. Lin, A. Harding, P. Im and Y. Chen et al. “Building fault detection data to aid diagnostic algorithm creation and performance testing,” Scientific Data, vol. 7, no. 1, pp. 65, 2020. [Google Scholar] [PubMed]
27. D. Wei, H. Feng, Q. Han and K. Jia, “Fault detection and diagnosis for variable-air-volume systems using combined residual, qualitative and quantitative techniques,” Energy and Buildings, vol. 254, pp. 111491, 2022. [Google Scholar]
28. A. Ebrahimifakhar, A. Kabirikopaei and D. Yuill, “Data-driven fault detection and diagnosis for packaged rooftop units using statistical machine learning classification methods,” Energy and Buildings, vol. 225, pp. 110318, 2020. [Google Scholar]
29. W. Deng, H. Liu, J. Xu, H. Zhao and Y. Song, “An improved quantum-inspired differential evolution algorithm for deep belief network,” IEEE Transactions on Instrumentation and Measurement, vol. 69, no. 10, pp. 7319–7327, 2020. [Google Scholar]
30. D. Zouache, Y. O. Arby, F. Nouioua and F. B. Abdelaziz, “Multi-objective chicken swarm optimization: A novel algorithm for solving multi-objective optimization problems,” Computers & Industrial Engineering, vol. 129, pp. 377–391, 2019. [Google Scholar]
Cite This Article
 Copyright © 2023 The Author(s). Published by Tech Science Press.
This work is licensed under a Creative Commons Attribution 4.0 International License , which permits unrestricted use, distribution, and reproduction in any medium, provided the original work is properly cited.
 Downloads
 Citation Tools