
 Submit a Paper
 Propose a Special lssue
 Open Access
ARTICLE

COVID TCL: A Joint Metric Loss Function for Diagnosing COVID-19 Patient in the Early and Incubation Period
1 Department of Electromechanical Engineering, Zhejiang Business Technology Institute, Ningbo, 315012, China
2 Engineering Research Center of Digital Forensics, Ministry of Education, Jiangsu Engineering Center of Network Monitoring, School of Computer and Software, Nanjing University of Information Science & Technology, Nanjing, 210044, China
3 Wuxi Research Institute, Nanjing University of Information Science & Technology, Wuxi, 214100, China
4 Jiangsu Collaborative Innovation Center of Atmospheric Environment and Equipment Technology (CICAEET), Nanjing University of Information Science & Technology, Nanjing, 210044, China
5 Department of Physics, Faculty of Science, Adani University, Ahmedabad, India
* Corresponding Author: Rui Wen. Email:
Computer Systems Science and Engineering 2023, 47(1), 187-204. https://doi.org/10.32604/csse.2023.037889
Received 20 November 2022; Accepted 17 February 2023; Issue published 26 May 2023
 View Full Text
 Download PDF
Abstract
Convolution Neural Networks (CNN) can quickly diagnose COVID-19 patients by analyzing computed tomography (CT) images of the lung, thereby effectively preventing the spread of COVID-19. However, the existing CNN-based COVID-19 diagnosis models do consider the problem that the lung images of COVID-19 patients in the early stage and incubation period are extremely similar to those of the non-COVID-19 population. Which reduces the model’s classification sensitivity, resulting in a higher probability of the model misdiagnosing COVID-19 patients as non-COVID-19 people. To solve the problem, this paper first attempts to apply triplet loss and center loss to the field of COVID-19 image classification, combining softmax loss to design a jointly supervised metric loss function COVID Triplet-Center Loss (COVID-TCL). Triplet loss can increase inter-class discreteness, and center loss can improve intra-class compactness. Therefore, COVID-TCL can help the CNN-based model to extract more discriminative features and strengthen the diagnostic capacity of COVID-19 patients in the early stage and incubation period. Meanwhile, we use the extreme gradient boosting (XGBoost) as a classifier to design a COVID-19 images classification model of CNN-XGBoost architecture, to further improve the CNN-based model’s classification effect and operation efficiency. The experiment shows that the classification accuracy of the model proposed in this paper is 97.41%, and the sensitivity is 97.61%, which is higher than the other 7 reference models. The COVID-TCL can effectively improve the classification sensitivity of the CNN-based model, the CNN-XGBoost architecture can further improve the CNN-based model’s classification effect.Keywords
The outbreak of COVID-19 forced countries to blockade their doors one after another, and countries were forced to cancel economic trade and the movement of people between each other. It has severely hit the economic development of all countries in the world, and endangered the lives and health of people in all countries. To this day, COVID-19 continues to ravage the world, and scientists suggest that it will coexist with humans for a long time. The effective way to prevent and treat this highly infectious disease is to diagnose and isolate patients promptly, on time to prevent the virus from further spreading. Now, reverse transcription polymerase chain reaction (RT-PCR) is considered the standard method for the diagnosis of novel coronavirus pneumonia, but it takes a long time, has a high false negative rate and low sensitivity, which hind the diagnosis and treatment of COVID-19 patients to some extent [1–5]. And with the development of imaging technology, medical imaging has gradually become the major tool for clinical disease screening, diagnosis, treatment guidance, and evaluation [6]. For people with COVID-19, their lung imaging includes lesions with ground-glass opacities (GGO), lung consolidation, bilateral patchy shadowing, pulmonary fibrosis, multiple lesions, and crazy-paving pattern, and so on [7,8]. Therefore, radiologists can diagnose whether they are infected with a novel coronavirus by observing the characteristics of medical images and analyzing them. However, in the face of a highly contagious disease such as the COVID-19, the huge workload will lead to doctors’ misdiagnosis. But computer-aided diagnosis (CAD) systems can help doctors use the COVID-19 detection method to diagnose quickly and accurately [9,10]. Therefore, it is of great significance to design an accurate and fast COVID-19 diagnostic method that can be introduced into a CAD systems.
Many technologies can be used to diagnose COVID-19 images, among which CNN-based technology has the best effect, which was verified in [11]. Therefore, a large number of CNN-based COVID-19 image classification models have emerged and achieved good results. However, most of the methods do not pay attention to the problem that the lung images of patients in the early stage and incubation period are extremely similar to those of the non-COVID-19 population. Because these methods have low classification sensitivity or without test the sensitivity of the model in the experimental stage. Low sensitivity means the model will misdiagnose COVID-19 patients as non-COVID-19 people. Meanwhile, CNN is characterized by feature extraction, which is considered to be one of the most powerful and effective feature extraction mechanisms, while the traditional classifier of CNN is a fully connected layer, being a single classifier, it cannot fully grasp the extracted complex and diverse deep features [12]. Because based on the “No Free Lunch” theorem, changeable data with different structures and characteristics will greatly affect the prediction accuracy of a single classifier [13]. And the parameter amount of the fully connected layer occupies 80% of the entire CNN, the operating efficiency is low.
To solve the problems, this paper first attempts to combine Triplet loss, Center loss, and softmax loss to design a jointly supervised metric loss function COVID Triplet-Center loss (COVID TCL). Triplet loss forces different feature clusters to be far away from each other, increasing the features’ inter-class distance of different classes and improving the discreteness between classes. Center loss learns the class center of each feature cluster, making the features distribution of each class move closer to the class center, reducing the intra-class distance and improving the compactness between classes. Therefore, through COVID TCL, the different classes’ features can be far away from each other, and the same classes features are close to each other, so that we can extract discriminative features to enhance the model’s ability to distinguish similar images and improve the CNN-based model’s diagnostic ability for the COVID-19 patients in early stage and incubation period.
At the same time, we design a COVID-19 image classification model with a CNN-XGBoost architecture, choose the ResNet50 as the feature extractor to extract the deep features, and then use the extreme gradient boosting (XGBoost) algorithm in ensemble learning to replace the fully connected layer in ResNet50 as the classifier to classify the extracted deep features. Ensemble learning is to combine multiple weak classifiers to obtain a strong classifier to obtain better results than a single classifier. Ditterch explained the basic reasons for the success of ensemble learning from three mathematical perspectives of statistics, calculation, and representativeness, and the bias-variance decomposition analyzes the effectiveness of ensemble learning, these studies proved that ensemble learning has a better learning ability than a single classifier [12,14,15]. XGBoost inherits the advantages of ensemble learning such as high accuracy, flexibility, high efficiency, and easy portability with few parameters, and also further improves its operational efficiency through cache optimization and memory optimization. Therefore, the designed COVID-19 diagnosis model of CNN-XGBoost architecture can not only fully analyze and utilize the extracted features to ensure the diagnosis effect, but also reduce the overall number of parameters of the model to improve the operation efficiency. Meanwhile, the method proposed in this paper can with an excellent epidemic peak time prediction model [16–18], can help governments to achieve accurate prevention and control.
The main contributions of this paper are as follows:
(1) This paper first attempts to introduce Triplet loss and Center loss into the field of COVID-19 image classification, combined with softmax loss to design a joint supervised metric loss function COVID Triplet-Center loss (COVID TCL). Which helps extract distinguishing features, strengthen the model’s ability to classify similar images, and improve the model’s ability to diagnose COVID-19 patients in the early and incubation period.
(2) Design a COVID-19 CT image classification model with CNN-XGBoost architecture, choose ResNet50 as the model feature extractor, and XGBoost as the model’s classifier. The complex and diverse deep features are more fully utilized to obtain a better classification effect than a fully connected layer, while reducing the overall parameter amount and calculation amount of the model and improving the operation efficiency.
(3) Compared with other methods, the classification indicators of the COVID-19 diagnosis method proposed in this paper are higher than most of the existing COVID-19 diagnosis methods. And the COVID TCL designed in this paper takes into account the problems that have not been considered in the previous COVID-19 diagnostic models, that is, the lung image of the COVID-19 patients in the early stage and incubation period are very similar to those of the non-COVID-19 population, resulting in low model sensitivity and high false negative rate. Provides a new requirement for the design of the COVID-19 diagnostic model in the future.
The rest of the paper is structured as follows. The second part introduces the related work; the third part introduces the algorithm and process of the model; the fourth part shows the results of this study and the comparison and conclusion with other similar works; Research gaps and future research directions.
2.1 CNN-Based COVID-19 Diagnosis Methods
CNN has excellent image feature extraction ability and classification performance. High-quality image features can be extracted by CNN, which is widely used in the field of medical image classification. Therefore, after the outbreak of COVID-19, there have been many excellent CNN-based COVID-19 image classification models. Wang et al. [19] developed a weakly supervised deep learning framework for COVID-19 classification and lesion localization from chest CT. The classification network in the framework is called DeCoVNet. Combined the activation regions produced by the DeCoVNet with an unsupervised lung segmentation method to localize lesion regions. The final classification accuracy is 90.1%, and the classification sensitivity is 84.0%. Mohammed et al. [20] proposed an end-to-end weakly supervised network for the detection of Covid-19 in chest CT scans. They combined the spatial attention module and the channel attention module end-to-end to optimize the feature map. Use the two-way long short-term memory to convert the spatial features into spatial axes-oriented features, and add a slice attention module before the last fully-connected layer. They achieved 81.9% classification accuracy and 85.5% classification sensitivity. Ouyang et al. [21] proposed a dual-sampling attention network for the diagnosis of COVID-19 from community-acquired pneumonia. They use different strategies to train two 3D ResNet34 networks, and propose a new online attention module to focus on lung infection regions, finally using ensemble learning for classification, the classification accuracy is 87.5% and the sensitivity is 86.9%. Polsinelli et al. [22] designed a light CNN for detecting COVID-19 from CT scans of the chest based on the SqueezeNet. It can classify COVID-19, community-acquired pneumonia, and healthy lung CT images. The classification speed is fast, achieving 85.03% classification accuracy and 87.55% sensitivity. Jaiswal et al. [23] proposed a COVID-19 classification model based on deep transfer learning using DenseNet201. They use weight parameters trained in the ImageNet database to initialize DenseNet201. The final classification accuracy reaches 96.25%, and the sensitivity reaches 96.29%. Wang et al. [24] proposed a framework based on the modified Inception network, using transfer learning to train the framework to classify the CT images of COVID-19 and typical viral pneumonia. The final classification accuracy is 89.5%, and the sensitivity is 87.00%. Karnati et al. [25] proposed a multi-scale deep neural network framework to diagnose COVID-19 from CXR images, it can learn features in X-ray images from different scales. The final classification accuracy is 96.01%, and the sensitivity is 96.00%.
2.2 Triplet Loss and Center Loss for Image Classification
Although the above methods have good classification accuracy, they have low classification sensitivity or no sensitivity test. Low sensitivity means a higher probability of the model misdiagnosing COVID-19 patients as non-COVID-19 people. This is because these methods do not consider the problem that lung images of COVID-19 patients in the early stage and incubation period are extremely similar to those of the non-COVID-19 population. This problem will make CNN unable to extract distinguishing features, thus affecting the sensitivity of the model. So this paper attempts to use triplet loss to make CNN extract more discriminative features. Triplet loss can increase the inter-class distance of different class features, to help CNN to extract discriminative features. He et al. [26] proposed a layered Triplet loss for fine-grained image classification, using the “coarse to fine” strategy to construct a loss function, which enables the effective separation of coarse-level classes and effective clustering of fine-level classes. Huang et al. [27] proposed a novel batch similarity-based triplet loss. This loss function can increase the similarity between images of the same class and decrease the similarity between images of different classes. The classification experiments on X-ray images and skin rash images show that the method has good applicability and effectiveness in terms of classification accuracy, sensitivity, and specificity. Huang et al. [28] to solve the problem of intra-class diversity and inter-class similarity of hyperspectral images, proposed an improved triplet loss, which makes the samples of the same class closer, and the samples of different classes far away from each other, it can filter many trivial pairs, and prevents the impact of the outliers at the same time.
Triplet loss can make features of different classes away from each other, but it cannot guarantee the intra-class compactness of features, and Center loss will learn the feature center of each class, so that the feature is close to its corresponding class center, making up for the lack of triplet loss. Feng et al. [29] combined triplet loss and center loss to propose triplet-margin-center loss to identify face sketch images and face photo images. Triplet-margin-center loss can expand the inter-class distance of different classes of samples and improve the intra-class compactness, to make the face sketches and face photos of different samples more distinguishable. Zhao et al. [30] proposed a new center-triplet model for person re-identification. They designed a hard mining center-triplet loss to optimize the intra-class distance and inter-class distance, and enhance robust feature representation learning. He et al. [31] established a 3D CNN object retrieval model, and proposed a new loss called triplet-center loss that can improve inter-class discreteness and intra-class compactness, which can further enhance feature discrimination. Yang et al. [32] proposed a joint triplet-center loss-based hierarchical learning method for difficult-to-extract discriminative speech emotion features. The joint triplet-center loss can reduce the intra-class distance and increase the inter-class distance to learn discriminative emotional features.
2.3 XGBoost for Image Classification
Meanwhile, CNN is characterized by feature extraction, its classifier is only a fully connected layer and cannot fully grasp complex and diverse deep features, and the parameters accounts for about 80% of the whole CNN. XGBoost is a boosting tree model, with the advantages of high precision, strong flexibility, high efficiency, and easy portability with few parameters. Compared with a fully connected layer XGBoost’s classification effect is not weaker than or even better, lower parameters and calculation, it also further improves the operating efficiency through methods such as cache optimization and memory optimization. Therefore, the CNN-XGBoost architecture that uses CNN as a feature extractor and XGBoost as a classifier received attention. Carvalho et al. [33] input the chest CT image into the LeNet5 network to extract features, and then replaced the last classifier layer of the network with XGBoost for classification to check whether it was infected with COVID-19. Fangoh et al. [34] used MobileNetv2 as the feature extractor and XGBoost as the classifier to classify chest X-ray images, and used transfer learning to train the feature extractor. Thongsuwan et al. [35] proposed a new deep-learning classification model called ConvXGB based on CNN and XGBoost. Using XGBoost to replace the fully connected layer of CNN, improves the classification effect and reduces model parameters. The classification results in the dataset are all better than the separate CNN classification and XGBoost classification. Ren et al. [36] proposed a CNN-XGBoost classification model for the problem that the existing classification models cannot make full use of image information, using LeNet5 as the feature extractor and XGBoost as the classifier, which has achieved good results in the MNIST and CIFAR-10 databases. Jiao et al. [12] proposed a CNN-XGBoost image classification model optimized by adaptive particle swarm optimization (APSO), CNN acts as a feature extractor, XGBoost acts as a classifier, and uses the improved APSO algorithm to optimize the hyperparameters on the model. These methods get better results than using CNN alone for classification, and the amount of model parameters is reduced.
According to the above studies, this paper combines triplet loss, center loss, and softmax loss to design a jointly supervised loss function COVID Triplet-Center loss to train CNN. And use XGBoost to replace the fully connected layer of CNN to design a model with CNN-XGBoost architecture for COVID-19 CT image classification.
This paper combines triplet loss, center loss, and softmax loss to design a jointly supervised loss function COVID Triplet-Center loss to train CNN for extracting more discriminative features, improve model classification sensitivity, and enhance the ability of CNN-based model to diagnose COVID-19 patients in the early stage and incubation period. Meanwhile, design a COVID-19 diagnosis model with CNN-XGBoost architecture to reduce the overall parameter amount of the model to improve operational efficiency while ensuring the classification effect of the model. The following will introduce the CNN-XGBoost architecture model proposed in this paper and COVID TCL in detail.
3.1 Model Architecture and Process
The COVID-19 diagnosis model with CNN-XGBoost architecture designed in this paper consists of two parts, a feature extractor, and a classifier, as shown in Fig. 1. Use the ResNet50 as the feature extractor and XGBoost as the classifier. Input the dataset into the ResNet50 network, and use the COVID TCL training feature extractor to extract the distinguishing features. Then, flatten the extracted features into a one-dimensional feature vector, input it into XGBoost and get the classification results.

Figure 1: Model architecture
The quality of the data affects the performance of the model to some extent. Therefore, add a preprocessing step to the feature extractor to improve the quality of the input data. Resize all CT images to 224

Figure 2: Comparison of the original image and the preprocessed image
Feature extraction is the most important link in the automatic image classification system, the quality of the feature directly affects the recognition performance of the image [30]. CNN is recognized as one of the most powerful and effective feature extraction mechanisms [10]. Through the convolution operation, CNN can effectively extract the deep features in the image. In this paper, select the ResNet50 network as the backbone of the feature extractor, input the preprocessed CT images into ResNet50, then use the COVID TCL to train the ResNet50 to get distinguishing features, and finally flatten the features into a one-dimensional feature vector as the input of XGBoost.
In this paper, the deep features extracted by ResNet50 are flattened into a one-dimensional feature vector as the input of XGBoost, and there are two types of image classification results: COVID-19 and non-COVID-19. In this paper, the deep features extracted by ResNet50 are flattened into a one-dimensional feature vector as the input of XGBoost, and there are two types of image classification results: COVID-19 and non-COVID-19. eXtreme Gradient Boosting (XGBoost) is a Boosting tree algorithm proposed by Chen et al. [37], the idea of Boosting algorithm is to integrate multiple weak classifiers to form a strong classifier. So the essence of XGBoost is a strong classifier formed by integrating multiple tree models. Specific steps are as follows:
Let dataset
where,
The regularization term
The objective function of the t-th iteration after the second-order Taylor formula expansion:
where,
Minimizing the objective function
Classification tasks generally use traditional metric loss functions softmax loss and sigmoid loss to train and optimize the network. However, these methods usually produce large intra-class distances and small inter-class distances during clustering, resulting in the overlap between clusters, as shown in Fig. 3a, which reduces the model classification sensitivity. To solve this problem, this paper attempts to introduce triplet loss and center loss into the field of COVID-19 image classification for the first time and combination with softmax loss design a jointly supervised loss metric function called COVID Triplet-Center loss.

Figure 3: The distribution of deep features learned by networks trained with different loss functions, (a) softmax loss, (b) triplet loss, (c) center loss, (d) COVID triplet-center loss
The normal feature distribution is shown in Fig. 3a, Triplet loss can reduce the intra-class distance of samples of the same class and increase the inter-class distance of samples of different classes to learn more discriminative deep features, as shown in Fig. 3b. The input of triplet loss is a triplet sample
where
where M is the number of batch size,
where M represents the dimension of the output of the full connection layer, n is the number of categories and T is the transpose. So get the formula
4 Experiment Results and Discussion
In this part, we use classification evaluation indicators to verify the proposed method in this paper, comparing it with other COVID-19 diagnosis models and performing ablation experiments to prove the effectiveness and superiority of the methods proposed in this paper.
4.1 Dataset and Hyperparameters
The dataset used in this paper is from the COVID-19 CT image data set available on Kaggle (https://www.kaggle.com/plameneduardo/sarscov2-ctscan-datasetand), which has a total of 2481 chest CT images including 1252 COVID-19 positive CT images and 1229 non-COVID-19 CT images. Divide the dataset into a training set and a test set according to the rate of 8:2.
In our experiments, in feature extractor ResNet50, the learning rate is 0.0001, the training epoch is 100, and the batch size is 128. In classifier XGBoost, “gamma” is 0.05, “max_depth” is 8, “lambda” is 2, “subsample” is 0.7, “eta” is 0.1, and the number of training iterations is 100. The balance weights
The method proposed in this paper can detect COVID-19 CT images, specifically, it can distinguish whether chest CT images belong to non-COVID-19 people or people with COVID-19. To examine the performance of the proposed method, the following metrics are selected for measurement.
Accuracy (
The precision (
Sensitivity (
It was used in this paper to test the ability of the model to correctly classify images of COVID-19 patients into the category of COVID-19 CT images. The higher the sensitivity, the better the ability to correctly classify the COVID-19 CT images. On the contrary, if the sensitivity is lower, it means that the model has a problem with a high false negative rate, that is, the model is prone to misclassify COVID-19 CT images into non-COVID-19 CT images.
F1-score(
4.3 Compared with Other Methods
To prove the effectiveness and superiority of the proposed method, the method proposed in this paper is compared with the other 7 methods. The results are shown in Table 1.
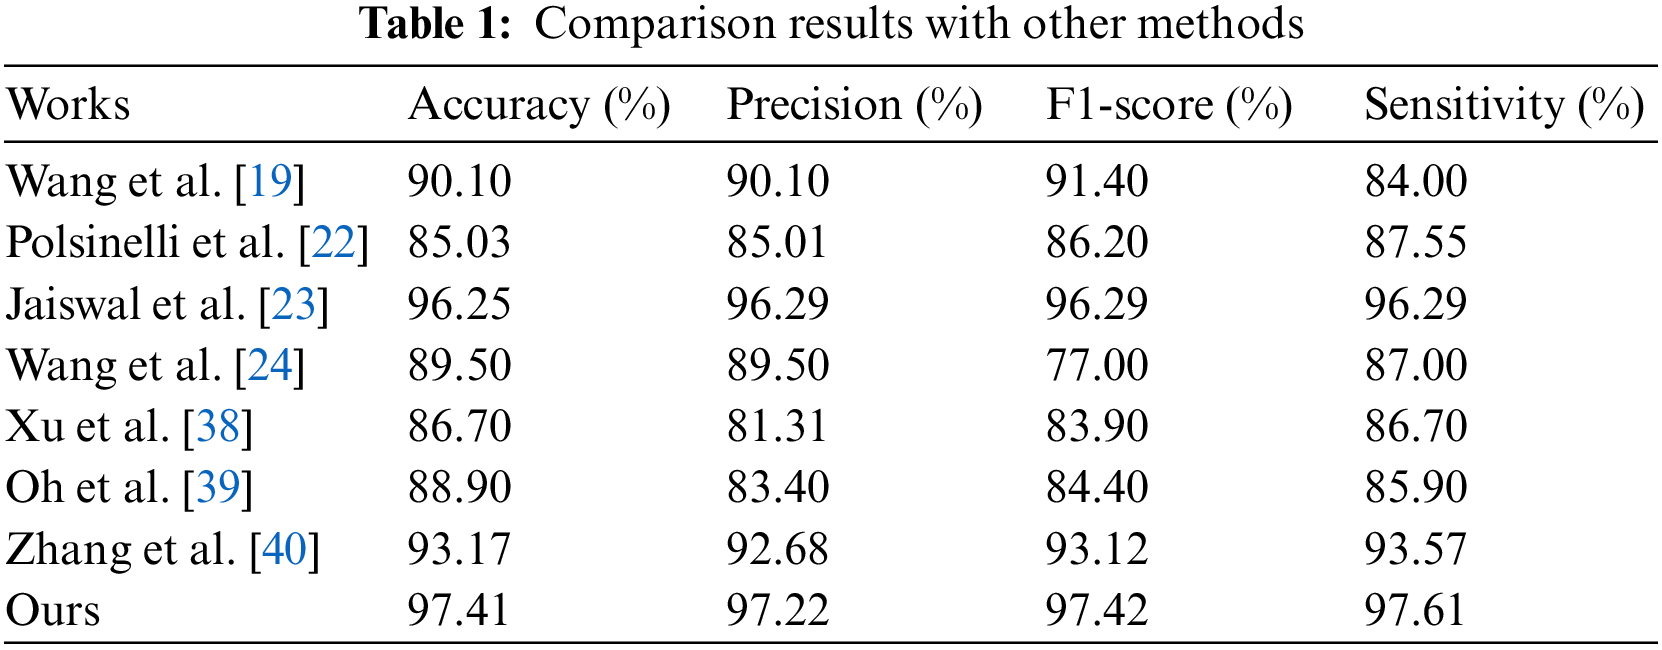
As can be seen from Table 1, our’s method that CNN-XGBoost architecture cooperate with COVID TCL gets the best evaluation indicator. The sensitivity is as high as 97.61%, which indicates that the method proposed in this paper has a high discriminative ability for COVID-19 patients and non-COVID-19 populations.
To demonstrate the contribution of the COVID Triplet-Center Loss and CNN-XGBoost architecture proposed in this paper, an ablation study is performed. We first tested ResN50, ResNet50 + COVID TCL, ResNet50 + XGBoost, and ResNet50 + COVID TCL + XGBoost in turn, and the results are shown in Table 2.
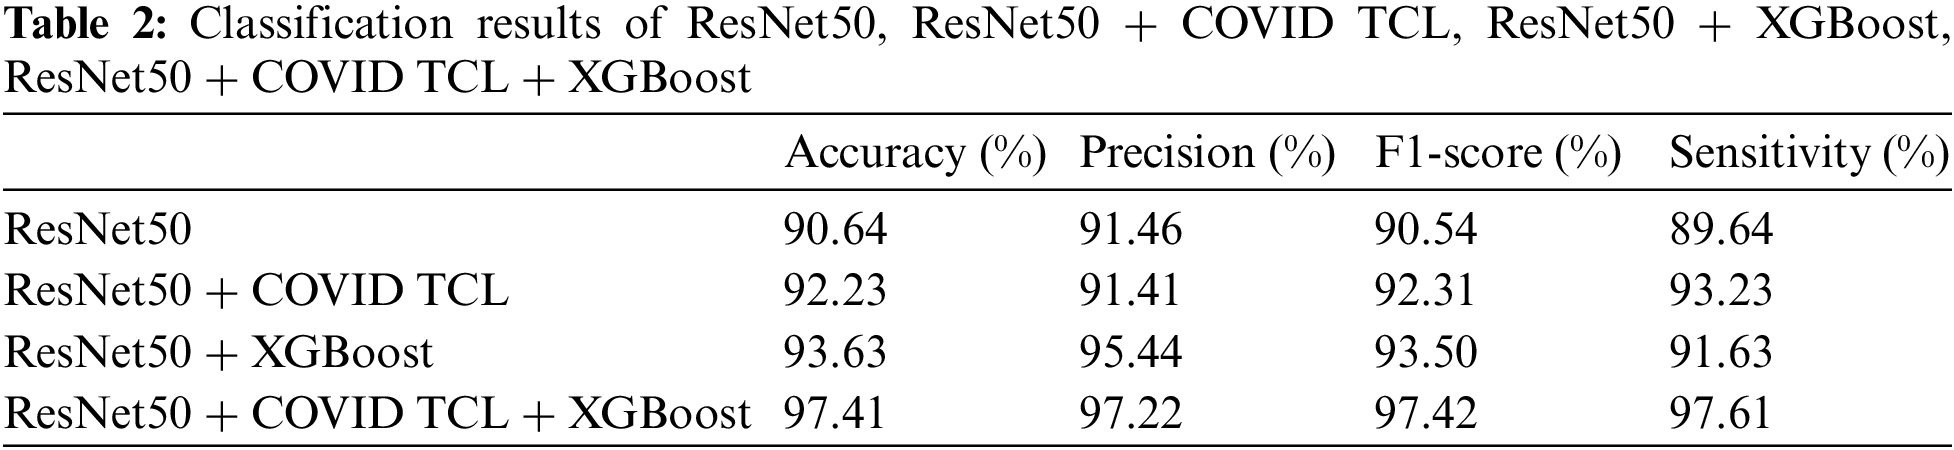
As can be seen from Table 2, the classification index of ResNet50 alone is the lowest. After using COVID TCL, the sensitivity is improved by 3.59%. After adding XGBoost, the classification index is improved greatly except for the small increase in sensitivity. The ResNet50 + COVID TCL + XGBoost obtain the best classification results. And Fig. 4 shows the classification ROC curve of the above 4 models.

Figure 4: ROC curves comparison of ResNet50, ResNet50 + COVID TCL, ResNet50 + XGBoost and ResNet50 + COVID TCL + XGBoost
From Fig. 4, we can see that the brown line is the ROC curve of ResNet50, and its AUC area is only 90.6%. The cyan line represents the ROC curve of ResNet50 + COVID TCL. The blue line is the ROC curve of ResNet50 + XGBoost. Finally, the orange line is the ROC curve of ResNet50 + COVID TCL + XGBoost, and the AUC area is as high as 97.4%. Meanwhile, it can be seen that the True positive rate of the orange line is significantly higher than other lines, while the False positive rate is significantly lower than other lines.
Table 2 and Fig. 4 both prove the effectiveness of the proposed COVID TCL and CNN-XGBoost architecture.
4.4.1 COVID Triplet-Center Loss
To further prove the superiority of COVID TCL, Fig. 5 compares the confusion matrix of ResNet50 + COVID TCL + XGBoost and ResNet50 + XGBoost classification results. There are 502 CT images for testing, 251 non-COVID-19 images, and 251 COVID-19 images, with 0 representing the non-COVID-19 category and 1 representing the COVID-19 category. Fig. 5a shows that a total of 245 images are correctly classified as COVID-19 category, with a true positive rate of 97.6%, and 6 COVID-19 CT images are misclassified as non-COVID-19 category, with a false negative rate of 2.3%. In Fig. 5b, among the 251 COVID-19 CT images, only 230 were correctly classified as COVID-19 category with a true positive rate of only 91.6%, and 21 were misclassified as non-COVID-19 category, the false negative rate is 8.4%. The false negative rate in Fig. 5b is nearly four times higher than that in Fig. 5a, which means that the probability of the model misclassified COVID-19 CT images as non-COVID-19 CT images will greatly increase without COVID-TCL.
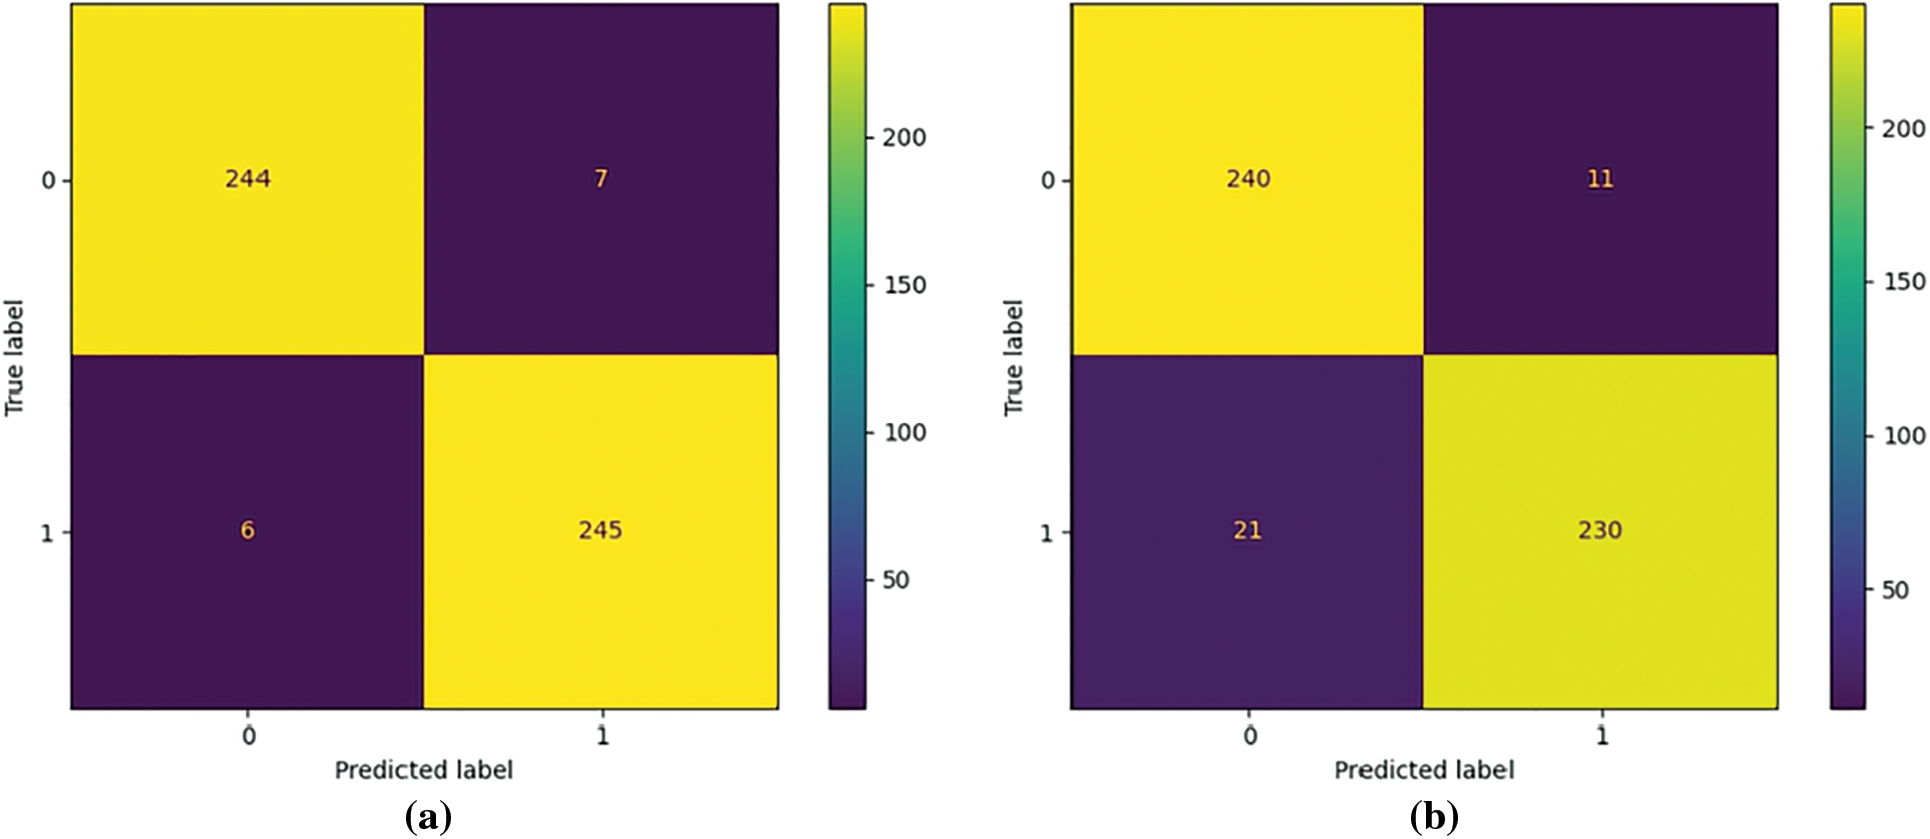
Figure 5: Visualization of the confusion matrix of COVID-19 diagnosis results: (a) Confusion_matrix for COVID-19 detection with ResNet50 + COVID TCL + XGBoost, (b) Confusion_matrix for COVID-19 detection with ResNet50 + XGBoost
Meanwhile, we selected 3 other well-known CNN models to test their classification results with or without COVID TCL in our dataset. The results are shown in Table 3.
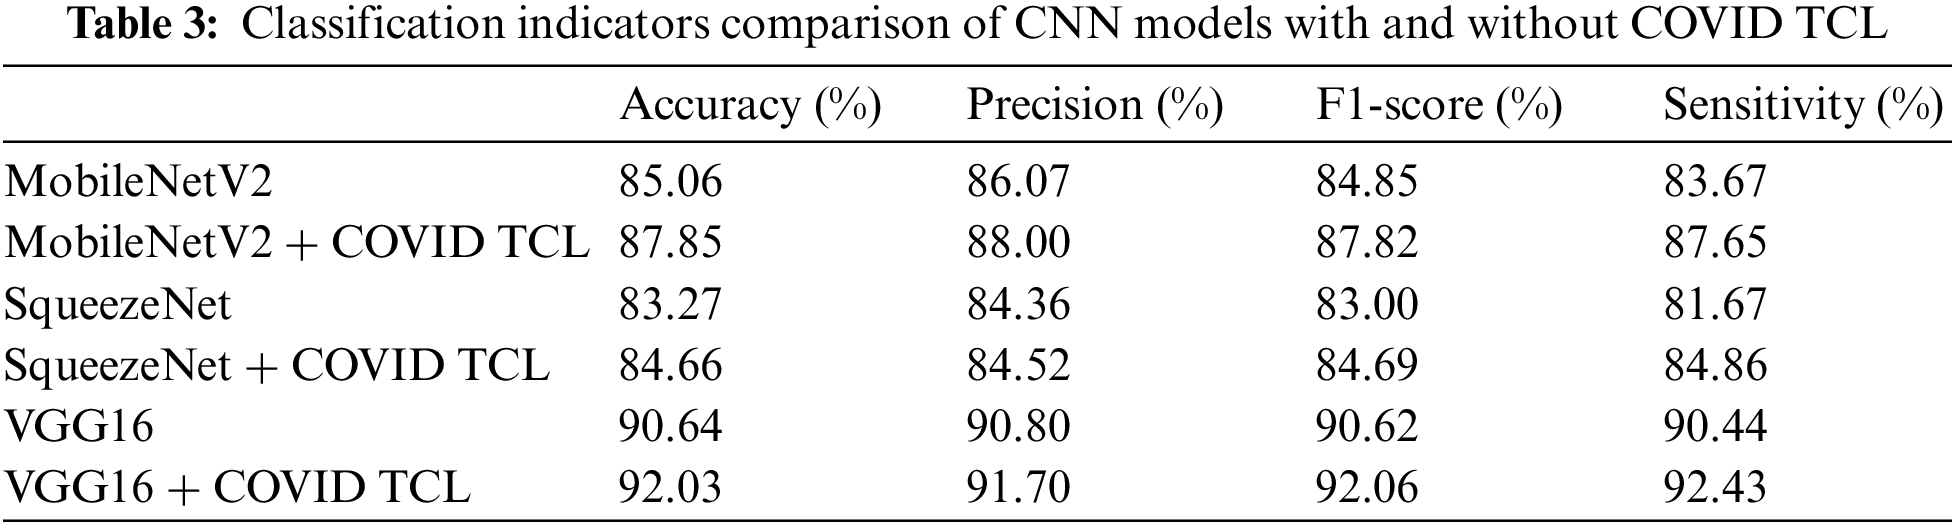
From Table 3, we can see that after using of the COVID TCL, all classification indicators of the CNN model are improved, among which the improvement of sensitivity is the most obvious. Fig. 6 shows the ROC curves of the 3 CNN models with or without COVID TCL.
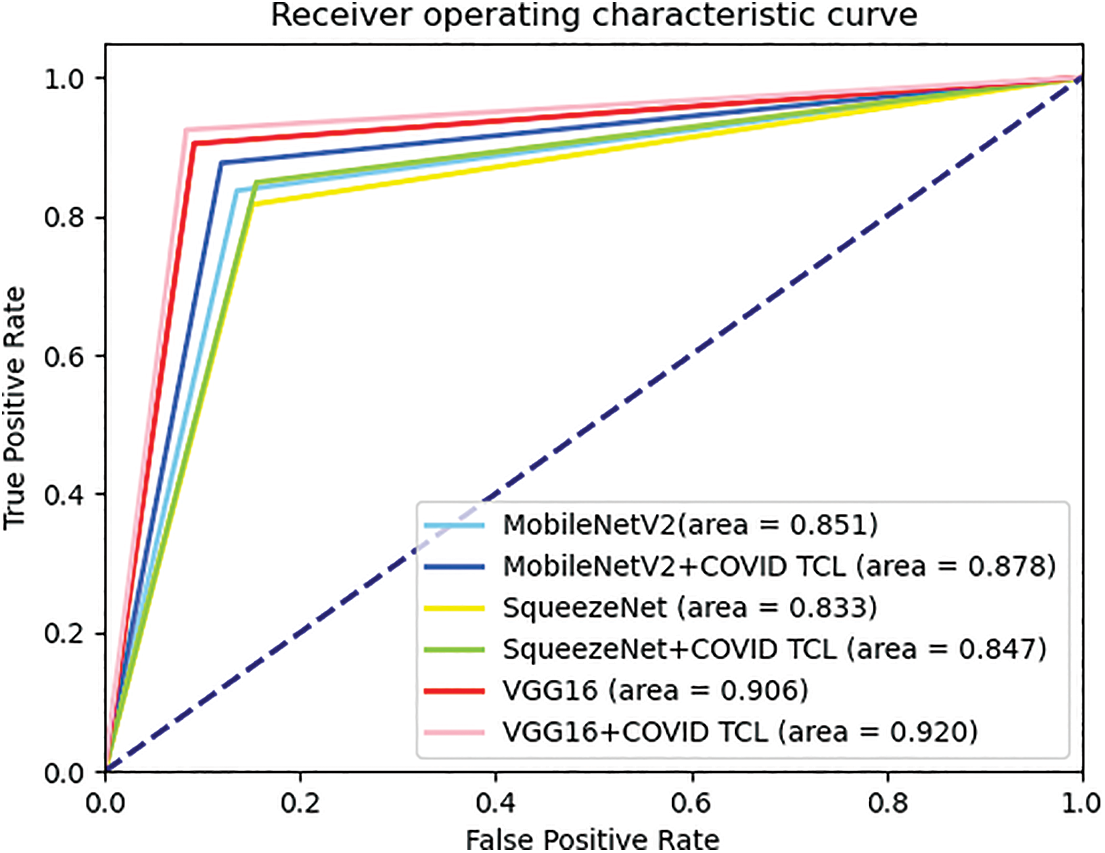
Figure 6: ROC curves comparison of the 3 CNN models with and without COVID TCL
From Fig. 6, we can intuitively see that after using COVID TCL, the AUC area of the 3 models has increased. Therefore, both the classification indicator results and the display of the ROC curves can fully prove that the proposed COVID TCL can effectively help the feature extractor to extract more discriminative features, improve the CNN-based model’s sensitivity to strengthen its diagnostic ability for patients with early and incubation period.
4.4.2 CNN-XGBoost Architecture
Similarly, to further prove the superiority of CNN-XGBoost architecture, we also selected 3 other well-known CNN models to test their classification results with and without XGBoost in our dataset. The results are shown in Table 4.
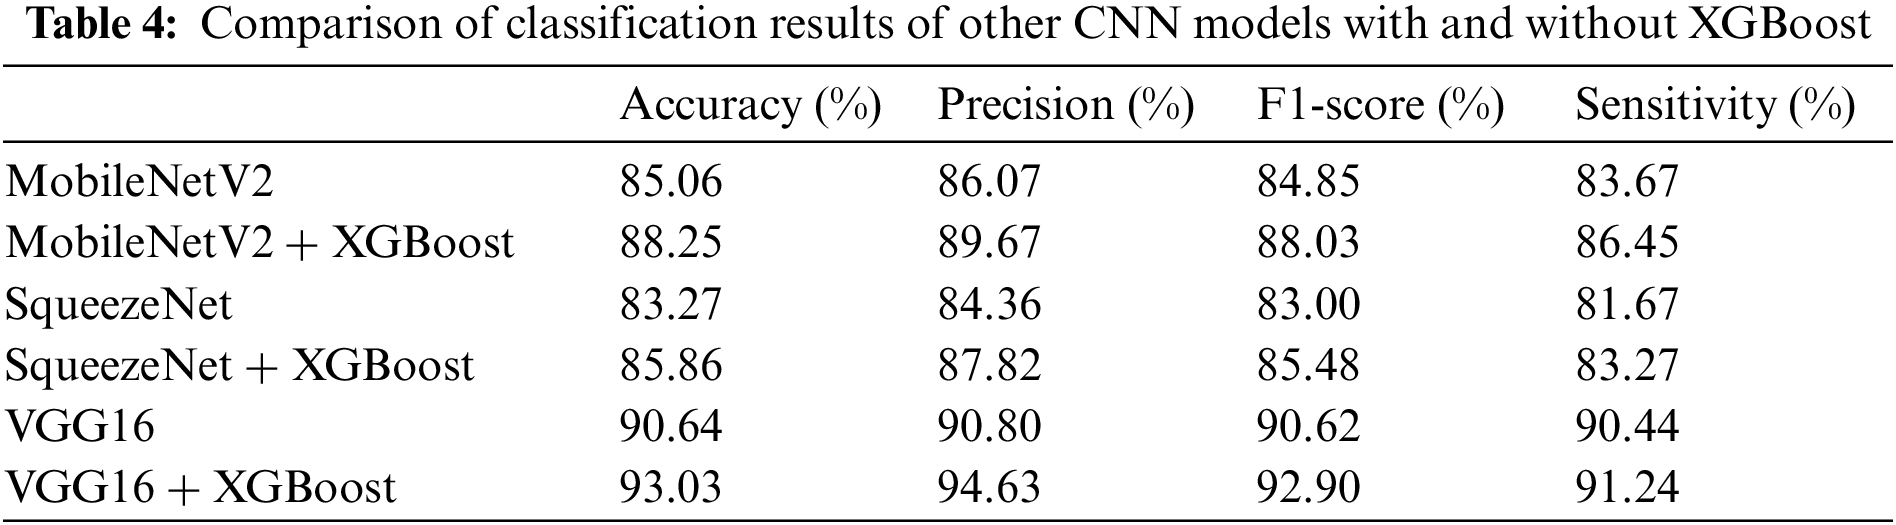
From Table 4, we can see that after using CNN-XGBoost architecture, the classification effect of each model has been effectively improved. Fig. 7 shows the ROC curves of the 3 CNN models with and without XGBoost.
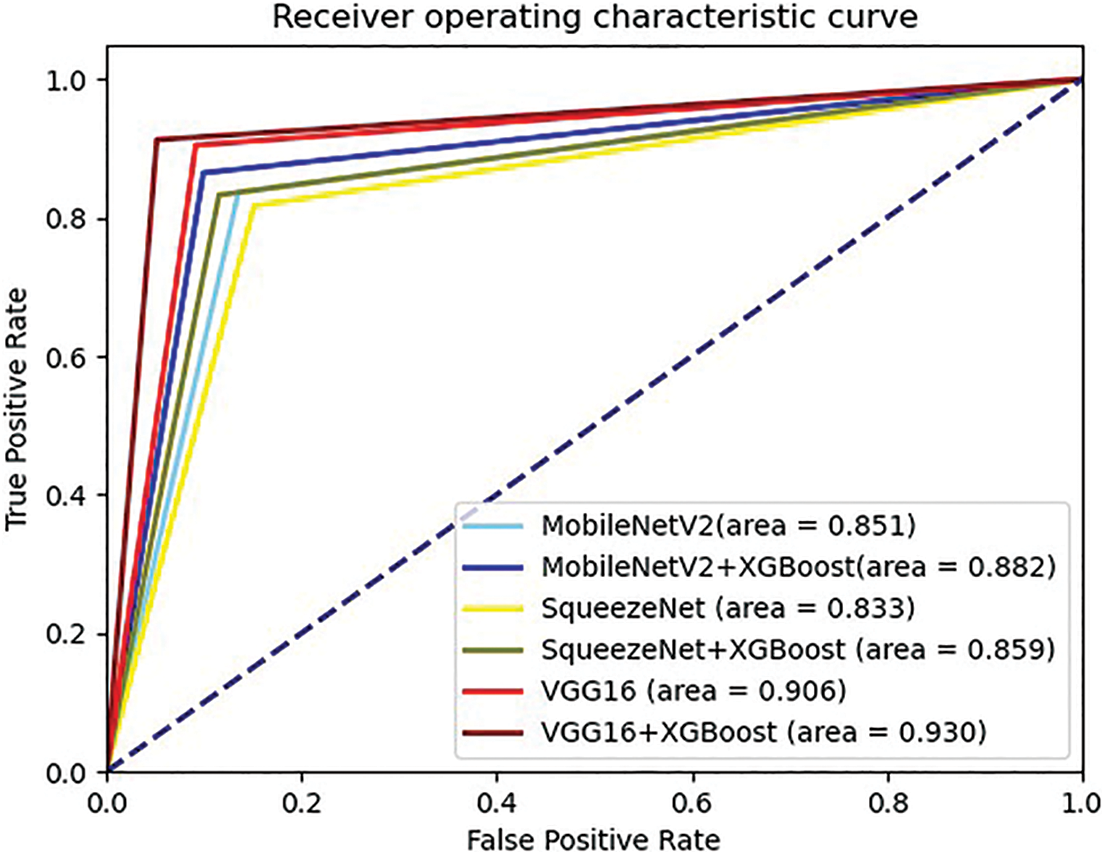
Figure 7: ROC curves comparison of the 3 CNN models with and without XGBoost
From Fig. 7, we can intuitively see that after using XGBoost, the AUC area of the 3 models has increased. By the classification results and ROC curves can prove that the CNN-XGBoost architecture is indeed better than using CNN alone for classification.
In this paper, we first attempt to apply triplet loss, and center loss to the field of COVID-19 diagnosis, combined with softmax loss to design a jointly supervised metric loss function COVID Triplet-Center Loss (COVID TCL). It can effectively alleviate the problem of low classification sensitivity. Meanwhile, we design a CNN-XGBoost architecture COVID-19 classification model. Using XGBoost as the classifier, improves the classification effect of the model. So, the research in this paper will help to strengthen the diagnostic ability of patients with early and incubation periods of COVID-19 and the experimental results show that the method proposed in this paper is better than other COVID-19 detection methods.
However, the method proposed also has some shortcomings in practical application. Firstly the model still has a certain scale parameter amount even if removes the fully connected layer. Secondly, if we want to fully train a ResNet50 that meets a specific task, we need a lot of data, but it is difficult to obtain COVID-19 CT images due to personal privacy issues. Therefore, future work will focus on these two points for improvement research, mainly including (1): research on small sample learning algorithm training network to alleviate the problem of insufficient data; (2): Studying image synthesis algorithm, realizing the manual generation of images or the mutual transformation of CT images and X-ray images, to expand the amount of data required for the experiment.
Acknowledgement: We would like to thank the support of the School of Nanjing University of Information Science & Technology.
Funding Statement: This work was supported, in part, by the Natural Science Foundation of Jiangsu Province under Grant Numbers BK20201136, BK20191401; in part, by the National Nature Science Foundation of China under Grant Numbers 62272236, 61502096, 61304205, 61773219, 61502240; in part, by the Public Welfare Fund Project of Zhejiang Province Grant Numbers LGG20E050001.
Conflicts of Interest: The authors declare that they have no conflicts of interest to report regarding the present study.
References
1. World Health Organization, “Clinical management of severe acute respiratory infection when novel coronavirus (nCoV) infection is suspected: Interim guidance,” 2020. [Online]. Available: https://apps.who.int/iris/handle/10665/330854 (Accessed 25 January 2020). [Google Scholar]
2. National Health Commission of the People’s Republic of China, “Diagnosis and treatment protocol for COVID-19 (Trial version 7),” 2020. [Online]. Available: http://en.nhc.gov.cn/2020-03/29/c_78469.htm (Accessed 29 March 2020). [Google Scholar]
3. L. Li, L. X. Qin, Z. G. Xu, Y. B. Yin, X. Wang et al., “Artificial intelligence distinguishes COVID-19 from community acquired pneumonia on chest CT,” Radiology, vol. 296, no. 2, pp. 65–71, 2020. [Google Scholar]
4. T. Ai, Z. L. Yang, H. Y. Hou, C. N. Zhang, C. Chen et al., “Correlation of chest CT and RT-PCR testing for coronavirus disease 2019 (COVID-19) in China: A report of 1014 cases,” Radiology, vol. 296, no. 2, pp. 32–40, 2020. [Google Scholar]
5. Y. C. Fang, H. Q. Zhang, J. C. Xie, M. J. Lin, L. J. Ying et al., “Sensitivity of chest CT for COVID-19:Comparison to RT-PCR,” Radiology, vol. 296, no. 2, pp. 115–117, 2020. [Google Scholar]
6. J. Shi, L. L. Wang, S. S. Wang, Y. X. Chen, Q. Wang et al., “Applications of deep learning in medical imaging: A survey,” Journal of Image and Graphics, vol. 25, no. 10, pp. 1953–1981, 2020. [Google Scholar]
7. J. P. Kanne, “Chest CT findings in 2019 novel coronavirus (2019-nCoV) infections from wuhan, China:Key points for the radiologist,” Radiology, vol. 295, no. 1, pp. 16–17, 2020. [Google Scholar] [PubMed]
8. H. S. Shi, X. Y. Han, N. C. Jiang, Y. K. Cao, O. Alwalid et al., “Radiological findings from 81 patients with COVID-19 pneumonia in wuhan, China: A descriptive study,” The Lancet Infectious Diseases, vol. 20, no. 4, pp. 425–434, 2020. [Google Scholar] [PubMed]
9. A. Rehman, M. A. Lqbal, H. L. Xing and I. Ahmed, “COVID-19 detection empowered with machine learning and deep learning techniques: A systematic review,” Applied Sciences, vol. 11, no. 8, pp. 1–21, 2021. [Google Scholar]
10. O. R. Shahin, H. H. Alshammari, A. I. Taloba and R. M. EI-Aziz, “Machine learning approach for autonomous detection and classification of COVID-19 virus,” Computers and Electrical Engineering, vol. 101, pp. 1–15, 2022. [Google Scholar]
11. S. Vyas and A. Seal, “A comparative study of different feature extraction techniques for identifying COVID-19 patients using chest X-rays images,” in 2020 Int. Conf. on Decision Aid Sciences and Application (DASA), Sakheer, Bahrain, pp. 209–213, 2020. [Google Scholar]
12. W. J. Jiao, X. W. Hao and C. Qin, “The image classification method with CNN-XGBoost model based on adaptive particle swarm optimization,” Information, vol. 12, no. 4, pp. 1–22, 2021. [Google Scholar]
13. D. H. Wolpert and W. G. Macready, “No free lunch theorems for optimization,” IEEE Transactions on Evolutionary Computation, vol. 1, no. 1, pp. 67–82, 1997. https://doi.org/10.1109/4235.585893 [Google Scholar] [CrossRef]
14. T. G. Dietterich, “Ensemble methods in machine learning,” in Proc. of the Int. Workshop on Multiple Classifier Systems, Berlin, Heidelberg, vol. 1857, pp. 1–15, 2000. [Google Scholar]
15. R. Kohavi and D. H. Wolpert, “Bias plus variance decomposition for zero-one loss functions,” in Proc. of the Thirteenth Int. Conf. on Int. Conf. on Machine Learning, Bari, Italy, vol. 96, pp. 275–283, 1996. [Google Scholar]
16. M. Turkyilmazoglu, “Explicit formulae for the peak time of an epidemic from the SIR model,” Physica D: Nonlinear Phenomena, vol. 422, pp. 1–9, 2021. [Google Scholar]
17. M. Turkyilmazoglu, “An extended epidemic model with vaccination: Weak-immune SIRVI,” Physica A: Statistical Mechanics and its Applications, vol. 598, no. 4, pp. 1–11, 2022. [Google Scholar]
18. M. Turkyilmazoglu, “A restricted epidemic SIR model with elementary solutions,” Physica A: Statistical Mechanics and its Applications, vol. 600, no. 4, pp. 127570, 2022. [Google Scholar]
19. X. G. Wang, X. B. Deng, Q. Fu, Q. Zhou and J. P. Feng et al., “A weakly-supervised framework for COVID-19 classification and lesion localization from chest CT,” IEEE Transactions on Medical Imaging, vol. 39, no. 8, pp. 2615–2625, 2020. [Google Scholar] [PubMed]
20. A. Mohammed, C. C. Wang, M. Zhao, M. Ullah and R. Naseem et al., “Weakly-supervised network for detection of COVID-19 in chest CT scans,” IEEE Access, vol. 8, pp. 155987–156000, 2020. [Google Scholar] [PubMed]
21. X. Ouyang, J. Y. Huo, L. M. Xia, F. Shan and J. Liu et al., “Dual-sampling attention network for diagnosis of COVID-19 from community acquired pneumonia,” IEEE Transactions on Medical Imaging, vol. 39, no. 8, pp. 2595–2605, 2020. [Google Scholar] [PubMed]
22. M. Polsinelli, L. Cinque and G. Placidi, “A light CNN for detecting COVID-19 from CT scans of the chest,” Pattern Recognition Letters, vol. 140, pp. 95–100, 2020. [Google Scholar] [PubMed]
23. A. Jaiswal, N. Gianchandani, D. Singh, V. Kumar and M. Kaur, “Classification of the COVID-19 infected patients using densenet201 based deep transfer learning,” Journal of Biomolecular Structure and Dynamics, vol. 39, no. 15, pp. 5682–5689, 2020. [Google Scholar] [PubMed]
24. S. Wang, B. Kang, J. L. Ma, X. J. Zeng, M. M. Xiao et al., “A deep learning algorithm using CT images to screen for corona virus disease (COVID-19),” European Radiology, vol. 31, no. 8, pp. 6096–9104, 2021. [Google Scholar] [PubMed]
25. M. Karnati, A. Seal, G. Sahu, A. Yazidi and O. Krejcar, “A novel multi-scale based deep convolutional neural network for detecting COVID-19 from X-rays,” Applied Soft Computing, vol. 125, pp. 1–17, 2022. [Google Scholar]
26. G. Q. He, F. Li, Q. Y. Wang, Z. W. Bai and Y. L. Xu, “A hierarchical sampling based triplet network for fine-grained image classification,” Pattern Recognition, vol. 115, pp. 1–12, 2021. [Google Scholar]
27. Z. W. Huang, Q. Zhou, X. X. Zhu and X. M. Zhang, “Batch similarity based triplet loss assembled into light-weighted convolutional neural networks for medical image classification,” Sensors, vol. 21, no. 3, pp. 1–21, 2021. [Google Scholar]
28. K. K. Huang, C. X. Ren, H. Liu, Z. R. Lai and Y. F. Yu et al., “Hyperspectral image classification via discriminative convolutional neural network with an improved triplet loss,” Pattern Recognition, vol. 112, pp. 1–13, 2021. [Google Scholar]
29. Y. J. Feng, F. Wu, Y. M. Ji, X. Y. Jing and J. Yu, “Deep metric learning with triplet-margin-center loss for sketch face recognition,” IEICE Transactions on Information and Systems, vol. 103, no. 11, pp. 2394–2397, 2020. [Google Scholar]
30. C. R. Zhao, X. B. Lv, Z. Zhang, W. M. Zuo, J. Wu et al., “Deep fusion feature representation learning with hard mining center-triplet loss for person re-identification,” IEEE Transactions on Multimedia, vol. 22, no. 12, pp. 3180–3195, 2020. [Google Scholar]
31. X. W. He, Y. Zhou, Z. C. Zhou, S. Bai and X. Bai, “Triplet-center loss for multi-view 3D object retrieval,” in Proc. of the IEEE Conf. on Computer Vision and Pattern Recognition, Salt Lake City, Utah, pp. 1945–1954, 2018. [Google Scholar]
32. X. Yang, X. Xia and Y. Dong, “A hierarchical speech emotion classification framework based on joint triplet-center loss,” in 2020 IEEE 5th Int. Conf. on Signal and Image Processing (ICSIP), Chendu, China, pp. 751–756, 2020. [Google Scholar]
33. E. D. Carvalho, E. D. Carvalho, A. O. de Carvalho Filho, F. H. D. de Araújo and R. d. A. L. Rabêlo, “Diagnosis of COVID-19 in CT image using CNN and XGBoost,” in 2020 IEEE Symp. on Computers and Communications (ISCC), Rennes, France, pp. 1–6, 2020. [Google Scholar]
34. A. M. Fangoh and S. Selim, “Using CNN-XGBoost deep networks for COVID-19 detection in chest X-ray images,” in 2020 15th Int. Conf. on Computer Engineering and Systems (ICCES), Cairo, Egypt, pp. 1–7, 2020. [Google Scholar]
35. S. Thongsuwan, S. Jaiyen, A. Padcharoen and P. Agarwal, “ConvXGB: A new deep learning model for classification problems based on CNN and XGBoost,” Nuclear Engineering and Technology, vol. 53, no. 2, pp. 522–531, 2021. [Google Scholar]
36. X. D. Ren, H. N. Guo, S. H. Li, S. L. Wang and J. H. Li, “A novel image classification method with CNN-XGBoost model,” in IWDW 2017: Digital Forensics and Watermarking, University of Magdeburg, Germany, vol. 10431, pp. 378–390, 2017. [Google Scholar]
37. T. Q. Chen and C. Guestrin, “XGBoost: A scalable tree boosting system,” in Proc. of the 22nd Acm Sigkdd Int. Conf. on Knowledge Discovery and Data Mining, San Francisco California, USA, pp. 785–794, 2016. [Google Scholar]
38. X. W. Xu, X. G. Jiang, C. L. Ma, P. Du, X. K. Li et al., “Deep learning system to screen coronavirus disease 2019 pneumonia,” Engineering, vol. 6, no. 10, pp. 1122–1129, 2020. [Google Scholar] [PubMed]
39. Y. J. Oh, S. J. Park and J. C. Ye, “Deep learning covid-19 features on cxr using limited training data sets,” IEEE Transactions on Medical Imaging, vol. 39, no. 8, pp. 2688–2700, 2020. [Google Scholar] [PubMed]
40. X. R. Zhang, J. Zhou, W. Sun and S. K. Jha, “A lightweight CNN based on transfer learning for COVID-19 diagnosis,” Computers, Materials & Continua, vol. 72, no. 1, pp. 1123–1137, 2022. [Google Scholar]
Cite This Article
 Copyright © 2023 The Author(s). Published by Tech Science Press.
This work is licensed under a Creative Commons Attribution 4.0 International License , which permits unrestricted use, distribution, and reproduction in any medium, provided the original work is properly cited.
 Downloads
 Citation Tools