
 Submit a Paper
 Propose a Special lssue
 Open Access
ARTICLE

Comparative Analysis for Evaluating Wind Energy Resources Using Intelligent Optimization Algorithms and Numerical Methods
Department of Electrical Engineering, College of Engineering, Qassim University, Buraidah, Saudi Arabia
* Corresponding Author: Musaed Alrashidi. Email:
Computer Systems Science and Engineering 2023, 47(1), 491-513. https://doi.org/10.32604/csse.2023.038628
Received 12 December 2022; Accepted 10 March 2023; Issue published 26 May 2023
 View Full Text
 Download PDF
Abstract
Statistical distributions are used to model wind speed, and the two-parameters Weibull distribution has proven its effectiveness at characterizing wind speed. Accurate estimation of Weibull parameters, the scale (c) and shape (k), is crucial in describing the actual wind speed data and evaluating the wind energy potential. Therefore, this study compares the most common conventional numerical (CN) estimation methods and the recent intelligent optimization algorithms (IOA) to show how precise estimation of c and k affects the wind energy resource assessments. In addition, this study conducts technical and economic feasibility studies for five sites in the northern part of Saudi Arabia, namely Aljouf, Rafha, Tabuk, Turaif, and Yanbo. Results exhibit that IOAs have better performance in attaining optimal Weibull parameters and provided an adequate description of the observed wind speed data. Also, with six wind turbine technologies rating between 1 and 3 MW, the technical and economic assessment results reveal that the CN methods tend to overestimate the energy output and underestimate the cost of energy ($/kWh) compared to the assessments by IOAs. The energy cost analyses show that Turaif is the windiest site, with an electricity cost of $0.016906/kWh. The highest wind energy output is obtained with the wind turbine having a rated power of 2.5 MW at all considered sites with electricity costs not exceeding $0.02739/kWh. Finally, the outcomes of this study exhibit the potential of wind energy in Saudi Arabia, and its environmental goals can be acquired by harvesting wind energy.Keywords
The rising demand for sustainable energy sources, such as solar and wind, has accelerated the pace of integrating renewable resources into power grids. Power extraction from wind is inexhaustible, and many countries started to embrace this technology. However, the uncertain nature of wind leads to variations in wind power generation, which causes severe obstacles to the power system operators attempting to maximize its penetration levels. For instance, wind power variability influences power systems’ reliability, stability, operation, design, and cost of power systems [1,2]. Therefore, to reduce the risk of ambiguity and to better analyze the potential of wind energy at any location, it is essential to have accurate assessments of wind energy and an understanding of the distribution of wind speeds [3].
The frequency distribution of the wind speed is required to be thoroughly comprehended to provide an accurate assessment of the wind energy potential. Different Probability Density Functions (PDF) have been used in the literature to model wind speed, such as three parameters Weibull [4], Rayleigh [5], Lognormal [6,7], Gamma [6,8,9], Inverse Weibull [10], Generalized Gamma [11], Kappa [11], Burr [7], Logistic [6,12], inverse Gaussian [7], Beta [5], etc. The two parameters Weibull PDF is the most famous distribution worldwide to describe wind speed frequencies and assess the wind speed potential. The Weibull distribution is adaptable, has just two parameters, simple to estimate, and has a closed-form formulation [5,13]. Therefore, Weibull distribution is in use in this paper.
Weibull distribution is defined by its two parameters: scale (c) and shape (k). Therefore, attaining the optimal combination of c and k is essential for successful fitting accuracy and evaluating wind energy. Several methods have been used to estimate these parameters, such as the Conventional Numerical (CN) methods, including the Maximum Likelihood Method (MLM) [9,14,15], Method of Moment (MOM) [6,9,14], Energy Patter Method (EPM) [14,15], Power Density Method (PDM) [16,17], Empirical Method (EM) [14,15], and Graphical Method (GM) [18]. Recently, Intelligent Optimization Algorithms (IOA) have been applied by researchers to evaluate their performance in tuning Weibull parameters and assess the wind energy potential. Such methods include Particle Swarm Optimization (PSO) [9,14,16], Genetic Algorithms (GA) [11,16,19], Cuckoo Optimization Algorithm (COA) [6,9], Differential Evolution (DE) [12,16], and Batt Algorithm (BA) [9].
For instance, the study in [20] conducts a technical assessment in two sites in Galati county, Romania. The wind speed data are characterized using Weibull and Rayleigh distributions, where the MOM is used to estimate their parameters. Study results reveal that the Weibull distribution best fits the wind speed in the two sites, while the Rayleigh distribution generates significant fitting errors. Bidaoui et al. [21] employ Weibull and Rayleigh distributions to evaluate the potential of wind energy in five remote areas in Northern Morocco, namely Larach, Tangier, Tetuan, Al-Hocima, and Nador. The Weibull distribution shows the superiority in accurately fitting the observed wind speed data at all the considered sites with low Root Mean Square Error (RMSE) values ranging between 0.0022 to 0.0004 m/s. The authors in [22] utilize Weibull distribution to analyze the wind speed in the Al-Salman site, Iraq. The shape and scale parameters of the Weibull PDF are estimated using the MLM. Results show that c and k values varied from 1.8 to 3.2 and from 5.93 to 8.3 m/s over various periods, respectively. On the other hand, results indicate that the average wind speed at 50 m above ground level (AGL) is 5.93 m/s.
Weibull distribution has been utilized in the techno-economic feasibility analysis of wind energy generation to evaluate the wind temporal and spatial variability and justify wind energy projects. The technical analyses use Weibull distribution to determine the best wind turbine technology for a specific location, wind power density, yearly energy output, and capacity factor (CF). In addition, Weibull distribution helps the economic assessments in determining the energy cost and the payback period of wind projects. For instance, the authors in [23] utilize EM, MLM, MLMLM, EPM, and GM to estimate Weibull parameters. These parameters are employed to determine the energy cost, CF, yearly energy yield, and wind power density for Hawke’s Bay in China. Statistical analysis shows that at 30, 60, and 80 m AGL, the yearly wind speeds are 5.04, 5.84, and 6.05 m/s, respectively, while the average power densities are 184.0, 231.5, and 307.5 W/m2. The lowest energy cost based on 2.3 MW wind turbine generators (WTG) is 0.056 US$/kWh. In [24], the authors also evaluate the potential of wind power generation in the central region of Thailand. Weibull distribution is used to carry out techno-economic assessments and accurate feed-in-tariff of a 15 MW wind farm. Results exhibit that the annual wind speed at the study location is 5.8 m/s at 120 m AGL, while annual energy production (AEP) and CF for the 15 MW power plant are speculated to be 41 GWh/year and 30%, respectively. Finally, the Levelized Cost of Energy (LCOE) is determined at 0.093 US$/kWh.
In addition, wind energy for electricity is assessed in the Republic of Djibouti by authors in [25]. Wind speed data were collected at five meteorological stations from 2015 to 2019. Weibull distribution is used to evaluate the economic and technical feasibility of five wind farms with a capacity of 450 MW. The mean wind speed is between 5.52 and 9.01 m/s for the selected five locations. The estimated annual electrical energy output from the proposed wind farms is 1739 GWh, with LCOE varying from 6.94 to 13.30 US cents/kWh. Adnan et al. [26] use GM, EM, EPF, and MLM to obtain the two parameters of Weibull distribution in the Umerkot and Sujawal districts of Pakistan. Results show low statistical errors with EM, EPF, and MLM. Accordingly, the optimal combination of the shape and scale parameters are used to analyze the energy production of various wind turbine technology with rated power ranging between 600 to 2500 kW. Regarding the wind turbines, Nordes N90/2500 produces the most wind energy in Umerkot and Sujawal, with associated energy costs of 0.074 and 0.056 $/kWh, respectively. From the above studies, however, the literature lacks a study that compares the performance of CN and IOA to assess the technical and economic feasibility of wind energy production. Younis et al. [27] examine the efficacy of various WTG when used in various Sultanate of Oman locations. The authors calculate internal and external factors and show how they influence small-scale energy WT using a fuzzy analytical hierarchy process technique. According to the research, the small WTG technology has the potential to be useful for irrigation, homes, schools, and colleges.
Saudi Arabia has roughly 16% of the total world’s oil reserves and is the largest oil producer and exporter of the total petroleum liquid [28]. On the other hand, Saudi Arabia has the potential for wind and sun energy. For wind energy, the process of wind data recording and collection in Saudi Arabia began in 1970 [29]. The first work concerning wind data was done by Ansari et al. [30]. Rehman et al. [29] evaluated the potential of wind energy by assessing the cost of wind power utilizing three WTG at 20 locations in Saudi Arabia. The results showed that the minimum cost of kWh utilizing 2500, 1300, and 600 kW WTG was 0.0234, 0.0295, and 0.0438 US$/kWh at Yanbo, while the maximum appeared in Nejran with values of 0.0706, 0.0829, and 0.121 US$/kWh. In addition, Rehmana et al. [31] studied the potential of wind for pumping water in isolated areas not connected to the main power grid of Saudi Arabia. Results point out that a wind turbine with a size of 2.5 kW is the most suitable for powering the water pump at all the selected sites. It is also found that the cost of water pumping at the three locations is as low as 1.28 US cents/m3.
1.2 Motivation and Contributions
Most wind energy assessments in Saudi studies use CN methods to estimate Weibull parameters and accordingly evaluate the techno-economic assessments of wind energy production. Nevertheless, the advent of the IOAs revealed their capacity to obtain optimal Weibull parameters and represent wind speed data more accurately, thus, more precise wind energy evaluation. Therefore, the main objective behind this research is to conduct technical and economic feasibility studies for five sites in northern Saudi Arabia. This study proposes six wind turbine technologies with different wind speed characteristics and rated powers. The primary contributions of this research work are as follows:
1. Develop a framework to calculate the characteristics of the Weibull distribution to describe the wind speed at five different locations in Saudi Arabia: Aljouf, Rafha, Tabuk, Turaif, and Yanbo.
2. Compare the performance of five CN methods and five IOAs in obtaining Weibull parameters. The CN methods used in this study are LSM, MLM, MOM, EM, and EPFM, while IOAs are PSO, GA, Differential Evolution (DE), COA, and Social Spider Optimization (SSO). Results demonstrate that IOAs outperform CN approaches in determining the best parameters, providing a trustworthy account of the actual frequency of wind speed.
3. Evaluate the energy output and recommend the optimal wind turbines for the selected sites. This study analyzes the installation of six wind turbine technologies rated between 1 and 3 MW.
4. Estimate the cost of energy to justify the wind turbines’ economic viability over their life span.
5. Even though this work aims to characterize wind speeds in Saudi Arabia, the established framework can be used to describe wind speeds in many geographical areas with varied wind regimes.
The paper is organized as follows: Section 2 explains the framework of the study and wind speed data source. In Section 3, Weibull PDF is presented together with the estimation approaches: CN and IOA. Section 4 describes the statistical indicators used to evaluate the accuracy of the study models. Section 5 discusses the wind power extrapolation at hub height, while Section 6 exhibits the economics analysis of wind turbines. The discussions and results of the comparison are presented in Section 7. Finally, the study concludes in Section 8.
This section provides a complete explanation of the methodology employed in this research. Initially, the problem description and framework of the proposed methods are described. An introduction about Weibull distribution and CN and IOA methods are then presented, along with the technical and economic assessment of the used procedure.
The main goal of this study is to present a framework for assessing the wind energy potential at five locations in northern Saudi Arabia, namely Aljouf, Rafha, Tabuk, Turaif, and Yanbo. The proposed framework evaluates the performance of five CN and IOA estimation methods in obtaining the two parameters of Weibull distribution. In addition, a comparative analysis is conducted using technical and economic feasibility studies to assess the wind energy resources at the considered sites. Therefore, the proposed framework is shown to be accurate, reliable, simple to implement, and can help evaluate wind energy in different geographic areas.
This feasibility study conducts a comparative analysis between five CN and five IOA methods to estimate Weibull distribution parameters. Fig. 1 presents the overall framework adopted. The main steps of the proposed framework are as follows:
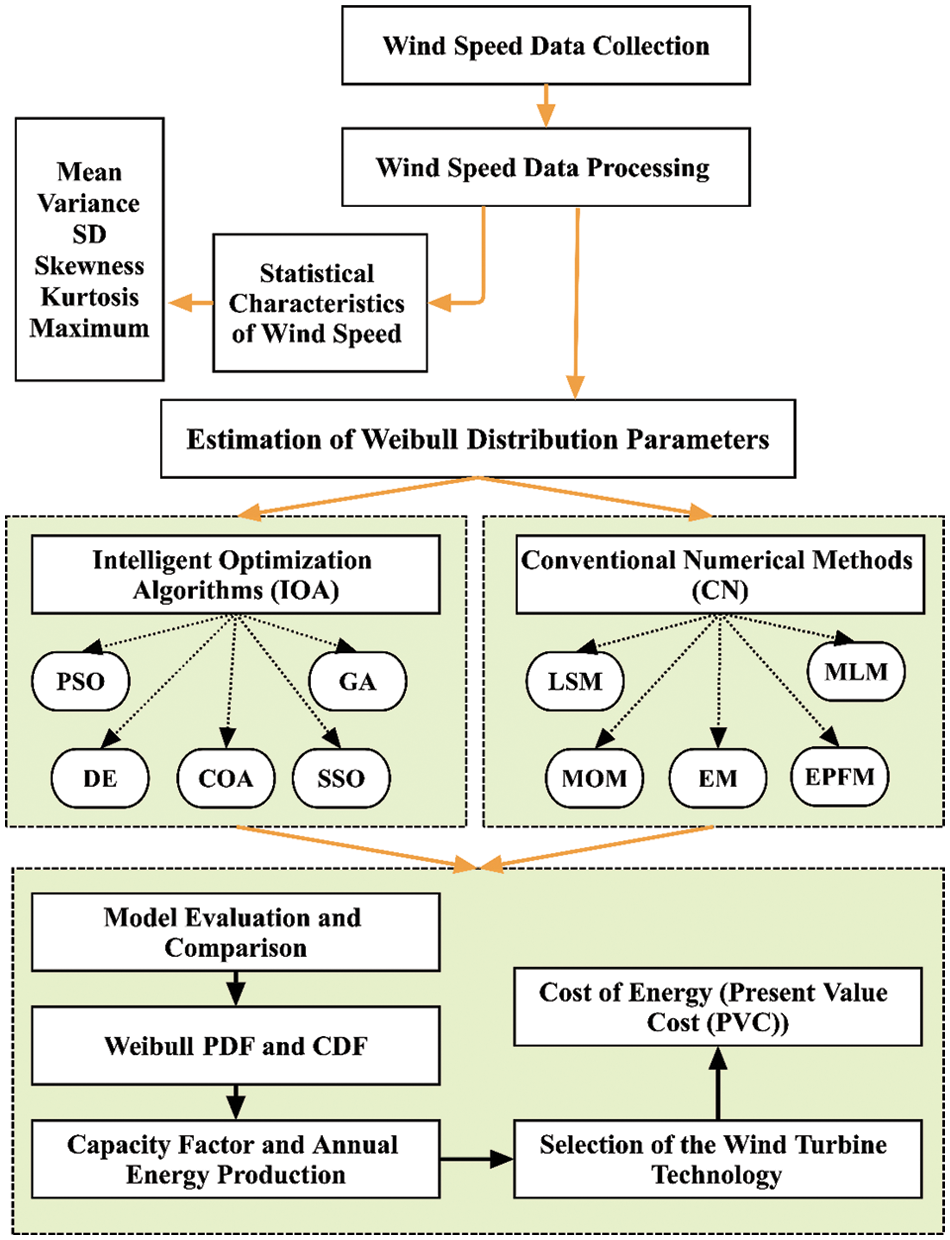
Figure 1: The framework of the study
Step 1: Data collection: the wind speed data are initially collected. Afterward, the data preprocessing techniques are applied to organize the data by looking for missing values, noisy data, and other abnormalities before running the estimation methods.
Step 2: Statistical characteristics: the main objective of this step is to provide insights into the wind regimes in each site and approve the performance of the proposed algorithms.
Step 3: Weibull parameters estimation: the CN and IOA methods are applied to estimate c and k of the Weibull distribution.
Step 4: Building the estimation models: by using the best parameters mentioned in Step 3, ten models are generated for each considered site.
Step 5: Results comparison: the models generated by CN and IOA methods are evaluated utilizing RMSE, Coefficient of Determination (R2), and Mean Absolute Error (MAE).
Step 6: Annual energy: based on the comparison in Step 5, the best Weibull PDF function findings are used to estimate the annual energy produced by wind turbines.
Step 7: Energy cost: the feasible energy cost per kilowatt hour (kWh) for the chosen wind turbine is then calculated using the annual energy estimate.
The subsections below provide a detailed explanation of each step.
The wind data used in this study is obtained from the National Climatic Data Center, USA, Department of Commerce [32]. In this study, the wind speed regimes of five Saudi areas located in the northern parts are investigated, namely Aljouf, Rafha, Tabuk, Turaif, and Yanbo. These locations are chosen for the wind analysis primarily because they are spread out geographically in the northern parts of Saudi Arabia, where the wind speed is predominant. To accomplish a very accurate assessment of wind power, avoid uncertainty in the wind, and justify the economic feasibility of wind deployment, long-term averaged-daily wind speed data are considered in this study covering 40 years (1977–2017). Table 1 exhibits the geographic information and anemometer height at each site. Fig. 2 displays the Saudi Arabia wind speed map, while Fig. 3 shows the monthly mean of wind speed data at the five study locations.
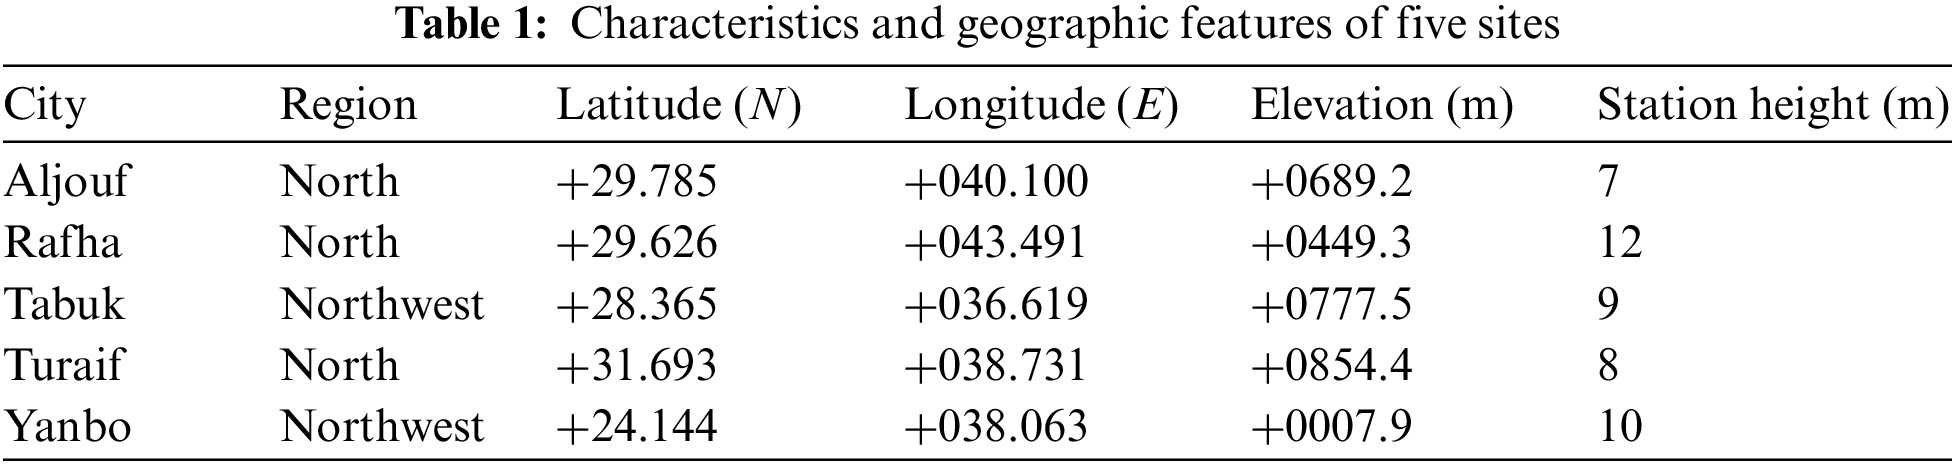
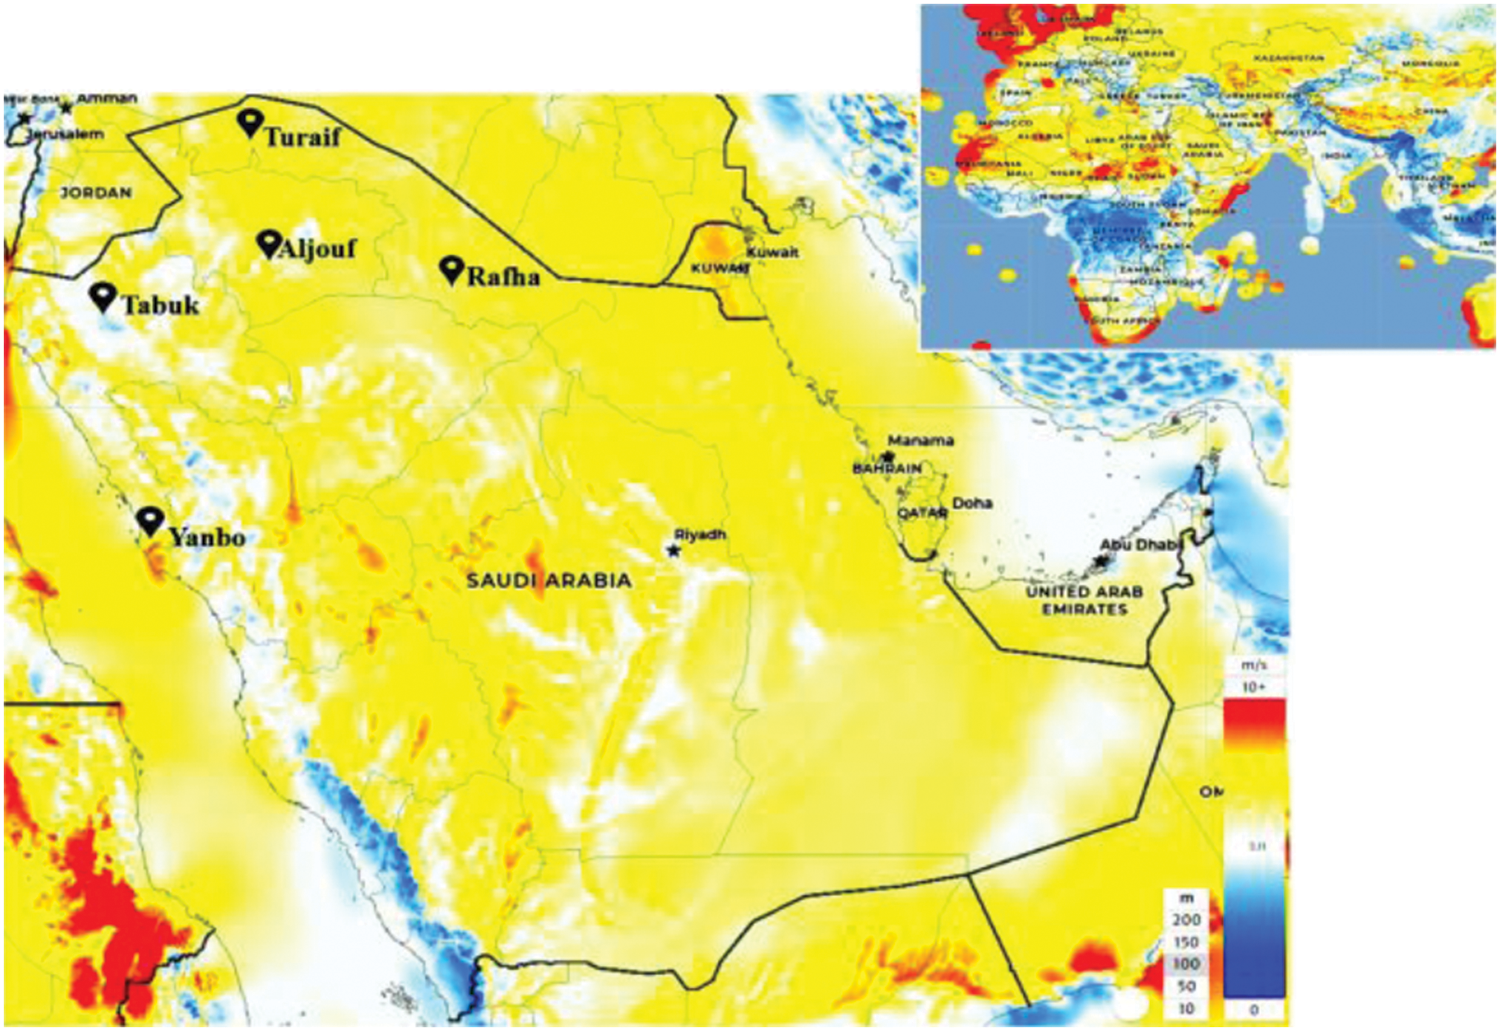
Figure 2: Map of Saudi selected sites. This map is obtained from Global Wind Atlas. Please visit https://globalwindatlas.info
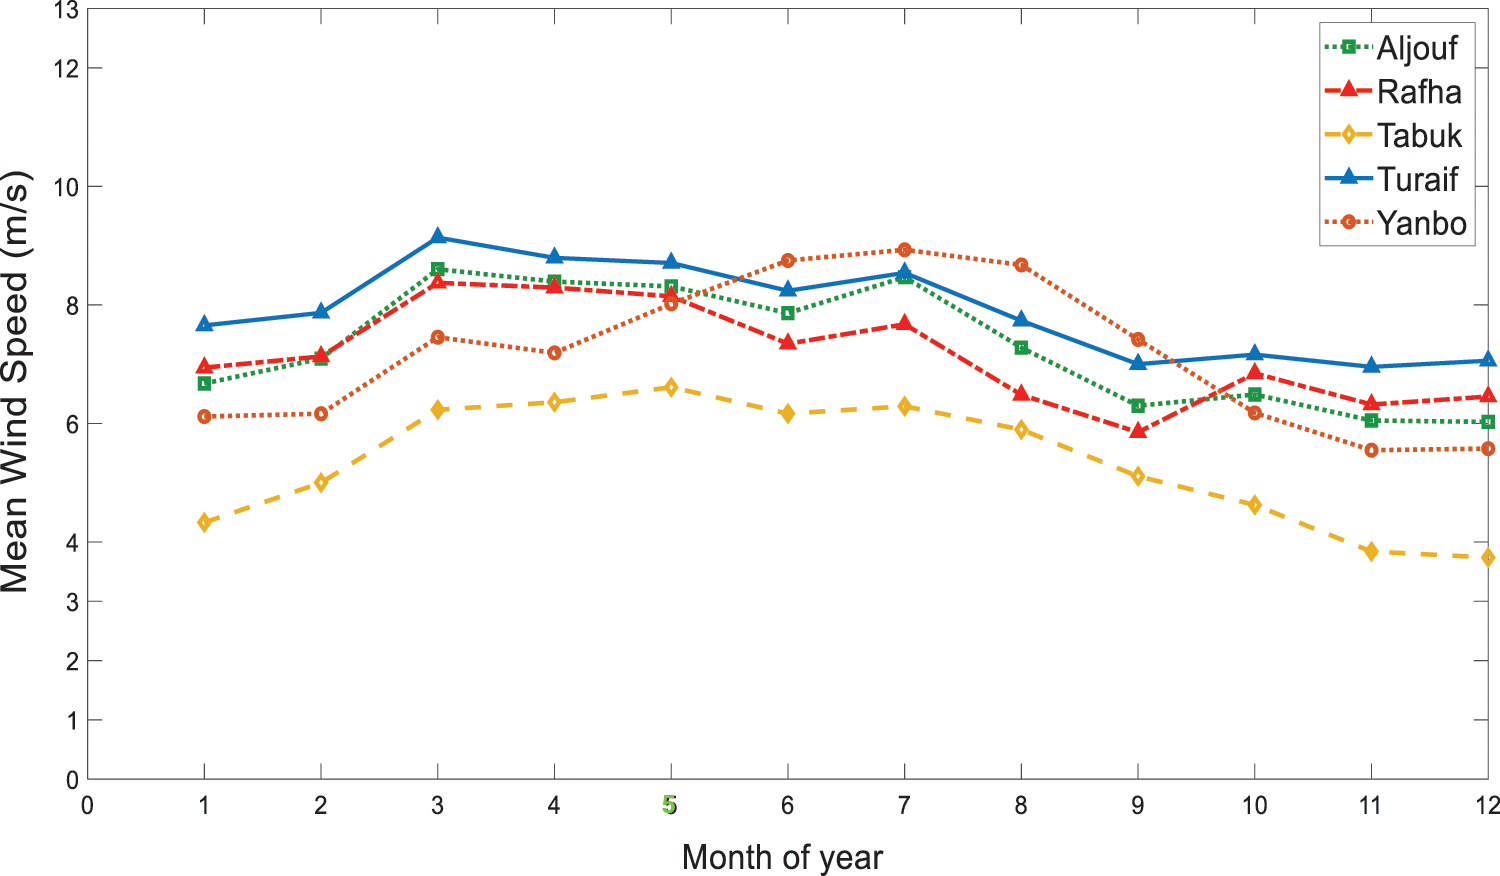
Figure 3: Monthly mean of wind speed at the study sites
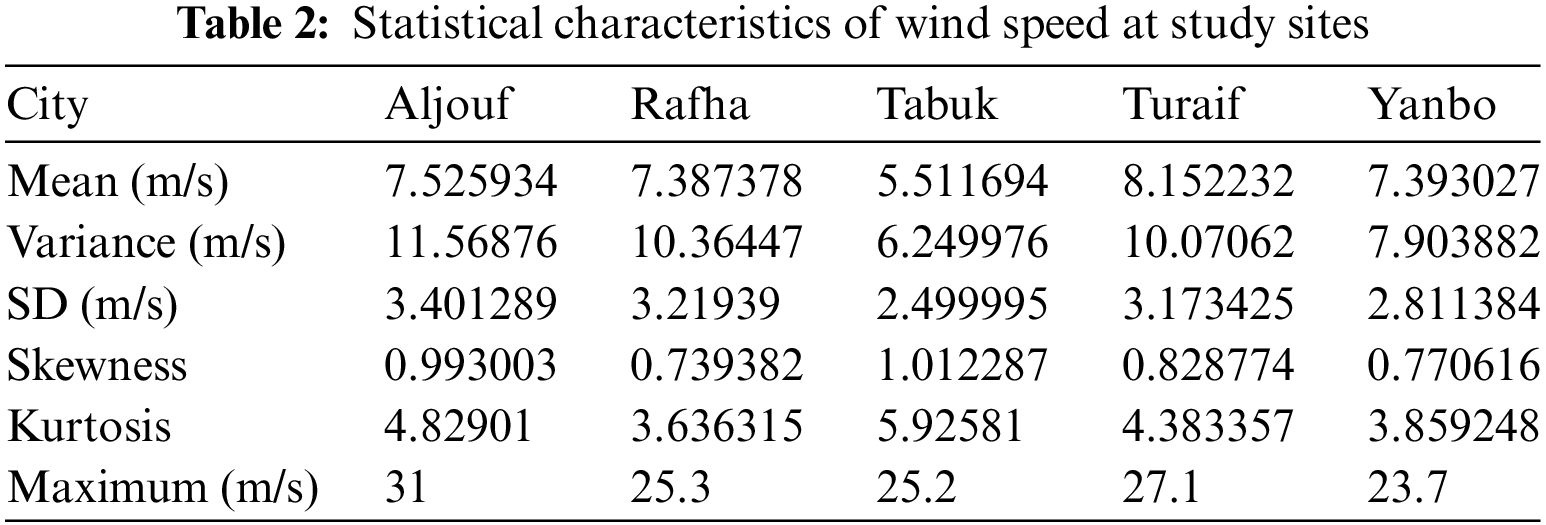
2.4 Wind Speed Characteristics
Some statistics are calculated at the measurement heights to comprehend and analyze the wind speed data. Table 2 lists the statistics values, including Mean, Variance, Standard Deviation, Skewness, Kurtosis, and Maximum wind speed value. The Mean value tells about the central tendency of the wind speed data. Variance and Standard Deviations (SD) provide information about how observed wind speed deviate from the central value. In addition, to understand the pattern of the observed frequency distribution, Skewness and Kurtosis are utilized. The symmetrical characteristic of the wind speed data is measured by Skewness, while the steep degree of data is described by the Kurtosis value [12].
3 Two-Parameters Weibull Model
Weibull PDF showed its popularity worldwide to represent the wind speed frequency distribution. Weibull distribution proved its efficiency in representing wind data as it provides a good fit for the wind speed data at the ground surface and upper layers [33]. Weibull distribution is characterized by its PDF,
where,
3.1 Conventional Numerical Estimation Methods
The following subsections explain the CN methods used to estimate the shape k and the scale c parameters of the Weibull PDF [35–37].
The wind speed data should be represented in a cumulative frequency distribution arrangement to use LSM [38]. The logarithmic transformation is fundamental to LSM. Therefore, the linearization of Weibull distribution, for example, is accomplished by taking the logarithm of its CDF to obtain the following expression [39]:
This equation represents a straight line as follows:
By linear regression formula, the least square estimator of Weibull distribution parameters k and c are as follows:
3.1.2 Maximum Likelihood Method
The MLM is known as the likelihood function of the wind speed data [35]. The MLM can be solved by numerical iteration to compute the two Weibull parameters. According to maximum likelihood estimation theory, the Weibull parameters are calculated from Eqs. (6) and (7) [40]:
After determining the value of k in Eq. (6) through a numerical iteration algorithm, such as Newton Raphson, the value of c can be computed from Eq. (7).
The MOM uses the mean of the observed wind speed
where:
The EM is a special case of the MOM [35]. The Two Weibull parameters are estimated in this method by using the following equations [41]:
3.1.5 Energy Pattern Factor Method
The EPFM is generated from the average data of the wind speed and is represented as follows [36]:
where Epf is the energy pattern factor. As the Epf is determined, the Weibull parameters k and c are estimated from Eqs. (13) and (14).
3.2 Intelligent Optimization Algorithms
The metaheuristic optimization algorithms are nature-inspired techniques. The examined algorithms include PSO, GA, DE, COA, and SSO. With these algorithms, this study attempts to minimize the difference between the measured frequency distribution of the wind speed and theoretical values generated by the considered PDFs. Hence, the objective function is as follows:
where
Fig. 4 depicts the process of optimizing the Weibull parameters from the scope of the PSO algorithm. The c and k are generated, and their values evolve until we obtain the lowest error values, represented by Eq. (15). The optimization algorithms are compared to estimate the Weibull parameters. The outcomes of the algorithms are considered after 50 runs, each with 1000 iterations. The median values of the 50 runs were used to select the final fitness values. Fig. 7 displays the convergence rates of the algorithms to obtain the optimal set of Weibull parameters in the selected sites.
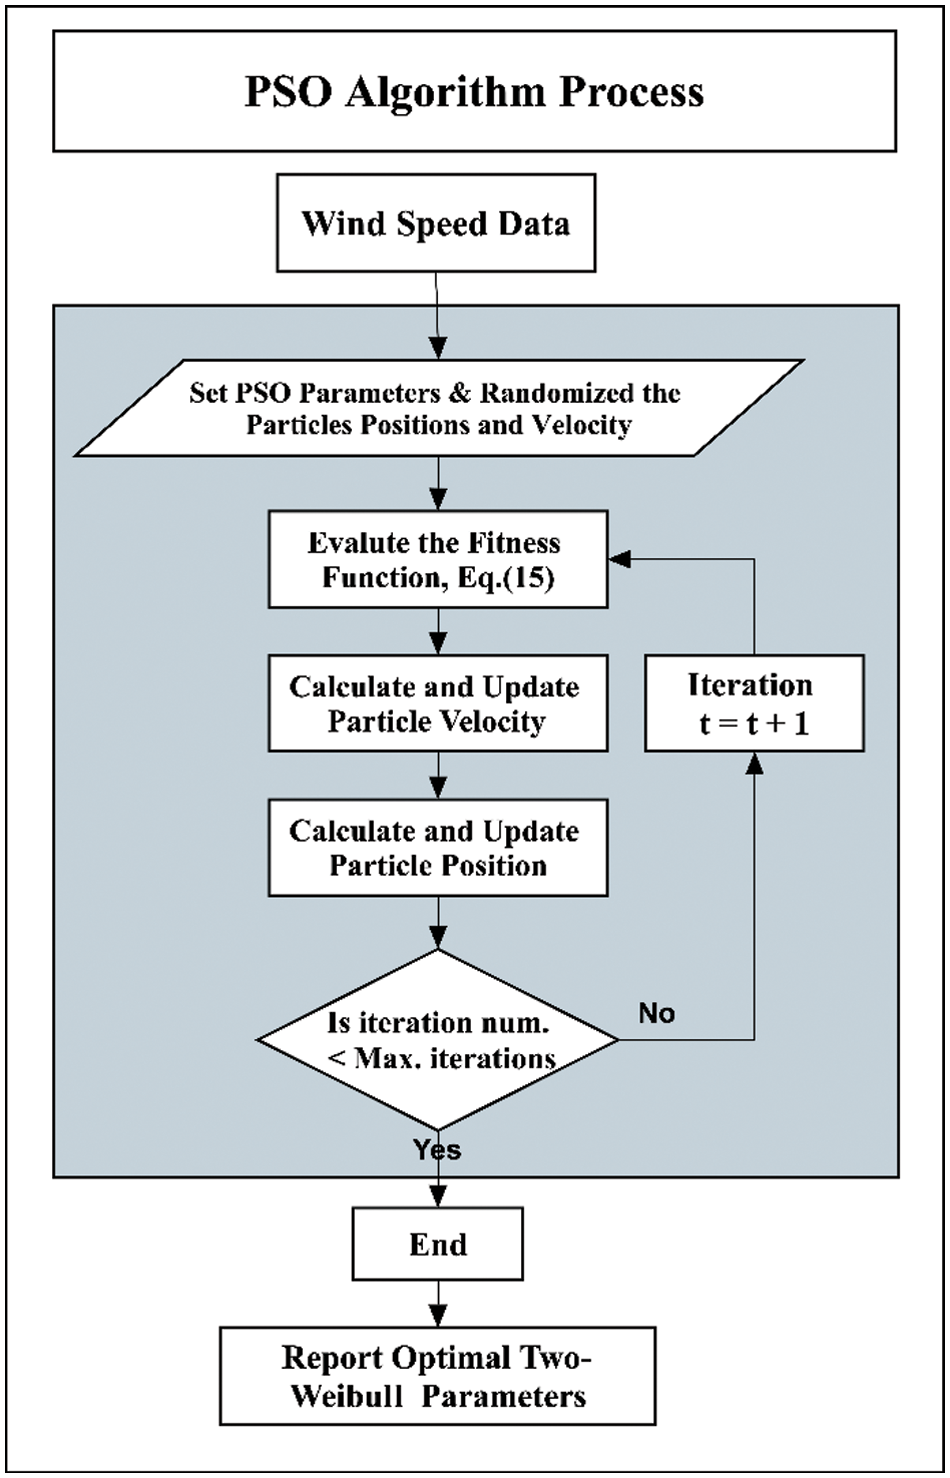
Figure 4: The process of optimizing Weibull parameters from the scope of PSO
The accuracy and efficiency of the considered numerical and optimization methods to show how close the theoretical frequency distribution is to the empirical frequency distribution are evaluated using some statistical indicators: RMSE, R2, and MAE [42].
where:
5 Wind Power Extrapolation at Turbines Height
Wind speeds are collected at station height while the wind turbines are functioning and designed to operate at hub heights
where v and
The Weibull distribution parameters values
The value of
The performance of Wind turbines is subjected to different criteria that are essential to evaluate their efficiency. CF is a significant criterion since it refers to the overall performance of the wind turbine over the desired time interval. The energy output
where
where
After determining the capacity factor and the rated power of the wind turbine, the output power of the WTG over its lifetime can be then calculated from the following equation:
6 Economic Analysis of Wind Turbines
The energy cost analysis is vital to justify the economic viability of wind turbines over their life span. The technical assessment (Maximum capacity factor) is insufficient to select the ideal wind turbine technologies and site. Hence, the minimum cost of energy ($/kWh) provides a reliable evaluation of the selection process.
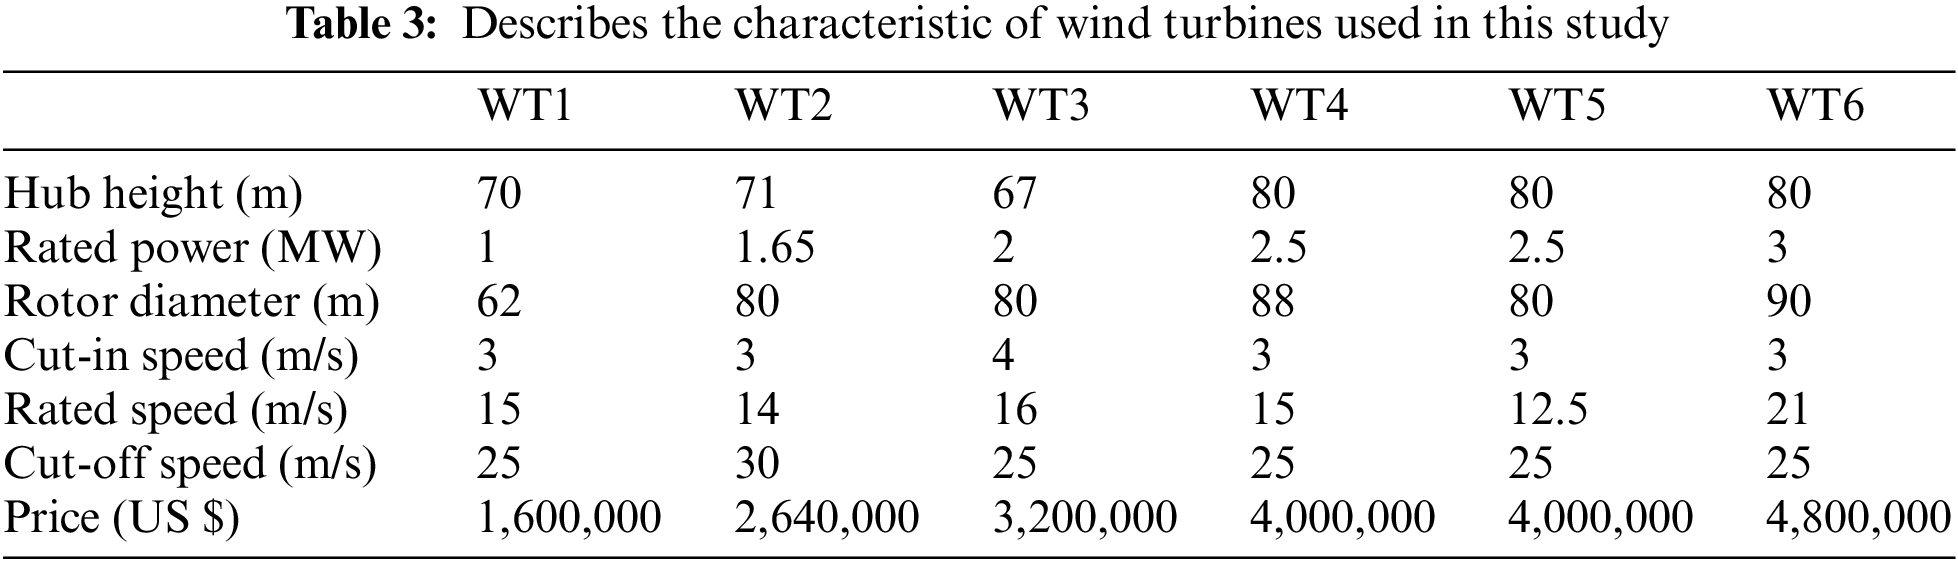
Several factors influence the cost of the WTG, including initial investment cost, location, and operating conditions where the wind turbines are implemented [45]. Prices of wind turbines are set by manufacturers depending primarily on the rated power of the wind turbines; see Table 3 [45,46]. Usually, for wind turbines with a size greater than 200 kW, the price is between $1000 to $1600 per kW [45]. Present Value Cost (PVC) is selected in this study to speculate the cost of wind energy production in the five Saudi sites. The cost of kWh of energy is computed by dividing the PVC values by
■ Wind turbines’ lifetime
■ The interest rate (
■ The operation, maintenance, and repair cost (
■ Scrap or Salvage value (
■ Investment
Therefore, under previous assumptions, PVC is calculated for each WTG at each site as follows:
In this study, a comparative analysis is conducted between the performance of five CN and IOA methods in the accurate estimation of Weibull parameters and in assessing wind energy resources in five locations in Saudi Arabia. First, the histograms of the observed wind speed frequency distributions are initially constructed for the considered sites. Next, the c and k are estimated using CN methods and IOA. After that, the performance of the theoretical PDFs is examined according to the RMSE, R2, and MAE. The results of the best estimation approach based on both CN methods and IOA are then compared in assessing the wind energy potential with six wind turbines in all the selected locations.
7.1 Analysis of Weibull PDF Estimation Methods
Fig. 5 shows the Weibull frequency distribution using CN methods and IOA with the original wind speed data histogram. Comparing the performance of CN methods and IOAs and according to Tables 4 and 5, which summarize the goodness of fit tests results of theoretical Weibull distributions, the IOAs outperformed CN methods in obtaining the optimal two-Weibull parameters and in describing the frequencies of actual wind data. In Table 4, the results of CN methods indicate that LSM is the least precise method among other approaches, while the best CN estimation methods for all five sites are ranked as EM, MOM, MLM, and EPFM, respectively.
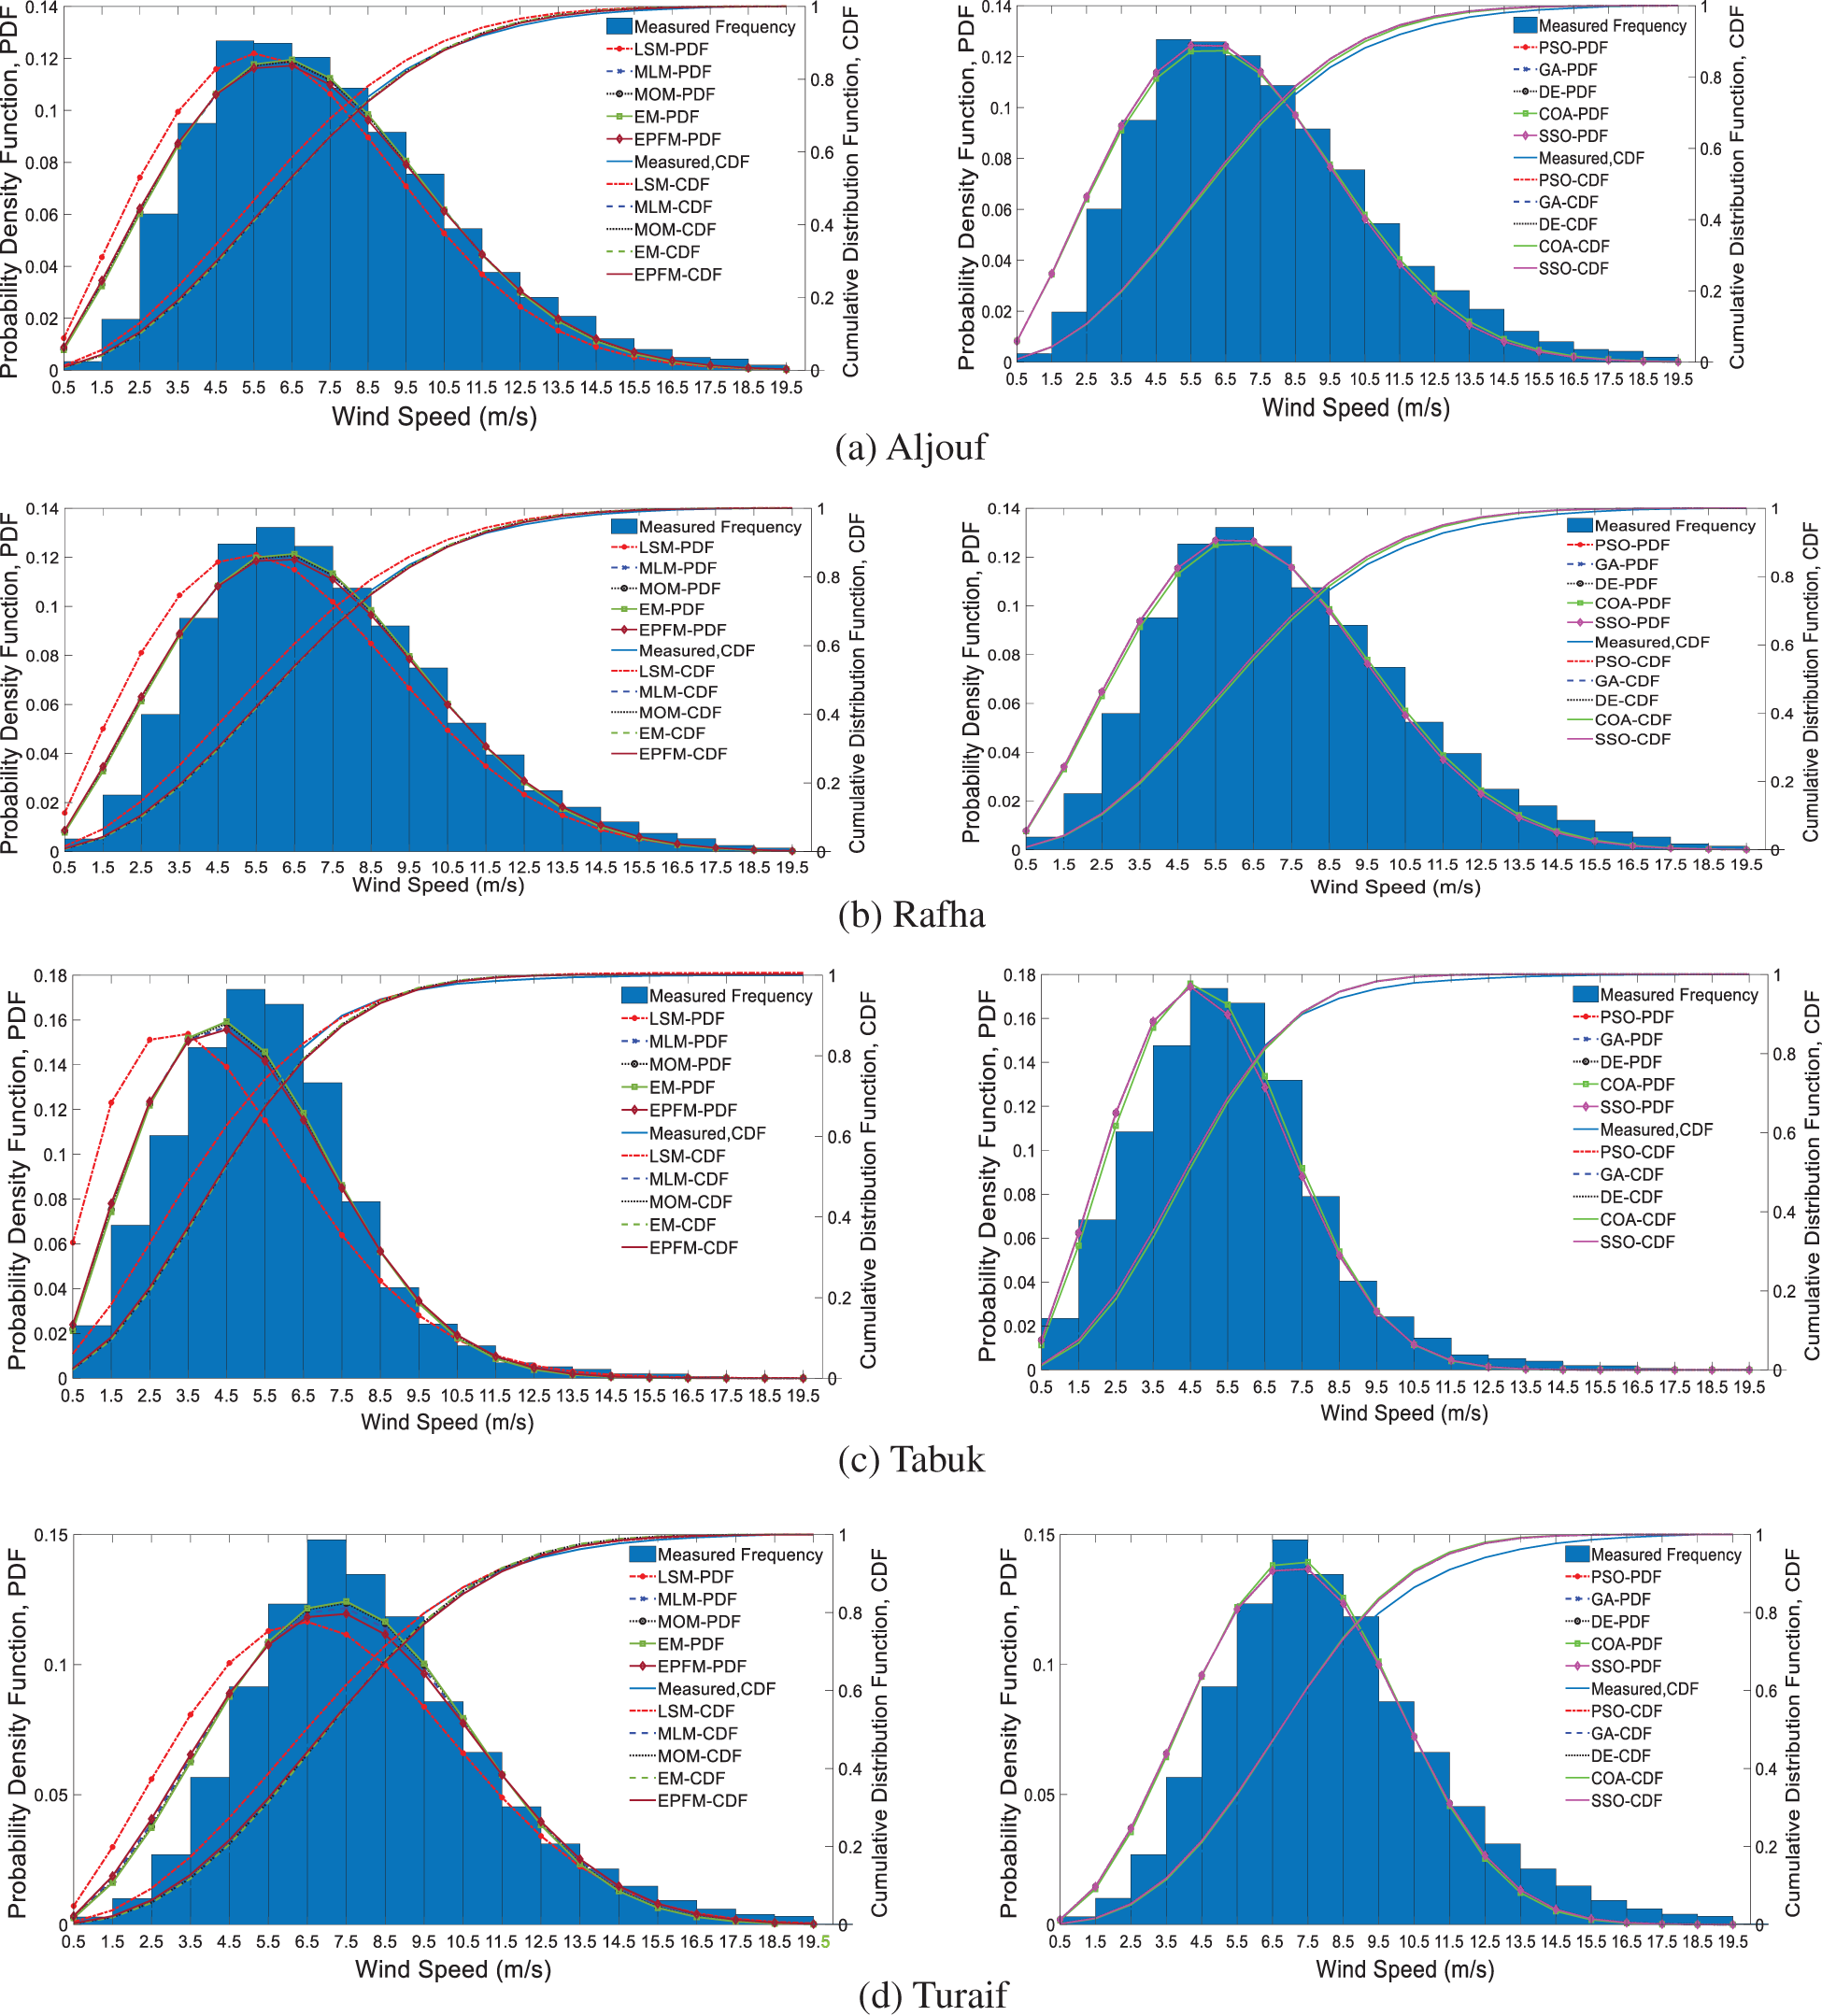
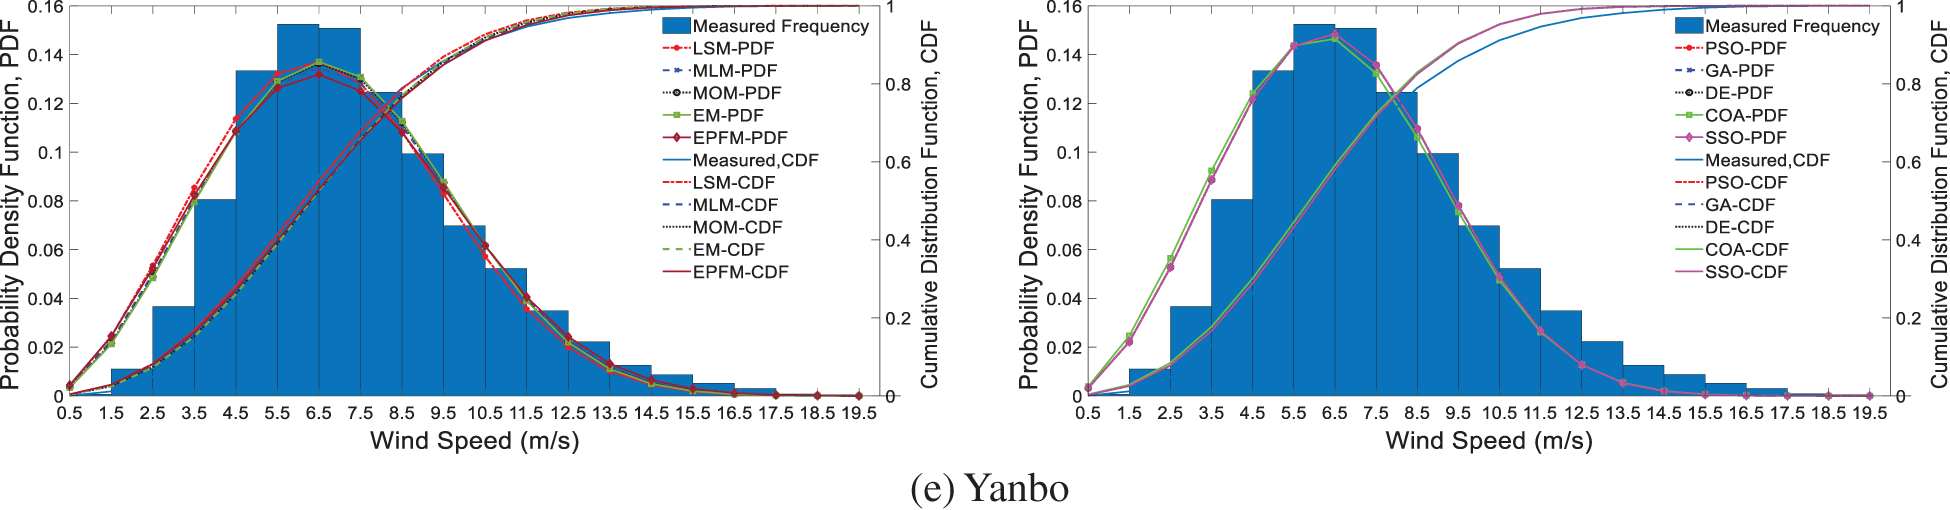
Figure 5: Histogram of observed wind speed and Weibull PDF using CN methods (left) and IOA (right)
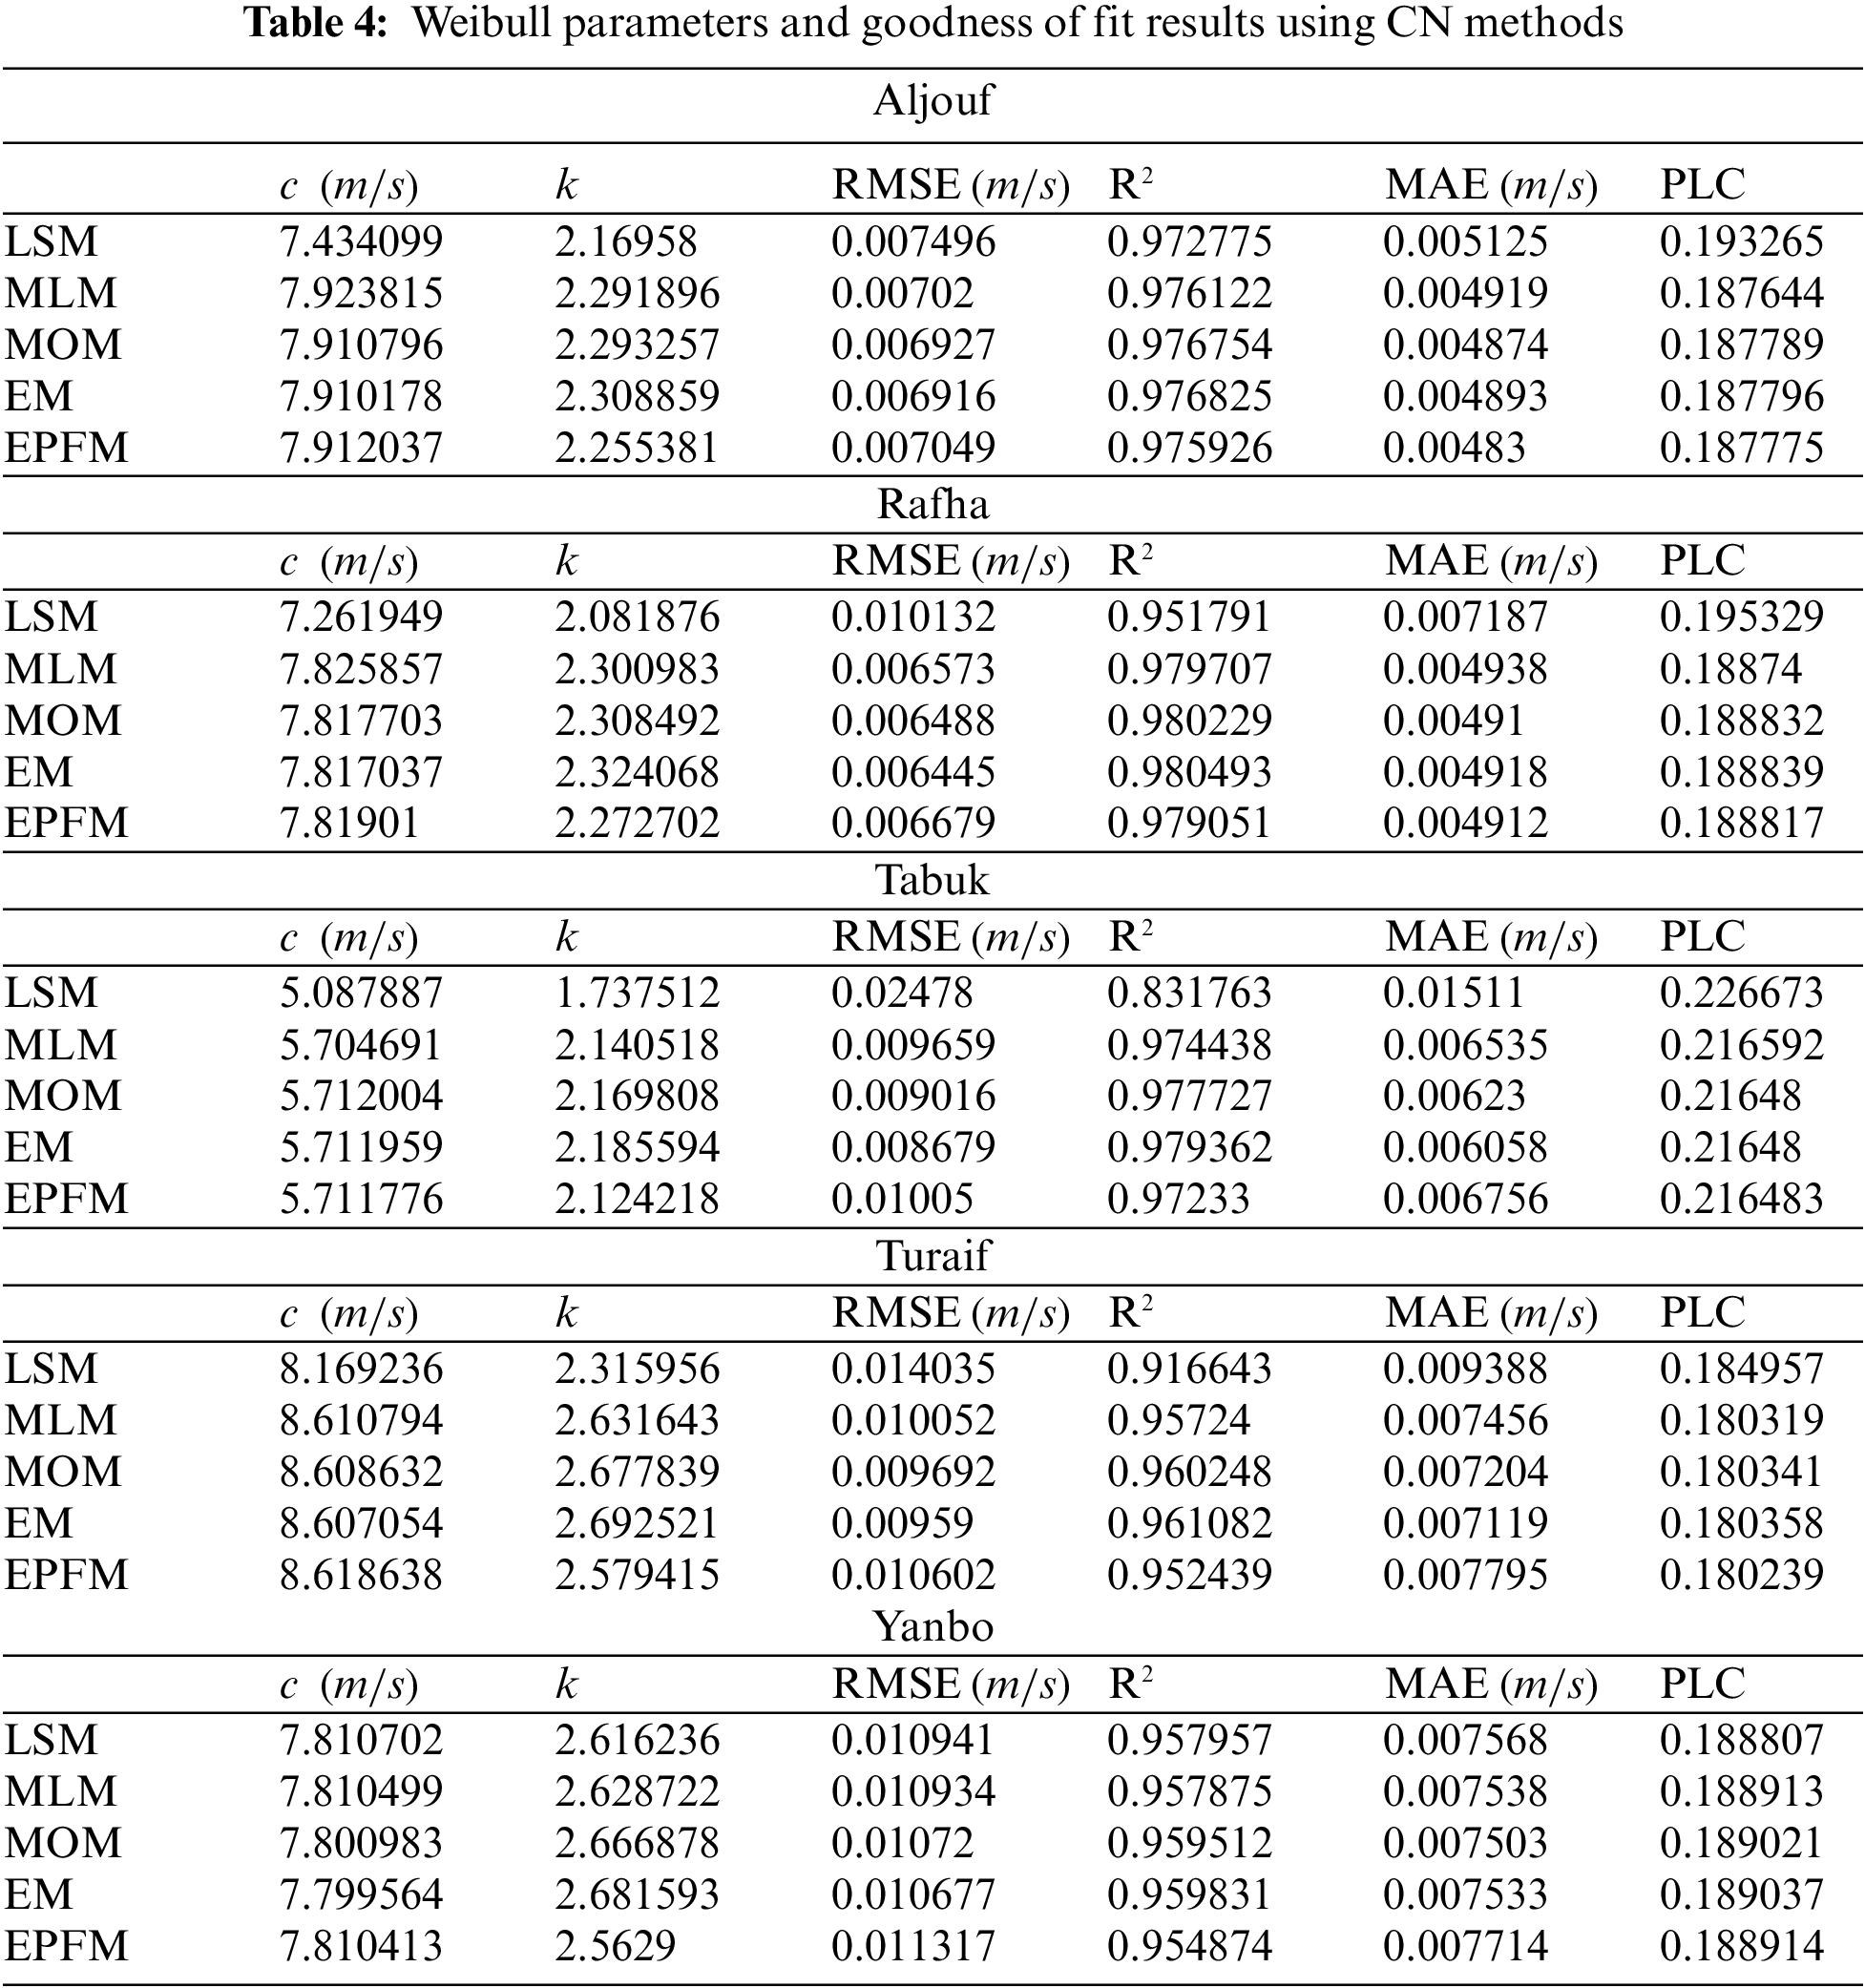
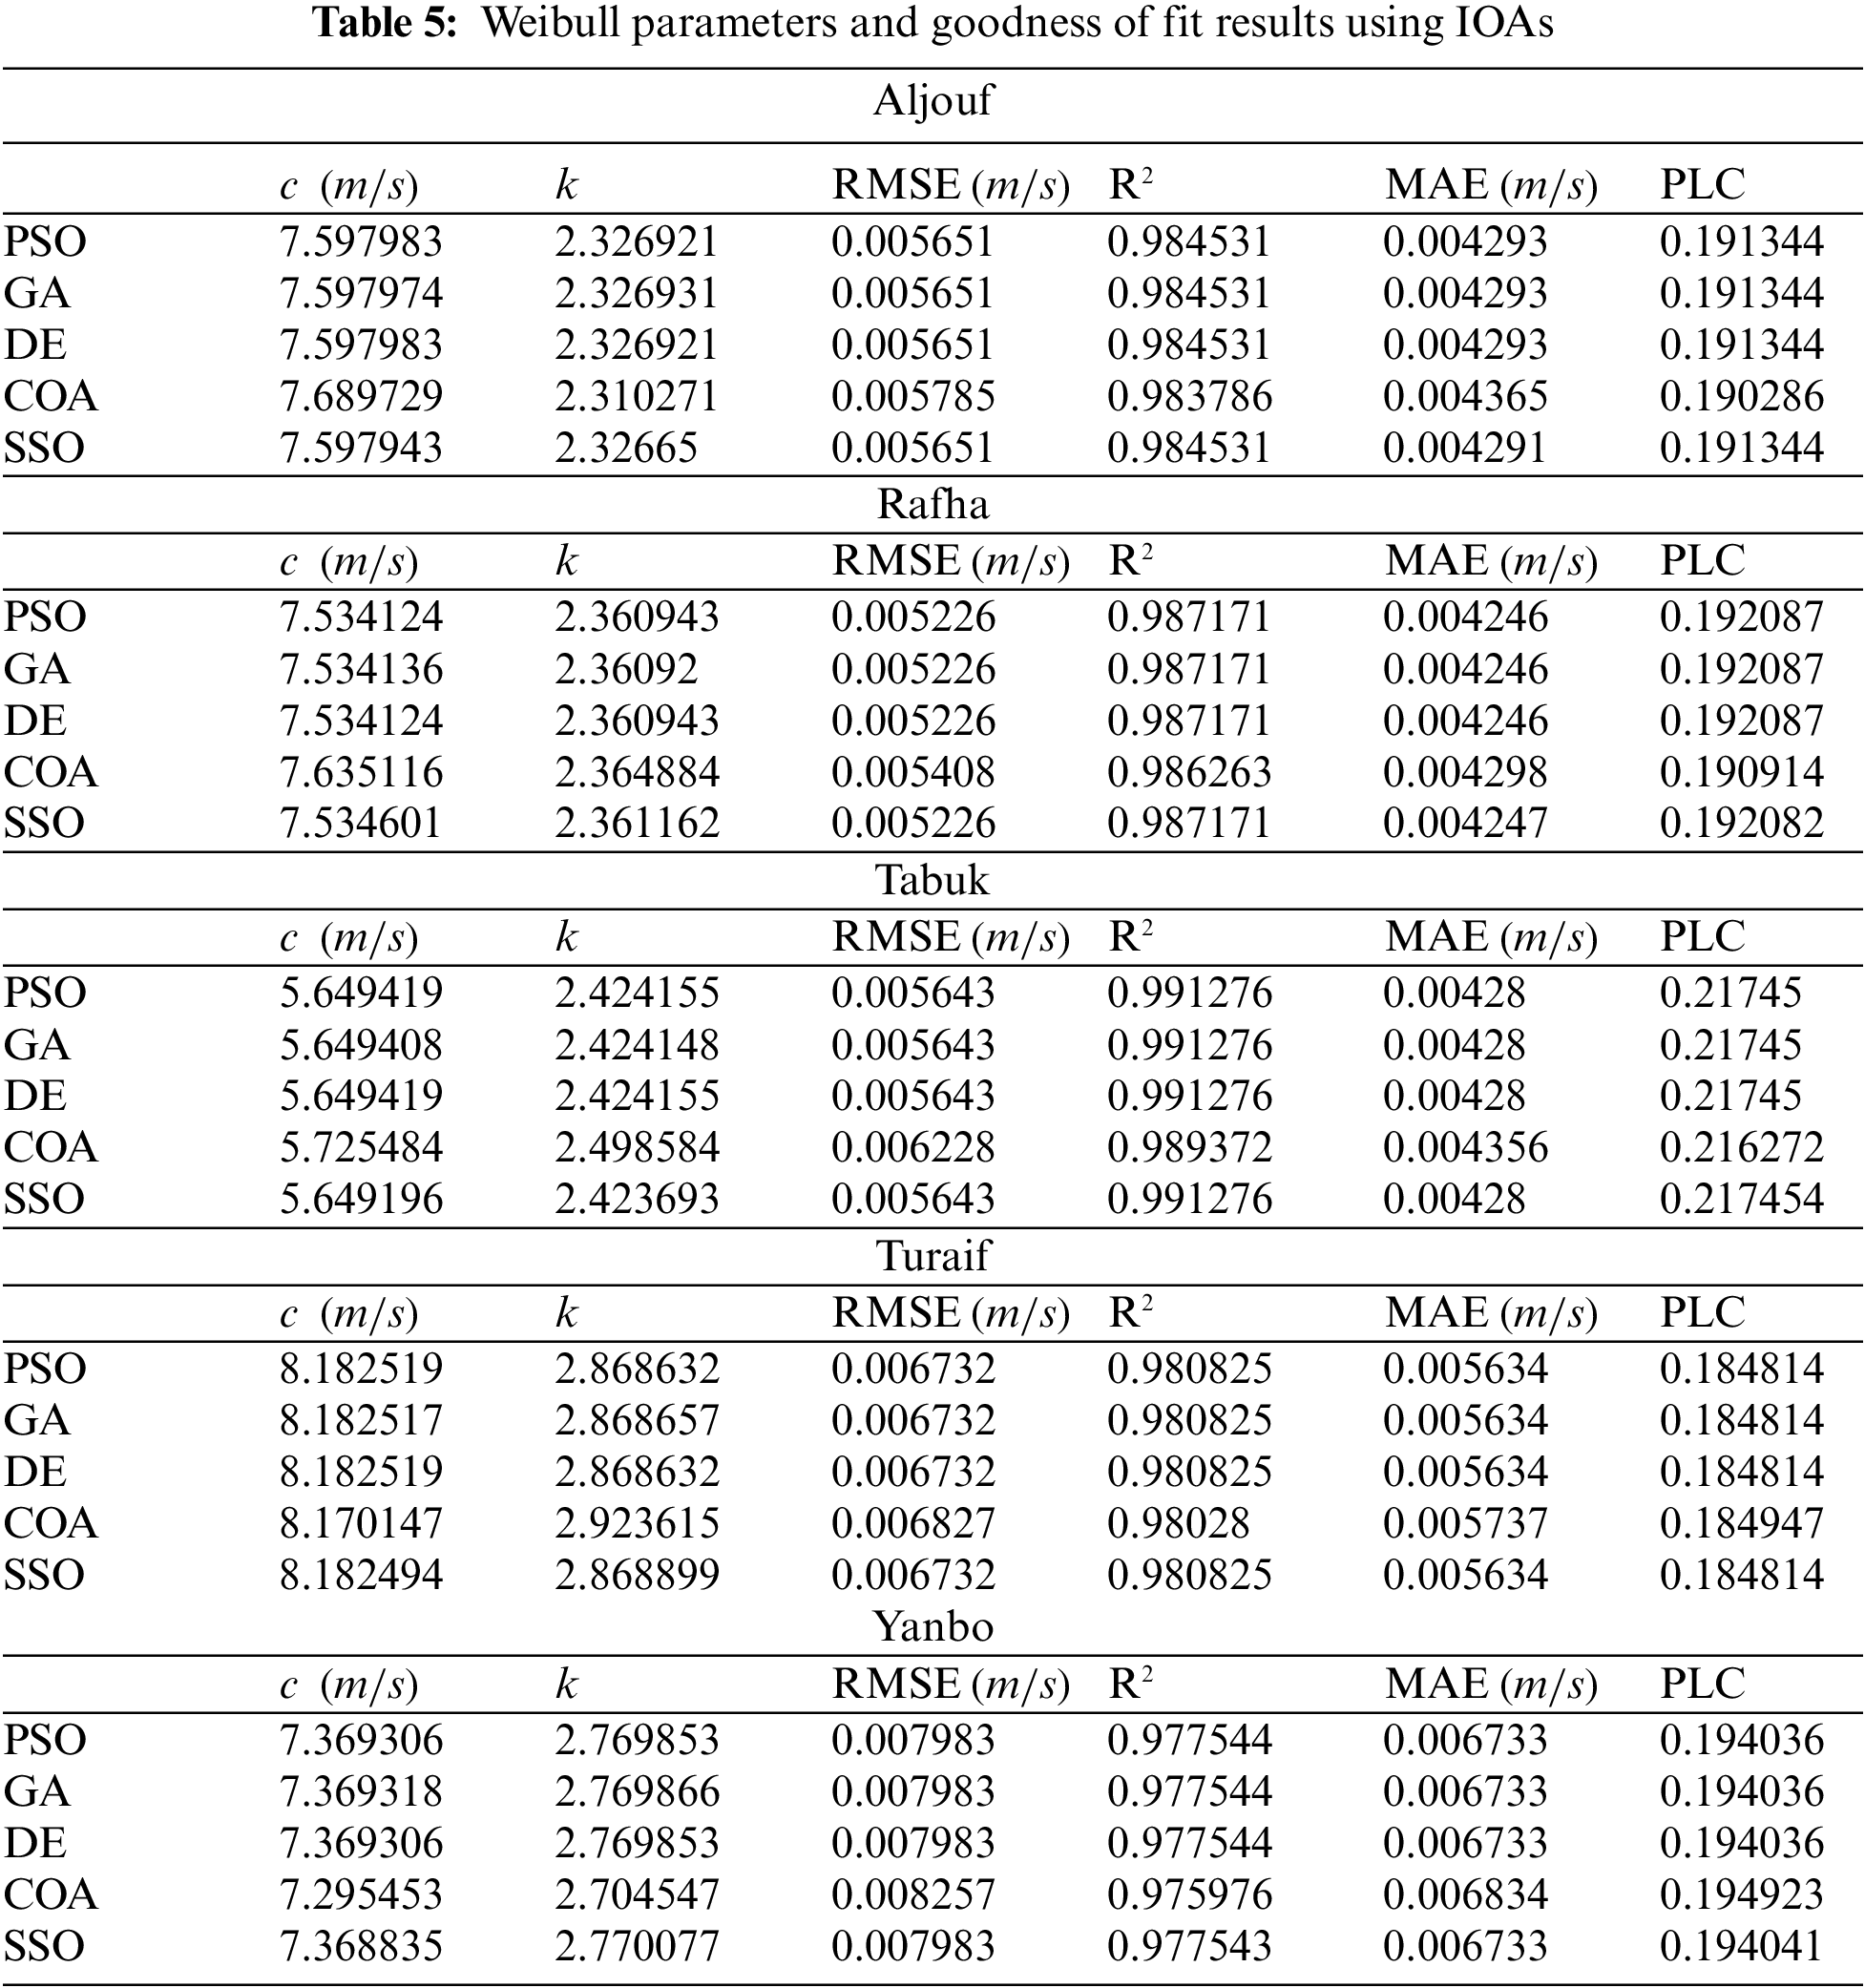
In Table 5 and Fig. 7, results revealed that COA is the less accurate and the slowest algorithm to obtain the Weibull parameters. Yet, it performs better in tuning c and k than all CN methods. PSO, GA, DE, and SSO algorithms have similar performance in estimating Weibull parameters, resulting in high fitting accuracy. In Aljouf, for example, the RMSE, R2, and MAEare 0.00565, 0.98453, and 0.00429, respectively. Therefore, for CN methods, the scale and shape parameters of Weibull for all five areas, Aljouf, Rafha, Tabuk, Turaif, and Yanbo, are determined by EM to carry out the technical and economic assessments and to compare its results with those obtained by SSO. Table 6 lists the Weibull parameters and PLC attained from EM and SSO at all Saudi sites. Fig. 6 shows the coefficient of determination values of the Weibull distribution using different models. The R2 values of Weibull using LSM, EM, PSO, and COA are 0.916643, 0.961082, 0.980825, and 0.980280. This indicates that the models generated by IOAs are more accurate than CN methods.
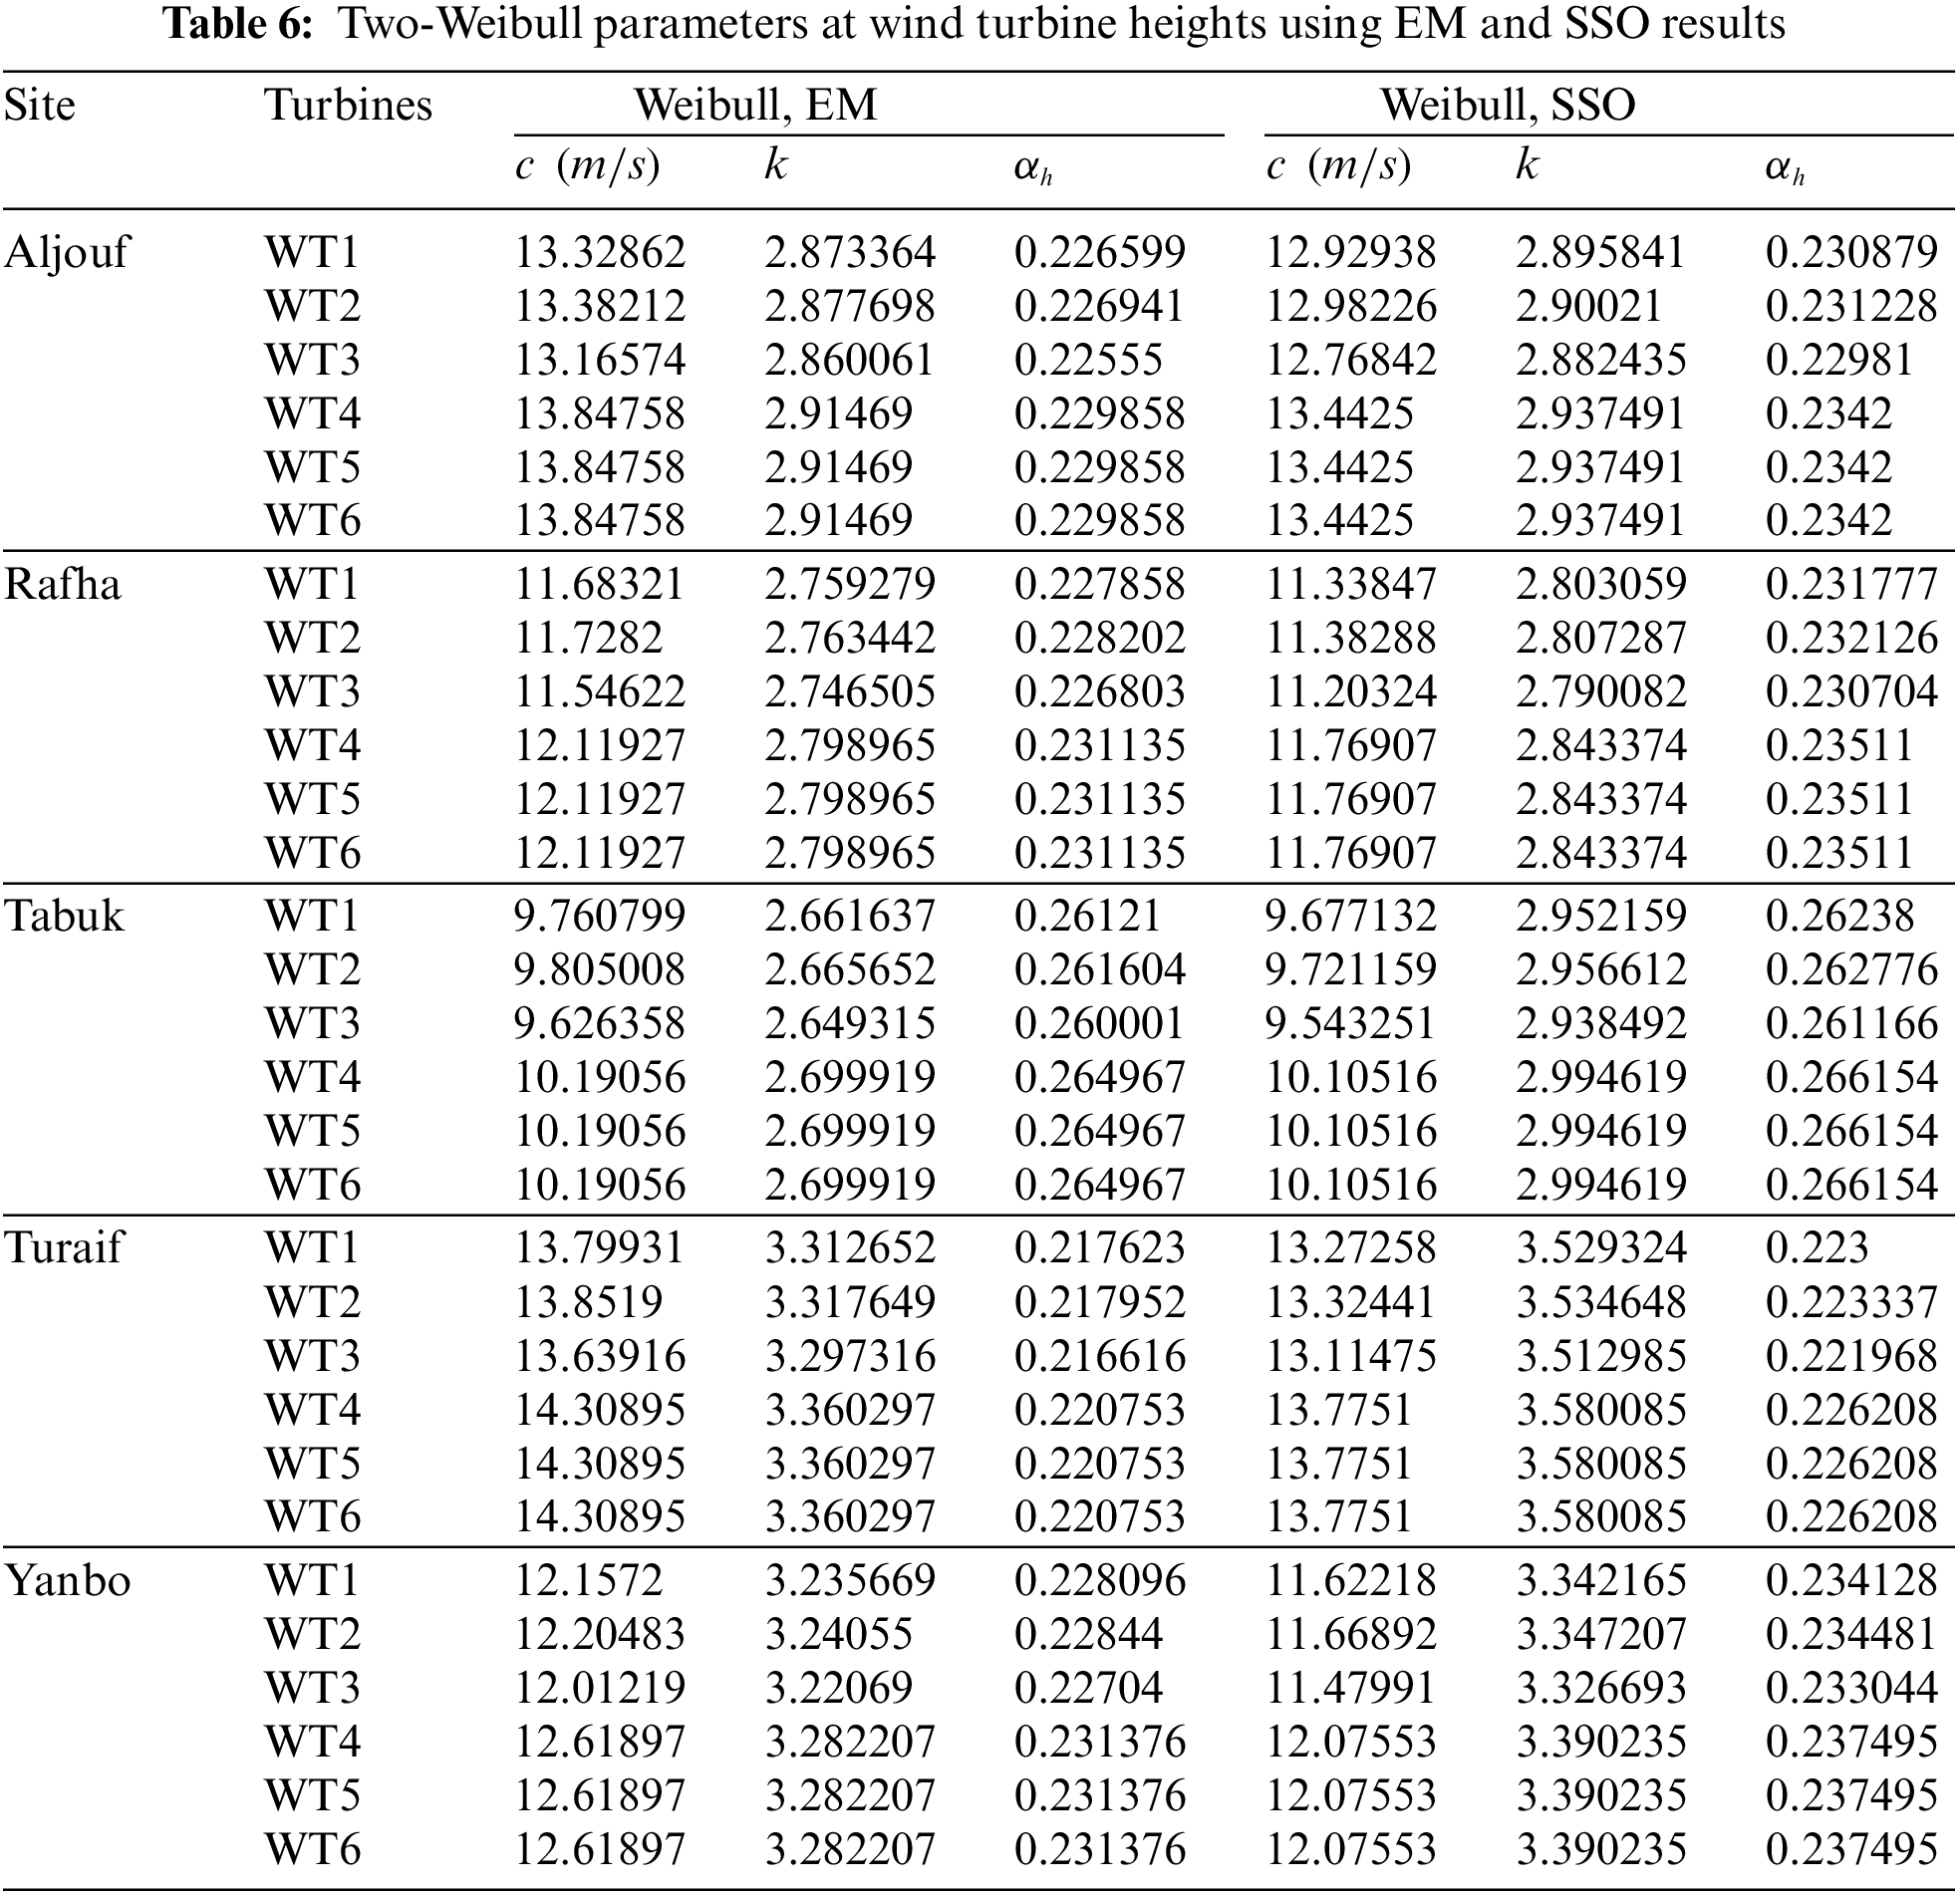
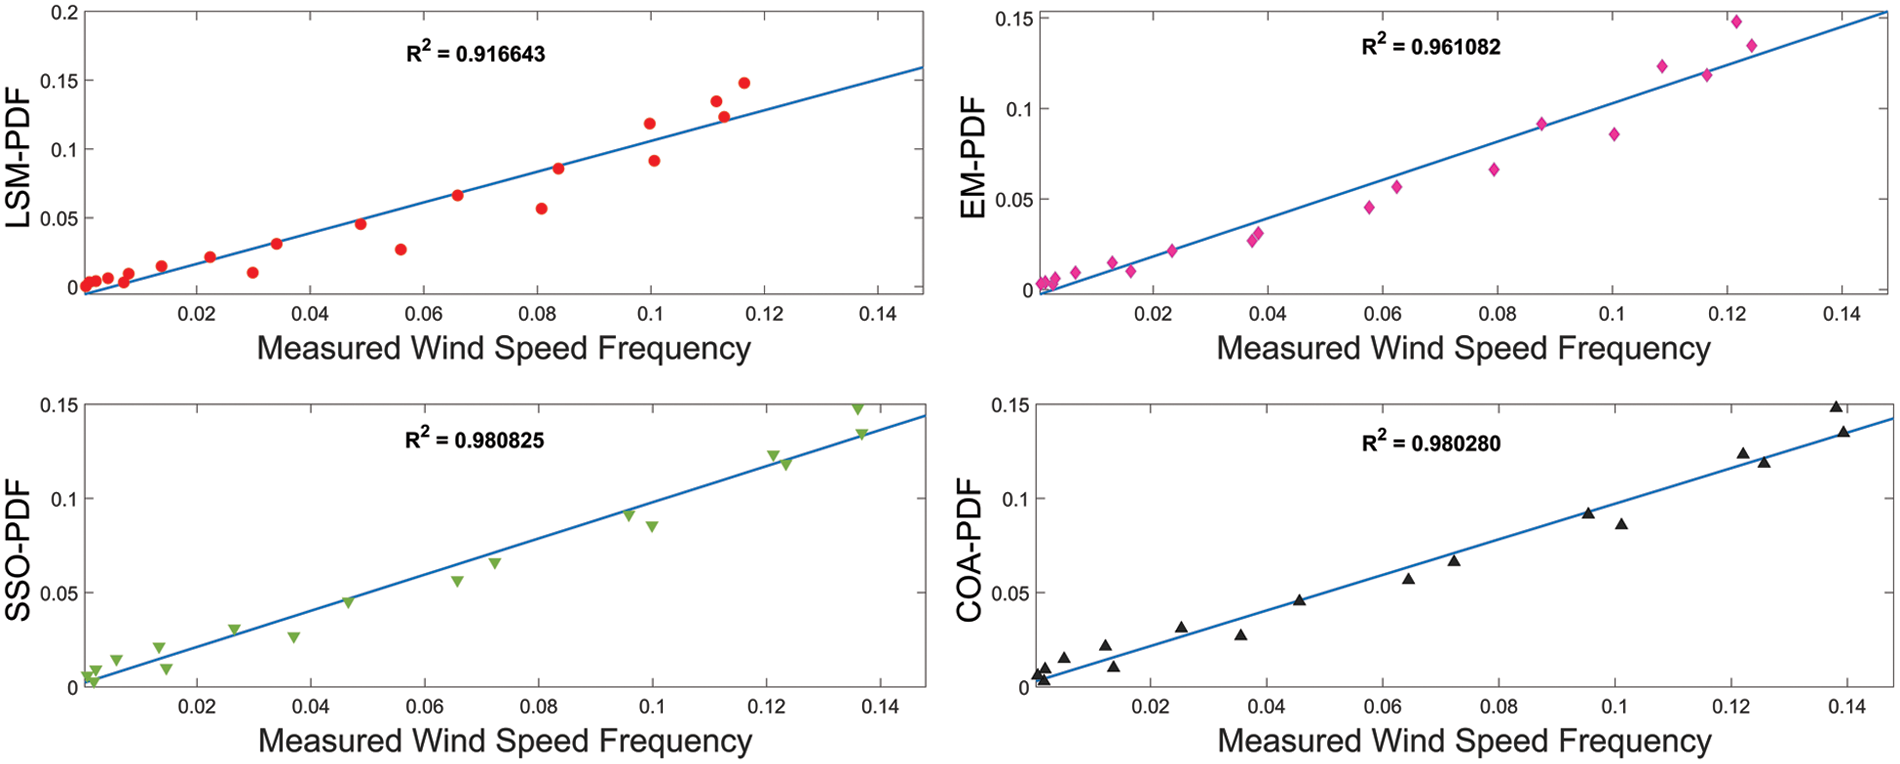
Figure 6: The coefficient of determination values of the Weibull distribution using different models
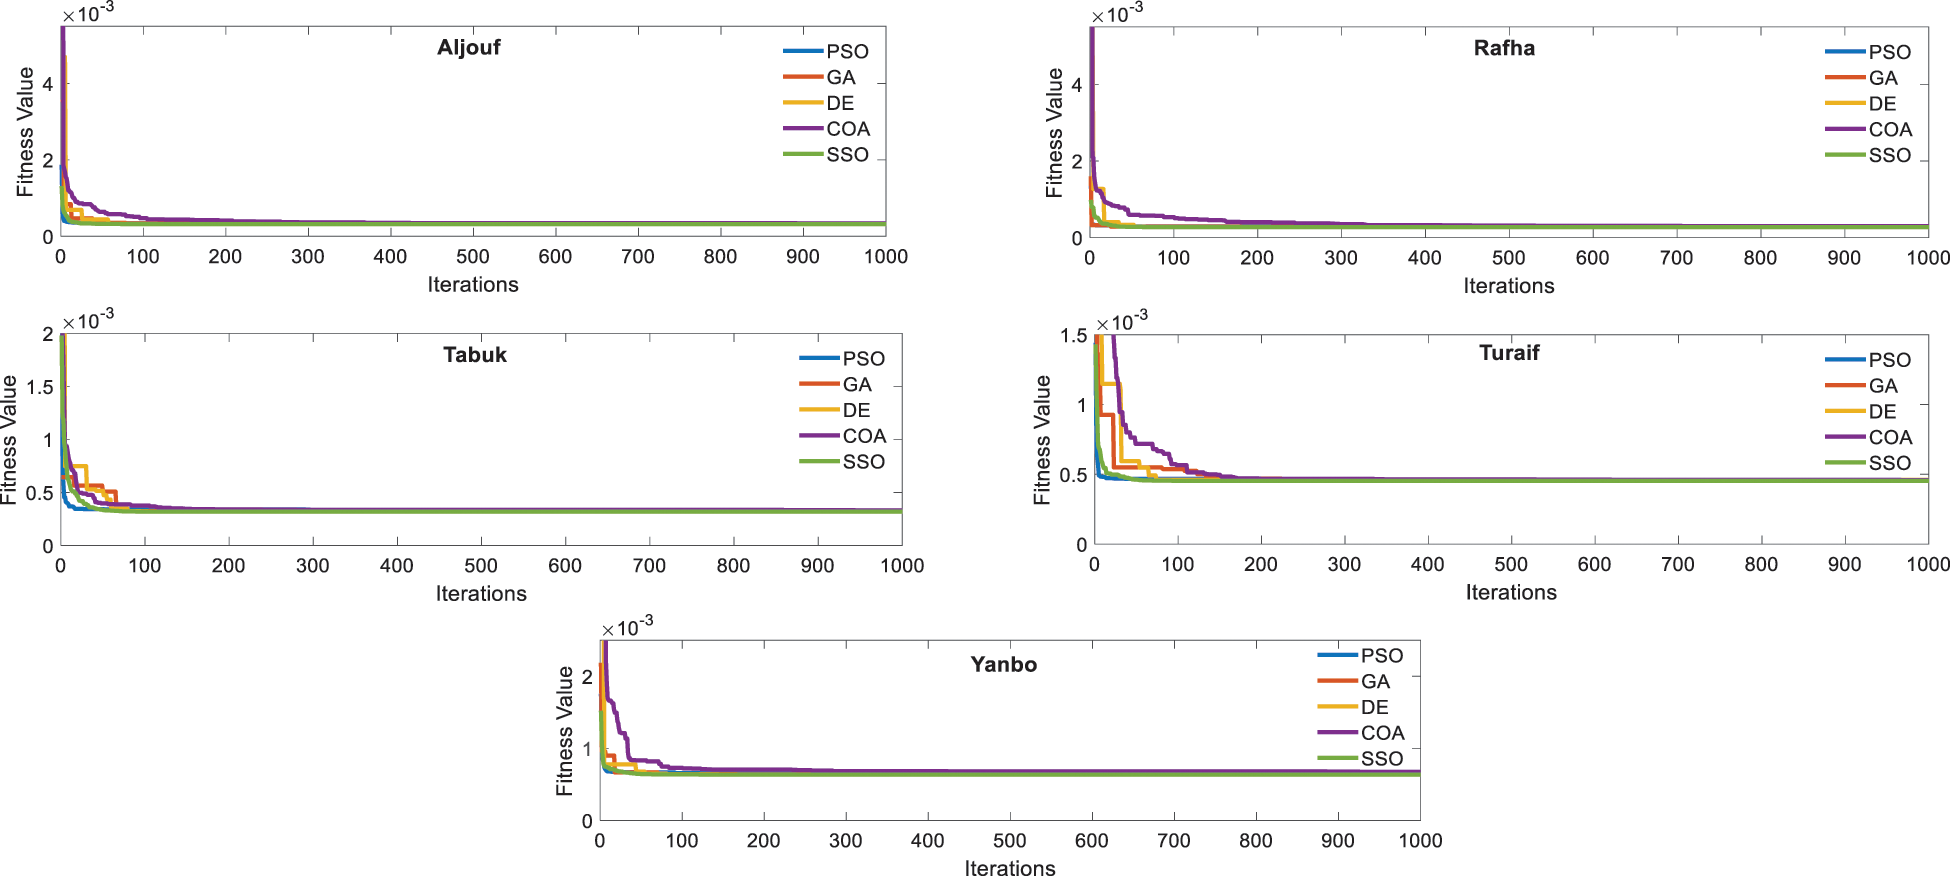
Figure 7: The convergence rate of PSO, GA, DE, COA, and SSO in optimizing Weibull parameters
7.2 Analysis of Wind Turbine Energy Output
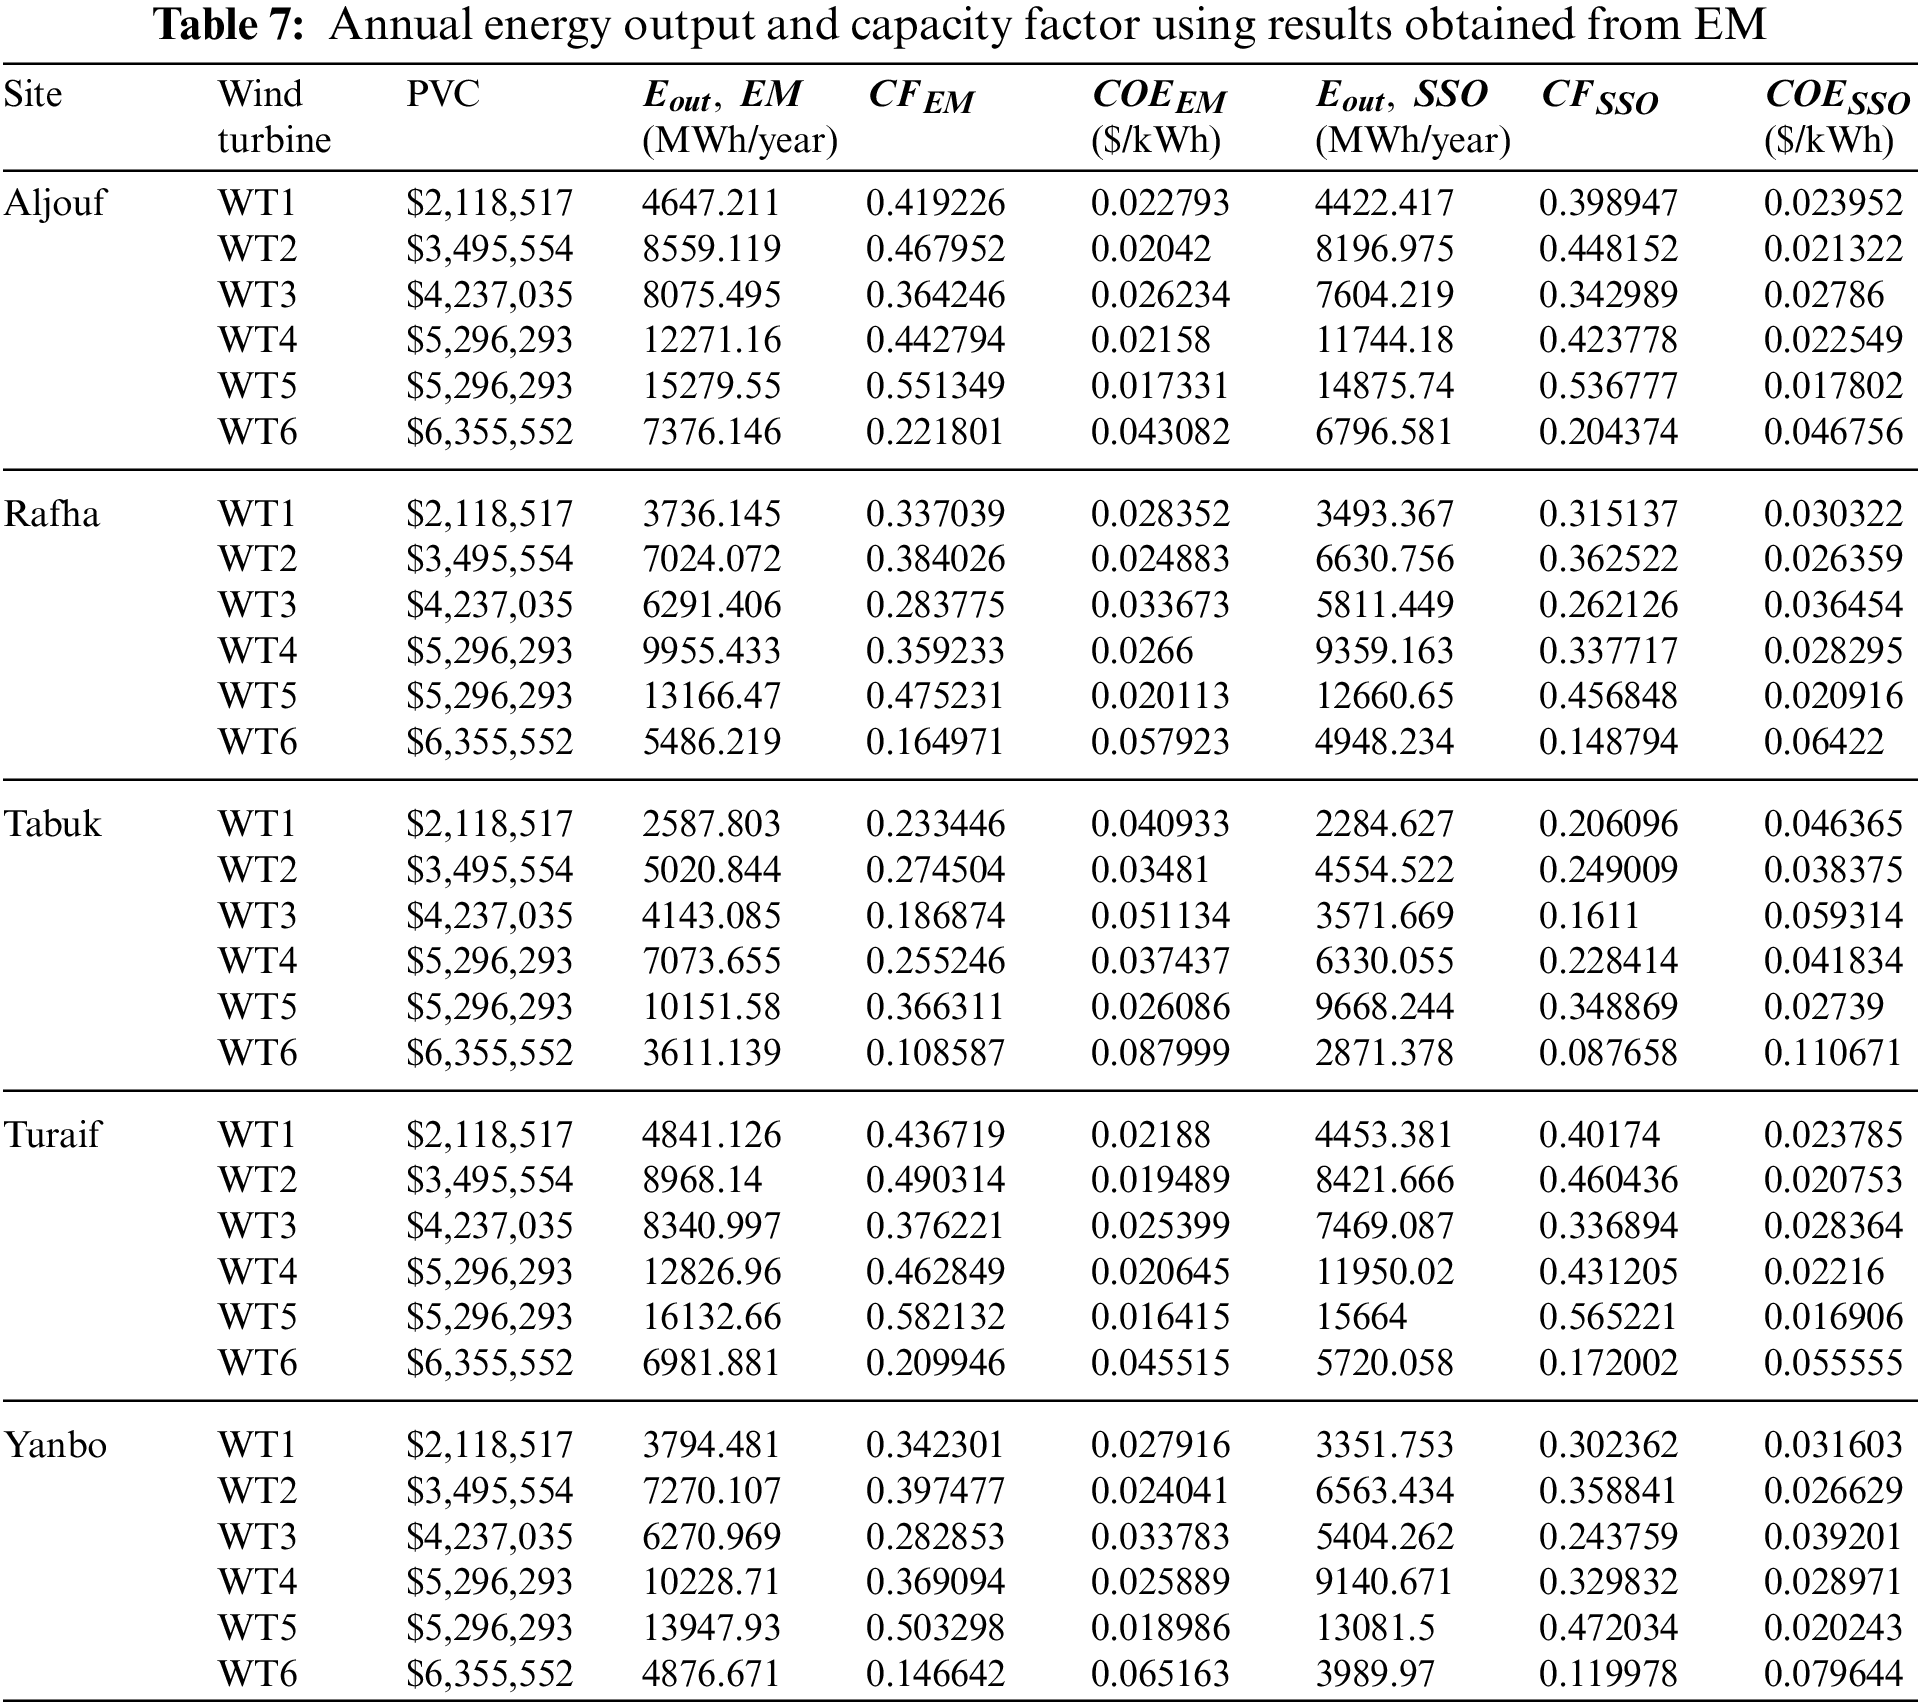
Table 7 exhibits the energy output in MWh and the CF. This Table shows that the range of CF is between 10.86%–58.21% and 8.77%–56.52% using EM methods and SSO, respectively. For all Saudi sites, the CF of all six wind turbines examined in this study has higher values in the case of using Weibull parameters obtained from EM compared to those attained by SSO. That means that the annual energy output of wind turbines is overestimated with CN approaches than the intelligent optimization methods. For instance, WT4 output energy in Yanbo is 10228.71 MWh when employing values calculated from EM, while it is found to be 9140.67 MWh with SSO.
7.3 Analysis of the Cost of Energy
In addition, Table 7 illustrates that the values of the cost of energy (COE) of all wind turbines at the five Saudi locations have low $/MWh with the best model obtained by EM compared with the best model in IOA. Since SSO results provide high fitting accuracy to the original wind speed data, the COE prices are better estimated utilizing the evaluation conducted by SSO. Therefore, in terms of the annual energy output of the four wind turbines, the range is between 4422.42 to 14875.74 MW in Aljouf, 3493.37 to 12660.65 MW in Rafha, 2284.23 to 9668.24 MW in Tabuk, 4453.38 MW to 15664 in Turaif, and 3351.75 to 13081.5 MW in Yanbo. The highest annual energy output at all Saudi sites was 15664 MW in Turaif with the WT5 machine model, while the lowest was 2284.23 MW in Tabuk using WT1. WT5 generates the maximum energy for all Saudi sites compared to all other wind turbine technologies, making this WTG the optimal one to be installed.
In addition, Table 7 presents the COE at each site using the six wind turbine models. This Table shows that the lowest cost of electricity was found to be $0.016906/kW in Turaif with WT5, and the highest price was obtained to be $0.11067/kW in Tabuk with the WT6 model. Furthermore, for the WT5, the COE was found not to exceed $0.02739/kW for all five considered sites.
The main goal of this study was to conduct a comparative analysis between conventional numerical (CN) methods and intelligent optimization algorithms (IOA) in evaluating the potential of wind energy in five Saudi cities located in the northern part, namely Aljouf, Rafha, Tabuk, Turaif, and Yanbo. The measured wind speed data at these sites are fitted using Weibull PDF to predict power density at these locations at different wind turbine hub heights. The two Weibull parameters, the shape (k) and scale (c), are estimated using five CN methods and five IOA. Moreover, the efficiency of these approaches is evaluated by the goodness of fit tests using the Root Mean Square Error (RMSE), Coefficient of Determination (R2), and Mean Absolute Error (MAE). By analyzing the techno-economic assessments, the main findings of this study are summarized as follows:
1. Results showed that IOAs are better at calculating the optimal combination of Weibull parameters and providing an adequate description of the frequencies of observed wind data. Method of Moment appeared to be the best CN method in determining k and c. PSO, GA, DE, and SSO have almost similar performance to approximate wind speed distribution for all considered Saudi sites.
2. Comparing the CN methods and IOA in carrying out the technical and economic assessments, results indicated that CN methods overestimated the energy output and hence underestimated the cost of energy ($/kWh) of the six wind turbine technologies investigated in this study. Therefore, since IOAs provide better fitting accuracy, the results based on SSO are considered to assess wind resources in Saudi Arabia.
3. Based on the electrical output of the WTG using IOA, the capacity factor range was computed to be between 8.77% and 56.52% in all locations.
4. Furthermore, Turaif was found to be the optimal location for harvesting wind energy, followed by Aljouf and Yanbo, respectively.
5. Based on the cost of energy analysis, the WT5 model exhibited the most suitable wind turbine technology to be implemented at all considered sites with an electricity cost of less than $0.02739/kW.
The economic risk associated with the generation of wind-based electricity is thoroughly examined in this study. The proposed framework in this study can be applied to any techno-economic analysis of green wind generation in developing nations. Moreover, it might support improved planning for wind energy projects by planners and policymakers. Weibull distribution is used in this study to characterize wind speed at five Saudi locations. Nevertheless, additional analyses that consider other probability distribution functions and various numerical and contemporary optimization techniques could be investigated. Finally, this study is carried out based on daily averaged wind speed due to data availability. However, a more detailed examination would be possible with a shorter temporal resolution, such as hourly wind speed data.
Acknowledgement: The author extends his appreciation to the Deputyship for Research & Innovation, Ministry of Education, Saudi Arabia for funding this research work through the Project Number (QU-IF-4–3-3-33891). The author also thank to Qassim University for technical support.
Funding Statement: The author extends his appreciation to the Deputyship for Research & Innovation, Ministry of Education, Saudi Arabia for funding this research work through the Project Number (QU-IF-4-3-3-33891). The author also thank to Qassim University for technical support.
Conflicts of Interest: The author declares that he has no conflicts of interest to report regarding the present study.
References
1. J. Feng and W. Z. Shen, “Wind farm power production in the changing wind: Robustness quantification and layout optimization,” Energy Conversion and Management, vol. 148, pp. 905–914, 2017. [Google Scholar]
2. E. M. Sandhu and T. Thakur, “Issues, challenges, causes, impacts and utilization of renewable energy sources-grid integration,” Journal of Engineering Research and Applications, vol. 4, no. 1, pp. 636–643, 2014. [Google Scholar]
3. A. Ucar and F. Balo, “Evaluation of wind energy potential and electricity generation at six locations in Turkey,” Applied Energy, vol. 86, pp. 1864–1872, 2009. [Google Scholar]
4. P. Wais, “A review of Weibull functions in wind sector,” Renewable and Sustainable Energy Reviews, vol. 70, pp. 1099–1107, 2017. [Google Scholar]
5. J. A. Carta, P. Ramírez and S. Velá Zquez, “A review of wind speed probability distributions used in wind energy analysis case studies in the Canary Islands,” Renewable and Sustainable Energy Reviews, vol. 13, pp. 933–955, 2009. [Google Scholar]
6. J. Wang, J. Hu and K. Ma, “Wind speed probability distribution estimation and wind energy assessment,” Renewable and Sustainable Energy Reviews, vol. 60, pp. 881–899, 2016. [Google Scholar]
7. V. Lo Brano, A. Orioli, G. Ciulla and S. Culotta, “Quality of wind speed fitting distributions for the urban area of Palermo, Italy,” Renewable Energy, vol. 36, pp. 1026–1039, 2011. [Google Scholar]
8. Q. Hu, Y. Wang, Z. Xie, P. Zhu and D. Yu, “On estimating uncertainty of wind energy with mixture of distributions,” Energy, vol. 112, pp. 935–962, 2016. [Google Scholar]
9. H. Jiang, J. Wang, J. Wu and W. Geng, “Comparison of numerical methods and metaheuristic optimization algorithms for estimating parameters for wind energy potential assessment in low wind regions,” Renewable and Sustainable Energy Reviews, vol. 69, pp. 1199–1217, 2017. [Google Scholar]
10. F. Gül Akgül, B. S. ßenog and T. Arslan, “An alternative distribution to Weibull for modeling the wind speed data: Inverse Weibull distribution,” Energy Conversion and Management, vol. 114, pp. 234–240, 2016. [Google Scholar]
11. T. B. M. J. Ouarda, C. Charron, J. Y. Shin, P. R. Marpu, A. H. Al-Mandoos et al., “Probability distributions of wind speed in the UAE,” Energy Conversion and Management, vol. 93, pp. 414–434, 2015. [Google Scholar]
12. J. Wu, J. Wang and D. Chi, “Wind energy potential assessment for the site of inner Mongolia in China,” Renewable and Sustainable Energy Reviews, vol. 21, pp. 215–228, 2013. [Google Scholar]
13. P. Ramírez and J. A. Carta, “Influence of the data sampling interval in the estimation of the parameters of the Weibull wind speed probability density distribution: A case study,” Energy Conversion and Management, vol. 46, pp. 2419–2438, 2005. [Google Scholar]
14. T. C. Carneiro, S. P. Melo, P. C. M. Carvalho, A. Plínio and S. Braga, “Particle swarm optimization method for estimation of Weibull parameters: A case study for the Brazilian northeast region,” Renewable Energy, vol. 86, pp. 751–759, 2016. [Google Scholar]
15. Z. Hussain Hulio, W. Jiang and S. Rehman, “Technical and economic assessment of wind power potential of nooriabad, Pakistan,” Energy, Sustainability and Society, vol. 7, pp. 7–35, 2017. [Google Scholar]
16. Y. Dong, J. Wang, H. Jiang and X. Shi, “Intelligent optimized wind resource assessment and wind turbines selection in huitengxile of inner Mongolia, China,” Applied Energy, vol. 109, pp. 239–253, 2013. [Google Scholar]
17. N. Aries, S. M. Boudia and H. Ounis, “Deep assessment of wind speed distribution models: A case study of four sites in Algeria,” Energy Conversion and Management, vol. 155, pp. 78–90, 2018. [Google Scholar]
18. A. Eltamaly and H. Farh, “Wind energy assessment for five locations in Saudi Arabia,” Journal of Renewable and Sustainable Energy, vol. 28, pp. 48–55, 2012. [Google Scholar]
19. J. -Y. Shin, J. -H. Heo, C. Jeong and T. Lee, “Meta-heuristic maximum likelihood parameter estimation of the mixture normal distribution for hydro-meteorological variables,” Stochastic Environmental Research and Risk Assessment, vol. 28, pp. 347–358, 2014. [Google Scholar]
20. A. Serban, L. S. Paraschiv and S. Paraschiv, “Assessment of wind energy potential based on Weibull and Rayleigh distribution models,” Energy Reports, vol. 6, pp. 250–267, 2020. [Google Scholar]
21. H. Bidaoui, I. El Abbassi, A. El Bouardi and A. Darcherif, “Wind speed data analysis using Weibull and Rayleigh distribution functions, case study: Five cities northern Morocco,” Procedia Manufacturing, vol. 32, pp. 786–793, 2019. [Google Scholar]
22. F. H. Mahmood, A. K. Resen and A. B. Khamees, “Wind characteristic analysis based on Weibull distribution of Al-Salman site, Iraq,” Energy Reports, vol. 6, pp. 79–87, 2020. [Google Scholar]
23. Z. H. Hulio, W. Jiang and S. Rehman, “Techno-economic assessment of wind power potential of Hawke’s Bay using Weibull parameter: A review,” Energy Strategy Reviews, vol. 26, pp. 100375, 2019. [Google Scholar]
24. L. Niyomtham, J. Waewsak, C. Kongruang, S. Chiwamongkhonkarn, C. Chancham et al., “Wind power generation and appropriate feed-in-tariff under limited wind resource in central Thailand,” Energy Reports, vol. 8, pp. 6220–6233, 2022. [Google Scholar]
25. O. A. Dabar, M. O. Awaleh, D. Kirk-Davidoff, J. Olauson, L. Söder et al., “Wind resource assessment and economic analysis for electricity generation in three locations of the Republic of Djibouti,” Energy, vol. 185, pp. 884–894, 2019. [Google Scholar]
26. M. Adnan, J. Ahmad, S. F. Ali and M. Imran, “A techno-economic analysis for power generation through wind energy: A case study of Pakistan,” Energy Reports, vol. 7, pp. 1424–1443, 2021. [Google Scholar]
27. M. A. A. Younis and A. Quteishat, “Selection of wind turbine systems for the Sultanate of Oman,” Computer Systems Science and Engineering, vol. 45, no. 1, pp. 343–359, 2023. [Google Scholar]
28. U.S. Energy Information Administration, Saudi Arabia-International-Analysis-U.S. Energy Information Administration (EIA), USA, 2021. [Online]. Available: https://www.eia.gov/beta/international/analysis.php?iso=SAU [Google Scholar]
29. S. Rehman, T. O. Halawani and M. Mohandes, “Wind power cost assessment at twenty locations in the Kingdom of Saudi Arabia,” Renewable Energy, vol. 28, no. 4, pp. 573–583, 2003. [Google Scholar]
30. J. Ansari, I. K. Madni and H. Bakhsh, “Saudi Arabian wind energy atlas,” KACST, Riyadh, Saudi Arabia, pp. 1–27, 1986. [Google Scholar]
31. S. Rehman and A. Z. Sahin, “Wind power utilization for water pumping using small wind turbines in Saudi Arabia: A techno-economical review,” Renewable and Sustainable Energy Reviews, vol. 16, pp. 4470–4478, 2012. [Google Scholar]
32. Department of Commerce, National Climatic Data Center, U.S. (NNDC), USA, 2022. [Online]. Available: https://www7.ncdc.noaa.gov/CDO/cdoselect.cmd?datasetabbv=GSOD [Google Scholar]
33. P. K. Chaurasiya, S. Ahmed and V. Warudkar, “Comparative analysis of Weibull parameters for wind data measured from met-mast and remote sensing techniques,” Renewable Energy, vol. 115, pp. 1153–1165, 2018. [Google Scholar]
34. K. M. Bataineh and D. Dalalah, “Assessment of wind energy potential for selected areas in Jordan,” Renewable Energy, vol. 59, pp. 75–81, 2013. [Google Scholar]
35. D. Indhumathy, C. V. Seshaiah and K. Sukkiramathi, “Estimation of Weibull parameters for wind speed calculation at Kanyakumari in India,” International Journal of Innovative Research in Science, Engineering and Technology, vol. 3, no. 1, pp. 8340–8345, 2014. [Google Scholar]
36. A. K. Azad, M. G. Rasul and T. Yusaf, “Statistical diagnosis of the best Weibull methods for wind power assessment for agricultural applications,” Energies, vol. 7, no. 5, pp. 3056–3085, 2014. [Google Scholar]
37. M. Celeska, K. Najdenkoski, V. Stoilkov, A. Buchkovska, Z. Kokolanski et al., “Estimation of Weibull parameters from wind measurement data by comparison of statistical methods,” in IEEE EUROCON 2015-Int. Conf. on Computer as a Tool (EUROCON), Salamanca, no. 1, pp. 1–6, 2015. [Google Scholar]
38. W. Werapun, Y. Tirawanichakul and J. Waewsak, “Comparative study of five methods to estimate Weibull parameters for wind speed on Phangan Island, Thailand,” Energy Procedia, vol. 79, pp. 976–981, 2015. [Google Scholar]
39. P. Bhattacharya, “Weibull distribution for estimating the parameters,” in Wind Energy Management, 1st ed., no. 1. Rijeka, Croatia: InTech, pp. 3–12, 2011. [Google Scholar]
40. S. Mohanty, “Estimation of parameters of some continuous distribution functions,” M.S. Thesis, Department of Mathematics, National Institute of Technology, Rourkela, India, 2012. [Google Scholar]
41. A. Allouhi, O. Zamzoum, M. R. Islam, R. Saidur, T. Kousksou et al., “Evaluation of wind energy potential in Morocco’s coastal regions,” Renewable and Sustainable Energy Reviews, vol. 72, pp. 311–324, 2017. [Google Scholar]
42. M. Alrashidi, M. Pipattanasomporn and S. Rahman, “Metaheuristic optimization algorithms to estimate statistical distribution parameters for characterizing wind speeds,” Renewable Energy, vol. 149, pp. 664–681, 2020. [Google Scholar]
43. C. Renno, F. Petito and A. Gatto, “Artificial neural network models for predicting the solar radiation as input of a concentrating photovoltaic system,” Energy Conversion and Management, vol. 106, pp. 999–1012, 2015. [Google Scholar]
44. C. G. Justus, W. R. Hargraves, A. Mikhail and D. Graber, “Methods for estimating wind speed frequency distributions,” Journal of Applied Meteorology, vol. 17, no. 3, pp. 350–353, 1978. [Google Scholar]
45. O. S. Ohunakin, O. M. Oyewola and M. S. Adaramola, “Economic analysis of wind energy conversion systems using levelized cost of electricity and present value cost methods in Nigeria,” International Journal of Energy and Environmental Engineering, vol. 4, no. 1, pp. 1–8, 2013. [Google Scholar]
46. M. Gökçek and M. Serdar Genç, “Evaluation of electricity generation and energy cost of wind energy conversion systems (WECSs) in Central Turkey,” Applied Energy, vol. 86, pp. 2731–2739, 2009. [Google Scholar]
Cite This Article
 Copyright © 2023 The Author(s). Published by Tech Science Press.
This work is licensed under a Creative Commons Attribution 4.0 International License , which permits unrestricted use, distribution, and reproduction in any medium, provided the original work is properly cited.
 Downloads
 Citation Tools