
 Submit a Paper
 Propose a Special lssue
 Open Access
ARTICLE

A Real-Time Pedestrian Social Distancing Risk Alert System for COVID-19
1 College of Computer Science and Technology, Harbin Engineering University, Harbin, 150001, China
2 Department of Clinical Laboratory, Harbin Medical University Cancer Hospital, Harbin, Heilongjiang, 150081, China
3 Faculty of Arts, Design and Architecture, School of Built Environment, The University of New South Wales, Sydney, NSW 2052, Australia
* Corresponding Author: Wei Li. Email:
Computer Systems Science and Engineering 2023, 47(1), 937-954. https://doi.org/10.32604/csse.2023.039417
Received 28 January 2023; Accepted 11 April 2023; Issue published 26 May 2023
 View Full Text
 Download PDF
Abstract
The COVID-19 virus is usually spread by small droplets when talking, coughing and sneezing, so maintaining physical distance between people is necessary to slow the spread of the virus. The World Health Organization (WHO) recommends maintaining a social distance of at least six feet. In this paper, we developed a real-time pedestrian social distance risk alert system for COVID-19, which monitors the distance between people in real-time via video streaming and provides risk alerts to the person in charge, thus avoiding the problem of too close social distance between pedestrians in public places. We design a lightweight convolutional neural network architecture to detect the distance between people more accurately. In addition, due to the limitation of camera placement, the previous algorithm based on flat view is not applicable to the social distance calculation for cameras, so we designed and developed a perspective conversion module to reduce the image in the video to a bird's eye view, which can avoid the error caused by the elevation view and thus provide accurate risk indication to the user. We selected images containing only person labels in the COCO2017 dataset to train our network model. The experimental results show that our network model achieves 82.3% detection accuracy and performs significantly better than other mainstream network architectures in the three metrics of Recall, Precision and mAP, proving the effectiveness of our system and the efficiency of our technology.Keywords
Novel coronavirus (COVID-19) is an acute respiratory infection that has spread widely in many countries around the world since December 12, 2019 [1]. To this end, the World Health Organization has issued a number of guidelines in the form of preventive measures, where social distancing is an effective and practical way to minimize the chance of transmission and reduce further harm [2], the purpose of which is to keep people isolated from each other and prevent most Transmission of respiratory infectious diseases. Based on the fact that droplets formed when speaking cannot spread beyond 1 meter, the World Health Organization says social distancing should be maintained at “at least 1 meter”; in contrast, some countries such as South Korea, the United States, Canada and the United Kingdom recommend social distancing with a distance limit of around 2 meters.
Manual on-the-spot judgment of distance is difficult to achieve due to the difficulty and high cost. In this case, in order to implement social distance rules in public places conveniently and efficiently, it is important to develop new technologies that can fully utilize the social distance risks of existing surveillance camera systems [3]. In recent years, computer vision, machine learning, and deep learning have achieved promising results and demonstrated significant advantages in many daily life problems, such as image recognition [4–6], high-precision positioning [7–8] or time-series forecasting [9–11], which also enable object recognition applications in pedestrian social distance detection. Therefore, a target recognition model can be designed by using the classic convolutional neural network (CNN) in deep learning, social distance detection and calculation for surveillance video, and corresponding risk reminders to the person in charge, so that they can take necessary action.
In order to save resources and costs, it is necessary to continuously optimize the deep learning model based on the traditional target recognition algorithm. The research purpose of this paper is to design a neural network model that introduces an attention mechanism, and design and develop a social distance risk degree judgment system based on top view, which can effectively improve the accuracy of target recognition, effectively reduce the hardware cost of the system, and effectively expand the application scenarios of the system. This is of great significance to support the epidemic prevention work of the health system and is beneficial to the life, health and safety of people.
The rest of the paper is organized as follows. A brief overview of the related work is given in Section 2. Section 3 presents our proposed approach. Section 4 presents our experimental results and discussion, and Section 5 finally concludes the paper.
There is a lot of research available for COVID-19 [12–16]. For the task of pedestrian social distance detection, it is first necessary to realize pedestrian target recognition, in order to accurately obtain pedestrian coordinates, and then calculate the social distance in the follow-up. Therefore, the research on pedestrian social distance detection is always accompanied by the development of general object detection algorithms. Object detection is a computer vision task that allows computers to determine the location and classification of objects. With the development of hardware devices and artificial intelligence deep learning, target detection algorithms are also being updated and iterated. Marked in 2014, its development can be divided into two stages, the first stage is represented by the traditional sliding window-based target detection algorithm, the second stage is represented by the deep learning-based target detection algorithm, and the latter is compared with the former, it is a great improvement.
2.1 Traditional Pedestrian Recognition Methods
Pedestrian target recognition has always been an important branch of target recognition tasks. In the early days, it received wide attention due to application scenarios such as road traffic safety. According to the development history of target detection algorithms, before deep learning was applied to target detection, pedestrian detection technology also relied on traditional methods to classify by manually extracting features and inputting them into classifiers. A pedestrian detection model based on Histogram of Oriented Gradients (HOG) features was proposed in 2005 by Dalal et al. [17]. The model is based on the combination of gradient histogram and linear support vector machine, which is a landmark achievement in pedestrian detection. However, the image information that can be extracted by this traditional method is limited to shallow layers, and the extraction effect of higher-level semantic information is not ideal. At the same time, due to a large amount of computation, the HOG-based model has the common defect of slow detection speed of traditional detection methods, which cannot meet the needs of real-time detection. Since the gradient histogram feature only focuses on the edge and shape information of the target, Dollar proposes an integral channel feature (ICF), which applies a total of ten channels to extract ten features, including three LUV color channels, one gradient amplitude channel and six The HOG of the direction is better for the feature extraction of the input pedestrian image. The representative target detection algorithm in the traditional method is the Viola-Jones algorithm [18]. The sliding window is to traverse all the windows to be observed and repeats the observation, feature extraction, and judgment. The algorithm is divided into three steps. While using the sliding window, Haar feature extraction and AdaBoost classifier learning methods are used, and a cascade structure is designed to complete the classification and realize the function of face detection. Based on Jones’s face detection algorithm design ideas, some scholars cascade the AdaBoost classifier into the pedestrian detection model to improve the detection speed of pedestrian recognition. The detection speed of the traditional method performs well on the central processing unit and can achieve relatively good performance in a controllable environment, but it cannot meet the application requirements when the data scale increases significantly, and the performance growth space is limited.
2.2 Pedestrian Recognition Method Based on Deep Learning
In terms of detection performance, detection methods based on deep learning have irreversible advantages, which benefit from the continuous improvement of computer computing power and the excellent deep learning model architecture [19–21]. After the successful application of deep learning in computer vision classification tasks, the pedestrian detection model has also been innovated in various aspects. A target detection algorithm for regional CNNs with depth features, namely RCNN, was proposed in 2014 by Girshick et al. [22]. As a two-stage target detection algorithm, the first step of its work is the generation of candidate frames, and the second step is recognizing target objects using convolutional networks. It uses the Caff network to achieve feature extraction and generates feature vectors. Finally, it uses the SVM classifier to classify the targets in the region and uses the non-maximum suppression NMS to remove the redundant regions. The algorithm has a good performance in the ImageNet classification challenge, and the accuracy on the VOC2007 dataset is greatly improved compared to the traditional detection algorithm, but its computational efficiency is low. On the basis of RCNN, scholars further proposed a series of improved algorithms, including Fast RCNN [23] and Faster RCNN [24], the former uses a selective search method to optimize the way of selecting and extracting candidate frames, the latter uses feature extraction by the regional network has obvious effect in reducing network computation and improving the rate of target detection. In pedestrian detection, the appearance difference caused by the size of the target often affects the detection effect. In response to this problem, SA-Fast RCNN was proposed by Li et al. [25]. The design of this model is based on Fast RCNN. Two sub-networks are designed for processing. A pedestrian detection model called HyperLearner was proposed in 2017 by Mao et al. [26], which is based on Faster-RCNN, introduces a channel feature network and splices with the features extracted by the original model backbone network, and strengthens it by introducing additional features Discrimination of pedestrians from the background, this method improves the accuracy of recognition in complex backgrounds or crowded people. In 2015, Joseph proposed YOLO (You Only Look Once) [27], in each test, the neural network omits the candidate frame and directly predicts the target location and category from the entire image. Since the entire detection process can be optimized end-to-end for performance, the structure of the input will be analyzed quickly. YOLO has achieved a high degree of speed improvement in the balance of accuracy and speed. Based on YOLOv1, the author has proposed more versions of improvements, including YOLO9000 [28], YOLOv2 [29], and YOLOv3 [30] with a feature extraction pyramid structure and loss function. The YOLOv3 algorithm was proposed in 2018. The trained YOLOv3 can be three times faster than the target recognition algorithm in the same period. Its excellent performance makes it used in many scenarios to solve practical problems, including pedestrian recognition and social distancing control. In 2020, Punn et al. [31] proposed a framework where they trained a YOLOv3 model using a frontal view dataset, Open Image Dataset (OID), to recognize pedestrians and tracked them using the Deepsort method with bounding boxes and assigned id information the person being tested. Since the epidemic, researchers have used computer vision technology to realize pedestrian recognition and provide solutions for the measurement of social distance. Ramadass developed a YOLOv3-based drone social distancing monitoring model in 2020 [32], and they used a custom dataset composed of pedestrian frontal and side images to train the model to achieve pedestrian localization and detection distance. This work has since been expanded to the monitoring of mask-wearing, also using drone cameras to monitor whether pedestrians are wearing masks in public places from the side or front. In 2020, AlexAB proposed YOLOv4 [33], tried a new backbone network combination method, and integrated a variety of data enhancement methods in the field of computer vision. Compared with YOLOv3, the network has a considerable improvement in accuracy, so it was used immediately after it was proposed. Pedestrian location and distance detection. Also in 2020, the v5 version of the YOLO algorithm was proposed by Glenn Jocher, which inherited and innovated the previous version of the YOLO algorithm and released four sizes of network structures to meet different hardware devices, in terms of performance and overhead.
In summary, more versions of current target detection algorithms have been developed with increasing speed and accuracy, but the adequacy of the computing power of the infrastructure needs to be taken into account in practical applications. We can therefore consider the introduction of an attention mechanism to the model, trained for pedestrian recognition, in order to pursue higher accuracy with the same overhead.
Meanwhile, researchers have currently done a lot of work on pedestrian recognition and social distance detection in public environments, but most of this work has focused on observations targeting the front or the side. We therefore propose a bird's-eye view-based detection framework that provides better observation angles and computational ideas to address the judgement errors arising from the distance and proximity of the target to the camera, and will play a key role in computing the distance between people using street view cameras.
We propose a novel convolutional neural network architecture for improving the accuracy of pedestrian detection. In addition, we propose a view transformation method in order to solve the distortion problem caused by perspective in video. The architectural design is shown in Fig. 1.
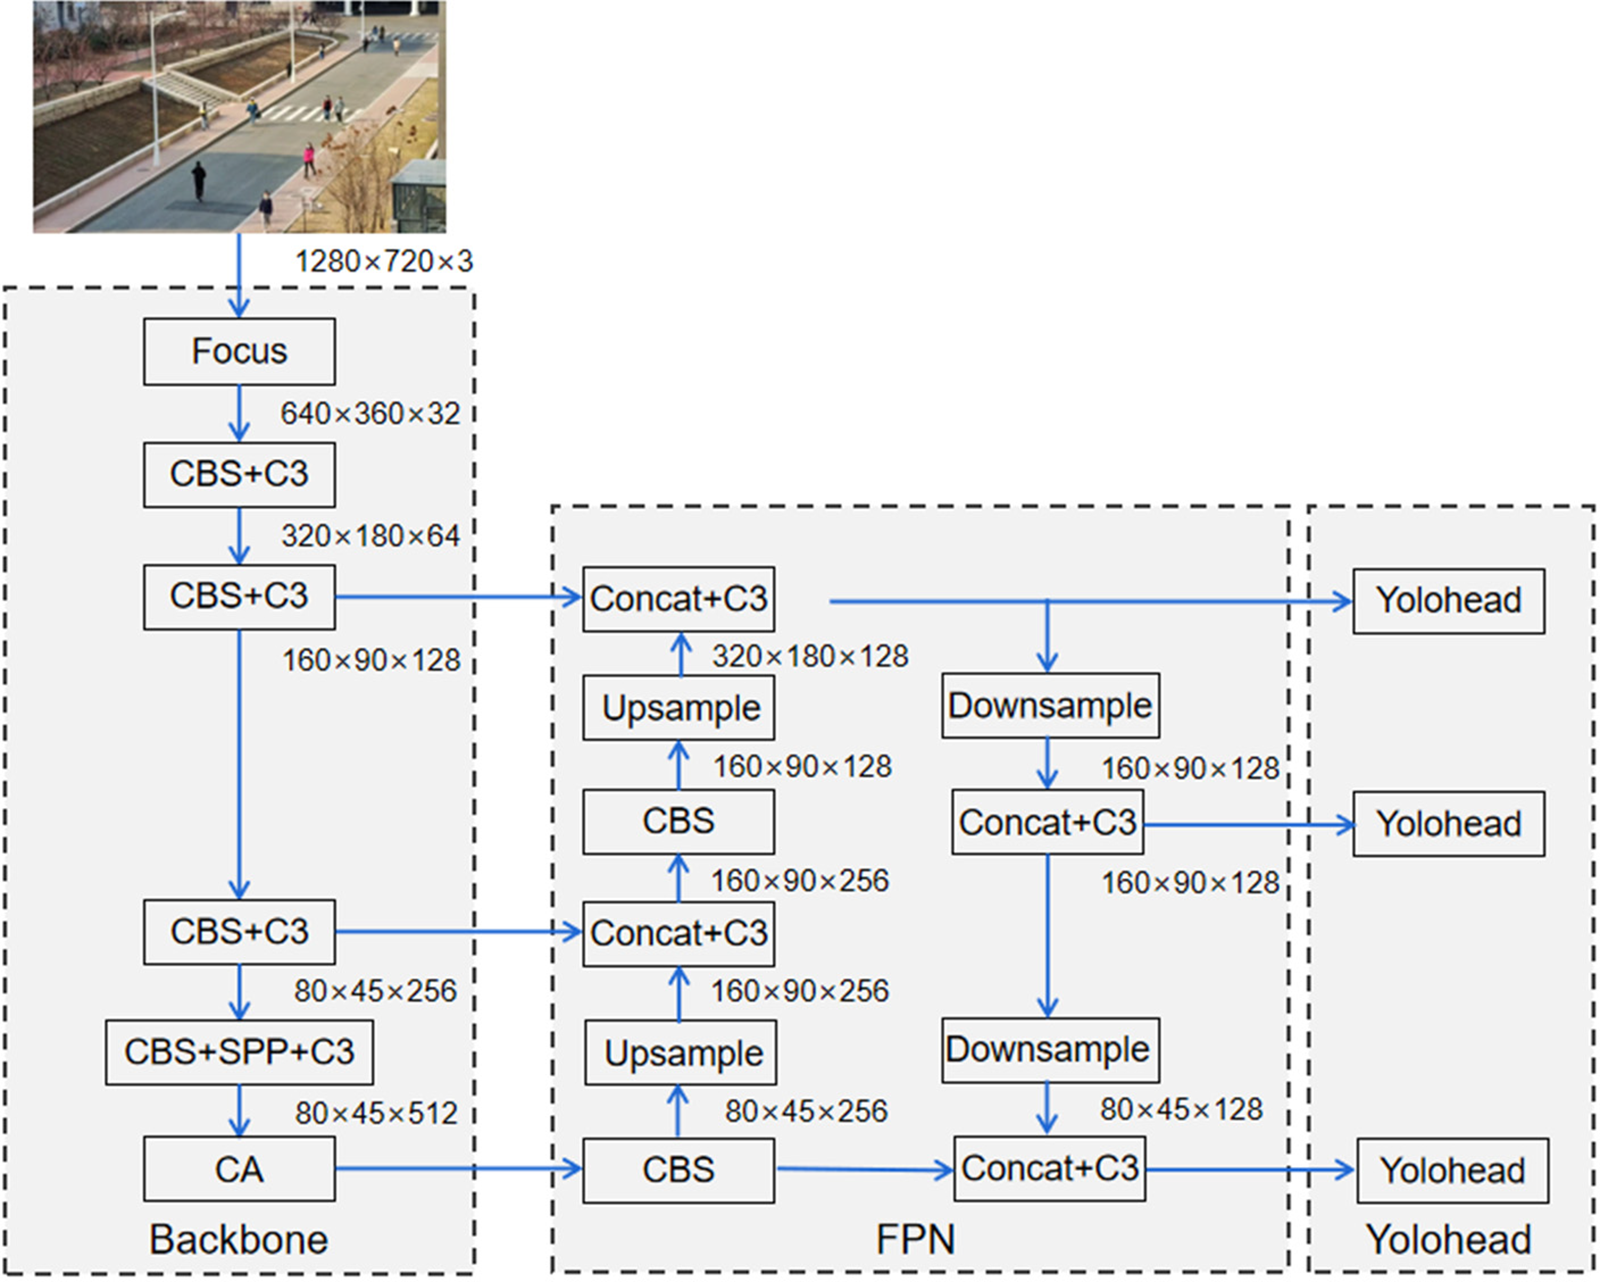
Figure 1: Architecture of the proposed network
Our proposed network structure can be divided into three main parts, including Backbone, FPN, and YOLO Head. Through experiments, we found that our network mainly benefits from the CA module in the Backbone part. Therefore, the rest of this section will focus on the Backbone module.
3.1 Backbone Structure for the Extraction of Features
We use the Backbone module as the backbone feature extraction structure of the entire network. It can obtain three effective feature layers of different sizes for the input image by specific step operation.
The Focus structure cuts the image into chunks before stitching it after inputting an image. First, a value is obtained for every pixel and four feature layers are generated, after which the four feature layers are stacked to reduce the size of the input width and height, thus concentrating on the channel information. The number of input channels of the stitched feature layers is quadrupled from three channels to twelve channels, and this operation reduces the size while maximizing the preservation of the input information, which is beneficial to the subsequent improvement of the computational power of the network structure. The flow of the Focus module for processing images is shown in Fig. 2.
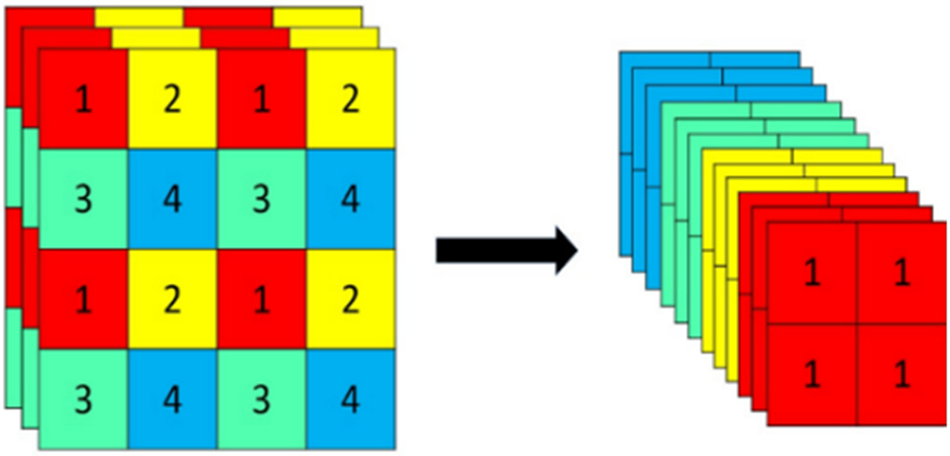
Figure 2: Processing of the focus module
After processing the images using the Focus module, the backbone part then uses the CBS module for feature extraction. The CBS module is a convolutional layer consisting of three structures, Conv2d, BatchNorm and activation function SiLU. The backbone part continuously performs feature extraction by multiple convolution, normalization and activation functions.
The C3 structure is also known as Bottleneck CSP structure and the specific practice of Bottleneck branching is to use two standard convolutional modules, first reduce the number of channels to half of the original one by
3.1.4 Spatial Pyramid Pooling Module
The Spatial Pyramid Pooling (SPP) module converts feature maps of arbitrary size into feature vectors of fixed size. SPP uses pooling kernels of different sizes when performing maximum pooling for feature extraction, thus increasing the perceptual field of the network and ultimately does not change the size of the input feature layer.
3.1.5 Coordinate Attention Module
After feature extraction in the backbone network, compared with the low-level feature layer, the feature map at this time is clearer in terms of low-level contour information and coordinate information, and also contains a large amount of high-level semantic information. We choose to place the Coordinate Attention (CA) module at the end of the backbone network, that is, at the end of feature extraction, in order to perform feature reinforcement on the feature maps with more complete information, which can improve the performance of the feature maps while ensuring the information integrity.
First, for the input feature layer, pooling is averaged for the horizontal and vertical directions using pooling kernels of dimensions
where
Similarly, the output of the
where
After two independent one-dimensional vectors are obtained, they are stitched in the spatial dimension and the channels are compressed by a
where
Then
where
Finally, the output equation of the CA attention module is as follows:
where
3.2 FPN Module for Enhanced Feature Extraction
After the backbone features are extracted, an FPN module with a pyramidal structure needs to be passed in for enhanced feature extraction. Intuitively, multi-scale features may provide different levels of semantics and improve the generalization capability of learned representation, for example, in a bird’s-eye view, the high-level semantics often represent the relative position between the pedestrian contours, but the low-level semantics represent the subtle differences between pedestrians, such as the relative relationship between anchor points, such as feet [30]. Consider a practical bird's eye view, in Fig. 3a the distance of the pedestrian's box relative to each other is often sensed by the high-level semantics and the detailed relationships between different goals sensed by the low-level semantics are as shown in Fig. 3b. Therefore, the main purpose of this part uses the multi-scale features for feature fusion, which is divided into two routes, bottom-up and top-down. Firstly, three different size feature layers are fused by up-sampling, feature layer stacking, and convolution operations, followed by down-sampling with the same principle. This method can effectively combine feature maps with high resolution and high semantic information with feature maps with high resolution and high geometric information. The final output is the three enhanced effective feature layers.
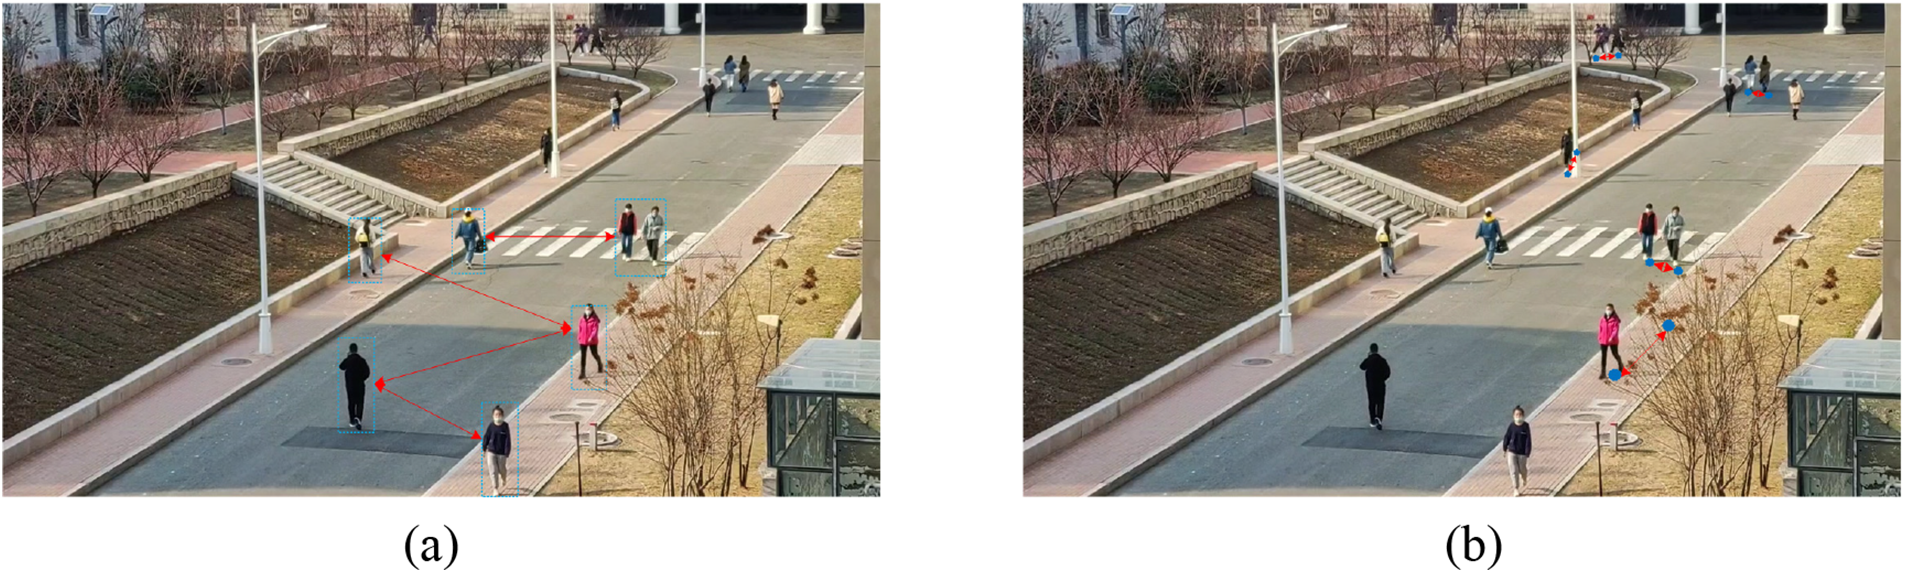
Figure 3: High-level semantics and low-level semantics in bird's-eye view @HEU campus
3.3 YOLO Head Module for Classification Prediction
The feature layers output by the enhanced feature extraction structure is passed to the YOLO Head section, whose main function is to classify and predict the feature layers. The Head section accounts for a relatively small amount of the network, but it is crucial for the final target classification and localization, and its prediction result feature maps are used for subsequent decoding to obtain the target prediction frames and confidence levels. The whole decoding process is shown in Fig. 4.
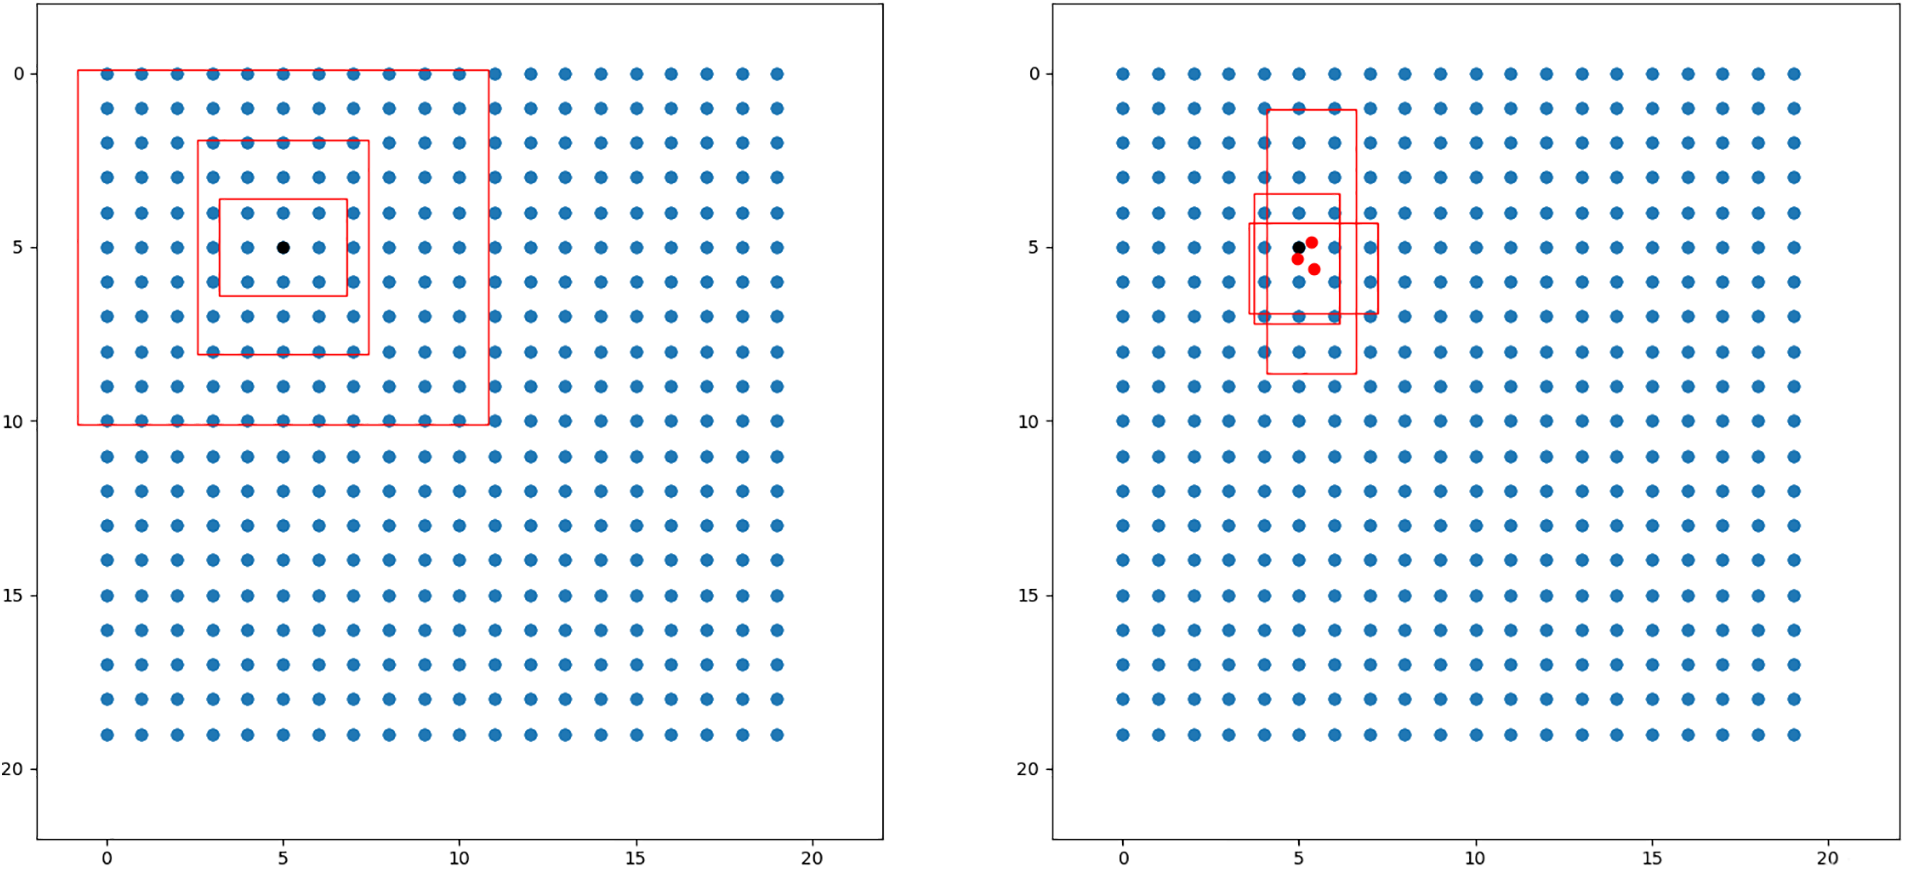
Figure 4: The process of decoding using feature maps
The feature map can be regarded as a collection of a certain number of feature points, and for the three feature maps output by the model in this paper, their dimensions are
The final parameter 255 of each feature layer can be split into 385, corresponding to 85 parameters of 3 a priori frames, and 85 can be further split into 4, 1, and 80, with 4 representing the regression parameters of each prediction point, and the prediction frame that is obtained from the adjusted regression parameters; 1 represents the judgment whether the feature point contains a target; 80 parameters corresponding to the COCO data set can identify 80 different kinds of targets, i.e., for judging Each feature point contains the type of object. Using the neural network prediction results to adjust the a priori frame, firstly, adjust the center of the a priori frame, offset from the center of the a priori frame to the lower right corner, and then adjust the width and height of the a priori frame, and finally normalize the output result to decimal form to obtain the prediction frame.
3.4 Bird’s-Eye View Conversion Method
Because of limitations in camera setup locations, perspective in the resulting video will cause distortion, with a larger pedestrian detection frame near the lens and a smaller pedestrian recognition frame at a distance. Due to the distortion caused by perspective, the distance between people cannot be calculated directly by measuring pixels. To solve this problem, we propose to use perspective transformation to convert the tilted view into a bird’s eye view to achieve the effect that the camera lens is parallel to the ground.
We convert the image into a bird's eye view by calculating the transformation matrix and using it to process the image, or we can process any coordinates in the image and calculate the transformed coordinates. The perspective transformation formula is as follows:
where
The process of bird’s-eye view conversion is shown in Fig. 5.
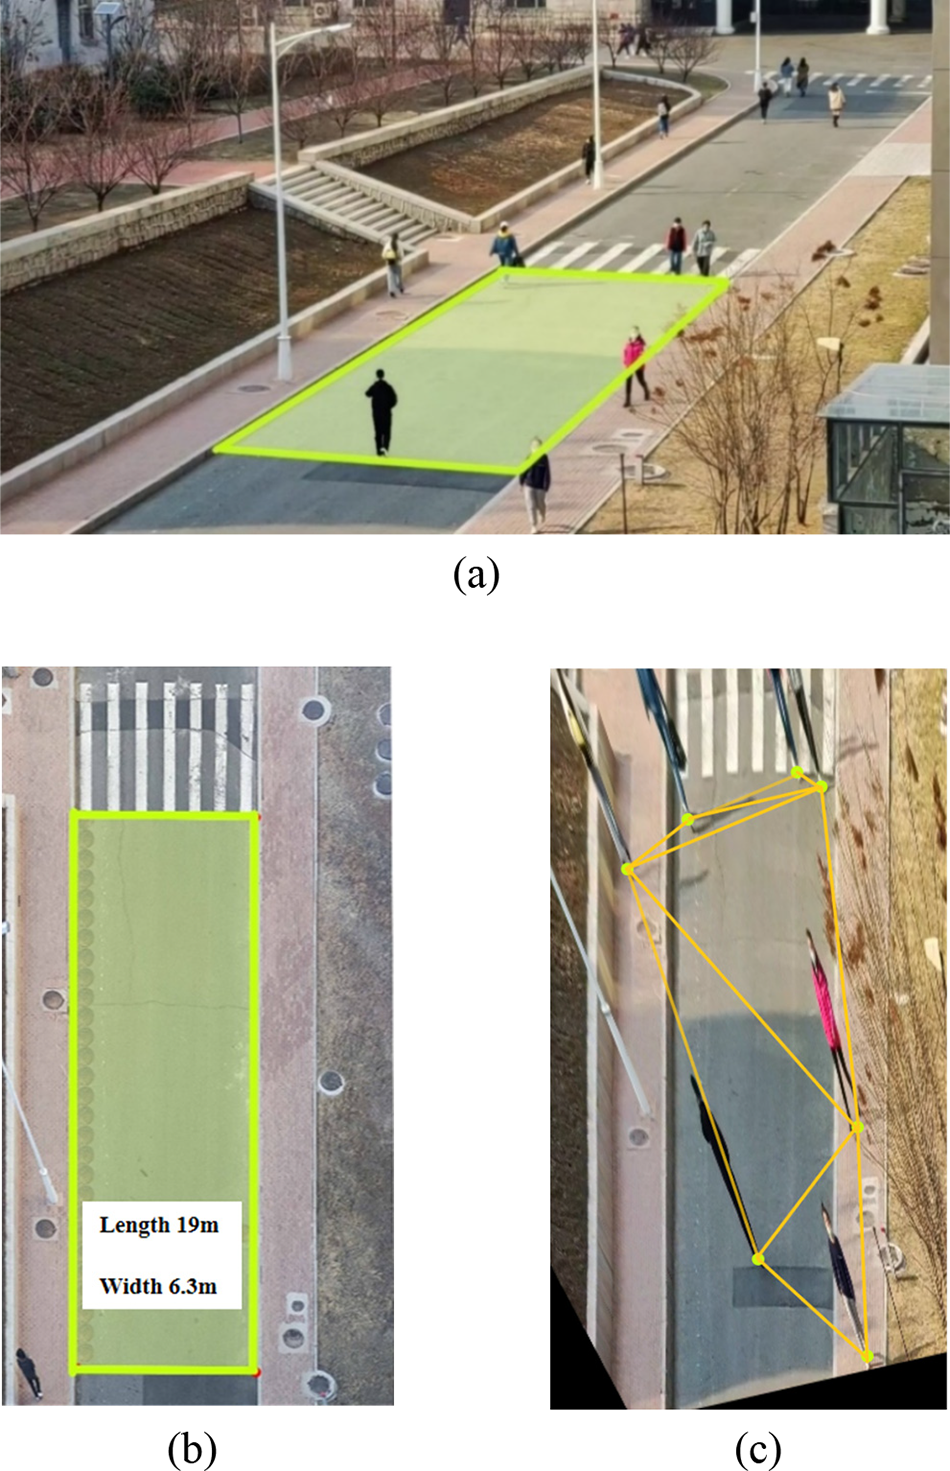
Figure 5: Process bird's-eye view conversion @HEU campus. (a) Is the process of selecting a rectangular range, (b) Is the process of determining the actual ratio and (c) Is the result of perspective transformation
First, we place the shooting equipment at the right height and take field photos of the target area. After that, we calculate the length, width and aspect ratio of the specified rectangular area by field measurement. At this point, the original vertex coordinates as input and the transformed vertex coordinates can be determined, and the transformation matrix
After converting the view to a bird’s eye view, the social distance between pedestrians needs to be calculated. First, we record the locations of all pedestrians derived by the target detection algorithm using the list data type. As the pedestrians are in contact with the plane they are walking on, it thus appears that the point where a person's foot hits the ground can define its position after the bird’s eye view transformation, so the coordinates of the midpoint of the bottom edge of the detection frame need to be calculated. The transformed coordinates in the bird's eye view are then calculated using the method described above, at which point the equation for the pixel distance between every two pedestrians is as follows:
According to the description in the introduction, the safe social distance between rows is 2 m or more, while between 1 and 2 m is low risk, and a distance of less than 1 m is too close socially and is judged to be high risk. After calculating the social distance between the pedestrians, it is compared with the set threshold and the target is marked prominently. The green coordinate points in the center of the detection frame for two pedestrians with a distance less than the safe social distance are covered in red or yellow and connected with line segments of the corresponding color, and a risk alert label is printed on the detection frame with different numbers of exclamation marks, while the actual distance calculated is printed next to the connected line segments. For pedestrians whose distance is greater than the threshold value the blue target detection box is used uniformly and without special treatment, the display is shown in Fig. 6.
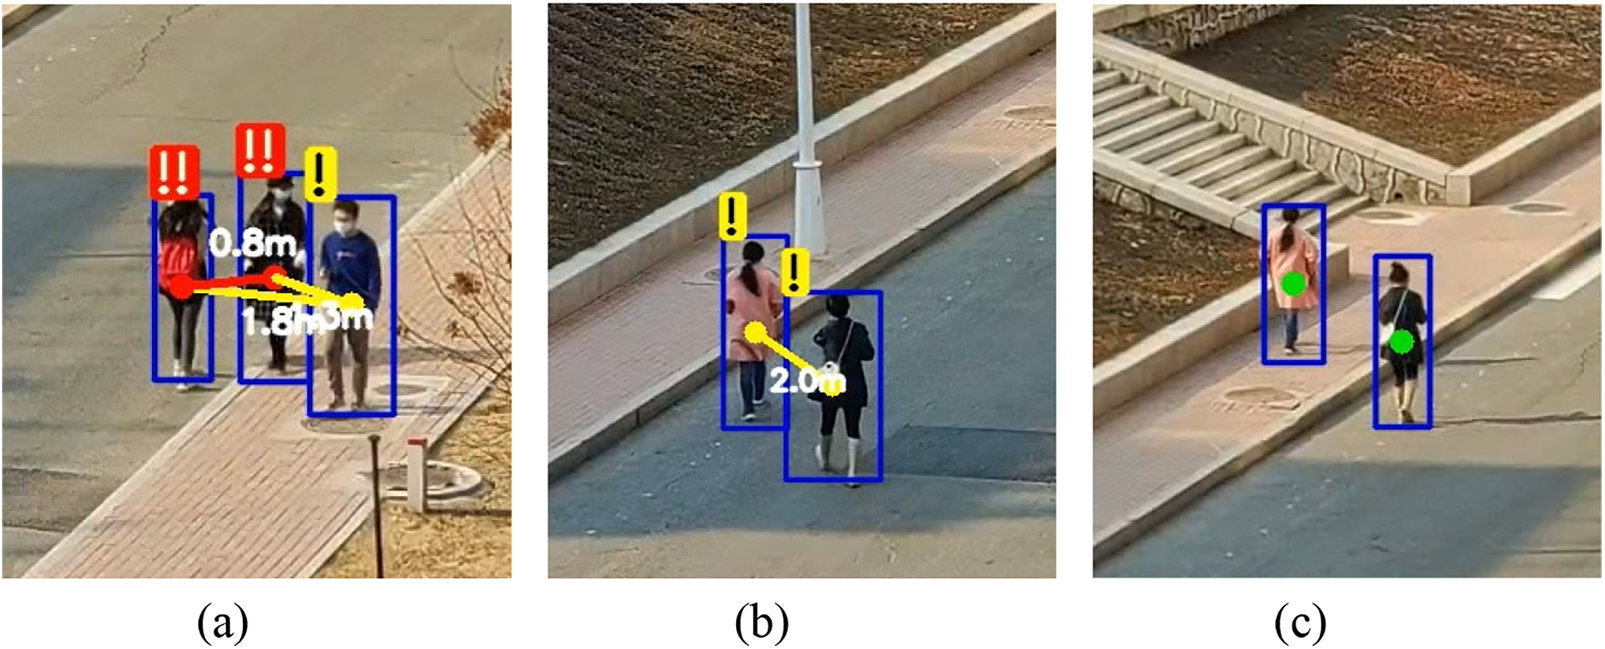
Figure 6: Display of detection and reminder effects. (a) Is a display of high-risk versus low-risk effect. (b) Is the display of low-risk effect. (c) Is the display of the no-risk effect
4 Experimental Results and Discussion
In our experiments, we used a server equipped with an AMD EPYC 7302 CPU and a GeForce RTX 3090 GPU for training.
We used Microsoft Common Objects in Context (MS COCO), which is commonly used in the field of deep learning target detection, as the dataset for our experiments. The COCO dataset has more than 330,000 images and contains 80 target categories, with categories covering pedestrians, cars, roadblocks, etc. There are 250,000 pedestrians with key point annotations. We adopted a random selection method to expand the number of images to 5,000 based on 128 images. Meanwhile, in order to improve the training efficiency, we selected 2,583 images containing only person labels and the corresponding annotation files from the COCO2017 dataset as the dataset for training our proposed target detection model, of which 80% is used as the training set and 20% as the validation set.
We used a migration learning approach with a pre-trained model using yolov5s.pt. We trained the network for 200 epochs with a batch size of 16, an initial learning rate of 0.01 and a warmup epoch of 3. The resolution size of the input sample is
In this section, we use three metrics to evaluate our proposed network structure, including recall (R), precision (P) and mean average precision (mAP).
The combination of the permutation of the sample values and the predicted results can be obtained in four different cases. True Positive (TP), where the sample is a positive case and the model predicts a positive case, and True Negative (TN), where the sample's true category is a negative case and the model predicts a negative case. The cases of incorrect prediction are False Positive (FP), where the true category of the sample is negative, but it is wrongly predicted to be positive, and False Negative (FN), where the true category is positive, but it is wrongly predicted to be negative.
In the target classification problem, there is often an error between the prediction frame and the actual labeled frame manually labeled in the training set, and the ratio of the area of the intersection of the prediction frame and the real frame to the merged area is defined as Intersection over Union (IoU).
IoU is used to determine which of the above four cases the result belongs to. When the IoU corresponding to a prediction box is greater than the set threshold, the box can be judged as TP, and the rest of the prediction boxes that do not match the real boxes are FP.
Recall is defined as the percentage of all sample positive cases that are correctly detected as positive cases. The corresponding mathematical formula is as follows:
where
Accuracy is defined as the percentage of all examples classified as positive that is actually positive. The corresponding mathematical formula is as follows:
where
Recall and precision are two relatively contradictory measures, the higher the one is, the lower the other is, and only a single one of these criteria cannot be used to judge the performance of the algorithm completely accurately. For example, if many positive cases are missed, even if all positive cases are detected as correct, the algorithm has high precision, but the detection effect is still not satisfactory.
Therefore, by combining the two metrics and graphing them with Recall and Precision as the axes, generally with Recall as the horizontal coordinate and Precision as the vertical coordinate, we can obtain the P-R curve, which represents the relationship between the two. The area enclosed under the P-R curve is the AP, and the average of the APs of all classes is the mAP. mAP is the AP value of the person class because the dataset we selected for training is only labeled with pedestrians. Usually, in target detection algorithms, the larger the area enclosed by the curve, the better the performance of the algorithm can be judged.
The number marked after mAP indicates the threshold value of IoU for determining positive and negative samples. 0.5 indicates the average mAP for threshold values greater than 0.5, while 0.5:0.95 indicates the average value of mAP for IoU thresholds from 0.5 to 0.95 in steps of 0.05.
Convergence is an important metric to measure the stability and reliability of deep learning neural networks, so it is important to test the convergence and generalization of neural network models.
To verify the stability and reliability of our model, we compared it with YOLOv3 and YOLOv3-tinty. As shown in Fig. 7, where the horizontal coordinates are the epochs values and the vertical coordinates are the loss values, the black, blue and red lines indicate the degree of convergence of our model, the YOLOv3 model and the YOLOv3-tiny model respectively. It can be seen that the loss value of our model decreases rapidly until about the 20th epoch, and then level off gradually. The YOLOv3 model's loss leveled off at 50 epochs, while the YOLOv3-tiny model's loss leveled off at about 60 epochs, with fluctuations between 25 and 50 epochs possibly due to suboptimal settings of the learning rate. So compared to the other two models, it is clear that our model is superior in terms of smoothness and reliability.
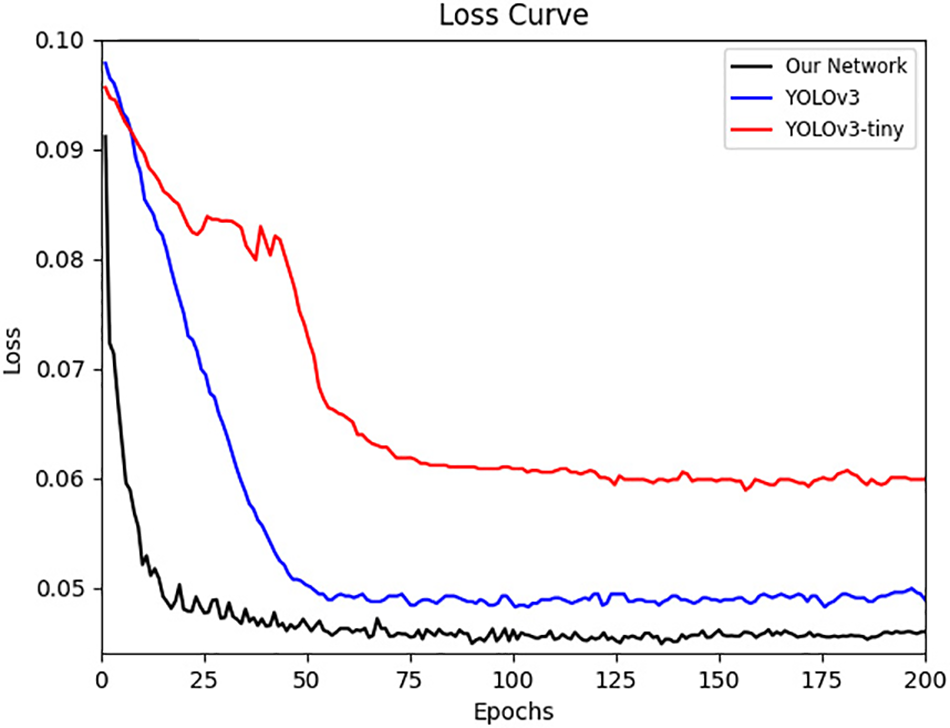
Figure 7: Convergence behavior of our network with YOLOv3 and YOLOv3-tiny. The black line indicates the convergence behavior of our network, the blue line indicates the convergence behavior of YOLOv3, and the red line indicates the convergence behavior of YOLOv3-tiny
Through the above tests, it can be observed that the convergence of our model can be proved.
We conducted an ablation study to validate the performance of our proposed neural network. First, we used the full version of our proposed neural network as the control group and the neural network without the attention mechanism module as the experimental group1. We both train and test them on our selected COCO dataset. As shown in Table 1, In terms of recall rate, experimental group 1 reached 57.8%, while the control group reached 59.9%. In terms of accuracy, experimental group 1 reached 79.5%, while the control group reached 81.7%. In terms of mAP@0.5, experimental group 1 reached 65.2%, while the control group reached 67.4%. In terms of mAP@0.5:0.95, experimental group 1 reached 38.9%, while the control group reached 38.3%.
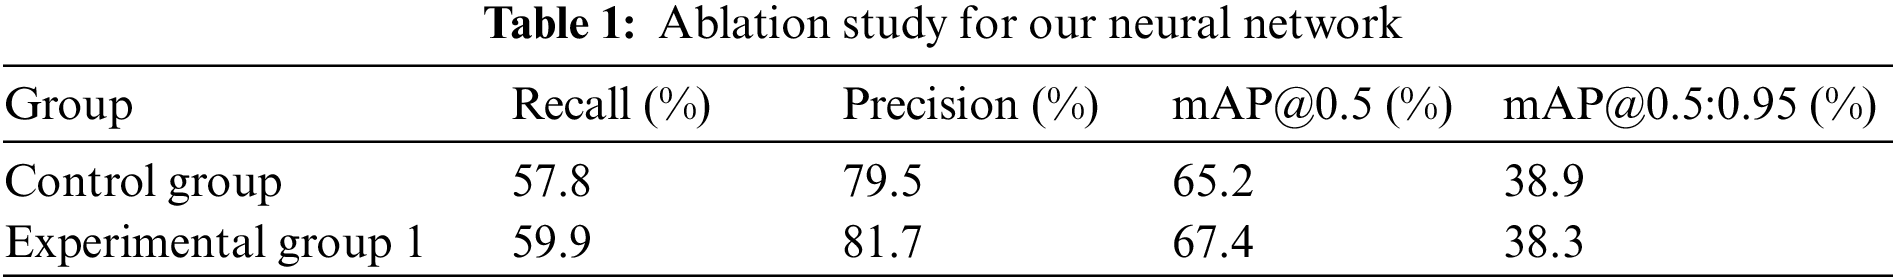
In conclusion, the convolutional neural network we designed performs well in all four metrics, so it can be verified that adding Coordinate Attention can improve the network performance.
The quantitative evaluation mainly used the YOLOv5s model for comparison with our model. YOLOv5s is a better single-stage network at this stage, which meets the requirements of real-time image detection in terms of detection accuracy and detection rate.
Meanwhile, the single-stage target detection models YOLOv3 and YOLOv3-tiny are selected for training. The major difference between YOLOv3 and our model is that the backbone network structure is Darknet53 and lacks structures such as SPP.
In addition, we chose the two-stage target detection network Faster-RCNN for training and comparison, which is large in size and therefore has a slower detection speed but excellent detection results. We choose to use two different backbone network structures, VGG16 and ResNet50, for training separately and then compare the two results with the training results of our model.
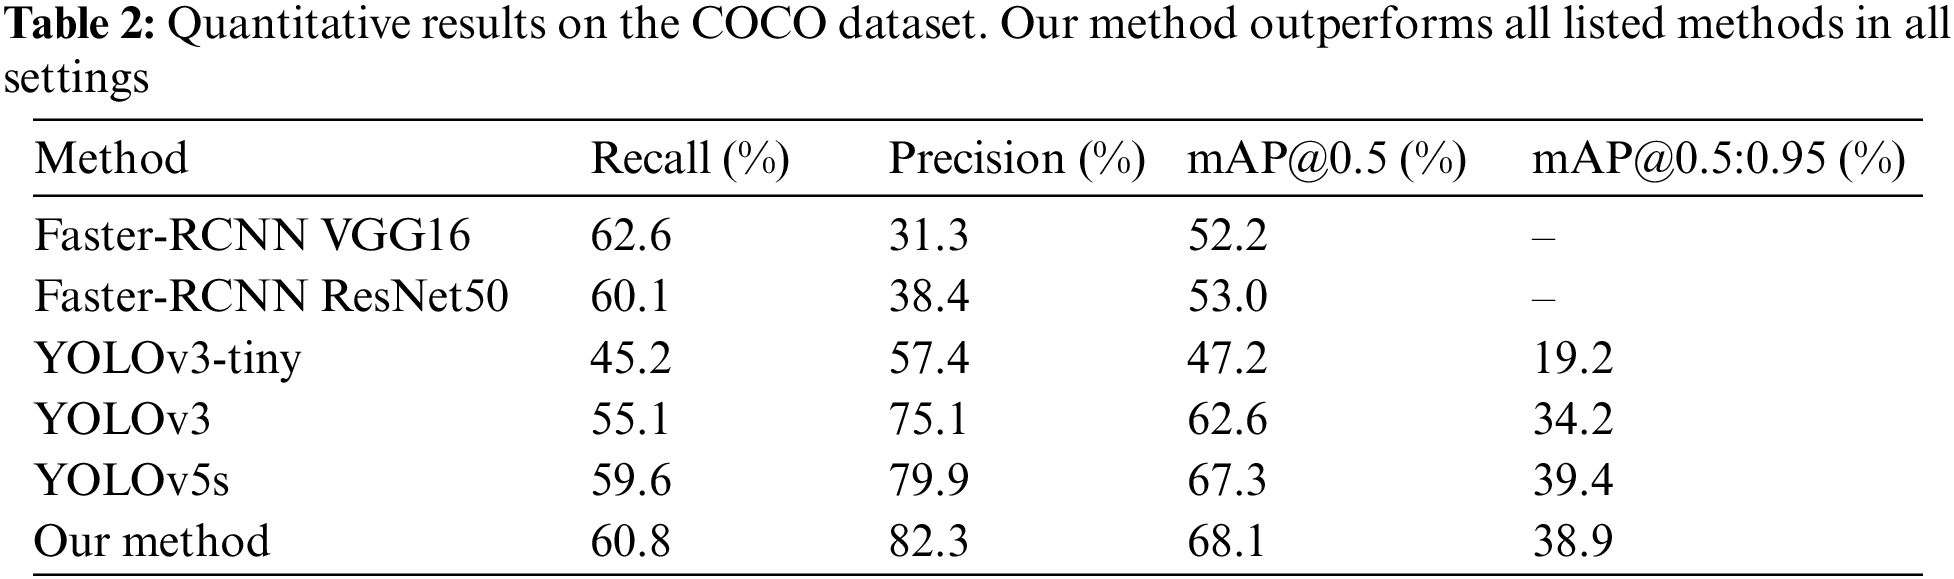
Our approach is evaluated on the four above-mentioned standard metrics: (1) recall; (2) precision; (3) mAP@0.5; and (4) mAP@0.5:0.95. The descriptions of these four metrics were introduced in Section 4.2, so they will not be repeated in this section. The results of six different methods are summarized in Table 2. Our method achieves state-of-the-art performance and outperforms existing methods in all settings.
To see the experimental results more intuitively, we compared the PR curves of our network, YOLOv5s, Faster-RCNN ResNet50, Faster-RCNN VGG16, YOLOv3, and YOLOv3-tiny. As shown in Fig. 8, the horizontal coordinate is the Recall value, the vertical coordinate is the Precision value, the black line represents the PR curve of our network model, the blue, yellow, red, green and purple lines represent the PR curves of YOLOv5s, Faster-RCNN ResNet50, Faster-RCNN VGG16, YOLOv3, and YOLOv3-tiny. The larger area enclosed by the PR curve and the horizontal and vertical coordinates indicates higher recognition accuracy. The images show that our network has the largest area enclosed by the PR curve, and that our network outperforms the other networks in terms of recognition accuracy.
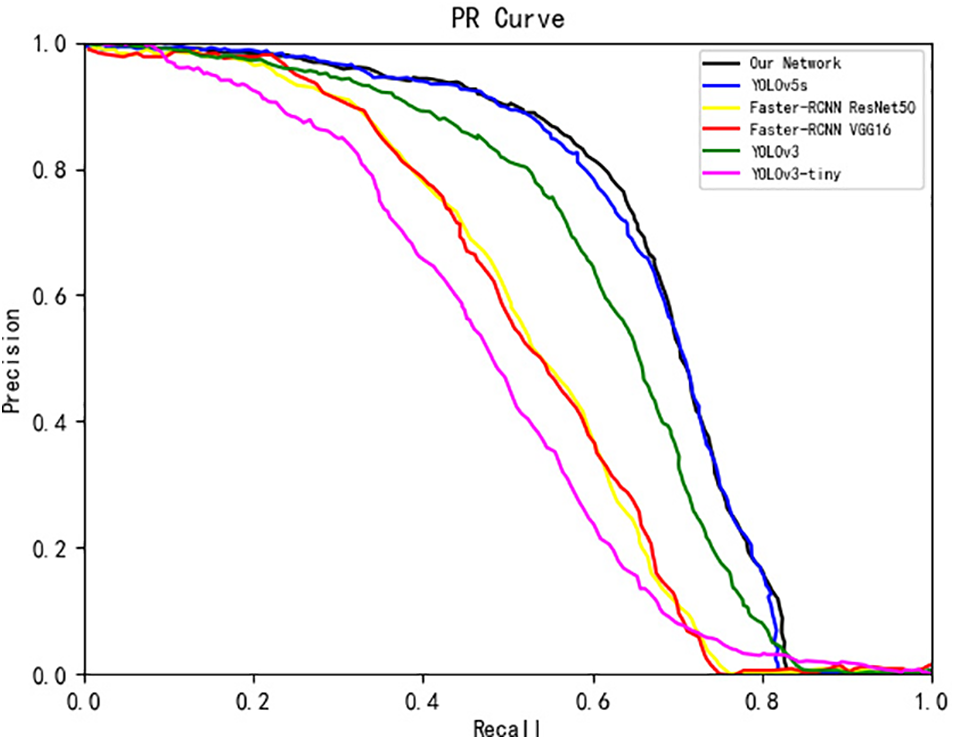
Figure 8: PR curves of our network with YOLOv5s, Faster-RCNN ResNet50, Faster-RCNN VGG16, YOLOv3 and YOLOv3-tiny. The black line shows the PR curve of our network, the blue line shows the PR curve of YOLOv5s, the yellow line shows the PR curve of Faster-RCNN ResNet50, the red line shows the PR curve of Faster-RCNN VGG16, the green line shows the PR curve of YOLOv3, and the purple line shows the PR curve of YOLOv3-tiny
In order to test the actual detection effect of our proposed model, we choose to use our proposed model and YOLOv5s model to test and compare the target recognition of our collected example images separately, as a visual illustration of the performance improvement.
The obtained target recognition test results are shown in Fig. 9. It is obvious from the figure that in the case that the target is far away from the camera, the image is blurred and the pedestrian size is small, at this time our designed model has better detection effect and can detect the pedestrians missed by the original model, and the missed detection rate is relatively low.
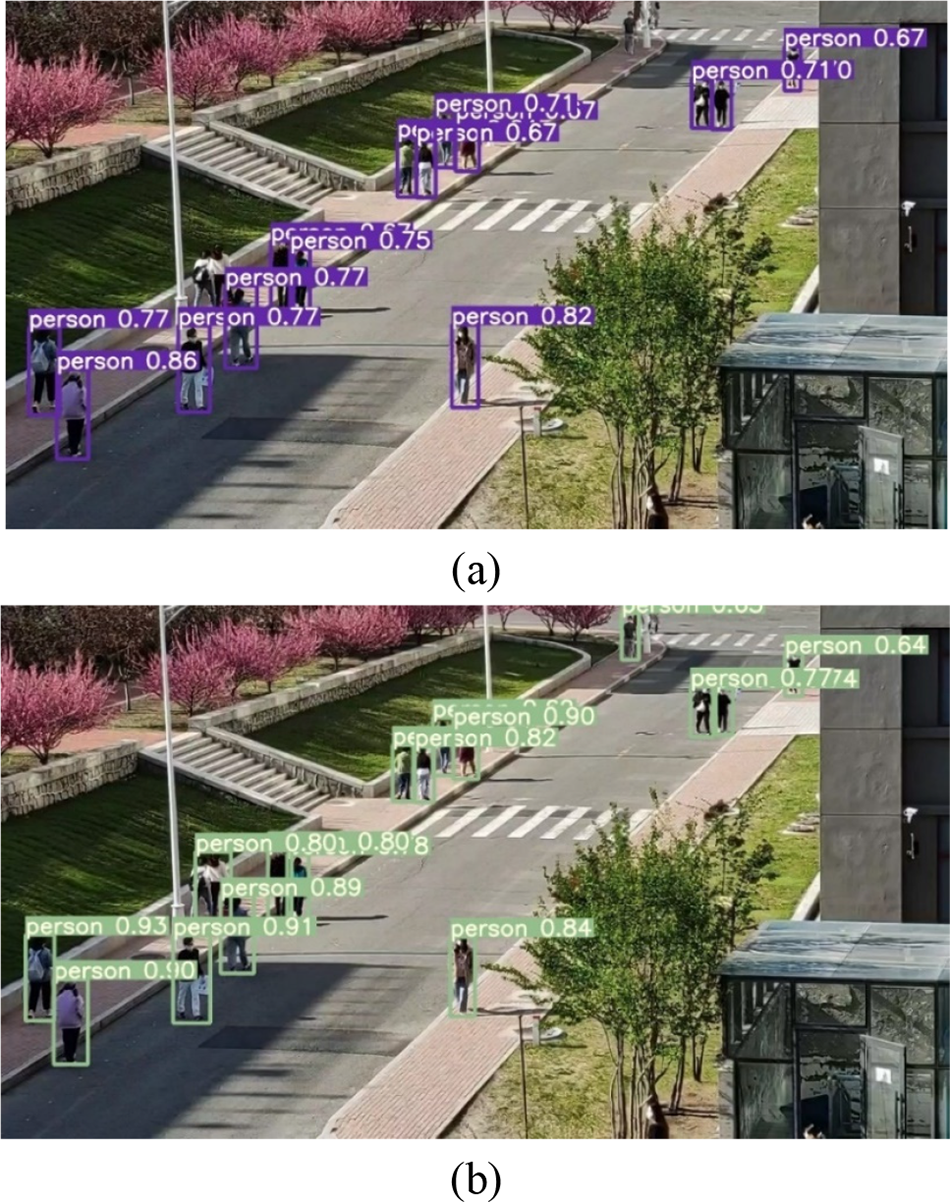
Figure 9: Pedestrian detection results generated by YOLOv5s (a) and our model (b)
In addition, the detection speed of our proposed model is improved based on the time record printed by the program after detection, which indicates the sum of the image preprocessing time, the network model inference time, and the time for processing such as non-maximal value suppression after inference. The total detection time of the original model for this example image is 0.078 s under the same computing power conditions, while the detection time is 0.062 s after replacing it with our model. The effect of time compression for a single image is not obvious enough, but this speed improvement accumulates when processing video frames, which can reduce video latency and improve smoothness, thus reducing the hardware cost.
In this paper, we study the application of deep learning in pedestrian detection scenarios. We design a lightweight convolutional neural network architecture based on a coordinate attention mechanism to improve the channel attention and spatial attention of the network. In addition, we propose a perspective transformation module for implementing coordinate transformation, which converts the original skewed view into a bird’s eye view and solves the distortion problem caused by perspective. Our experiments show that our network recognition accuracy reaches 82.3%, outperforming existing methods in terms of recall, accuracy and mAP.
Our work still has some shortcomings. For example, the detected targets may be blurred when the scene being detected is crowded, and there is a lack of experiments for pedestrian distance detection. To address this issue, we will try to improve our network in future work and design relative metrics to refine the experimental content.
Funding Statement: This research was funded by the Fundamental Research Funds for the Central Universities, 3072022TS0605, and the China University Industry-University-Research Innovation Fund, 2021LDA10004.
Author Contributions: The authors confirm contribution to the paper as follows: study conception and design: W. Li, Z.H. Liu, X. Li; data collection: X. Li, Z.H. Liu; analysis and interpretation of results: Z.H. Liu, X. Li, S.Q. Liu, X.X. Meng; draft manuscript preparation: S.Q. Liu, W. Li, J. Jia. All authors reviewed the results and approved the final version of the manuscript.
Conflicts of Interest: The authors declare that they have no conflicts of interest to report regarding the present study.
References
1. H. Li, S. M. Liu, X. H. Yu, S. L. Tang and C. K. Tang, “Coronavirus disease 2019 (COVID-19Current status and future perspectives,” International Journal of Antimicrobial Agents, vol. 55, no. 5, pp. 105951, 2020. [Google Scholar] [PubMed]
2. A. Wilder-Smith and D. O. Freedman, “Isolation, quarantine, social distancing and community containment: Pivotal role for old-style public health measures in the novel coronavirus (2019-nCoV) outbreak,” Journal of Travel Medicine, vol. 27, no. 2, pp. 727, 2020. [Google Scholar]
3. A. Brunetti, D. Buongiorno, G. F. Trotta and V. Bevilacqua, “Computer vision and deep learning techniques for pedestrian detection and tracking: A survey,” Neurocomputing, vol. 300, no. 2, pp. 17–30, 2018. [Google Scholar]
4. A. Dosovitskiy, L. Beyer, A. Kolesnikov, D. Weissenborn, X. Zhai et al., “An image is worth 16 × 16 words: Transformers for image recognition at scale,” arXiv preprint, arXiv. 2010, no. 11929, 2020. [Google Scholar]
5. Y. Wang, R. Huang, S. Song, Z. Huang and G. Huang, “Not all images are worth 16 × 16 words: Dynamic transformers for efficient image recognition,” Advances in Neural Information Processing Systems, vol. 34, pp. 11960–11973, 2021. [Google Scholar]
6. G. Sharir, A. Noy and L. Zelnik-Manor, “An image is worth 16 × 16 words, what is a video worth?,” arXiv preprint, arXiv. 2103, no. 13915, 2021. [Google Scholar]
7. X. X. Meng, W. Li, S. Zlatanova, Z. Zhao and X. Wang, “A dual-encoder-condensed convolution method for high-precision indoor positioning,” Remote Sensing, vol. 14, no. 19, pp. 4746, 2022. [Google Scholar]
8. K. X. Gao, H. Q. Wang, H. W. Lv and W. X. Liu, “Towards 5G NR high-precision indoor positioning via channel frequency response: A new paradigm and dataset generation method,” IEEE Journal on Selected Areas in Communications, vol. 40, no. 7, pp. 2233–2247, 2022. [Google Scholar]
9. H. Zhou, S. Zhang, J. Peng, S. Zhang, J. Li et al., “Informer: Beyond efficient transformer for long sequence time-series forecasting,” in Proc. of the AAAI Conf. on Artificial Intelligence, California, CA, USA, vol. 35, pp. 11106–11115, 2021. [Google Scholar]
10. H. Wu, J. Xu, J. Wang and M. Long, “Autoformer: Decomposition transformers with autocorrelation for long-term series forecasting,” Advances in Neural Information Processing Systems, vol. 34, pp. 22419–22430, 2021. [Google Scholar]
11. T. Zhou, Z. Ma, Q. Wen, X. Wang, L. Sun et al., “FEDformer: Frequency enhanced decomposed transformer for long-term series forecasting,” arXiv preprint, arXiv. 2201, no. 12740, 2022. [Google Scholar]
12. M. O. Arowolo, R. O. Ogundokun, S. Misra, B. D. Agboola and B. Gupta, “Machine learning-based IoT system for COVID-19 epidemics,” Computing, vol. 105, no. 4, pp. 1–17, 2022. [Google Scholar]
13. C. T. Nnodim, M. O. Arowolo, A. A. Ajani, S. N. Okhuegbe, B. D. Agboola et al., “Emerging advances in the internet of things (IoT) technology for fast response to COVID-19 outbreak with ANOVA-K-NN implementation,” Engineering Letters, vol. 29, pp. 8, 2021. [Google Scholar]
14. M. O. Arowolo, R. O. Ogundokun, S. Misra, A. F. Kadri and T. O. Aduragba, “Machine learning approach using KPCA-SVMs for predicting COVID-19,” Healthcare Informatics for Fighting COVID-19 and Future Epidemics, pp. 193–209, 2022. [Google Scholar]
15. M. Turkyilmazoglu, “Explicit formulae for the peak time of an epidemic from the SIR model,” Physica D: Nonlinear Phenomena, vol. 422, pp. 132902, 2021. [Google Scholar] [PubMed]
16. M. Turkyilmazoglu, “Indoor transmission of airborne viral aerosol with a simplistic reaction-diffusion model,” The European Physical Journal Special Topics, vol. 231, no. 18–20, pp. 3591–3601, 2022. [Google Scholar] [PubMed]
17. N. Dalal and B. Triggs, “Histograms of oriented gradients for human detection,” in 2005 IEEE Computer Society Conf. on Computer Vision and Pattern Recognition, San Diego, CA, USA, vol. 1, pp. 886–893, 2005. [Google Scholar]
18. P. Viola and M. J. Jones, “Robust real-time face detection,” International Journal of Computer Vision, vol. 57, no. 2, pp. 137–154, 2004. [Google Scholar]
19. K. He, X. Zhang, S. Ren and J. Sun, “Deep residual learning for image recognition,” in Proc. of the IEEE Conf. on Computer Vision and Pattern Recognition, Las Vegas, NV, USA, pp. 770–778, 2016. [Google Scholar]
20. S. Zagoruyko and N. Komodakis, “Wide residual networks,” arXiv preprint, arXiv. 1605, no. 07146, 2016. [Google Scholar]
21. Y. Chen, X. Dai, D. Chen, M. Liu, X. Dong et al., “Mobile-former: Bridging mobilenet and transformer,” in Proc. CVPR, New Orleans, LA, USA, pp. 5270–5279, 2022. [Google Scholar]
22. R. Girshick, J. Donahue, T. Darrell and J. Malik, “Rich feature hierarchies for accurate object detection and semantic segmentation,” in Proc. CVPR, Columbus, OH, USA, pp. 580–587, 2014. [Google Scholar]
23. R. Girshick, “Fast R-CNN,” in Proc. ICCV, Santiago, Chile, pp. 1440–1448, 2015. [Google Scholar]
24. S. Ren, K. He, R. Girshick and J. Sun, “Faster R-CNN: Towards real-time object detection with region proposal networks,” Advances in Neural Information Processing Systems, vol. 28, pp. 1137–1149, 2015. [Google Scholar]
25. J. Li, X. Liang, S. Shen, T. Xu, J. Feng et al., “Scale-aware fast R-CNN for pedestrian detection,” IEEE Transactions on Multimedia, vol. 20, pp. 985–996, 2017. [Google Scholar]
26. J. Mao, T. Xiao, Y. Jiang and Z. Cao, “What can help pedestrian detection?” in Proc. of the IEEE Conf. on Computer Vision and Pattern Recognition, Honolulu, HI, USA, pp. 3127–3136, 2017. [Google Scholar]
27. J. Redmon, S. Divvala, R. Girshick and A. Farhadi, “You only look once: Unified, real-time object detection,” in Proc. of the IEEE Conf. on Computer Vision and Pattern Recognition, Las Vegas, NV, USA, pp. 779–788, 2016. [Google Scholar]
28. J. Redmon and A. Farhadi, “YOLO9000: Better, faster, stronger,” in Proc. of the IEEE Conf. on Computer Vision and Pattern Recognition, Honolulu, HI, USA, pp. 7263–7271, 2017. [Google Scholar]
29. J. Zhang, M. Huang, X. Jin and X. Li, “A real-time chinese traffic sign detection algorithm based on modified YOLOv2,” Algorithms, vol. 10, no. 127, pp. 127, 2017. [Google Scholar]
30. J. Redmon and A. Farhadi, “Yolov3: An incremental improvement,” arXiv preprint, arXiv. 1804, no. 02767, 2018. [Google Scholar]
31. N. S. Punn, S. K. Sonbhadra, S. Agarwal and G. Rai, “Monitoring COVID-19 social distancing with person detection and tracking via fine-tuned YOLO v3 and Deepsort techniques,” arXiv preprint, arXiv. 2005, 01385, 2020. [Google Scholar]
32. L. Ramadass, S. Arunachalam and Z. Sagayasree, “Applying deep learning algorithm to maintain social distance in public place through drone technology,” International Journal of Pervasive Computing and Communications, vol. 16, no. 3, pp. 223–234, 2020. [Google Scholar]
33. A. Bochkovskiy, C. Y. Wang and H. Y. M. Liao, “Yolov4: Optimal speed and accuracy of object detection,” arXiv preprint, arXiv. 2004, no. 10934, 2020. [Google Scholar]
34. Q. Hou, D. Zhou and J. Feng, “Coordinate attention for efficient mobile network design,” in Proc. of the IEEE/CVF Conf. on Computer Vision and Pattern Recognition, Nashville, Tennessee, Verenigde Staten, pp. 13713–13722, 2021. [Google Scholar]
Cite This Article
 Copyright © 2023 The Author(s). Published by Tech Science Press.
This work is licensed under a Creative Commons Attribution 4.0 International License , which permits unrestricted use, distribution, and reproduction in any medium, provided the original work is properly cited.
 Downloads
 Citation Tools