
 Submit a Paper
 Propose a Special lssue
 Open Access
ARTICLE

CDR2IMG: A Bridge from Text to Image in Telecommunication Fraud Detection
1 School of Information Network Security, People’s Public Security University of China, Beijing, 100038, China
2 Key Laboratory of Safety Precautions and Risk Assessment, Ministry of Public Security, Beijing, 102623, China
* Corresponding Author: Jian Gao. Email:
Computer Systems Science and Engineering 2023, 47(1), 955-973. https://doi.org/10.32604/csse.2023.039525
Received 02 February 2023; Accepted 11 April 2023; Issue published 26 May 2023
 View Full Text
 Download PDF
Abstract
Telecommunication fraud has run rampant recently worldwide. However, previous studies depend highly on expert knowledge-based feature engineering to extract behavior information, which cannot adapt to the fast-changing modes of fraudulent subscribers. Therefore, we propose a new taxonomy that needs no hand-designed features but directly takes raw Call Detail Records (CDR) data as input for the classifier. Concretely, we proposed a fraud detection method using a convolutional neural network (CNN) by taking CDR data as images and applying computer vision techniques like image augmentation. Comprehensive experiments on the real-world dataset from the 2020 Digital Sichuan Innovation Competition show that our proposed method outperforms the classic methods in many metrics with excellent stability in both the changes of quantity and the balance of samples. Compared with the state-of-the-art method, the proposed method has achieved about 89.98% F1-score and 92.93% AUC, improving 2.97% and 0.48%, respectively. With the augmentation technique, the model’s performance can be further enhanced by a 91.09% F1-score and a 94.49% AUC respectively. Beyond telecommunication fraud detection, our method can also be extended to other text datasets to automatically discover new features in the view of computer vision and its powerful methods.Keywords
Telecommunication (abbreviated as telecom) fraud is an act of defrauding a large amount of public and private property by making up fake stories to acquire possession illegally through messages, calls, and other communication means [1]. In recent years, with the fast development of the telecom and the internet industry, the number of telecom fraud instances has increased, bringing substantial economic losses for telecom users. According to the survey from Truecaller Insight, 68.4 M Americans (26%) report encountering phone scams, with total money lost of about 39.5 billion USD in the 12 months before June 2021 [2]. In China, within merely five months, from January to May 2021, as much as 99.1 billion RMB was saved from 114,000 fraud instances [3]. Singapore, Korea, Australia, Germany, and many other countries also heavily suffer from Telecom fraud [4]. These fraudulent activities damage people’s lives economically and mentally, even leading to death [5]. Therefore, it has become an urgent global issue to combat telecom fraud.
Though tremendous work has been practiced to combat telecom frauds, e.g., publicizing the latest typical fraudulent cases on social media and using a predictive intercept mechanism and a system like China’s national Anti-Fraud APP, such cases still frequently occur. As governments enhance their methods, fraudsters improve their tactics adversarially, making it highly challenging to detect telecom frauds, especially when they disguise as normal users in a massive amount of calling records.
Previous studies generally tackled fraud detection problems on several kinds of data, such as CDR, credit card transaction records, voice call records, and text records. This study focuses on the detection with CDR. In recent years, studies mainly concentrated on designing delicate features of a phone call with expert knowledge and then utilizing the state-of-practice machine learning algorithms to classify them, including traditional machine learning methods like Support Vector Machine (SVM) [6–8], Random Forest (RF) [9,10], and deep learning methods like CNN [11], Long Short-Term Memory (LSTM) [12,13], and Recurrent Neural Network (RNN) [14]. Recently, Graph Neural Network (GNN) has been used to extract interactive information among users and make predictions [15–17]. The challenges in this area are summarized as follows:
Challenge 1: Automatically extracting practical features. It has been shown that finding distinctive features is effective for accurately recognizing fraudulent phone calls [12]. In the study [16], the authors offer 55 features and find that features like vocal call type and the mean of the opposite are better than the others of about 50, showing a quality difference between existing features. However, we cannot manually design all-grained level features and then decide which are more effective, which is a drawback of feature engineering. In addition, the cost of the work is enormous as fraudulent call behaviors dynamically change over time. Therefore, a significant challenge in this area is to find a way to extract valuable features automatically adapting to the fast change of call behaviors.
Challenge 2: Category imbalance. Fraudulent phone calls hide in a vast number of normal phone calls, so fraud detection is regarded as an anomaly detection task. However, few works have focused on the data imbalance problem in this area. Some studies try to handle class imbalance problems in fraud detection [18–20], yet they mainly focus on credit card fraud detection. As far as we know, few studies have tried to explore the class imbalance problem on the CDR dataset [12,21], and some studies only use accuracy metrics, which works poorly when a dataset is highly imbalanced.
Challenge 3: Lack of public dataset. Few operators are willing to share a public dataset for privacy-related reasons, so reproducing and improving the published research is challenging in the CDR-based fraud detection area.
For challenge 1, inspired by studies [22,23], which generate images from text datasets, this research proposes a mechanism to turn CDR text data into image-like matrixes and then adopt computer vision approaches. It can automatically extract practical features without any feature engineering, which eases the need for experts’ laborious work. In general, in the two-dimensional matrix, the horizontal axis coordinates are hours, and the vertical axis coordinates are days. Each grid is filled with −1, 0, or 1 concerning calling records within the hour. More specifically, the calling duration is treated as a positive number, while the called duration is regarded as a negative number. If the accumulated call duration of the phone number in the hour is positive, 1 will be filled into the grid, while it will be marked as −1 if it is negative. If the accumulated result is 0, then 0 will be filled. For challenge 2, based on the processed image-like matrix, we evaluate our methods on imbalanced datasets with more suitable metrics for imbalanced data like F1-score and AUC. We also apply the method on datasets with different sample ratios to verify its stability when data is in various degrees of imbalance. For challenge 3, followed [16], we use a real-world labeled CDR dataset released by Sichuan Mobile from the Digital Sichuan Innovation Competition in 2020. We test the method in different quantities of training data to measure its stability when data is insufficient. The source code and data are available at https://github.com/VICKY-ZZ/CDR2IMG.
Our work makes the following contributions:
■ We design an end-to-end CDR-based telecom fraud detection approach without feature engineering, which can automatically complete the entire pipeline, including preprocessing, feature extracting, and predicting.
■ We propose a novel CDR2IMG conversion mechanism that generates images from CDR data and can utilize computer vision methods like augmentation techniques afterward to improve the performance further. Our approach can be a feasible example in the field of text-to-image conversion.
■ We analyze the proposed method CDR2IMG on real-world CDR data. The results indicate that the CDR2IMG outperforms others and can effectively detect fraudulent subscribers with stable performance under the changes in the quantity and balance of samples which are two significant challenges in the field of fraud detection.
The rest of the paper is organized as follows. Section 2 examines the related literature, and Section 3 provides a detailed explanation of the CDR2IMG model. The experimental results are described and analyzed in Section 4. Lastly, Section 5 concludes and discusses future work.
In this paper, we attempt to predict fraudsters by transforming CDR data into pictures and utilizing computer vision methods. Accordingly, we will elaborate on the related work from CDR-based fraud detection and TEXT2IMG methods.
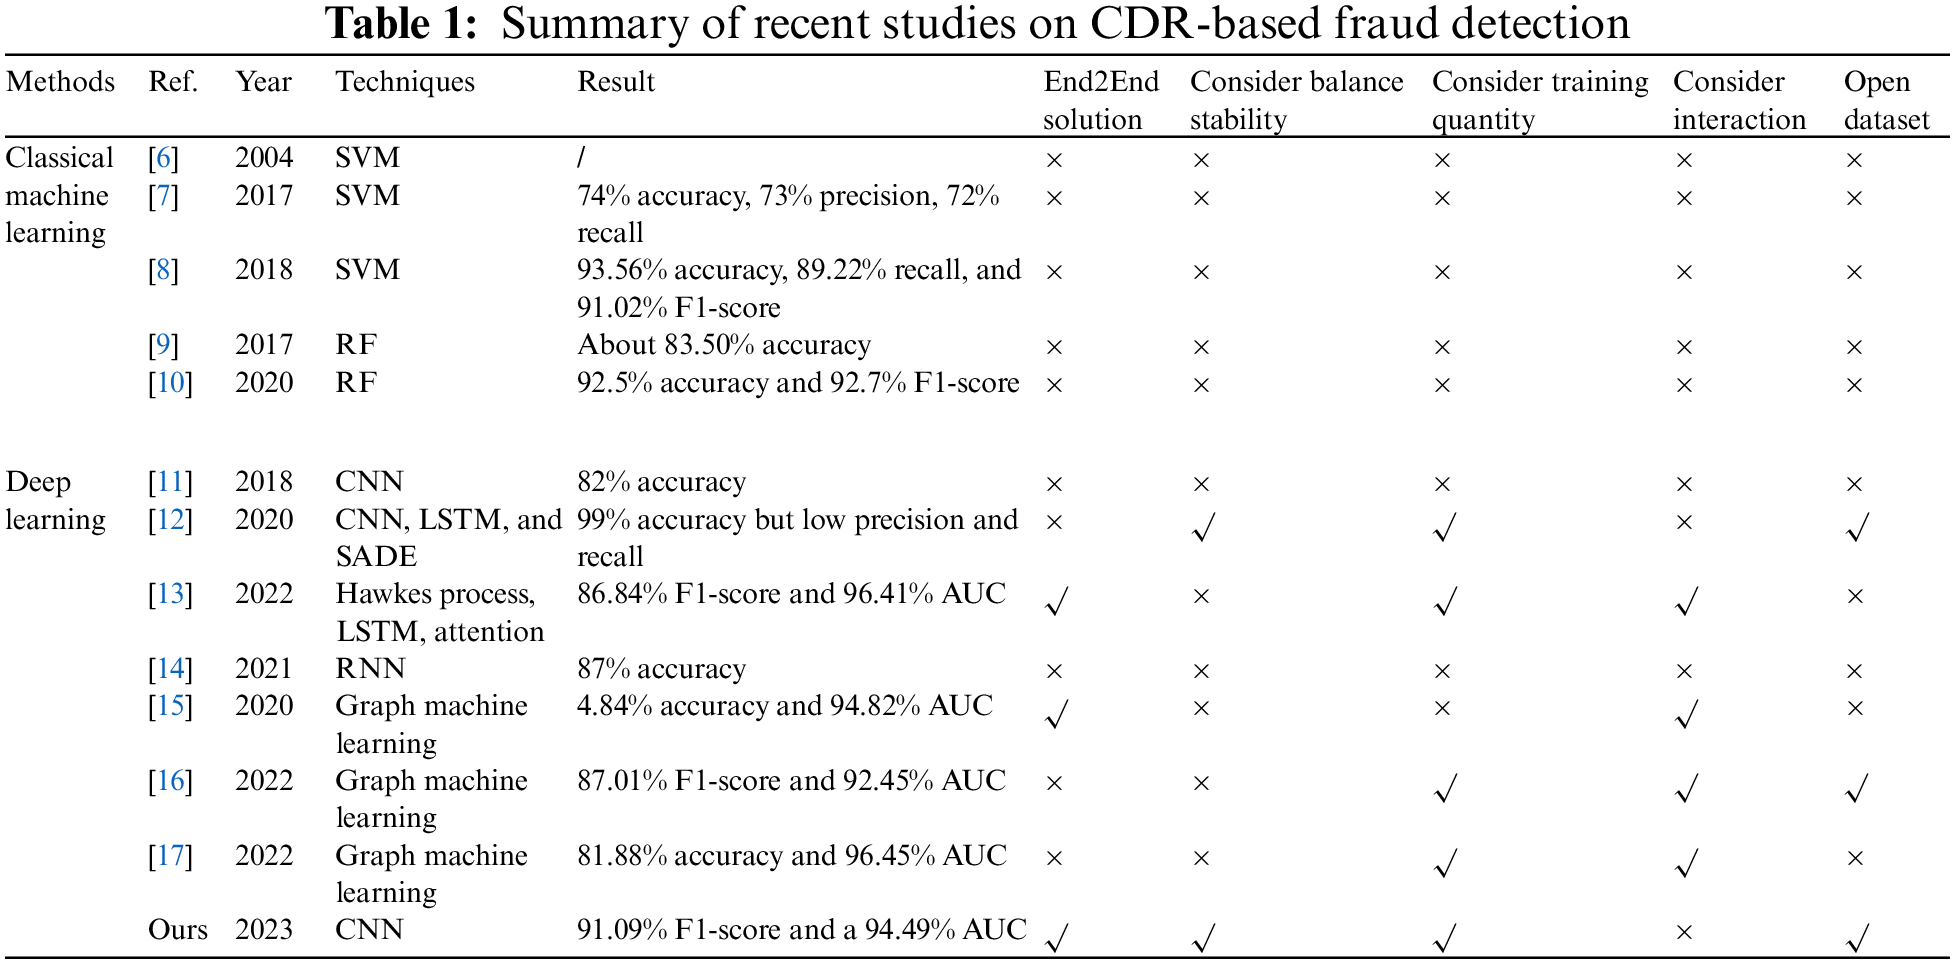
The related works regarding CDR-based Fraud Detection are provided in this section. The works are classified into classical machine learning and deep learning based on their methods, summarized in Table 1. Specifically, the End2End solution mentioned in Table 1 is referred to research without manually designed features.
2.1.1 Classical Machine Learning
As the most intuitive methods, manually designing features and applying classical machine learning methods to classify fraudulent telephone numbers are commonly used. With different features and machine learning algorithms, there are lots of works trying to deal with fraud detection problems.
A stream of studies has focused on using SVM. The main idea of SVM is to separate the data as far as possible. To achieve this goal, SVM searches for an optimal hyperplane with a maximal margin. By adding the kernel method, it can solve nonlinear problems. Wang et al. used SVM with RBF kernel to predict fraud users after extracting 55 attributes from CDR [6]. Ji et al. extracted statistical features such as the number of calls, the mode of the local area, the mode of the call type, and the mode of the calling users to model under a given time granularity. Then they used SVM with linear, poly, and RBF kernels to predict the fraud calls. As shown in the result, SVM with RBF kernel performed the best and achieved 74% accuracy, 73% precision, and 72% recall on a real-world dataset [7]. Li et al. extract features like call duration and call characteristics from the data, then apply SVM to detect suspicious users and classify them with a Finite State Machine [8], which achieves 93.56% accuracy, 89.22% recall, and 91.02% F1-score on a real-world dataset. However, when the data size grows, SVM’s time and computing efficiency become low.
Another widely used family of approaches is RF which considers the voting results of every decision tree on data samples to determine the best solution. By averaging or combing the outputs of various decision trees, RF solves the overfitting issue and performs better than a single tree. Wang et al. designed an analysis method using users’ feedback and behavior features. By preprocessing CDR, they extracted features from nine different granularities ranging from 1 min to 1440 min and then put them into the random forest model, achieving about 83.50% accuracy on a real-world dataset [9]. Lu et al. used an adaptive synthetic sampling algorithm to rebalance the original dataset and chose RF to train on the 20 selected features, achieving 92.5% accuracy and 92.7% F1-score [10]. According to [12], the study used RF as a baseline model because it outperformed k-Nearest Neighbors and SVMs with linear and RBF kernel on their CDR-based fraud detection dataset.
Other researchers chose to use decision trees [24], Naïve Bayesian models [25], the Hidden Markov model [26], and ensemble learning [27]. Even though classical machine learning methods compute more efficiently, their feature engineering phase is complex and laborious. Furthermore, they can’t achieve high performance because their ability to capture the rules behind data is limited.
More recently, deep learning methods have become another important class of methods for CDR-based fraud detection as their remarkable ability to mine big data. Xing et al. extracted six statistical metadata and calling numbers from CDR [12], resulting in 176 dimensions of data, and applied deep learning methods like CNN, LSTM, and SADE. Most deep learning methods obtained accuracy exceeding 99%, but their recall and precision are relatively low. Besides, the team tested the balance and quantity stability of the deep learning models. Although they published the preprocessed data, it can only prove their study but is challenging to use for future research. Observing the sequences’ source and neighbor sequential patterns, Jiang et al. found interesting correlation and repetition modes for fraud detection, and they designed a Hawkes-enhanced sequence model [13]. Their method achieved 86.84% F1-score and 96.41% AUC on an unpublished real-world dataset. Gowri et al. practiced the RNN algorithm to detect malicious calls and achieved 87% accuracy [14]. Features in the dataset were scaled and used principal component analysis before putting into the RNN. However, we can’t find the dataset on Kaggle. Although performing well, they only consider behavior information but ignore the interactive information.
In recent years, a stream of studies has combined behavior features with interactive information using graph machine learning. Ji et al. propose the Multi-Range Gated Graph Neural Network for learning behavior and interactive features between users, achieving 94.84% accuracy and 94.82% AUC [15]. Hu et al. first extracted statistical features from the data and then used graph neural network methods to make classification [16]. They experimented on different training quantities and achieved 87.01% F1-score and 92.45% AUC when using 60% of the total data, outperforming the classic techniques in many metrics. Their study was conducted on a public raw CDR, also used as our experimental dataset. Chu et al. integrated Gaussian and Bernoulli Mixture Hidden Markov Models with an attention-based Graph-SAGE model after a dynamic extended form of statistical and interactive features to learn the sequential call patterns and the neighbors’ call patterns [17]. Their method achieved 81.88% accuracy and 96.45% AUC using 90% training data. Above mentioned studies add interactive information to the model, but their efficiency is relatively low as the limitation of graph neural network.
Although the abovementioned deep learning methods have reached high performance through their massive computation, most still need expert knowledge to design and extract features before feeding into models, which is tedious and can’t adapt to the fast-changing modes of fraudsters. To replace laborious hand-designed feature engineering, a method to automatically acquire compelling features with more helpful information is desperately needed in this area.
The TEXT2IMG method is a data transformation scheme that turns text data into images and then utilizes well-developed models and techniques in the computer vision domain. This scheme has been researched extensively in the network traffic analysis area, whose input data are one-dimensional time series of consecutive bytes transmitted.
Usually, there are two main approaches for adding one more dimension to the network traffic data: traffic wrapping or one-hot encoding [22]. By traffic wrapping, samples in the form of bytes are split into several pieces and concatenated vertically. Thus, the processed data has horizontal and vertical neighbors that appeared at a specific time before and after the current data value. In One-hot encoding, the 1D vectors of numerical integer values are replaced with the 2D binary vector. According to [22], flow wrapping appears to be one of the main trends in traffic manipulations within discussed CNN entries [28–33].
To our knowledge, few studies have used the scheme in the fraud detection domain [11,23]. Alharbi et al. propose generating small images and using CNN models in the credit card-based fraud detection domain [23]. Specifically, the public dataset containing 30 features was converted into (6 × 5)-dimensional images with the text2IMG method. Their approach reached a 99.87% accuracy by Coarse-KNN using features generated by the proposed CNN. However, their picturing process is designed for the credit card transaction dataset with distinct features unsuitable for CDR datasets with time-series information. Chouiekh et al. transformed the users’ daily communication information, such as long call duration, an unusual number of voucher recharges, and so on, into images and then utilized a 7-layer convolutional neural network [11]. Their results in the dataset of 300 users within 60 days indicate that the proposed method is better than baseline models such as SVM and gradient boosting algorithms. However, more details regarding the study are limited, and the performance of 82% accuracy needs to be improved.
Above mentioned studies have practiced TEXT2IMG in different kinds of text datasets and achieved good results, enabling end-to-end models without manually designed features from new views of computer vision. However, their methods are limited in domain and data format, yet they can’t be applied to fraud detection based on CDR data.
Motivated by the observations from the TEXT2IMG method mentioned in Section 2.2, we propose a CDR2IMG approach that converts CDR data into image-like matrixes. The generated image-like data are then trained in the proposed CNN model after a computer vision method like data augmentation. The framework of the approach is shown in Fig. 1, and the detailed information will be elaborated on in the following paragraphs.
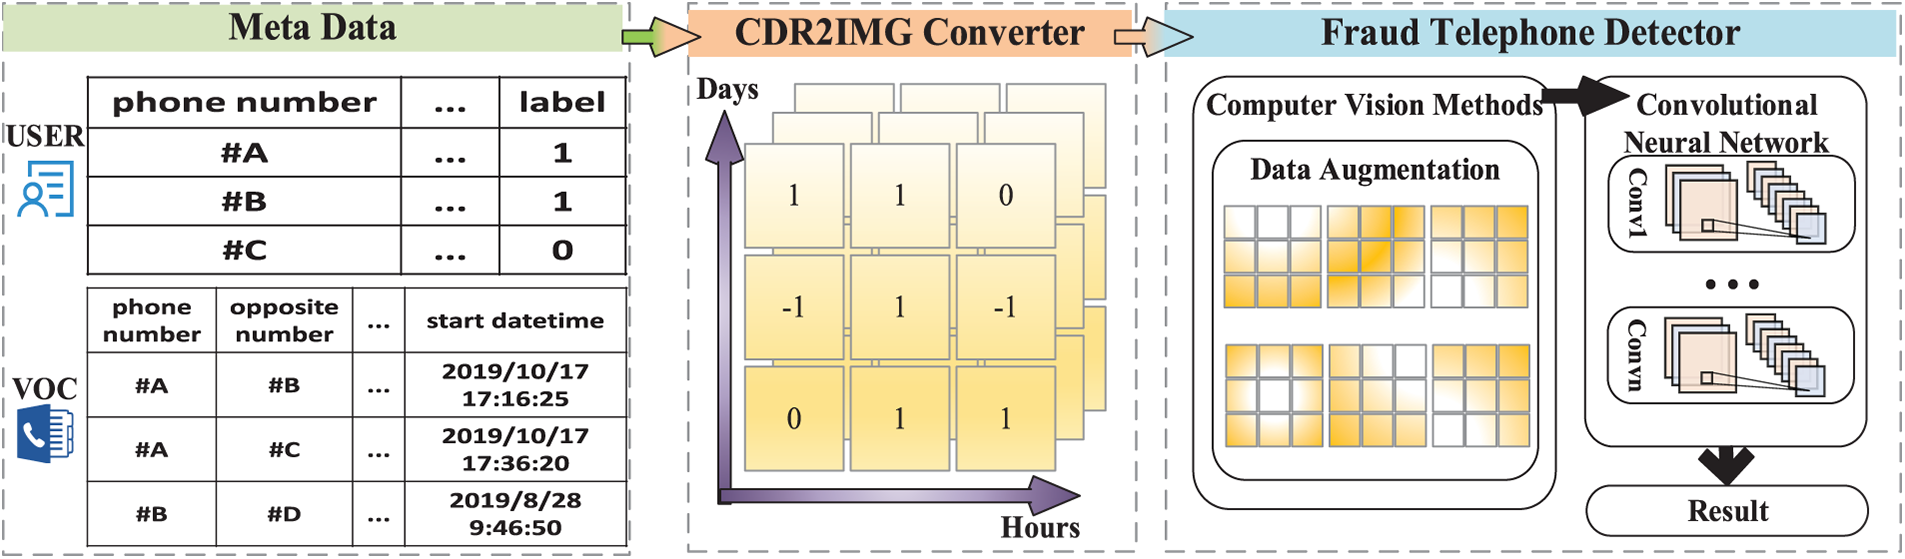
Figure 1: Flowchart of the proposed framework
Given the metadata containing users’ data and vocal call data, we can differentiate fraudsters’ and normal users’ vocal call behaviors by visualizing them in matrixes through CDR2IMG converter, whose primary work is to automatically generate the image-like matrixes of call behaviors which are used for the fraud telephone detection in the following stages.
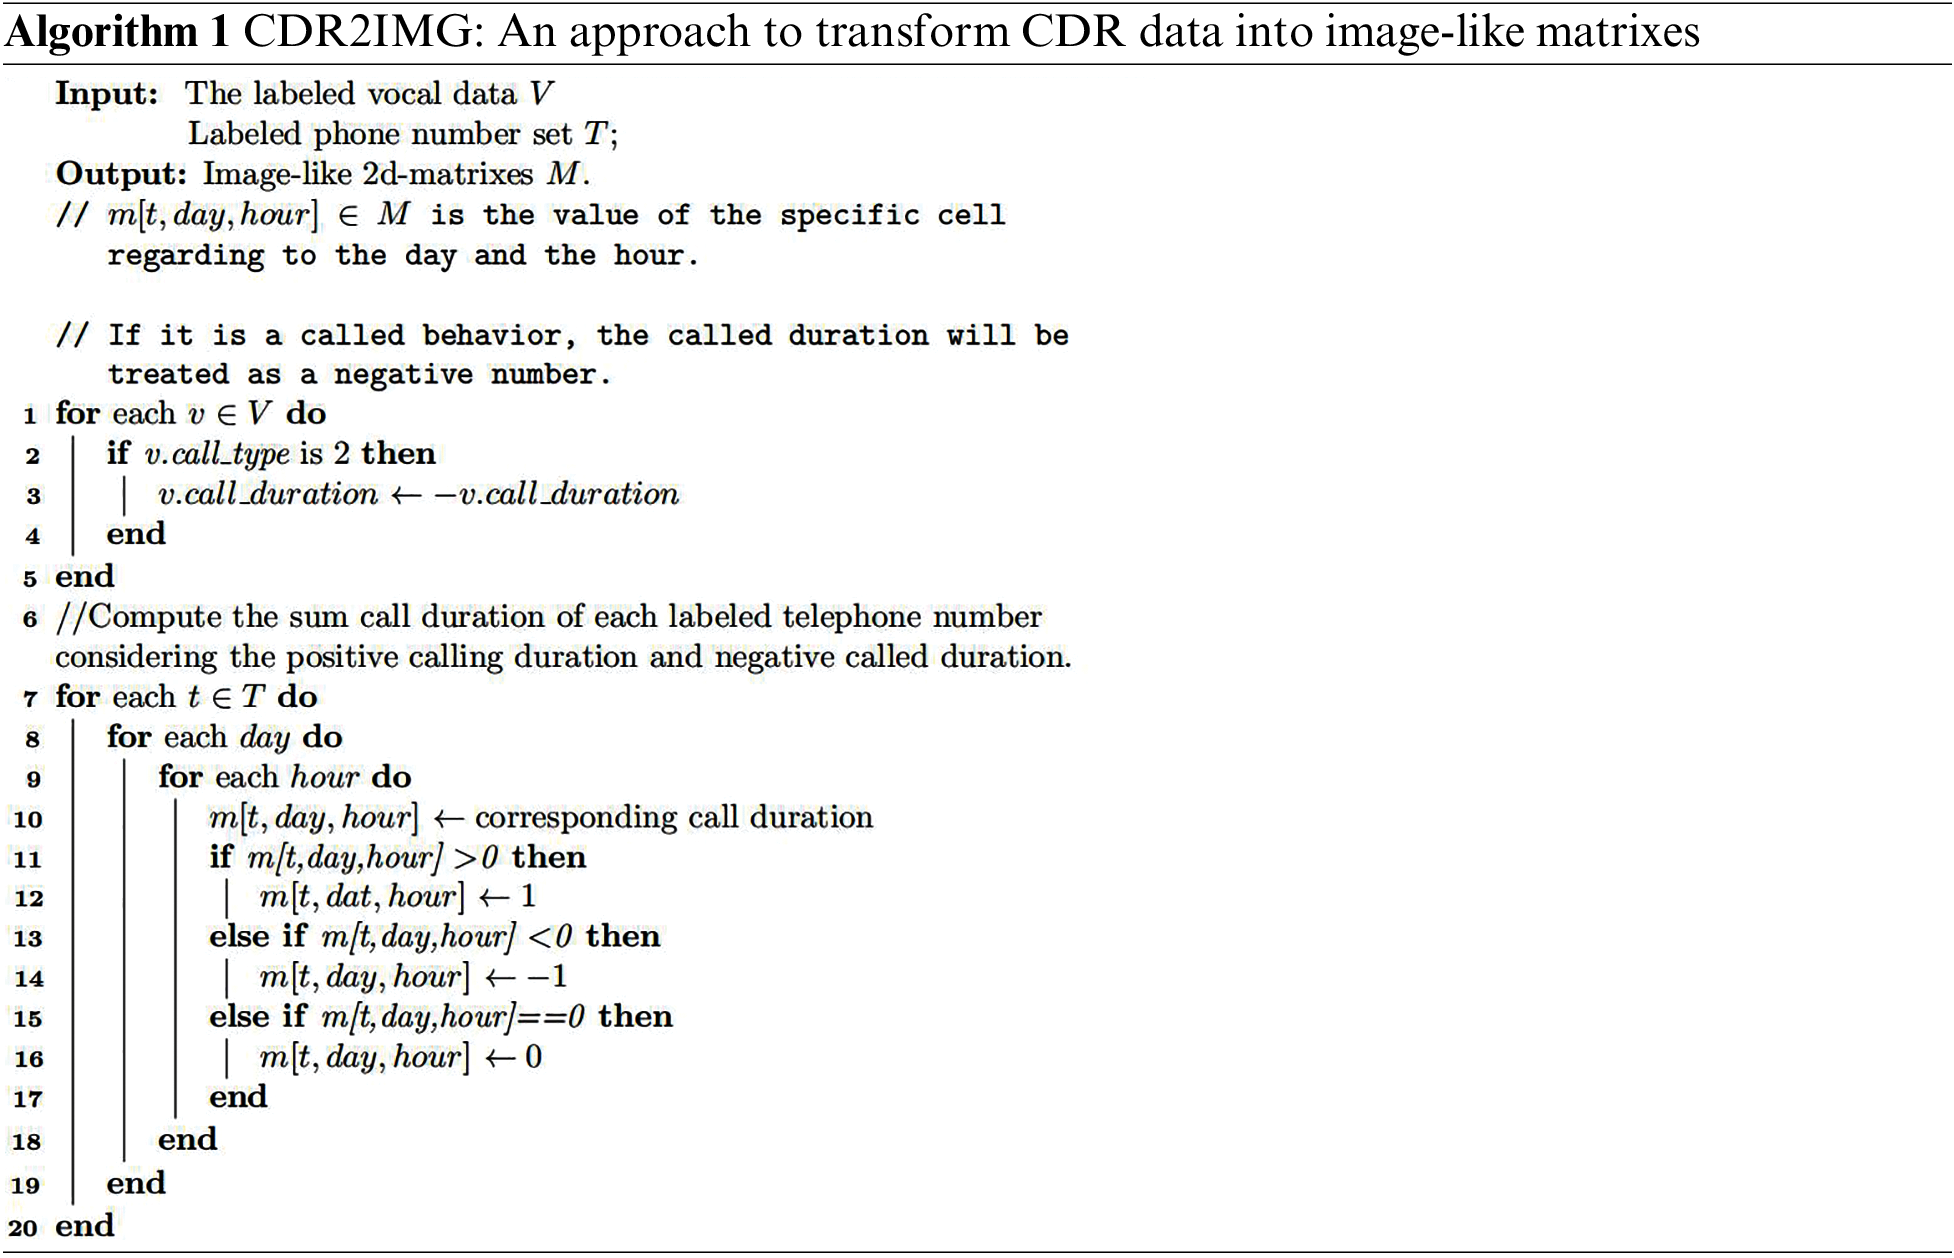
In the generated image-like matrixes, the horizontal axis coordinates are hours, and the size is 24, as there are 24 h in a day. The coordinates of the vertical axis are days. Since the data used in this paper is from Aug. 1, 2019, to Mar. 31, 2020, the size of the vertical axis should be 244. Thus, we intend to use a 24 × 244 two-dimensional matrix to describe the call behaviors of a telephone number by accumulating the call duration at every specific hour on every specific day.
As shown in Algorithm 1, the calling duration is treated as a positive number, while the called duration is regarded as a negative number. Otherwise, if the call is not made, it will be treated as 0. Since the type of transfer dominates very little, we ignore its influence and treat its duration as a positive number. If the accumulated call duration of the phone number in a particular hour is positive, the data corresponding to that hour will be marked as 1 in the matrix, while it will be marked as −1 if it is negative. Otherwise, it will be 0.
The images generated are shown in Fig. 2. As the two-dimensional matrix generated from Aug. 1, 2019, to Mar. 31, 2020, is too large, we use one month’s call records (February 2020) instead to visualize the matrix. The images in the first row of the figure are generated by fraudulent subscribers, while pictures from the second row describe normal users. While Subpictures (a) and (b) are easy to detect and consistent since they are typically different from normal users as they have set working patterns and usually call to others. However, the other two Subpictures, (c) and (d) from fraudsters, are difficult to discern as they are similar to the normal users, and we can’t figure them out with our normal knowledge. Thus we need models from computer vision to learn tiny differences from massively generated matrixes, which are impossible for human beings to discern.
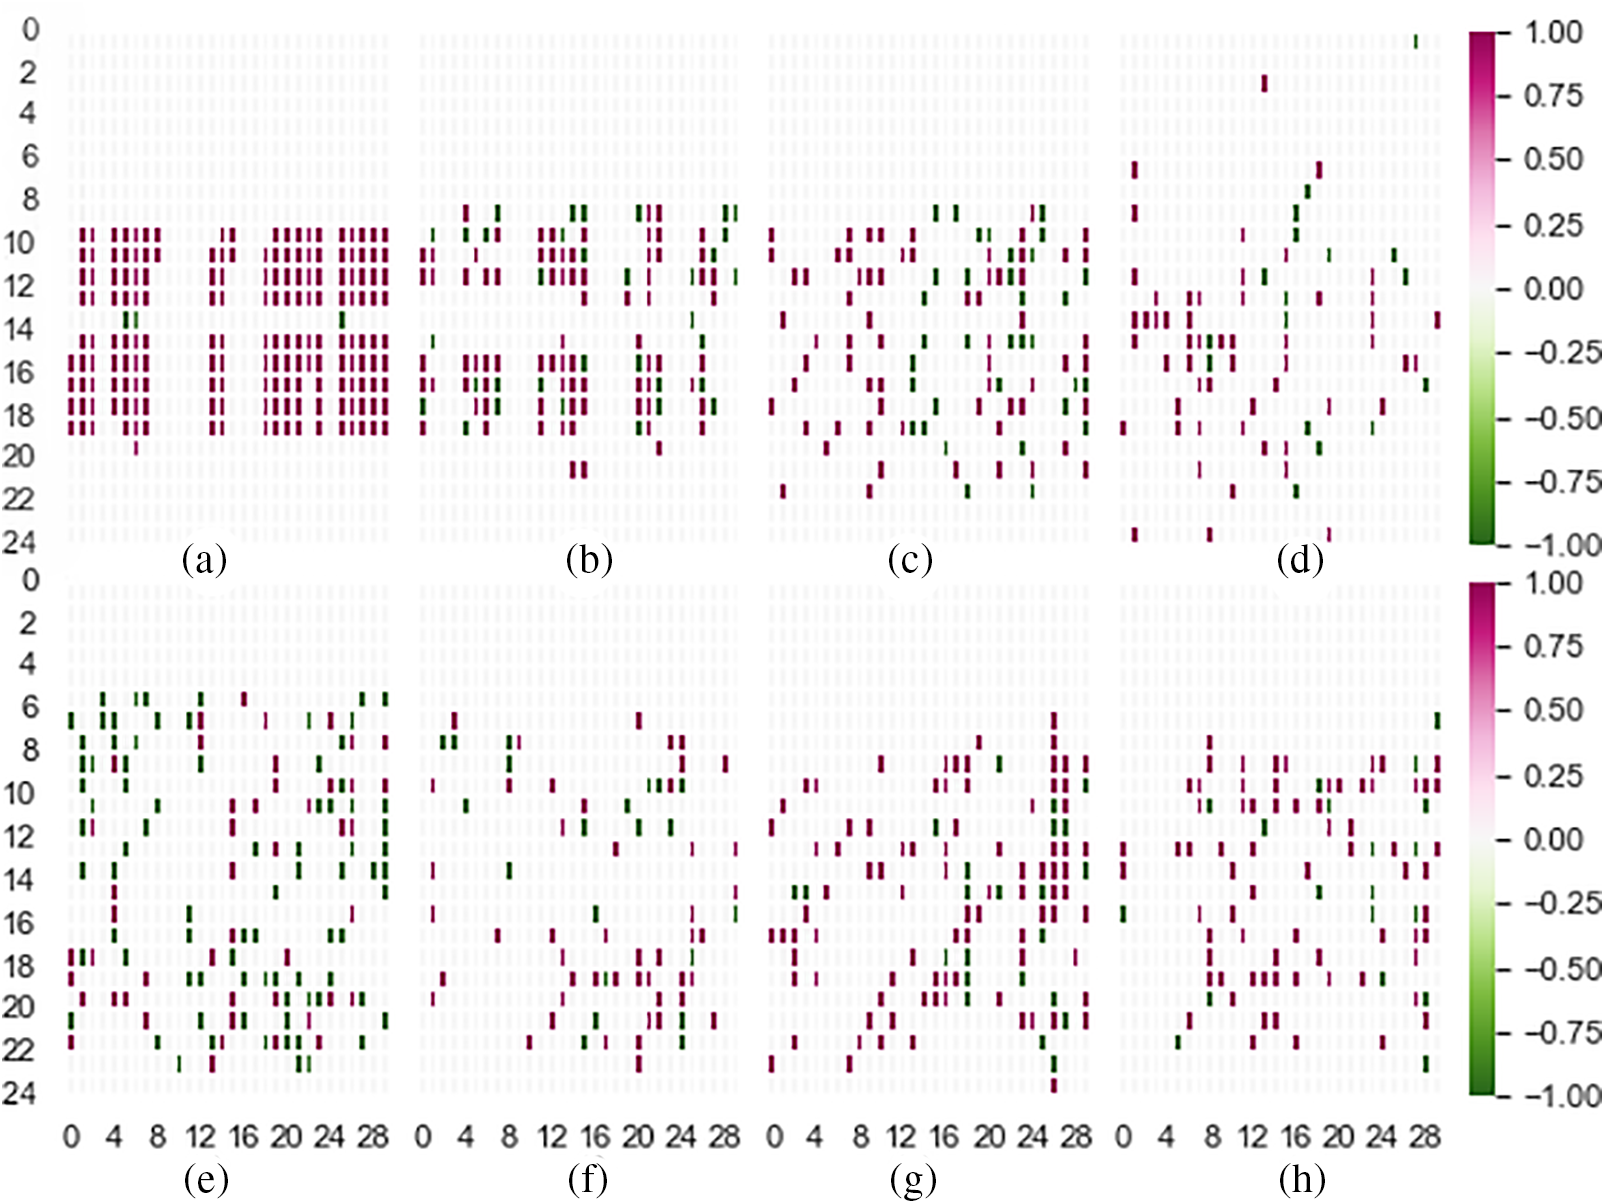
Figure 2: Visualization of fraud and normal users’ CDR (a), (b), (c), and (d) are fraudulent patterns; (e), (f), (g), and (h) are normal patterns
Although we can visually distinguish some kinds of fraudsters’ patterns from normal users’ in Fig. 2, it’s still hard for human beings to learn the trivial and complex differences between them among other not typical cases. Considering this, we utilize computer vision methods. Specifically, we try using image augmentation in computer vision to amplify samples. Then, we propose a straightforward CNN architecture that is efficient and effective in learning the differences between two types of subscribers. Detailed information about the architecture can be seen in Section 3.2.2.
In Section 3.1, we have gotten image-like matrixes that can be directly fed into CNN models. However, as a fast-developing research topic, there are plenty of ways to improve classification performance in the computer vision area. We choose image augmentation in our study as it is a common measure when samples are insufficient, which is a challenging problem in fraud telephone detection.
Data augmentation enlarges the training set with generated data from the original dataset according to specific algorithms. The idea of image augmentation was first applied to the MNIST dataset in [34]. Prevalent practices for augmenting images are to reasonably change the geometry and color of the photos, such as rotating the images and changing the pictures’ color.
In our method, we choose to zoom and shift the data horizontally (shorten the period of the data) at random. Both of the transformations are the affine transformation of the original data that takes the form:
3.2.2 Proposed CNN Architecture
CNN models use convolutional layers, which are essential and valuable in computer vision. The convolutional layers perform convolution operations and can perfectly utilize an image’s structure, improving the model’s classification ability. The mathematical representation of a convolutional layer is formulated as follows:
which is defined in [35].
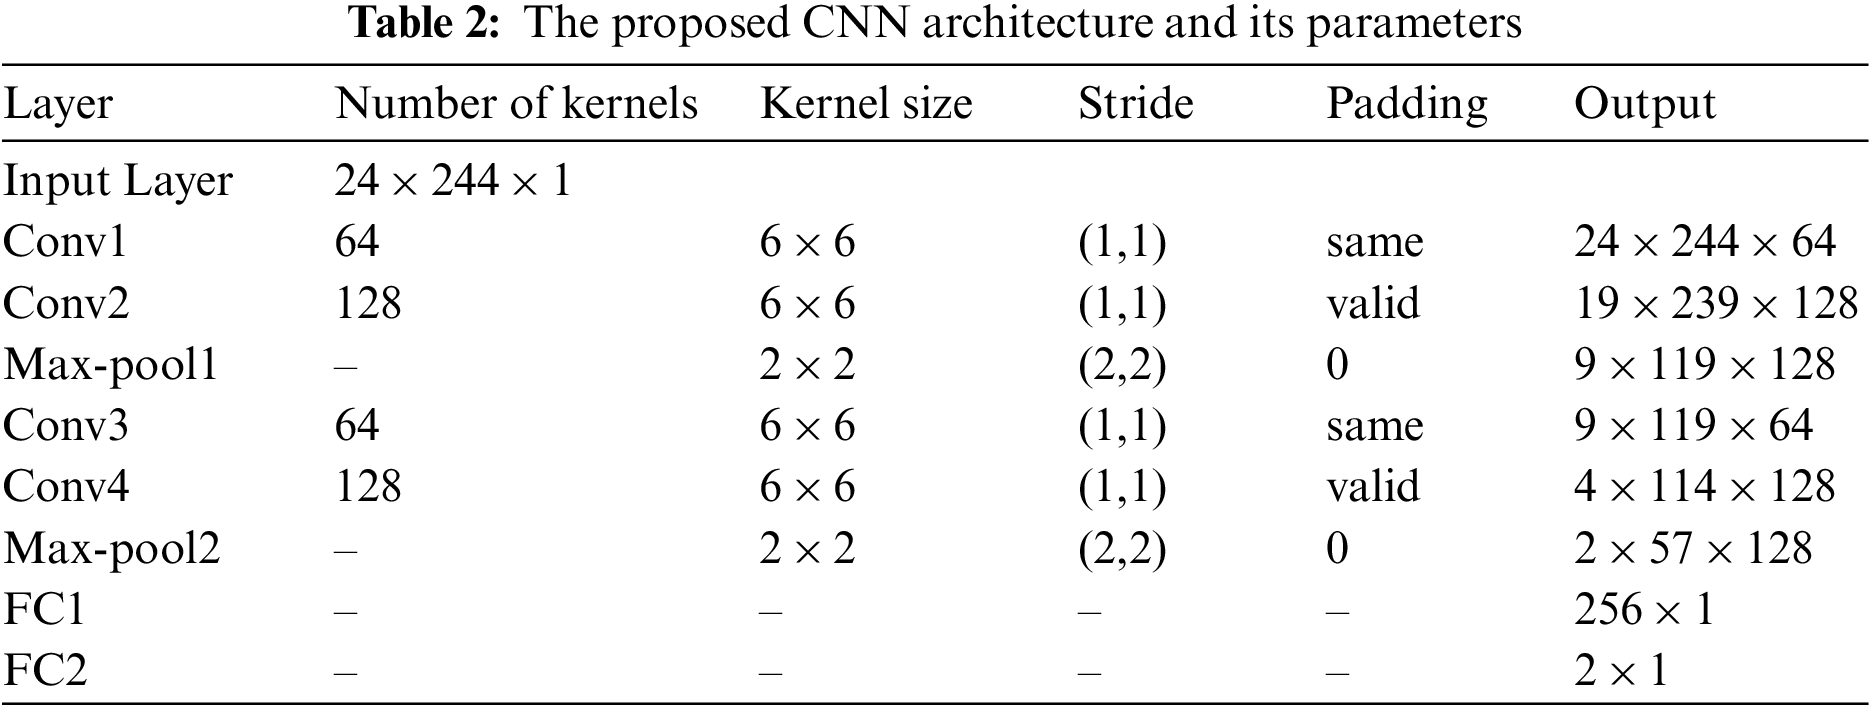
Ci is the output which includes the feature maps extracted in this layer. The kernel Ki,j is the window iterating over the given images. Moreover, n and m are the indexes of rows and columns, respectively. The kernel size and the number of filters vary in the proposed method, and the detailed information is shown in Table 2.
We used the telecom fraud dataset1 released in the 2020 Digital Sichuan Innovation Competition2. To our knowledge, the only public research on it is [16] as it is a newly published dataset, and we compared the performance of our method with theirs.
From August 2019 to March 2020, the China Mobile Sichuan Corporation, who made the dataset sampled 6025 users. The dataset has four subsets: application usage record, short message service record, voice record (VOC), and user information (USER). In our research, we mainly use VOC and USER data. The VOC subset includes the voice communication object id, call type, timestamp, and duration. The USER subset comprises the communication object id and the fraud label. A more detailed introduction about other subsets in the dataset can be found in [16].
As shown in Table 3 below, the original dataset involves 6,025 users, including 4,133 non-fraud users and 1,892 fraud users. The ratio is about 2:1, so a severe category imbalance problem doesn’t exist in this dataset. We divided the original dataset into 20%, 20%, and 60% as the test, validation, and training set, with its original sample ratio as our original dataset. We will elaborate on Table 3 in Section 4.1.2 about the resampled dataset.
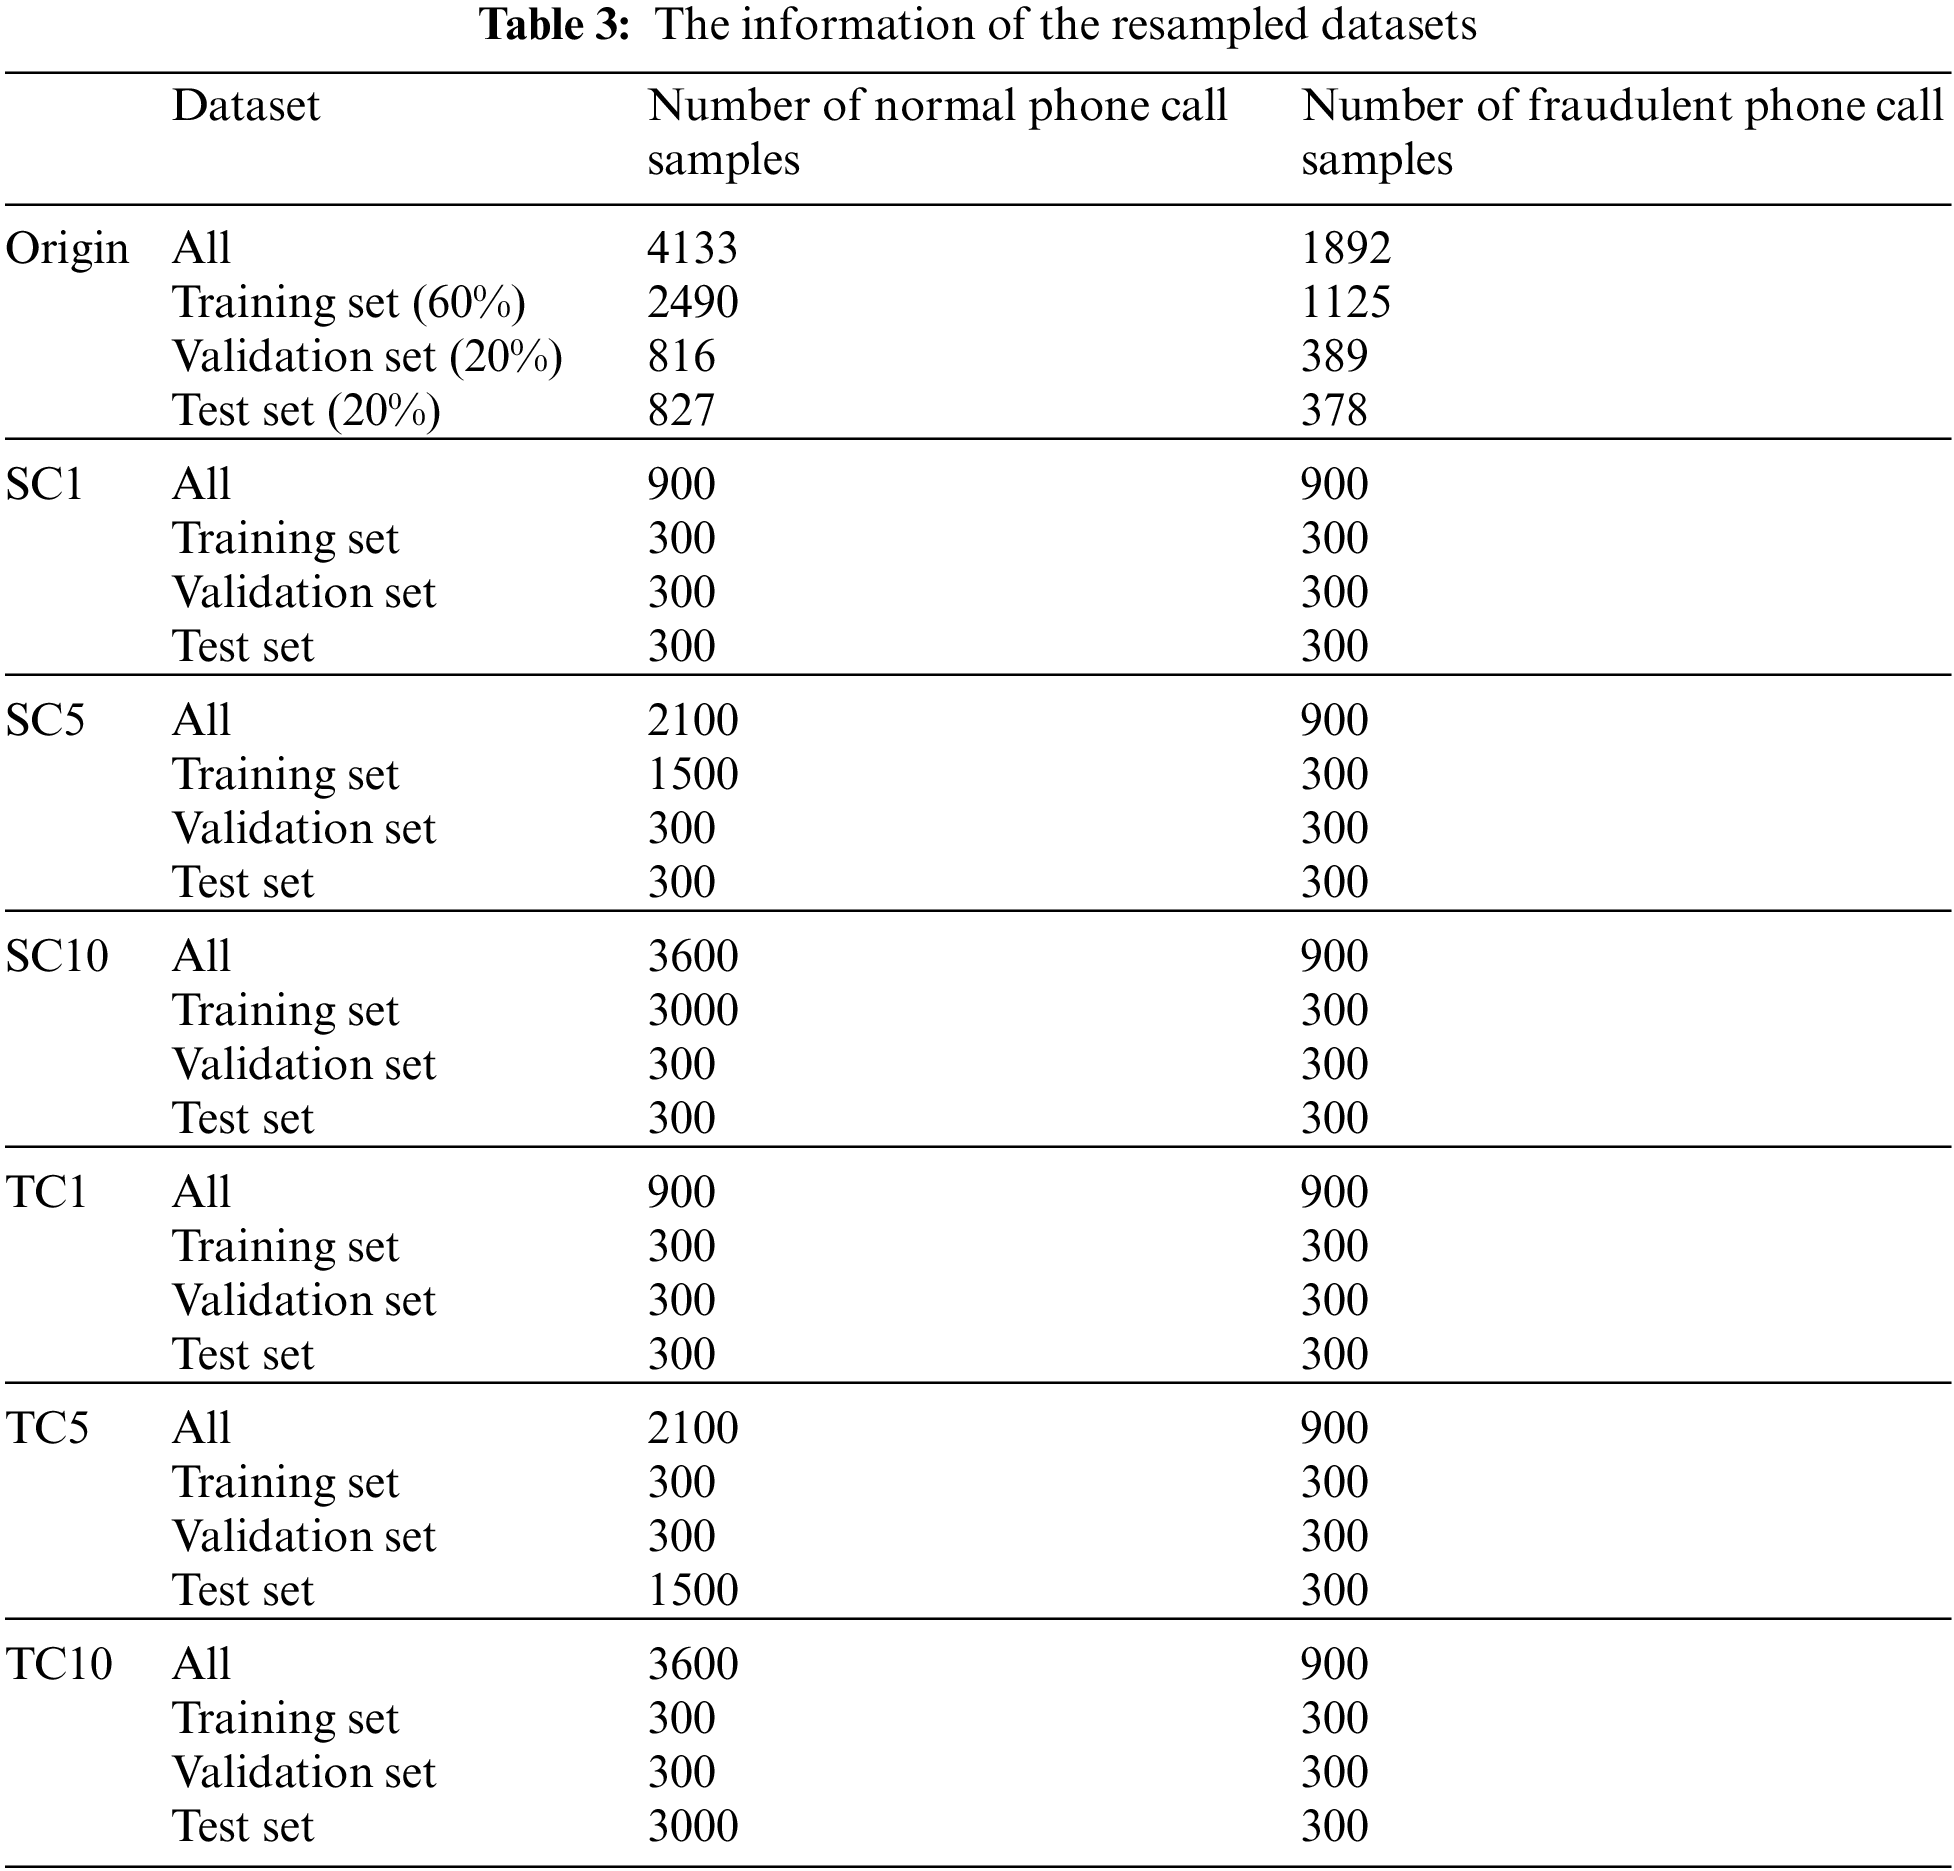
In real-world environments, normal phone calls dominate the whole samples, which is larger than the ratio in our released dataset. We resampled the public dataset and generated six other datasets to simulate the real-world situation, summarized in Table 3. We took the normal phone call samples as negative and fraudulent phone call samples as positive. Due to the number of samples, we only used 900 positive samples chosen randomly in the original dataset. We randomly divided all of the positive samples selected into three datasets for the following experiments: training set, validation set, and test set, with a ratio of 1:1:1, meaning there were 300 positive samples in each set. Meanwhile, in each part, the number of negative samples is 1, 5, 10 times the number of positive samples in the training set and test set, respectively. The ratios of other sets are maintained at 1:1, meaning the number of positive and negative samples is 300. For example, in dataset SC5, the number of negative samples, which is 1500, is five times the positive in its training set. The positive and negative samples in the validation and test sets maintain 300. And in dataset TC5, the number of negative samples, which is 1500, is five times the positive. The number of positive and negative samples maintains 300 with a ratio of 1:1.
The purpose of splitting the test and train set into different sizes is to evaluate the method performance when the sample balance varies. Detailed elaboration is given in the following experiments.
In this section, we evaluate our method on real-world telecom datasets. All experiments are implemented by Tensorflow, and all models are running on python 3.8.15, 1 NVIDIA T600 Laptop GPU, 16 GB RAM, 14 cores Gen Intel(R) Core(TM) i7-12700H 2.30 GHz Windows 11.
To verify the effectiveness of CDR2IMG, we compare it with classic methods used in the fraud detection area, including both traditional machine learning and deep learning approaches.
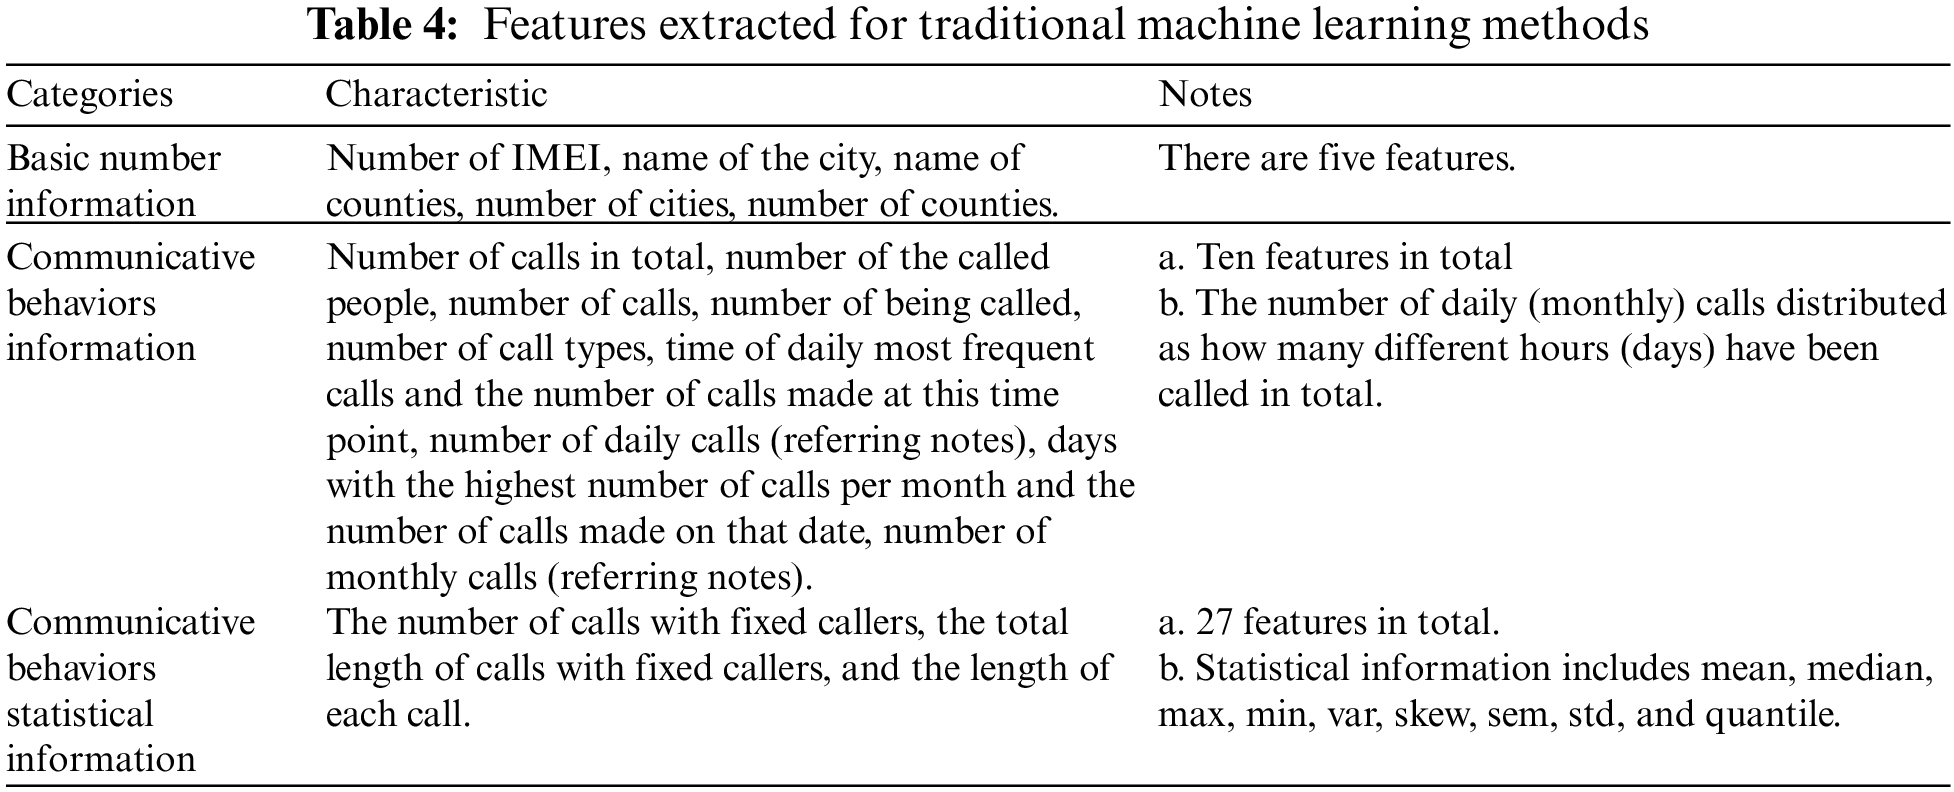
Traditional methods include SVM [36], Logistic Regression (LR) [37], and RF [38], which are widely used in the industry. We use four different kernels on SVM: linear kernel, poly kernel, RBF kernel, and sigmoid kernel. More specifically, we extract 42 features ranging from basic number information to communicative behaviors statistical information from USER and VOC subsets and feed them into previously mentioned traditional machine learning methods. Detailed information on the features is summarized in Table 4.
Deep learning methods include a one-dimensional convolutional neural network (1D-CNN) and the BTG [16]. The input of 1D-CNN is the extracted features shown in Table 4 which is the same as traditional machine learning methods, and the architecture of it is the same as our proposed CNN architecture shown in Table 1, except that we adjust the kernel size from 6 × 6 to 6 since it’s a one-dimensional CNN. The BTG uses the similarity-based method to predict the link and construct the graph after extracting features from the metadata without a graph [16]. Finally, on this basis, the graph convolutional neural network is used to classify fraudulent users. Their method is better than the classic methods in many metrics. We selected scheme 2 (S2) as it performed the best and used the experimental result in the paper.
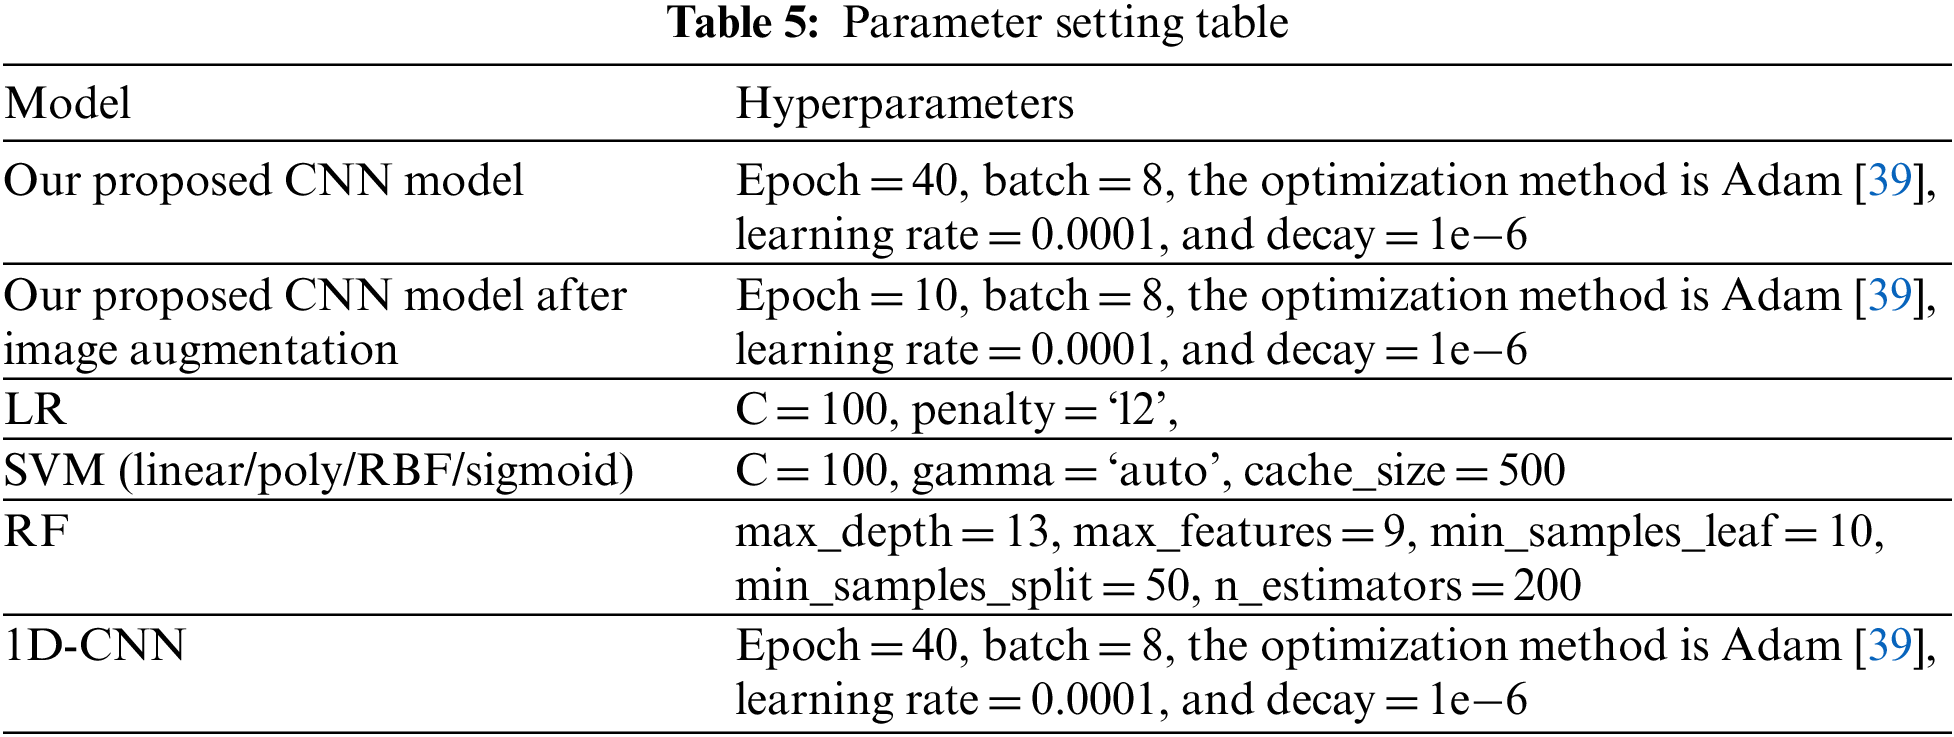
In the experiments, for CDR2IMG models, the performances of the validation set were compared with the number of iterations between 1 to 40 and the batch size between 3 to 10. The hyperparameters with the highest performances were selected as the final set of structures. For the hyperparameters of logistic regression (LR), SVM, RF, and 1D-CNN, details are listed in Table 5 below.
To verify the validity and robustness of our proposed methods, four commonly used evaluation metrics in telecom fraud detection were adopted in our experiments, including precision (P), recall (R), F1-score (F1), and AUC. The equations for each indicator are as follows:
In our experiments, the dataset contains two types of classes, fraud and non-fraud. A true positive (TP) indicates that the sample has been predicted as fraudulent, and it is true. Similarly, a true negative (TN) properly denotes a non-fraudulent telephone number. A false positive (FP) indicates that a non-fraud telephone number is classified as fraud, whereas a false negative (FN) means that fraud is classified as non-fraud. As for the terms in AUC,
Among these four measures, precision and recall are selected to evaluate the model from predictive and realistic perspectives, respectively. The F1-score is brought out to consider these two contradictory measures simultaneously. As proven in [17], the AUC can better evaluate the classifier performance than accuracy, as it eliminates the influence of the manually selected threshold for the model and works well on imbalanced datasets.
As shown in Table 3, the proportion of positive and negative examples in the original dataset is about 2:1, so a severe category imbalance problem doesn’t exist in the first experiment. In the second experiment, we intend to explore the imbalanced issues in telecom fraud detection, so we pay more attention to metrics like F1-score and AUC, which can better describe models when data are imbalanced.
4.4 Experimental Results and Analysis
In the experiments, we vary the size of the training set among 10%, 20%, 40%, and 60% of total samples and leave out 20% and 20% from the data as the validation set and test set, respectively, which is the same set as [16]. We choose the ratios mainly because we want to verify our method’s performance and stability when data becomes less and compare it with the state-of-the-art method BTG [16]. Table 6 shows the results of CDR2IMG and other approaches on AUC, Recall, Precision, and F1. The best-performing methods are in bold, and the second-best ones are underlined.
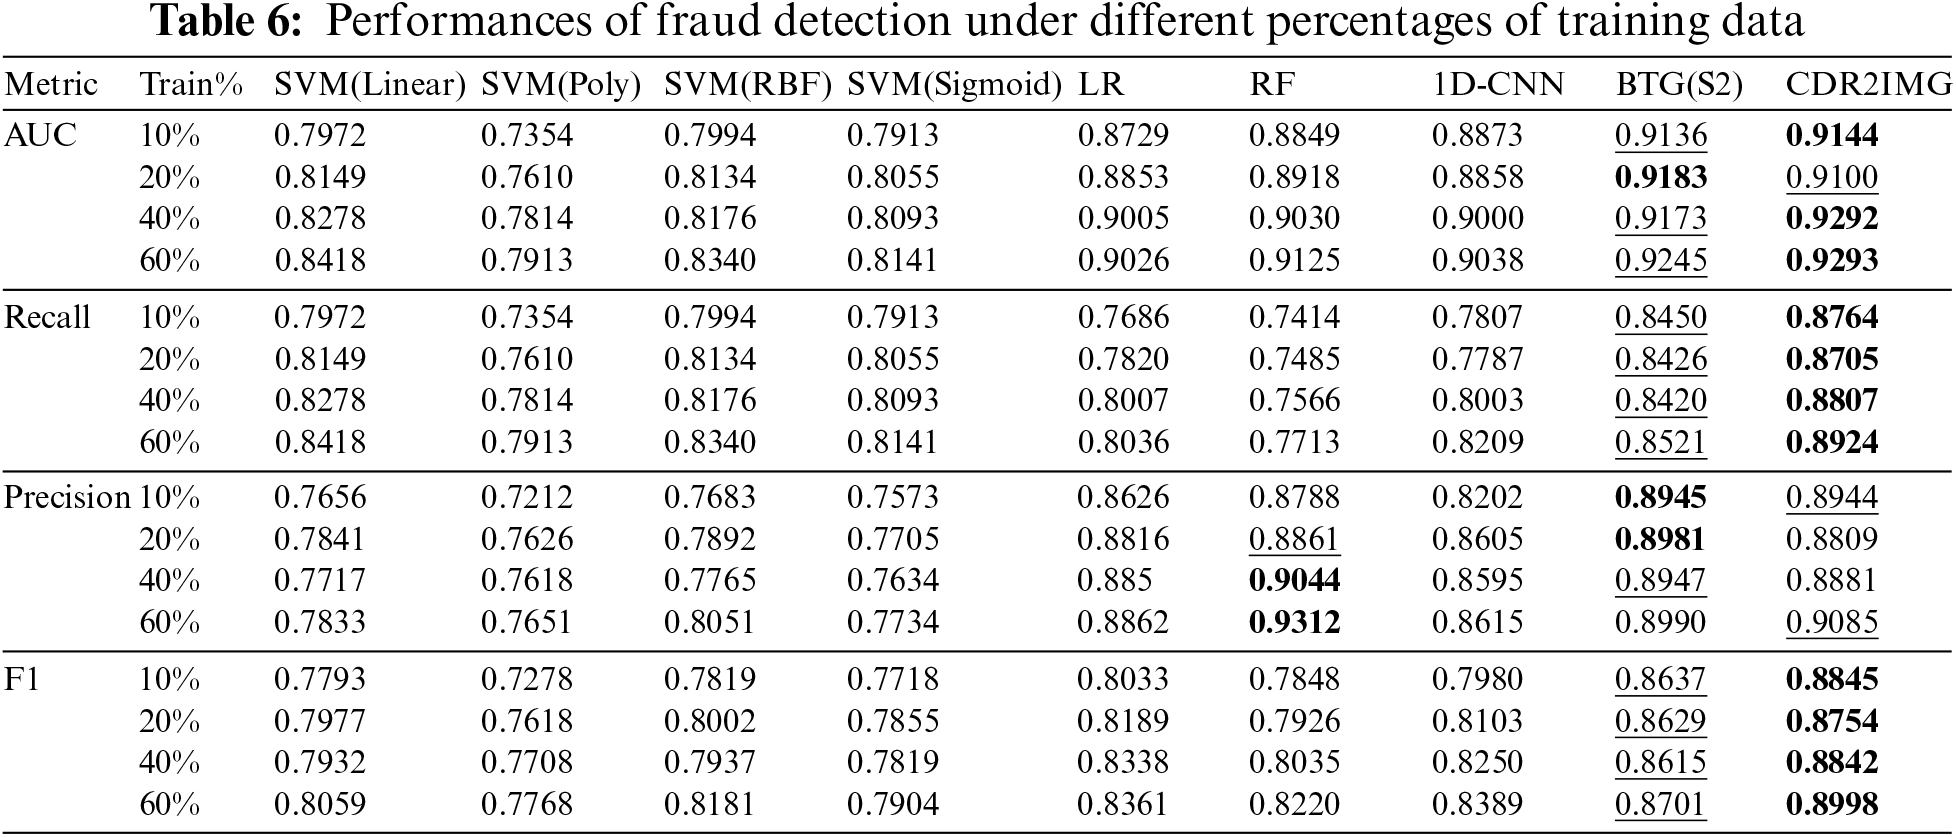
As can be seen, our model outperforms other baseline methods under most of the training sizes and metrics. Although when the training set is 20%, our approach is slightly lower than the best method with precision metric and AUC metric, the overall performance is relatively balanced. As shown in Fig. 2, we believe the high performance is achieved by CDR2IMG transformation, making it easier to capture the feature, and computer vision methods capture features more powerfully. For example, when extracting behavioral features from CDR, hand-design features usually extract the number of vocal calls within an hour, a day, or a week [16]. However, our method can detect the rule behind the number of calls with more flexibility as it does not limit the observation of the data in a specific period.
From the experimental results, deep learning methods don’t fluctuate much as the proportion of the training set changes. When the quantity of the training set is 10%, 20%, 40%, and 60% of the total dataset, the four evaluation metrics’ fluctuation ranges are roughly 0.02 with BTG (S2) [16] and our method, and about 0.04 with the 1D-CNN while SVM using poly kernel has a huge fluctuation when training data decrease to 10%, which shows the stability of the proposed method.
As for the detection performances, we can observe that CDR2IMG and BTG (S2) [16] dominate almost all the best and the second-best scores under all metrics with different training set proportions, except when it comes to the precision metric, RF ranks the best when the training set proportion is 40% and 60% and ranks the second-best when the ratio is 20%. However, their recall metric and F1-score are far better than RF’s.
The last two columns in Table 6 summarize the experiment results of BTG (S2) and CDR2IMG. While the precision of BGT (S2) [16] is slightly higher than CDR2IMG by an average score of about 0.004, CDR2IMG outperforms BTG (S2) [16] in terms of AUC, recall, and F1 score by an average score of about 0.002, 0.035 and 0.0214, respectively. This result makes sense as BTG (S2) only learns from the limited features designed by domain experts. In contrast, CDR2IMG extract features directly from the raw data with less information loss, considering the CDR’s full contexts. Moreover, it is worth mentioning that by doing so, CDR2IMG can adapt to the fast-changing schemes of fraudsters which is hard for a feature engineering-based approach like BTG [16].
It shows that CDR2IMG performs the best overall with decent stability as the proportions of the training set vary. Besides, it indicates that CDR2IMG can extract the difference between inputs even in a small training set, which is worth noting in the telecom fraud detection area as it lacks labeled data.
4.4.2 Stability of Sample Balance Evaluation
In this study, we evaluate well-performed models on our six imbalanced datasets, namely, SC1, SC5, SC10, TC1, TC5, and TC10, to assess the stability of their generalization capabilities. More specifically, models are CNN, LR, SVM with linear and RBF kernel, and RF. As mentioned in Section 4.1.2, we experiment with CDR2IMG in different sample equilibriums in the train and test set to test its performance in real-world environments when classes are imbalanced. AUC value and F1 score are selected to evaluate the models’ performances. The results are presented in Fig. 3.
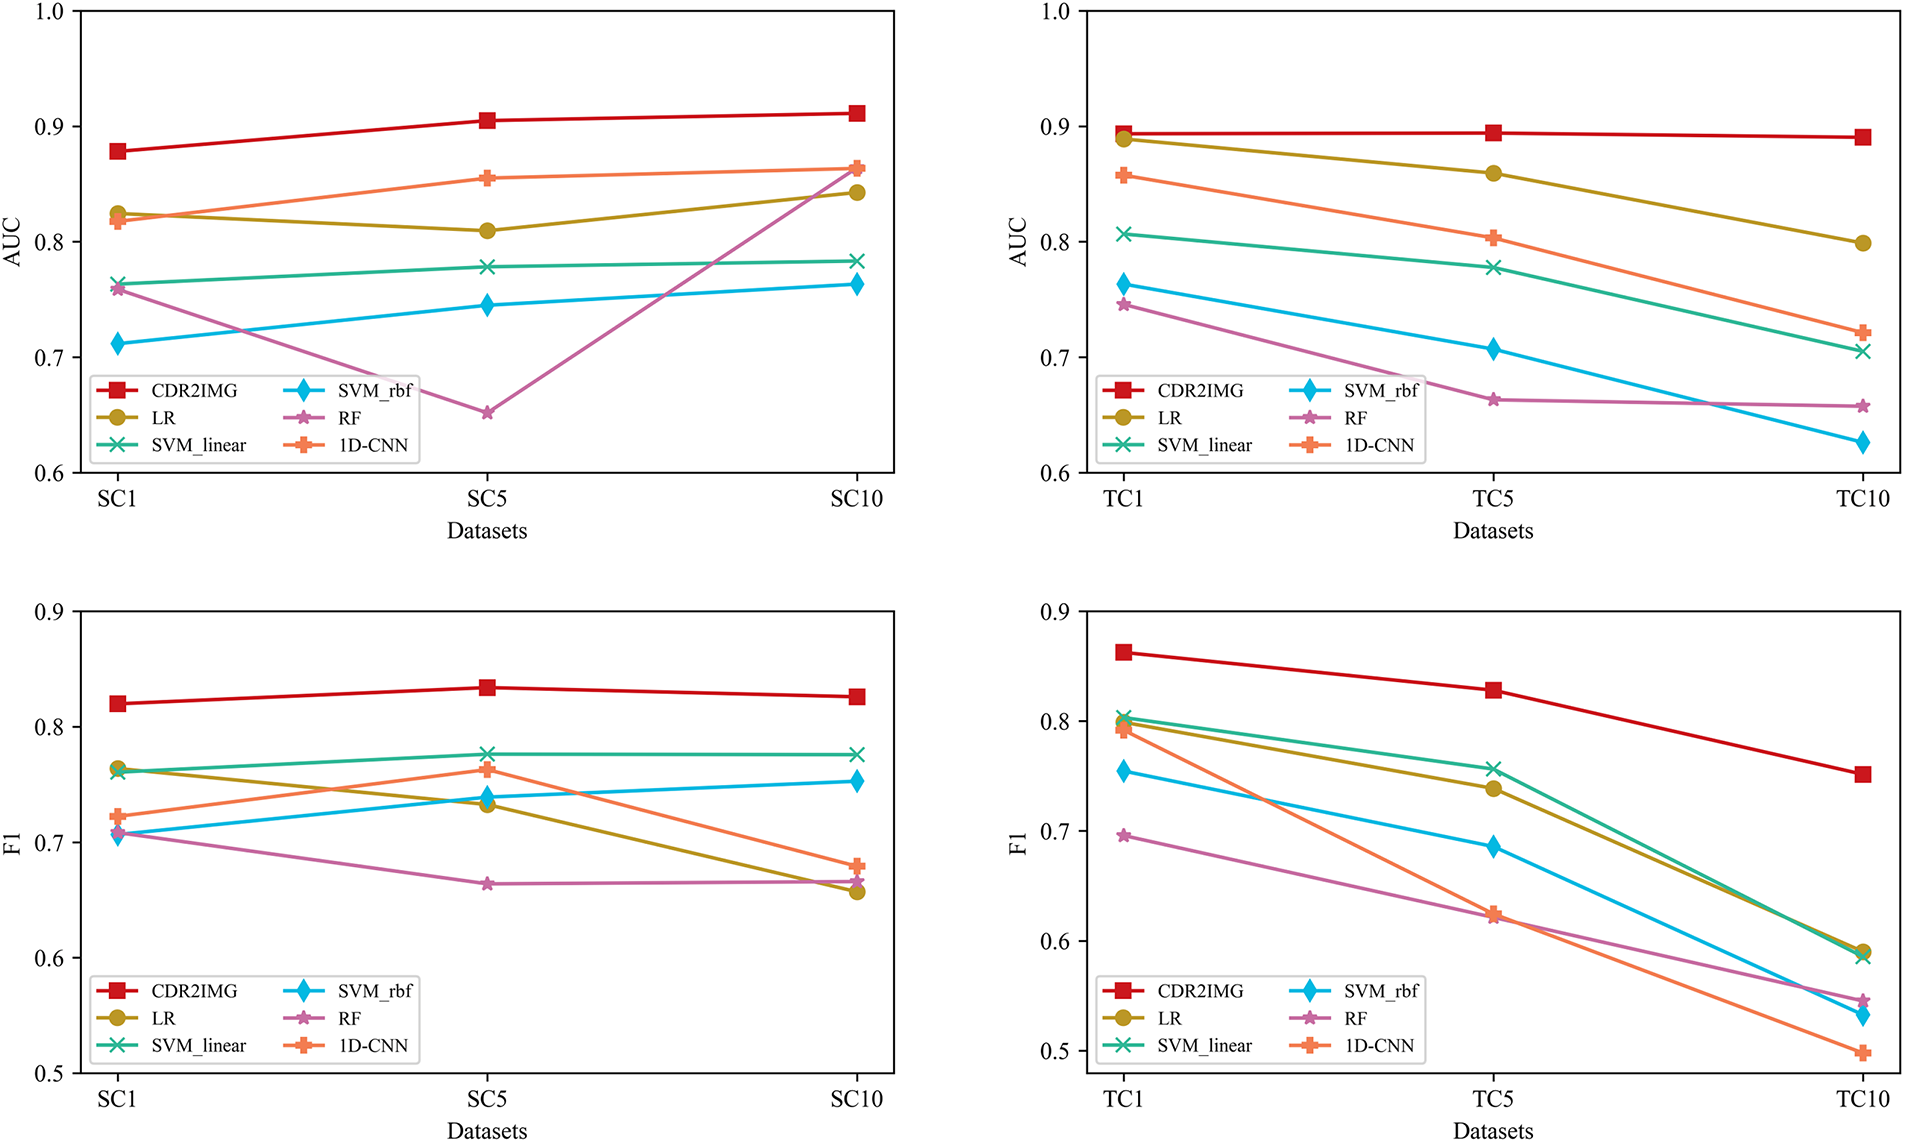
Figure 3: Traditional machine learning method vs. CDR2IMG on our six new datasets
As shown in Fig. 3, our proposed approach is stable in the case of class imbalance. Regarding AUC metrics, we observe that all models tested except Random Forest are relatively stable, and our approach performed best when the ratio of the training set varied. As the ratio of negative training data increases, our model performs better, which may be caused by the sample increase enabling our model to capture more features of negative samples. When the ratio of the test set varied, only our model remained stable. In contrast, other models’ AUC metrics kept dropping, indicating that our method has a better generalization ability. As for the F1-score metrics, our method still performs the best and the most stable in all datasets, while 1D-CNN had a significant drop when the test set varied.
4.4.3 Computer Vision Methods Exploration
As mentioned in Section 3.2.1, we can utilize well-developed methods in computer vision to improve the performance after turning the text data into image-like matrixes. We adopt image augmentation as an example in our experiment.
From Fig. 4, we can see that image augmentation improves the model’s performance in all metrics except when the training set size is 10%, which means image augmentation is a relatively effective method when the training set size is relatively not small.
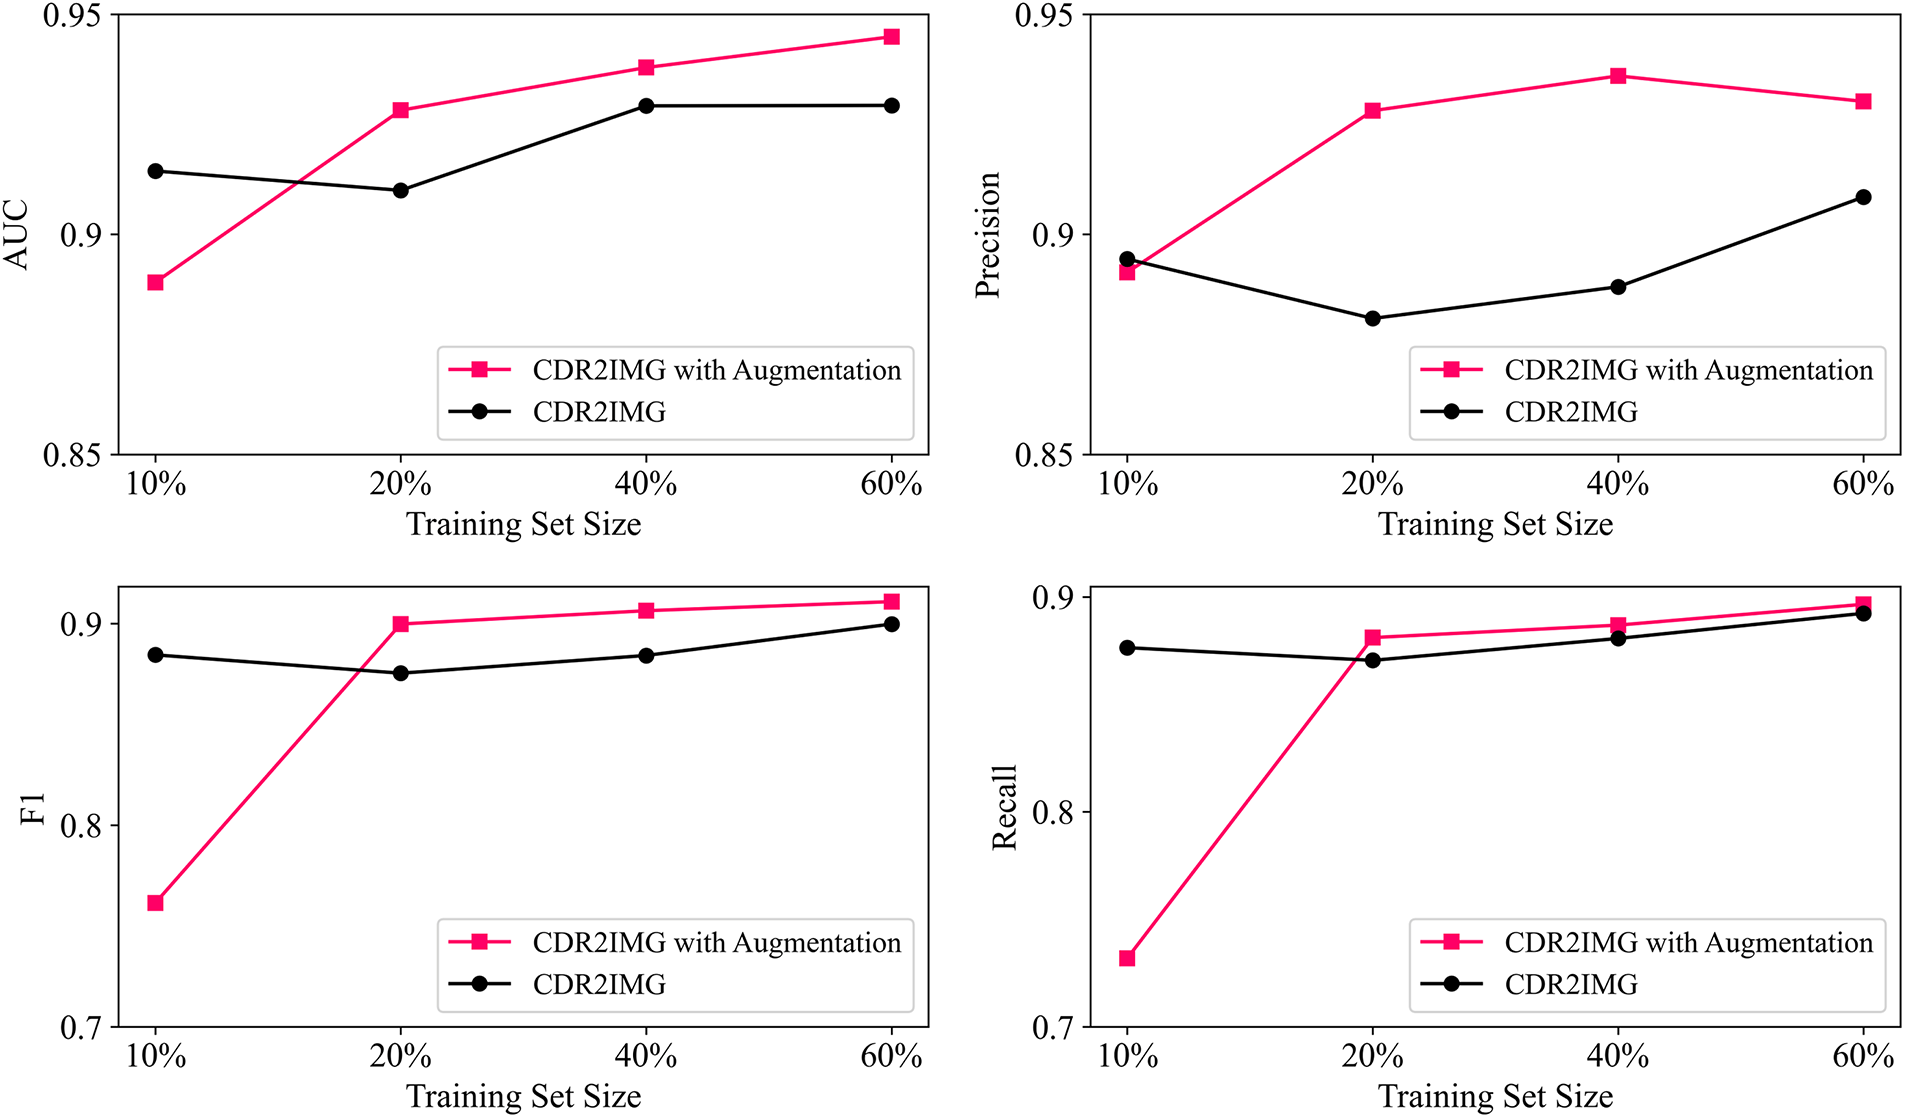
Figure 4: Performances with or without image augmentation with different training set sizes
In this work, we propose a novel approach using TEXT2IMG conversion to solve CDR-based fraud detection, which extends a new dimension to the task by utilizing computer vision techniques. It offers future directions to build a bridge between image-free data and computer vision machine learning, enabling data classification with unique patterns and more powerful detecting methods. This study also provides an end-to-end model without manually designed features to identify new distinguishing features. It has achieved satisfying results on stability regarding different quantities and balance of samples which are two main challenges in the telecommunication detection area. Specifically, the proposed method has achieved 88.45%, 87.54%, 88.42%, and 89.98% F1-score when the training set size is 10%, 20%, 40%, and 60% of the original dataset. When the balance of the dataset varies, the method outperforms all the baseline methods in both F1-score and AUC. To solve the problem of the limited size of publicly available data, we also demonstrate the effectiveness of augmentation techniques based on our TEXT2IMG method, and the method has achieved 76.14%, 89.98%, 90.64%, and 91.09% F1-scores according to the different training set size.
In the future, we will explore the stability of the method over time if there is enough data, which is important because the behavior of fraudsters often changes over time. Besides, a mechanism for a sustainable fraud detection model over time is desperately needed because of the quick change in call behaviors. Furthermore, our method efficiently extracts behavior information from raw CDR automatically, but combining it with interactive information is still an unsolved problem, which we plan as our future work.
We hope the transformation method could be generalized in similar CDR-based problems or other text datasets to discover new features, reduce tedious feature engineering processes, and solve the data shortage problem. Moreover, due to the lack of published CDR datasets that can be used to detect fraud phone calls, we appeal to relevant researchers to make full use of the dataset to provide insights for further research in this area. However, although this dataset is a real-world dataset with reliability, it lacks detailed information about how it was created. Thus, we also call for more publicized fraud detection datasets with detailed building information for better academic research in this area.
Funding Statement: This research was funded by the Double Top-Class Innovation research project in Cyberspace Security Enforcement Technology of People’s Public Security University of China (No. 2023SYL07).
Conflicts of Interest: The authors declare that they have no conflicts of interest to report regarding the present study.
1https://aistudio.baidu.com/aistudio/datasetdetail/40690
2http://www.scdata.net.cn/kfds/pages/index.html
References
1. T. Liu, “Research on network investigation of telecom fraud,” M.S. Thesis, People’s Public Security University of China, China, 2020. [Google Scholar]
2. Truecaller Insights 2022 U.S. Spam & Scam Report—Truecaller Blog. Stockholm, Sweden: Truecaller AB, 2022. [Online]. Available: https://www.truecaller.com/blog/insights/truecaller-insights-2022-us-spam-scam-report [Google Scholar]
3. Report on the Effectiveness of Measures Taken by China’s Ministry of Public Security to Combat Telecommunication Network Fraud. Beijing, China: Information Office of the State Council, 2021. [Online]. Available: http://www.scio.gov.cn/xwfbh/gbwxwfbh/xwfbh/gab/Document/1706955/1706955.htm [Google Scholar]
4. Y. H. Wang, X. D. Cui, X. Y. Wan and Y. P. Dong, Experience and Enlightenment of Telecom Network Fraud Governance. China: Communications World, 2021. [Online]. Available: http://www.cww.net.cn/article?id=491353 [Google Scholar]
5. R. X. Zhao, Telecom Fraud Blamed in Death of College Applicant-Chinadaily.com.cn, Beijing, China: China Daily, 2016. [Online]. Available: https://www.chinadaily.com.cn/china/2016-08/26/content_26600922.htm [Google Scholar]
6. D. Wang, Q. Y. Wang, S. Y. Zhan, F. X. Li and D. Z. Wang, “A feature extraction method for fraud detection in mobile communication networks,” in Fifth World Congress on Intelligent Control and Automation (IEEE Cat. No. 04EX788), Hangzhou, China, vol. 2, pp. 1853–1856, 2004. [Google Scholar]
7. H. Z. Ji, Y. C. Ma, S. Li and J. L. Li, “SVM based telecom fraud behavior identification method,” Computer Engineering & Software, vol. 38, no. 12, pp. 104–109, 2017. [Google Scholar]
8. R. Li, Y. Zhang, Y. Tuo and P. Chang, “A novel method for detecting telecom fraud user,” in 2018 3rd Int. Conf. on Information Systems Engineering (ICISE), Shanghai, China, pp. 46–50, 2018. [Google Scholar]
9. Y. Q. Wang and H. C. Wang, “Research on a combined algorithm for identifying disturbance calls,” Telecommunications Science, vol. 33, no. 7, pp. 112–119, 2017. [Google Scholar]
10. C. Lu, S. F. Lin, X. L. Liu and H. Shi, “Telecom fraud identification based on ADASYN and random forest,” in 2020 5th Int. Conf. on Computer and Communication Systems (ICCCS), Shanghai, China, pp. 447–452, 2020. [Google Scholar]
11. A. Chouiekh and E. H. I. E. Haj, “ConvNets for fraud detection analysis,” Procedia Computer Science, vol. 127, pp. 133–138, 2018. [Google Scholar]
12. J. Xing, M. Yu, S. Wang, Y. Zhang and Y. Ding, “Automated fraudulent phone call recognition through deep learning,” Wireless Communications and Mobile Computing, vol. 2020, pp. e8853468, 2020. [Google Scholar]
13. Y. Jiang, G. N. Liu, J. J. Wu and H. Lin, “Telecom fraud detection via hawkes-enhanced sequence model,” IEEE Transactions on Knowledge and Data Engineering, vol. 35, pp. 1–14, 2022. [Google Scholar]
14. S. M. Gowri, G. S. Ramana, M. S. Ranjani and T. Tharani, “Detection of telephony spam and scams using recurrent neural network (RNN) algorithm,” in 2021 7th Int. Conf. on Advanced Computing and Communication Systems (ICACCS), Coimbatore, India, pp. 1284–1288, 2021. [Google Scholar]
15. S. Y. Ji, J. L. Li, Q. Yuan and J. W. Lu, “Multi-range gated graph neural network for telecommunication fraud detection,” in 2020 Int. Joint Conf. on Neural Networks (IJCNN), Glasgow, United Kingdom, pp. 1–6, 2020. [Google Scholar]
16. X. Hu, H. Chen, S. Liu, H. Jiang, G. Chu et al., “BTG: A bridge to graph machine learning in telecommunications fraud detection,” Future Generation Computer Systems, vol. 137, pp. 274–287, 2022. [Google Scholar]
17. G. J. Chu, J. Y. Wang, Q. Qi, H. F. Sun, S. M. Tao et al., “Exploiting spatial-temporal behavior patterns for fraud detection in telecom networks,” IEEE Transactions on Dependable and Secure Computing, pp. 1–13, 2022. [Google Scholar]
18. C. V. Priscilla and D. P. Prabha, “Influence of optimizing XGBoost to handle class imbalance in credit card fraud detection,” in 2020 Third Int. Conf. on Smart Systems and Inventive Technology (ICSSIT), Tirunelveli, India, pp. 1309–1315, 2020. [Google Scholar]
19. S. Makki, Z. Assaghir, Y. Taher, R. Haque, M. S. Hacid et al., “An experimental study with imbalanced classification approaches for credit card fraud detection,” IEEE Access, vol. 7, pp. 93010–93022, 2019. [Google Scholar]
20. W. Wei, J. J. Li, L. B. Cao, Y. M. Ou and J. H. Chen, “Effective detection of sophisticated online banking fraud on extremely imbalanced data,” World Wide Web, vol. 16, no. 4, pp. 449–475, 2013. [Google Scholar]
21. Q. Chang, S. Lin and X. Liu, “Stacked-SVM: A dynamic SVM framework for telephone fraud identification from imbalanced CDRs,” in Proc. of the 2019 2nd Int. Conf. on Algorithms, Computing and Artificial Intelligence, Sanya, China, pp. 112–120, 2019. [Google Scholar]
22. J. Krupski, W. Graniszewski and M. Iwanowski, “Data transformation schemes for CNN-based network traffic analysis: A survey,” Electronics, vol. 10, no. 16, pp. 2042, 2021. [Google Scholar]
23. A. Alharbi, M. Alshammari, O. D. Okon and A. Alabrah, “A novel text2IMG mechanism of credit card fraud detection: A deep learning approach,” Electronics, vol. 11, no. 5, pp. 756, 2022. [Google Scholar]
24. T. Xu, “Design and implementation of visualization character relationship analysis system based on mining of call records,” M.S. Thesis, Harbin Institute of Technology, China, 2014. [Google Scholar]
25. L. G. Kabari, D. N. Nanwin and E. U. Nquoh, “Telecommunications subscription fraud detection using naïve Bayesian network,” International Journal of Computer Science and Mathematical Theory, vol. 2, no. 5, pp. 1–10, 2016. [Google Scholar]
26. H. Lin, G. N. Liu, J. J. Wu, Y. Zuo, X. Wan et al., “Fraud detection in dynamic interaction network,” IEEE Transactions on Knowledge and Data Engineering, vol. 32, no. 10, pp. 1936–1950, 2020. [Google Scholar]
27. M. Arafat, A. Qusef and G. Sammour, “Detection of wangiri telecommunication fraud using ensemble learning,” in 2019 IEEE Jordan Int. Joint Conf. on Electrical Engineering and Information Technology (JEEIT), Amman, Jordan, pp. 330–335, 2019. [Google Scholar]
28. Y. Wang, J. An and W. Huang, “Using CNN-based representation learning method for malicious traffic identification,” in 2018 IEEE/ACIS 17th Int. Conf. on Computer and Information Science (ICIS), Singapore, pp. 400–404, 2018. [Google Scholar]
29. Z. H. Zhou, L. H. Yao, B. Hu, J. H. Li, C. Wang et al., “Classification of botnet families based on features self-learning under network traffic censorship,” in 2018 Third Int. Conf. on Security of Smart Cities, Industrial Control System and Communications (SSIC), Shanghai, China, pp. 1–7, 2018. [Google Scholar]
30. O. Salman, I. H. Elhajj, A. Kayssi and A. Chehab, “Data representation for CNN based internet traffic classification: A comparative study,” Multimed Tools Applications, vol. 80, no. 11, pp. 16951–16977, 2021. [Google Scholar]
31. K. Millar, A. Cheng, H. G. Chew and C. C. Lim, “Deep learning for classifying malicious network traffic,” in Trends and Applications in Knowledge Discovery and Data Mining, Melbourne, VIC, Australia, pp. 156–161, 2018. [Google Scholar]
32. W. Wang, Y. Q. Sheng, J. L. Wang, X. W. Zeng, X. Z. Ye et al., “HAST-IDS: Learning hierarchical spatial-temporal features using deep neural networks to improve intrusion detection,” IEEE Access, vol. 6, pp. 1792–1806, 2018. [Google Scholar]
33. C. L. Yang, C. Y. Yang, Z. X. Chen and N. W. Lo, “Multivariate time series data transformation for convolutional neural network,” in 2019 IEEE/SICE Int. Symp. on System Integration (SII), Paris, France, pp. 188–192, 2019. [Google Scholar]
34. H. Bunke, P. S. P. Wang and H. Baird, “Document image analysis,” World Scientific, vol. 16, pp. 280, 1994. [Google Scholar]
35. S. Albawi, T. A. Mohammed and S. Al-Zawi, “Understanding of a convolutional neural network,” in 2017 Int. Conf. on Engineering and Technology (ICET), Antalya, Turkey, pp. 1–6, 2017. [Google Scholar]
36. C. Cortes and V. Vapnik, “Support-vector networks,” Machine Learning, vol. 20, no. 3, pp. 273–297, 1995. [Google Scholar]
37. D. R. Cox, “Regression models and life-tables,” Journal of the Royal Statistical Society. Series B (Methodological), vol. 34, no. 2, pp. 187–220, 1972. [Google Scholar]
38. L. Breiman, “Random forests,” Machine Learning, vol. 45, no. 1, pp. 5–32, 2001. [Google Scholar]
39. D. P. Kingma and J. Ba, “Adam: A method for stochastic optimization,” in 3rd Int. Conf. for Learning Representations, San Diego, USA, 2015. [Google Scholar]
Cite This Article
 Copyright © 2023 The Author(s). Published by Tech Science Press.
This work is licensed under a Creative Commons Attribution 4.0 International License , which permits unrestricted use, distribution, and reproduction in any medium, provided the original work is properly cited.
 Downloads
 Citation Tools