
 Submit a Paper
 Propose a Special lssue
 Open Access
ARTICLE

DeepSVDNet: A Deep Learning-Based Approach for Detecting and Classifying Vision-Threatening Diabetic Retinopathy in Retinal Fundus Images
1 College of Information Science and Technology, Hainan Normal University, Haikou, 571158, China
2 Department of Creative Technologies, Air University, Islamabad, Pakistan
3 School of Life Science and Technology, University of Electronic Science and Technology of China UESTC, Chengdu, China
4 School of Science and Technology, University of Management and Technology UMT, Lahore, Punjab, Pakistan
5 Faculty of Computer Science & Information Technology, Al Baha University, Al Baha, Saudi Arabia
6 School of Information Engineering, Qujing Normal University, Qujing, China
* Corresponding Author: Xiaowen Liu. Email:
(This article belongs to the Special Issue: Explainable AI and Cybersecurity Techniques for IoT-Based Medical and Healthcare Applications)
Computer Systems Science and Engineering 2024, 48(2), 511-528. https://doi.org/10.32604/csse.2023.039672
Received 10 February 2023; Accepted 16 June 2023; Issue published 19 March 2024
 View Full Text
 Download PDF
Abstract
Artificial Intelligence (AI) is being increasingly used for diagnosing Vision-Threatening Diabetic Retinopathy (VTDR), which is a leading cause of visual impairment and blindness worldwide. However, previous automated VTDR detection methods have mainly relied on manual feature extraction and classification, leading to errors. This paper proposes a novel VTDR detection and classification model that combines different models through majority voting. Our proposed methodology involves preprocessing, data augmentation, feature extraction, and classification stages. We use a hybrid convolutional neural network-singular value decomposition (CNN-SVD) model for feature extraction and selection and an improved SVM-RBF with a Decision Tree (DT) and K-Nearest Neighbor (KNN) for classification. We tested our model on the IDRiD dataset and achieved an accuracy of 98.06%, a sensitivity of 83.67%, and a specificity of 100% for DR detection and evaluation tests, respectively. Our proposed approach outperforms baseline techniques and provides a more robust and accurate method for VTDR detection.Keywords
The eye is an important and one of humans’ most complex sensory organs. It helps us visualize objects in a light color and depth perception. It comprises various parts, including the retina, iris, pupil, optic nerve, and lens. Any disorder in the eye can cause serious effects, from visual impairment to blindness. Although there are numerous eye disorders, the four most prevalent ones that result in vision loss or blindness are Age-related Macular Degeneration (AMD), Glaucoma, Cataracts, Diabetic Retinopathy (DR), etc. Macular degeneration (age-related macular degeneration) is a retinal disease affecting central vision. It damages the macula, which is the center area of the retina that allows us to see fine details. It is considered the main cause of vision loss in people over 60. Diabetic retinopathy is characterized by continuous harm to the retina’s blood vessels resulting from uncontrolled blood sugar levels. Vision-Threatening Diabetic Retinopathy (VTDR) is the second most occurring retinal disease that can cause blurred vision and blindness in later stages. Generally, the number of DR patients is expected to reach around 439 million by 2030 [1]. DR results from microvascular retinal alterations brought on by diabetes. It is the most significant cause of blindness and visual impairment in the world’s working-age population [2]. Fig. 1 demonstrates several kinds of microvascular damage in VTDR. (a) A microaneurysm produced by ballooning from a weak spot in the microvascular wall. To the observer, this looks like a dot. (b) A hemorrhage is caused by blood leaking from a damaged capillary. To the observer, this looks like a circular blot. (c) An exudate occurs when the capillary wall is excessively leaky, allowing more plasma to escape from the capillary than normal. Because of the pressure, all of the blood in the surrounding capillaries is squeezed out, leaving a white spot. Cotton wool spots occur when puffy white spots on the retina develop due to nerve fiber swelling. This is due to a failure of local capillary circulation, which results in insufficient oxygen and nutrients to the nerve fibers [3].

Figure 1: Retinal images (a) NDPR fundus image with microaneurysms, haemorrhage, and exudate (b) PDR fundus image with abnormal blood vessels (c) normal retina [3]
As indicated in Fig. 2, microaneurysms (MAs), hemorrhages (HEs), hard exudates (HEXUs), as well as soft exudates (SEXUs) are strongly related to DR. Each abnormality indicates the severity of DR in the patient [4].
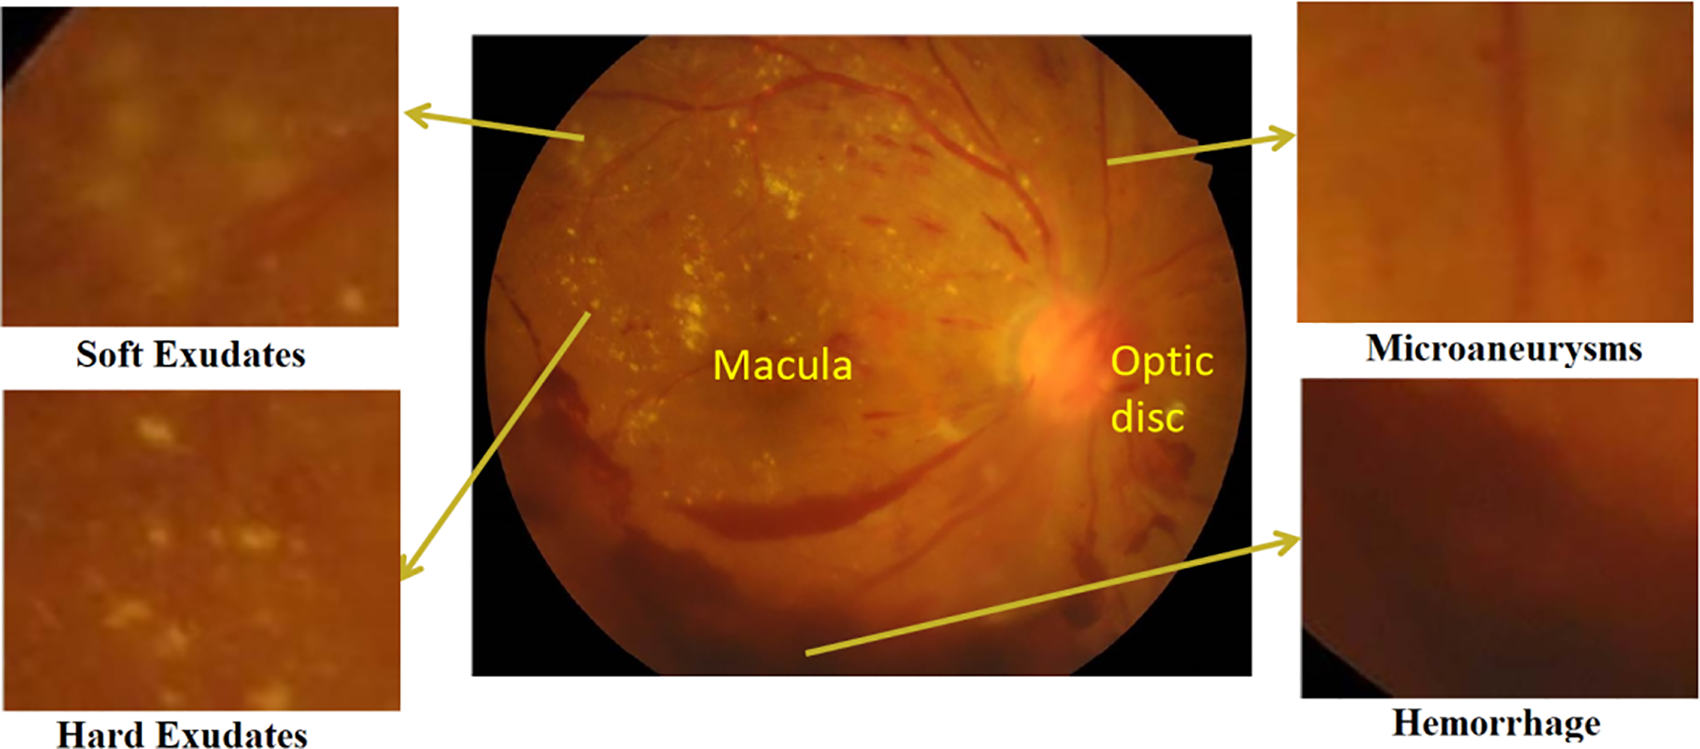
Figure 2: A DR fundus image shows early signs of VTDR, soft exudates, microaneurysms, hard exudates, and hemorrhage [5]
Based on the nature and number of lesions, the severity of VTDR may be categorized into five stages: normal, mild, moderate, severe, as well as proliferative, represented in Fig. 3 [6]. During the first four phases of NPDR, Lesions include MAs, HEs, as well as EXUs [7]. The fifth stage is PDR, distinguished by particular lesions such as retinal neovascularization (RNV) [8].

Figure 3: FIs with different severity of DR
An obstruction or dilatation of the blood vessels in the eye may lead to a condition known as proliferative retinopathy. There are no early warning indications of diabetes-related eye disease, and the damage done to blood vessels cannot be reversed; therefore, early detection plays an important role for diabetic individuals [9]. Furthermore, identifying VTDR is a time-consuming manual procedure requiring an expert clinician to analyze and interpret digital color pictures of the retina’s fundus. The assessment is often delivered a few days later, resulting in missed follow-up, deprived communication, as well as delayed therapy [10]. Even though doctors may efficiently diagnose DR by the occurrence of lesions linked with the disease’s vascular anomalies, the resource needed for DR diagnosis is significant. The requisite skills with sufficient equipment are often missing in places with a large diabetes population, implying that as the number of individuals with diabetes grows, the infrastructure required to prevent VTDR will become less adequate [11,12]. To address these drawbacks, researchers are pursuing automated DR detection using computer-aided diagnostic (CAD)-based methods. Several machine learning algorithms have recently been suggested and established to classify the early diagnosis and severity level of DR. Image processing and data mining approaches are often used to investigate fundus screening. Picture processing methods are often used to extract the retinal FIs characteristics. Data-mining methods are used to create a DL system for the classification; this classifier can detect the illness’s presence in retinal FIs. The applied CAD approaches for DR early diagnosis are familiar as well as beneficial, but they are a significant problem since they are unique in the medical area. Such procedures, however, provide trustworthy and accurate illness diagnostic outcomes [13–16].
With advancements in computer-aided diagnosis (CAD), numerous automated approaches for automatic DR identification and categorization have been presented in recent years. Table 1 summarizes the literature on major approaches for detecting DR.

Table 1 identifies a research gap in the need to improve the detection accuracy of diabetic retinopathy (DR) using automated methods, despite various deep learning and machine learning approaches proposed. Most of these approaches rely on convolutional neural networks (CNNs) for feature extraction and classification, while others utilize SVM and morphological and geometrical properties. However, they face limitations in accuracy, efficiency, and applicability to larger datasets and complex retinal images. To address these limitations, the proposed approach involves preprocessing, data augmentation, feature extraction, and classification stages designed for VTDR detection. A hybrid CNN-SVD model is employed for feature extraction and reduction from retinal fundus images, followed by an improved support vector machine (ISVM) for classifying the five DRs. The study’s significance lies in providing a more accurate and efficient approach to VTDR detection, leading to early diagnosis and effective treatment of this leading cause of visual impairment and blindness worldwide. The performance evaluation includes accuracy, sensitivity, specificity, and F1-score measures, demonstrating the proposed approach’s effectiveness.
The principal findings of the study are as follows:
• Proposed a novel ISVM is combined with the distinct models centered on the majority voting approach, resulting in decreased error proneness.
• After preprocessing and data augmentation, a novel hybrid CNN-SVD model extracted fundus image features. CNN retrieved 256 features from FIs. After that, SVD decreases the number of features to 100 by picking just the most important features, resulting in a simpler model with improved performance.
• The proposed model is evaluated on the IDRID datasets of 516 retinal FIs.
• The proposed methodology can identify disease indicators concurrently, even early signs of disease, and it does not have any problems learning to recognize an image of a healthy eye.
• Calculated the accuracy, sensitivity, specificity, F1-score, and computational time of the model to verify its diagnostic ability.
The remaining parts of the article are structured as described below. In Section 2, we comprehensively explain the research methodology. The “Results and Discussions” section can be found in Section 3, while “Comments on the Proposed Work” can be found in Section 4.
This research provides a new approach for identifying Vision-Threatening Diabetic Retinopathy (VTDR) by utilizing fundus images (FIs) of the IDRiD public dataset and preprocessing methods such as FI scaling, histogram equalization, and contrast stretching to improve the FIs quality. Moreover, data augmentation techniques are used to balance the data set in order to overcome underfitting and overfitting concerns. Subsequently, a unique hybrid CNN-SVD model was developed after preprocessing and augmentation to extract and select the most appropriate feature. As a final step, an enhanced SVM-RBF is used to classify DR into 5 levels. The F1-score and other performance indicators, such as accuracy, sensitivity, and specificity, are used to assess the proposed strategy. The suggested procedure is shown in the flowchart form in Fig. 4.
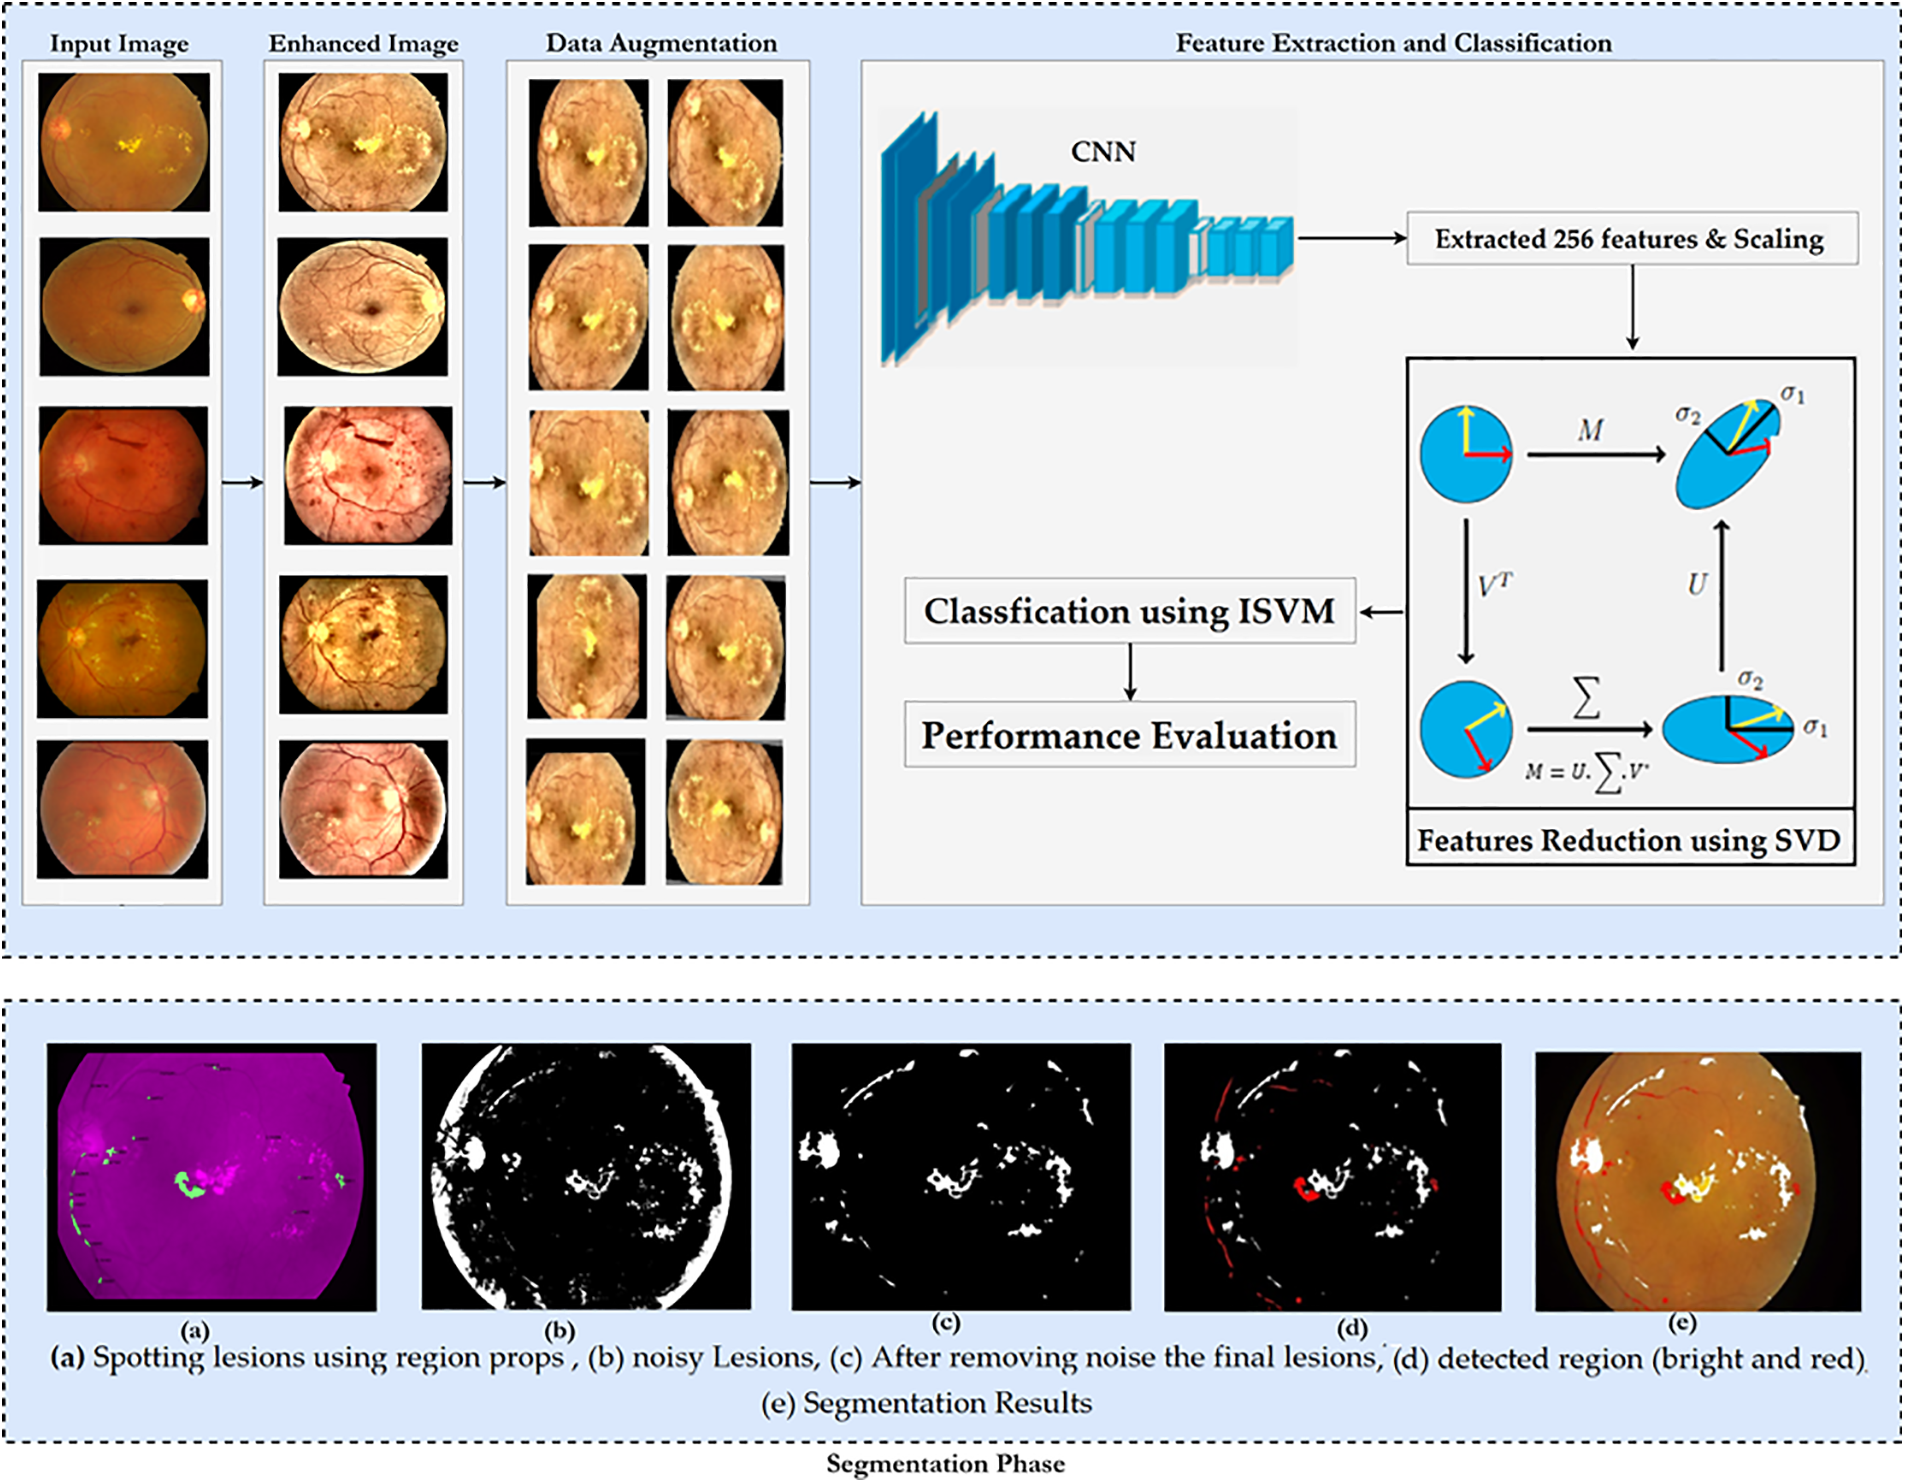
Figure 4: Proposed methodology
2.1 Preprocessing and Data Augmentation
Problems arise due to the blurred or non-clear images of the dataset. Pre-processing aims to enhance image data by reducing unwanted distortions and emphasizing essential features for subsequent processing [25]. Different steps for preprocessing images are performed, i.e., retinal images are converted to RGB as an inverse YCbCr transformation. Contrast Limited Adaptive Histogram Equalization (CLAHE) mitigates noise over-amplification from AHE by limiting contrast enhancement. After successful preprocessing, avoiding overfit and generalization problems is considered one of the most fundamental characteristics of the efficient processing of AI models [28]. Augmentation refers to creating new images based on existing images in the dataset. The number of images would be increased by applying data augmentation techniques, i.e., vertically and horizontally rotating and flipping, cropping and resizing
• Rotation: Images revolved at random from 0–360 degrees.
• Shearing: Sheared with an angle randomly ranging between 20 and 200 degrees.
• Flip: Images were flipped in both the horizontal and vertical directions.
• Zoom: Images were extended randomly in the (1/1.3, 1.3) range.
• Crop: Randomly selected images were scaled to 85% and 95% of their original size.
• Translation: Images randomly shifted between −25 and 25 pixels in both directions.
Fig. 4 displays several examples of post-augmentation images.
2.2 Feature Extraction and Reduction by CNN-SVD from FIs
In this section, we intend to use a basic convolutional neural network (CNN) to learn as many FI features as possible. The model’s classification performance will be improved if the fundamental properties that distinguish between the various DR stages are extracted. That is why we used a simple CNN model. Fig. 5 depicts the CNN feature extractor in its configuration. Features generated by CNN layers, batch normalized and max-pooled, efficiently classify VTDR stages [27]. Batch normalization speeds up modeling and improves performance by adjusting inputs. Max-pooling extracts relevant features from processed images [28, 29]. Dropout prevents overfitting and accelerates training. The Adam optimizer was chosen for its performance with large datasets [30]. The final dense layer extracts 256 distinct attributes from each image. After the feature extraction stage using the hybrid Convolutional Neural Network (CNN), the extracted features are subjected to dimensionality reduction using Singular Value Decomposition (SVD). This step aims to reduce the feature space while preserving the most informative aspects of the data, thereby facilitating more efficient and effective classification.
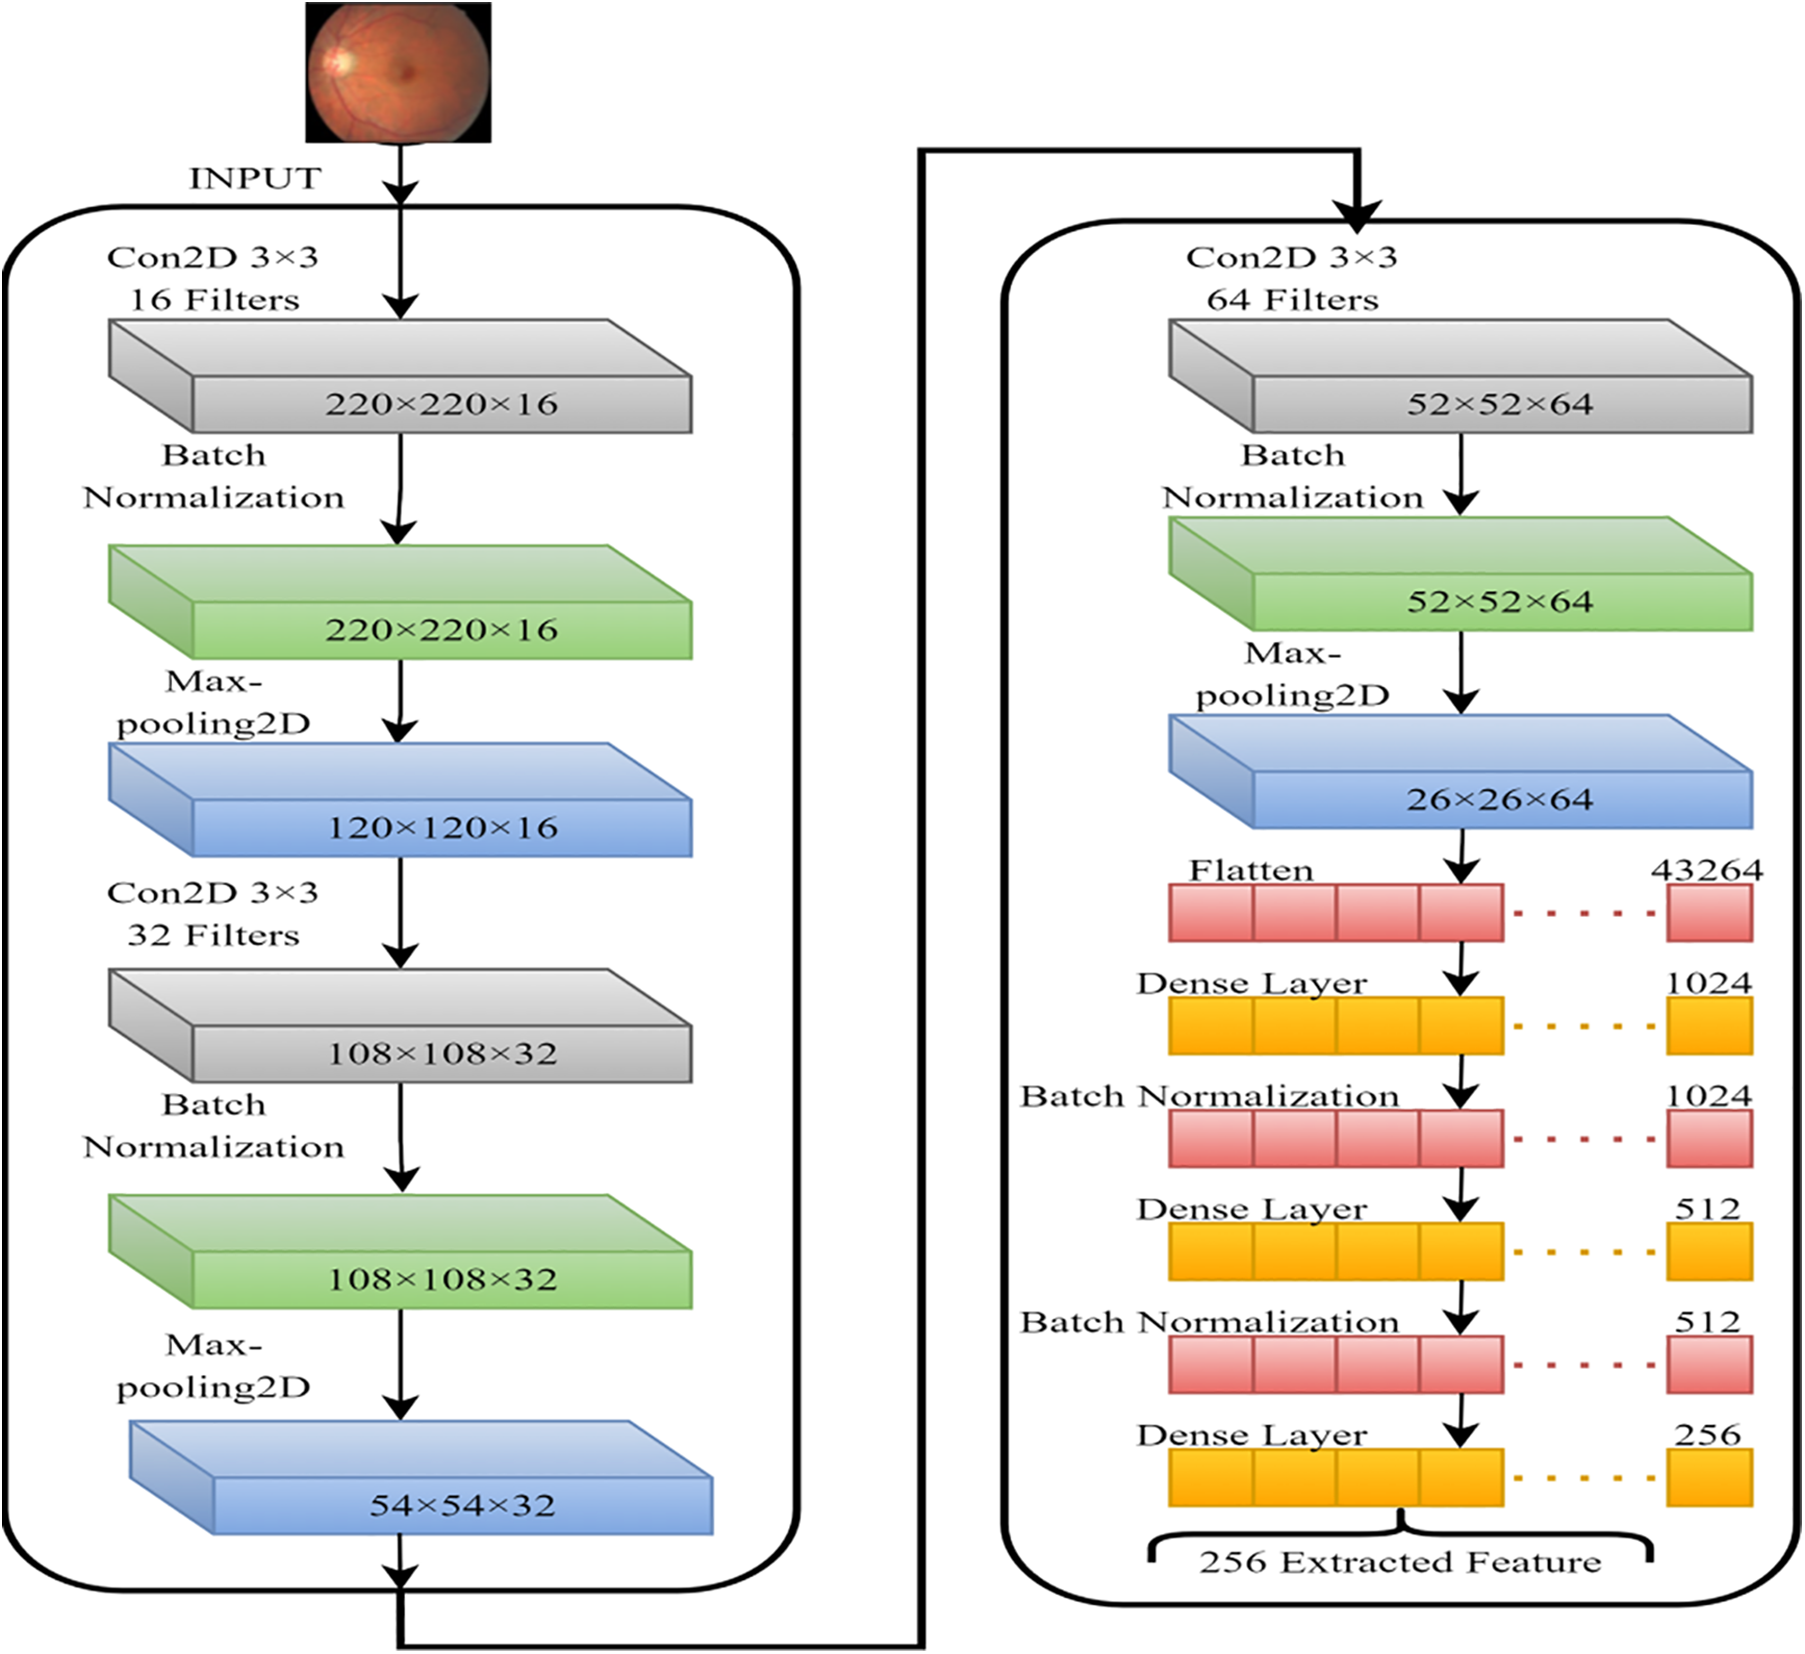
Figure 5: CNN model for the features extraction from FIs
2.3 Working Mechanism of Novel ISVM-RBF
The new ISVM-RBF is defined as variation aggregation that can be used for regression and classification. Unlike traditional statistic-based parametric classification methods, the ISVM-RBF is non-parametric. Even though the SVM has become one of the most commonly used non-parametric machine learning processes, its performance suffers when there are many data samples. As a result, the new ISVM-RBF improves change detection efficiency and accuracy. Furthermore, no assumptions about data distribution are required. When the data cannot be classified as linear or nonlinear, a nonlinear ISVM-RBF uses functions to reduce the computational burden. This is commonly referred to as a kernel trick. Two common examples of SVM-RBF transfers input variables to a high-dimensional feature space using a pre-selected nonlinear mapping function in nonlinear separating conditions, generating a better classification hyperplane. In the preceding example, the SVM-RBF Variants will find a hyperplane with the same properties as the straight line. Four kernel functions are heavily utilized. However, we only used radial basis function variations in our study (Gaussian variants).
As a result, the enhanced ISVM-RBF now includes parameters. The parameter is used to implement the function. It is critical to have a parameter that determines the adjustment between the predicted function and the lowest fitting error. As a result, the ISVM-RBF can be calculated in the following Eq. (1):
ISVM-Linear attributes are represented by
The SVM-RBF may integrate binary classifiers method based on one vs. all. The one alongside all approach generates one binary classifier for each class in a k classification issue. All specimens of the class have
K-NN is a supervised machine-learning technique frequently used to solve regression and classification tasks. The K-neighbor nearest is a simple algorithm that keeps track of all available samples and finds new samples with the majority votes from its k-neighbors. The majority votes of the k-nearest neighbors determined by a distance function are used to classify an object. The distance can be Euclidean, Manhattan, Hamming, and Minkowski distances.
The decision tree is a supervised learning technique used chiefly for categorical and continuous data classification. The data samples are classified into two or more homogeneous subgroups. A decision tree is a directed graph with a root node at the top. The tree is then split into two or more leaf nodes, indicating the classes/categories the tree may categorize. A node is divided into two leaf nodes based on various decision tree criteria. Chi-Square is a widely used decision tree-splitting method. It determines the statistically significant differences between parents and child nodes. It may be quantified in the following manner.
2.6 Performance Evaluation Metrics
Several performance indicators, including sensitivity, specificity, F1-score, and accuracy, are used to assess the efficacy of the proposed [29,30]. Here is an example of how these performance metrics can be expressed mathematically:
Sensitivity: The classifier effectively detects the fraction of true positives during the evaluation. It is calculated using Eq. (4) below:
Specificity: During testing, the classifier accurately detects the ratio of true negatives. It is calculated using the following Eq. (5):
Accuracy: This is the ratio of a classifier’s precise prediction to the label’s actual value during testing. Also known as the correct evaluations to total assessments ratio. To determine accuracy, use Eq. (6) below:
According to Eq. (7), the F1-score represents the harmonic mean value of recall and precision.
2.7 Evaluation of Theoretical Computational Complexity Using Big-O Notation
To evaluate the theoretical computational complexity of the proposed methodology, let us analyze the different components and their potential complexities:
Preprocessing and Data Augmentation: Preprocessing techniques such as scaling, histogram equalization, and contrast stretching typically have a complexity of O (n), where n represents the number of pixels in the image. Data augmentation techniques like rotation, shearing, flipping, zooming, cropping, and translation also have a complexity of O (n) since they operate on individual pixels.
Feature Extraction and Reduction by CNN-SVD: The complexity of the CNN model for feature extraction depends on the number of layers, filters, and the size of the input images. Let us assume the CNN model has L layers and F filters in each layer. The complexity of forward propagation for a single image would be approximately O (L * F * n2), where n is the size of the input image. Singular Value Decomposition (SVD) is typically performed on a matrix and has a complexity of O (r * m * n), where r is the rank of the matrix, and m and n are the dimensions of the matrix.
Working Mechanism of Novel ISVM-RBF: The complexity of the SVM-RBF model depends on the number of support vectors and the dimensionality of the feature space. Let us assume there are S support vectors and D dimensions. The complexity of predicting a single sample using the SVM-RBF model is approximately O (S * D).
K-Nearest Neighbor (KNN): The complexity of the KNN algorithm depends on the number of training samples (N) and the dimensionality of the feature space (D). The complexity of predicting a single sample using KNN is typically O (N * D).
Decision Tree (DT): The complexity of building a decision tree depends on the number of training samples (N) and the number of features (F). The complexity of predicting a single sample using a decision tree is typically O (F).
Considering the above complexities, the overall complexity of the proposed methodology would be determined by the most computationally intensive component. In this case, it would be the feature extraction stage with the hybrid CNN-SVD model, which has a complexity of O (L * F * n2). However, without specific information on the values of L, F, and n, it is challenging to provide a precise evaluation of the computational complexity using Big-O notation.
We assess the efficacy of our strategy by comparing it to prior research on the IDRiD dataset [31]. This dataset contains 516 photos of various pathological states of DR and DME, including 413 training images as well as 103 testing images, as shown in Table 2. As a result, each picture in the IDRiD collection has labels indicating the severity of DR and DME damage. The severity scale divides the DR grade into five groups, and we classify DR according to these five classes. The goal of segmentation masks is to achieve precise spatial accuracy for four types of lesions: hard exudates, soft exudates, hemorrhages, and microaneurysms. Fig. 6 shows an example of FIs with the ground truth masks and the IDRiD dataset.


Figure 6: (a) Fundus images (FIs), (b) hard exudates, (c) soft exudates, (d) hemorrhages, and (e) microaneurysms
The Matlab programming environment was used for all experiments. We used an Intel Core i7 7th generation CPU, a 1 TB SSD, and 32 GB of RAM. In this section, we emphasize the main outcomes of the classifier results, time complexity, and image preprocessing. In a separate presentation, the proposed work is contrasted with traditional approaches. The configurations of hyperparameters are illustrated in Table 3.

This section compares the pre-processing results to the classification results. As shown in Fig. 4, the case study findings for illness grade 4 are effectively achieved in the detection zones. Because of the lack of ground truth in the disease classification database, segmentation results cannot be quantified. Table 4 compares the outcomes of various classifiers.

Furthermore, in terms of performance, the mixed model outperforms separate models. ISVM-RBF outperforms all other classifiers, including KNN, DT, SVM-P, and SVM-L. Based on the results, we discovered that the Improved SVM-RBF approaches outperformed other methods. As shown in Figs. 7a–7d, the ISVM-RBF approach predicts more precisely than other methods. A comparison of sensitivity specificity and F1-score is presented.


Figure 7: Comparison of accuracy, sensitivity specificity and F1-score using improved SVM-RBF, KNN, DT, SVM-P, and SVM-L
Table 5 displays the projected PT, which is a critical metric in the image retrieval process. The total time procedure for each image is a combination of processing, training, and testing periods. The PT is divided into two phases: preprocessing and feature extraction, beginning with image reading and ending with feature extraction. Similarly, the training time required to train the entire dataset for individual classifiers. The testing time is made up of predictions and voting from each classifier. On the other hand, this study achieved a projected PT of around 10 s, which is significantly faster.

3.5 Comparison with State-of-the-Art Studies
Table 6 contrasts the proposed study with traditional research in which the authors provided various databases to describe their findings. The metrics used in this comparison are thus a trade-off between accuracy and sensitivity, with some studies focusing solely on accuracy and others on sensitivity. The proposed work improved accuracy and specificity. Only a few studies, however, have achieved the proposed work’s level of sensitivity. Mixed models with a disease severity of 2 had higher F1-scores and sensitivity than models with a disease severity of 1. In terms of time complexity, this algorithm performs reasonably well. Because all image processing processes are included, the pre-treatment technique takes the longest to complete, taking 9.5935 s.

The implementation challenges associated with the proposed methodology in our paper on VTDR detection and classification can be grouped into several categories, including data collection and preprocessing, computing resources, hyperparameter optimization, interpretability and explainability, and model deployment, in collecting a large and diverse dataset of retinal images, preprocessing challenging. Training deep learning models can also require significant computing resources, including GPUs or TPUs, which can be expensive to purchase and maintain. Tuning hyperparameters is essential in proving model performance, but it can be challenging and time-consuming, especially. AI models are often considered black boxes and the model output. Finally, deploying the AI model in clinical settings may require additional challenges, such as ethical and legal considerations, patient privacy, and regulatory compliance. Addressing these implementation challenges requires a collaborative effort between experts in machine learning, clinical practice, and regulatory compliance.
Fig. 4 shows that, as mentioned in [39], the preprocessing technique emphasizes the lesions for detecting DR. Two different algorithms are used to identify the lesions. The lesions’ features are extracted and integrated into a feature vector. The total performance of the voting system is recorded based on the increasing severity threshold for each classifier and the set of metrics for each classifier. The voting system has the highest classification accuracy compared to each classifier. Furthermore, because the clarity of the lesion makes it easy to classify, a higher severity threshold is set to improve the accuracy of all classifiers. Mixed models achieve the highest overall accuracy at a disease severity of 4. (98.79%).
The timely diagnosis and treatment of Vision-Threatening Diabetic Retinopathy (VTDR) is crucial for patients, and technological advancements facilitate this process. In this study, artificial intelligence models were employed to classify the severity of each retinal lesion. Specifically, the paper focuses on detecting and classifying red and bright lesions using three classifiers and a combined voting approach. The proposed method demonstrated superior performance with an accuracy of 98.79% and specificity of 85.4% and 100%, respectively, surpassing the current state-of-the-art. However, it is important to acknowledge the limitations of the proposed approach. The results obtained are influenced by the preprocessing and feature extraction techniques, highlighting a trade-off between critical parameters. Although the hybrid method used in this study yielded positive outcomes, there is still room for improvement. Future research directions could involve expanding the model to predict additional classes beyond VTDR, enhancing the capability of the initial model. Additionally, exploring the use of Generative Adversarial Networks (GANs) to generate high-quality synthetic samples from the original dataset could be beneficial. This would allow for training more powerful models using artificially induced images, eliminating privacy concerns associated with patient-specific data. While this study demonstrates promising results, it is important to recognize its limitations and consider potential avenues for further enhancement and exploration.
Acknowledgement: None.
Funding Statement: This research was funded by the National Natural Science Foundation of China (Nos. 71762010, 62262019, 62162025, 61966013, 12162012), the Hainan Provincial Natural Science Foundation of China (Nos. 823RC488, 623RC481, 620RC603, 621QN241, 620RC602, 121RC536), the Haikou Science and Technology Plan Project of China (No. 2022-016), and the Project supported by the Education Department of Hainan Province, No. Hnky2021-23.
Author Contributions: Conceptualization, A.B.; methodology, A.B.; software, A.B. and A.I.; validation, A.B., H.L., A.A. and T.B.; formal analysis, H.L.; investigation, X.L., M.S., T.B., A.A.; resources, H.L.; data curation, A.B.; writing—original draft preparation, A.B.; writing—review and editing, A.I. and M.S.; visualization, A.B., X.L.; funding acquisition, A.B., H.L. All authors have read and agreed to the published version of the manuscript.
Availability of Data and Materials: The data supporting this study’s findings are available from the corresponding author or Anas Bilal (a.bilal19@yahoo.com) upon reasonable request.
Conflicts of Interest: The authors declare that they have no conflicts of interest to report regarding the present study.
References
1. J. E. Shaw, R. A. Sicree and P. Z. Zimmet, “Global estimates of the prevalence of diabetes for 2010 and 2030,” Diabetes Research and Clinical Practice, vol. 87, no. 1, pp. 4–14, 2010. [Google Scholar] [PubMed]
2. N. H. Cho, J. E. Shaw, S. Karuranga, Y. Huang, D. R. Fernandes et al., “IDF Diabetes Atlas: Global estimates of diabetes prevalence for 2017 and projections for 2045,” Diabetes Research and Clinical Practice, vol. 1, no. 138, pp. 271–281, 2018. [Google Scholar]
3. WHO, Global data on visual impairments, 2012. [Online]. Available: https://www.emro.who.int/controland-preventions-of-blindness-and-deafness/announcements/global-estimates-on-visual-impairment.html#:~:text=18%20April%202012%20%E2%80%93%20Using%20the,(82%25%20over%2050) (accessed on 06/11/2022). [Google Scholar]
4. A. B. Tufail, I. Ullah, W. U. Khan, M. Asif, I. Ahmad et al., “Diagnosis of diabetic retinopathy through retinal fundus images and 3D convolutional neural networks with limited number of samples,” Wireless Communications and Mobile Computing, vol. 18, pp. 1–5, 2021. [Google Scholar]
5. A. Bilal, G. Sun and S. Mazhar, “Survey on recent developments in automatic detection of diabetic retinopathy,” Journal Francais d’Ophtalmologie, vol. 44, no. 3, pp. 420–440, 2021. [Google Scholar] [PubMed]
6. Y. Yang, T. Li, W. Li, H. Wu, W. Fan et al., “Lesion detection and grading of diabetic retinopathy via two-stages deep convolutional neural networks,” in Proc. of Medical Image Computing and Computer Assisted Intervention (MICCAI), Quebec, Canada, pp. 533–540, 2017. [Google Scholar]
7. M. U. Akram, S. Khalid and S. A. Khan, “Identification and classification of microaneurysms for early detection of diabetic retinopathy,” Pattern Recognition, vol. 46, no. 1, pp. 107–116, 2013. [Google Scholar]
8. P. Vashist, S. Singh, N. Gupta and R. Saxena, “Role of early screening for diabetic retinopathy in patients with diabetes mellitus: An overview,” Indian Journal of Community Medicine, vol. 36, no. 4, pp. 247–252, 2011. [Google Scholar] [PubMed]
9. Y. G. Park and Y. J. Roh, “New diagnostic and therapeutic approaches for preventing the progression of diabetic retinopathy,” Journal of Diabetes Research, vol. 2016, no. 1, pp. 1–10, 2016. [Google Scholar]
10. G. S. Scotland, P. McNamee, A. D. Fleming, K. A. Goatman, S. Philip et al., “Costs and consequences of automated algorithms versus manual grading for the detection of referable diabetic retinopathy,” British Journal of Ophthalmology, vol. 94, no. 6, pp. 712–719, 2010. [Google Scholar] [PubMed]
11. N. Maniadakis and E. Konstantakopoulou, “Cost effectiveness of treatments for diabetic retinopathy: A systematic literature review,” Pharmacoeconomics, vol. 37, no. 8, pp. 995–1010, 2019. [Google Scholar] [PubMed]
12. A. Bilal, L. Zhu, A. Deng, H. Lu and Wu N. “AI-Based automatic detection and classification of diabetic retinopathy using U-Net and deep learning,” Symmetry, vol. 14, no. 7, pp. 1427–1446, 2022. [Google Scholar]
13. L. K. Ramasamy, S. G. Padinjappurathu, S. Kadry and R. Damaševičius, “Detection of diabetic retinopathy using a fusion of textural and ridgelet features of retinal images and sequential minimal optimization classifier,” PeerJ Computer Science, vol. 7, pp. 1–21, 2021. [Google Scholar]
14. S. Lal, S. U. Rehman, J. H. Shah, T. Meraj, H. T. Zauf et al., “Adversarial attack and defence through adversarial training and feature fusion for diabetic retinopathy recognition,” Sensors, vol. 21, no. 11, pp. 1–21, 2021. [Google Scholar]
15. X. Zeng, H. Chen, Y. Luo and W. Ye, “Automated diabetic retinopathy detection based on binocular siamese-like convolutional neural network,” IEEE Access, vol. 7, no. 5, pp. 30744–30753, 2019. [Google Scholar]
16. N. Khan, A. Ullah, I. U. Haq, V. G. Menon and S. W. Baik, “SD-Net: Understanding overcrowded scenes in real-time via an efficient dilated convolutional neural network,” Journal of Real-Time Image Processing, vol. 18, no. 5, pp. 1729–1743, 2021. [Google Scholar]
17. X. Pan, K. Jin, J. Cao, Z. Liu, J. Wu et al., “Multi-label classification of retinal lesions in diabetic retinopathy for automatic analysis of fundus fluorescein angiography based on deep learning,” Graefe’s Archive for Clinical and Experimental Ophthalmology, vol. 258, no. 4, pp. 779–785, 2020. [Google Scholar] [PubMed]
18. S. Qummar, F. G. Khan, S. Shah, A. Khan, S. Shamshirband et al., “A deep learning ensemble approach for diabetic retinopathy detection,” IEEE Access, vol. 17, no. 7, pp. 150530–150539, 2019. [Google Scholar]
19. J. de la Torre, A. Valls and D. Puig, “A deep learning interpretable classifier for diabetic retinopathy disease grading,” Neurocomputing, vol. 396, pp. 465–476, 2020. [Google Scholar]
20. W. Zhang, J. Zhong, S. Yang, Z. Gao, J. Hu et al., “Automated identification and grading system of diabetic retinopathy using deep neural networks,” Knowledge-Based Systems, vol. 175, pp. 12–25, 2019. [Google Scholar]
21. A. Bilal, G. Sun, Y. Li, S. Mazhar and A. Q. Khan, “Diabetic retinopathy detection and classification using mixed models for a disease grading database,” IEEE Access, vol. 9, pp. 23544–23553, 2021. [Google Scholar]
22. A. Bilal, G. Sun, S. Mazhar, A. Imran and J. Latif, “A transfer learning and U-Net-based automatic detection of diabetic retinopathy from fundus images,” Computer Methods in Biomechanics and Biomedical Engineering: Imaging & Visualization, vol. 10, no. 6, pp. 1–12, 2022. [Google Scholar]
23. R. S. Rekhi, A. Issac and M. K. Dutta, “Automated detection and grading of diabetic macular edema from digital colour fundus images,” in Proc. of 4th IEEE Int. Conf. on Electrical, Computer and Electronics, Mathura, India, pp. 482–486, 2017. [Google Scholar]
24. A. Bilal, G. Sun and S. Mazhar, “Diabetic retinopathy detection using weighted filters and classification using CNN,” in Proc. of Int. Conf. on Intelligent Technologies (CONIT), Hubli, India, pp. 1–6, 2021. [Google Scholar]
25. D. Marín, M. E. Gegundez-Arias, B. Ponte, F. Alvarez, J. Garrido et al., “An exudate detection method for diagnosis risk of diabetic macular edema in retinal images using feature-based and supervised classification,” Medical Biological Engineering & Eomputing, vol. 56, pp. 1379–1390, 2018. [Google Scholar]
26. A. Kunwar, S. Magotra and M. P. Sarathi, “Detection of high-risk macular edema using texture features and classification using SVM classifier,” in Proc. of Int. Conf. on Advances in Computing, Communications and Informatics, Kochi, India, pp. 2285–2289, 2015. [Google Scholar]
27. O. Perdomo, S. Otalora, F. Rodríguez, J. Arevalo and F. A. González, “A novel machine learning model based on exudate localization to detect diabetic macular edema,” in Proc. of Ophthalmic Medical Image Analysis Int. Workshop, University of Iowa, USA, vol. 3, pp. 137–144, 2016. [Google Scholar]
28. A. B. Tufail, K. Ullah, R. A. Khan, M. Shakir, M. A. Khan et al., “An improved 3D-CNN-based binary and multiclass classification of Alzheimer’s disease using neuroimaging modalities and data augmentation methods,” Journal of Healthcare Engineering, vol. 2022, pp. 1–14, 2022. [Google Scholar]
29. S. F. Qadri, L. Shen, M. Ahmad, S. Qadri, S. S. Zareen et al., “OP-convNet: A patch classification-based framework for CT vertebrae segmentation,” IEEE Access, vol. 9, pp. 158227–158240, 2021. [Google Scholar]
30. S. F. Qadri, L. Shen, M. Ahmad, S. Qadri, S. S. Zareen et al., “SVSEG: Stacked sparse autoencoder-based patch classification modeling for vertebrae segmentation,” Mathematics, vol. 10, no. 5, pp. 796–815, 2022. [Google Scholar]
31. P. Porwal, S. Pachade, R. Kamble, M. Kokare, G. Deshmukh et al., “Indian diabetic retinopathy image dataset (IDRiDA database for diabetic retinopathy screening research,” Data, vol. 3, no. 3, pp. 25–33, 2018. [Google Scholar]
32. B. Harangi, J. Toth, A. Baran and A. Hajdu, “Automatic screening of fundus images using a combination of convolutional neural network and hand-crafted features,” in Proc. of Annual Int. Conf. of the IEEE Engineering in Medicine and Biology Society (EMBS), Berlin, Germany, pp. 2699–2702, 2019. [Google Scholar]
33. X. Li, X. Hu, L. Yu, L. Zhu, C. W. Fu et al., “CANet: Cross-disease attention network for joint diabetic retinopathy and diabetic macular edema grading,” IEEE Transactions on Medical Imaging, vol. 39, no. 5, pp. 1483–1493, 2019. [Google Scholar]
34. D. K Elswah, A. A Elnakib and H. El-Din Moustafa, “Automated diabetic retinopathy grading using resnet,” in Proc. of National Radio Science Conf., Cairo, Egypt, pp. 248–254, 2020. [Google Scholar]
35. P. Saranya and S. Prabakaran, “Automatic detection of non-proliferative diabetic retinopathy in retinal fundus images using convolution neural network,” Journal of Ambient Intelligence and Humanized Computing, vol. 2020, no. 1, pp. 1–10, 2020. [Google Scholar]
36. V. Alcalá-Rmz, V. Maeda-Gutiérrez, L. A. Zanella-Calzada, A. Valladares-Salgado, J. M. Celaya-Padilla et al., “Convolutional neural network for classification of diabetic retinopathy grade,” in Proc. of Advances in Soft Computing: 19th Mexican Int. Conf. on Artificial Intelligence, Mexico, pp. 104–118, 2020. [Google Scholar]
37. C. Bhardwaj, S. Jain and M. Sood, “Hierarchical severity grade classification of non-proliferative diabetic retinopathy,” Journal of Ambient Intelligence and Humanized Computing, vol. 12, no. 2, pp. 2649–2670, 2021. [Google Scholar]
38. J. J. Chandran, J. Jabez and S. Srinivasulu, “Auto-metric graph neural network optimized with capuchin search optimization algorithm for coinciding diabetic retinopathy and diabetic macular edema grading,” Biomedical Signal Processing and Control, vol. 80, pp. 104386–104397, 2023. [Google Scholar]
39. S. Maqsood, R. Damaševičius and R. Maskeliūnas, “Hemorrhage detection based on 3D CNN deep learning framework and feature fusion for evaluating retinal abnormality in diabetic patients,” Sensors, vol. 21, no. 11, pp. 3865–3886, 2021. [Google Scholar] [PubMed]
Cite This Article
 Copyright © 2024 The Author(s). Published by Tech Science Press.
This work is licensed under a Creative Commons Attribution 4.0 International License , which permits unrestricted use, distribution, and reproduction in any medium, provided the original work is properly cited.
 Downloads
 Citation Tools