
 Submit a Paper
 Propose a Special lssue
 Open Access
ARTICLE

Test Case Generation Evaluator for the Implementation of Test Case Generation Algorithms Based on Learning to Rank
College of Biomedical Engineering & Instrument Science, Zhejiang University, Hangzhou, 310000, China
* Corresponding Author: Zhonghao Guo. Email:
Computer Systems Science and Engineering 2024, 48(2), 479-509. https://doi.org/10.32604/csse.2023.043932
Received 16 July 2023; Accepted 04 December 2023; Issue published 19 March 2024
 View Full Text
 Download PDF
Abstract
In software testing, the quality of test cases is crucial, but manual generation is time-consuming. Various automatic test case generation methods exist, requiring careful selection based on program features. Current evaluation methods compare a limited set of metrics, which does not support a larger number of metrics or consider the relative importance of each metric to the final assessment. To address this, we propose an evaluation tool, the Test Case Generation Evaluator (TCGE), based on the learning to rank (L2R) algorithm. Unlike previous approaches, our method comprehensively evaluates algorithms by considering multiple metrics, resulting in a more reasoned assessment. The main principle of the TCGE is the formation of feature vectors that are of concern by the tester. Through training, the feature vectors are sorted to generate a list, with the order of the methods on the list determined according to their effectiveness on the tested assembly. We implement TCGE using three L2R algorithms: Listnet, LambdaMART, and RFLambdaMART. Evaluation employs a dataset with features of classical test case generation algorithms and three metrics—Normalized Discounted Cumulative Gain (NDCG), Mean Average Precision (MAP), and Mean Reciprocal Rank (MRR). Results demonstrate the TCGE’s superior effectiveness in evaluating test case generation algorithms compared to other methods. Among the three L2R algorithms, RFLambdaMART proves the most effective, achieving an accuracy above 96.5%, surpassing LambdaMART by 2% and Listnet by 1.5%. Consequently, the TCGE framework exhibits significant application value in the evaluation of test case generation algorithms.Keywords
Software testing is an important part of the software life cycle. It plays an important role in detecting software bugs and improving software quality. However, the cost of software testing is extremely high. Generally, the cost of performing manual testing accounts for up to 50% of the total development cost [1]. The test case is one of the most important elements in software testing. Therefore, to reduce the cost of testing and improve testing efficiency, studies have been performed on automatic test case generation in recent years.
The quality of the test cases greatly affects the test results [2]. Thus, it is very important to choose the right algorithm for automatic test case generation. Generally, the quality of automatic test case generation algorithms is measured by several specific standards. For example, in unit testing, when considering the generated test cases, statement coverage, branch coverage, path coverage, and number of test cases are typical metrics that are used to measure the quality of those algorithms.
The evaluation of test case generation algorithms generally proceeds as follows. The proposed automatic test case generation algorithm is compared with similar algorithms. First, metrics used to evaluate the test case generation algorithm are chosen. Then, the test case generation algorithm is executed on the assembly, and the effects are measured. Classic but simple programs, such as “triangle.c,” or custom programs are implemented as the assembly. Finally, one method is generally considered to be the superior method based on the metrics results of the evaluation.
However, this method of evaluating the test case generation algorithms has some shortcomings. First, the measurement indicators are not comprehensive. Most studies use only 1–5 features to measure the effect of the test case generation algorithm; however, there are many more measurement metrics used to evaluate test case generation algorithms. For example, there are 6–7 classic metrics pertaining to only the coverage of unit tests. In addition, this measurement method cannot handle partial order features. For instance, when F1A > F1B and F2A > F2B appear in features F1 and F2 of two test case generation algorithms A and B, it is impossible to determine which algorithm is better. Finally, the measurement metrics of existing studies are fixed and not scalable, which does not facilitate the selection of the appropriate algorithm according to the assembly characteristics and testing requirements. The TCGE (Test Case Generation Evaluator) in this study compensates for the above deficiencies.
Therefore, this research aims to construct a framework named TCGE that evaluates test case generation algorithms. The TCGE ranks the algorithms in a list based on L2R (Learning to Rank) technology. In this framework, eight features are incorporated to evaluate the performance of test case generation algorithms more comprehensively. As the L2R algorithm can comprehensively consider eight features, it can select the optimal algorithm, even if some features of the two algorithms have a partial order relation. Considering the differences in the performance of various algorithms on different assemblies, some of the test cases of the algorithms need to be evaluated. Consequently, the TCGE can learn the characteristics of the assembly and testing requirements from the ranked results, such that it can recommend the best test case generation algorithm for the assembly to be tested. In this study, we consider three metrics to evaluate the performance of the TCGE.
The main contributions of this study are as follows:
1. An extensible framework TCGE is constructed for the evaluation of test case generation algorithms. Various test case generation algorithms can be evaluated according to user needs and characteristics of the tested program.
2. Three L2R algorithms are used to construct TCGE, and their performances are compared. The RFLambdaMART, which is proposed in this study with a performance approximately 2% higher than that of the other two methods, is chosen to build TCGE, thereby optimizing its evaluation capability.
3. Four classical test case generation algorithms are evaluated on two types of assemblies, demonstrating the effectiveness of the TCGE.
The remainder of this paper is organized as follows: Section 2 introduces the background and related work of this study, including the test case generation algorithms, evaluation of test case generation algorithms, and development of evaluation systems in various fields. Section 3 describes the framework of the TCGE, introduces the content of each module, and the three L2R algorithms that are to be used with it. Section 4 discusses the experiments addressing the four proposed questions, analyses the experimental results, and demonstrates the effectiveness of the TCGE. In Section 5, the conclusions of this study are presented.
This section describes related works in two areas. One is the evaluation of the effect in the research of automatic generation of test cases. The other is the construction of evaluation systems with a brief introduction of evaluation algorithms.
2.1 Automatic Test Case Generation Algorithms and Evaluation
Research on test case generation techniques began in the early 1970s, and since then, the number of papers in this field has increased, as indicated by review studies [3,4].
The TCGE introduced in this study serves the purpose of evaluating the quality of automated test case generation algorithms. To achieve this, we categorize and introduce current automated test case generation algorithms, selecting a subset of them as the subjects for evaluation to demonstrate the effectiveness of the TCGE. In addition, we will introduce the methods typically used in these studies to evaluate the effectiveness of test case generation algorithms. This will illustrate the necessity of an effective evaluation method for test case generation algorithms. The test case generation algorithm mainly includes the following categories: random test case generation, static test case generation, and dynamic test case generation. The above three test case generation methods are mature and have many outstanding research results. In these studies, researchers used 1–5 features to evaluate the effectiveness of the proposed method and compared it with similar algorithms to illustrate the superiority of the proposed method.
The following three types of these algorithms are used in this study to construct datasets for TCGE training and testing.
2.1.1 Random Test Case Generation
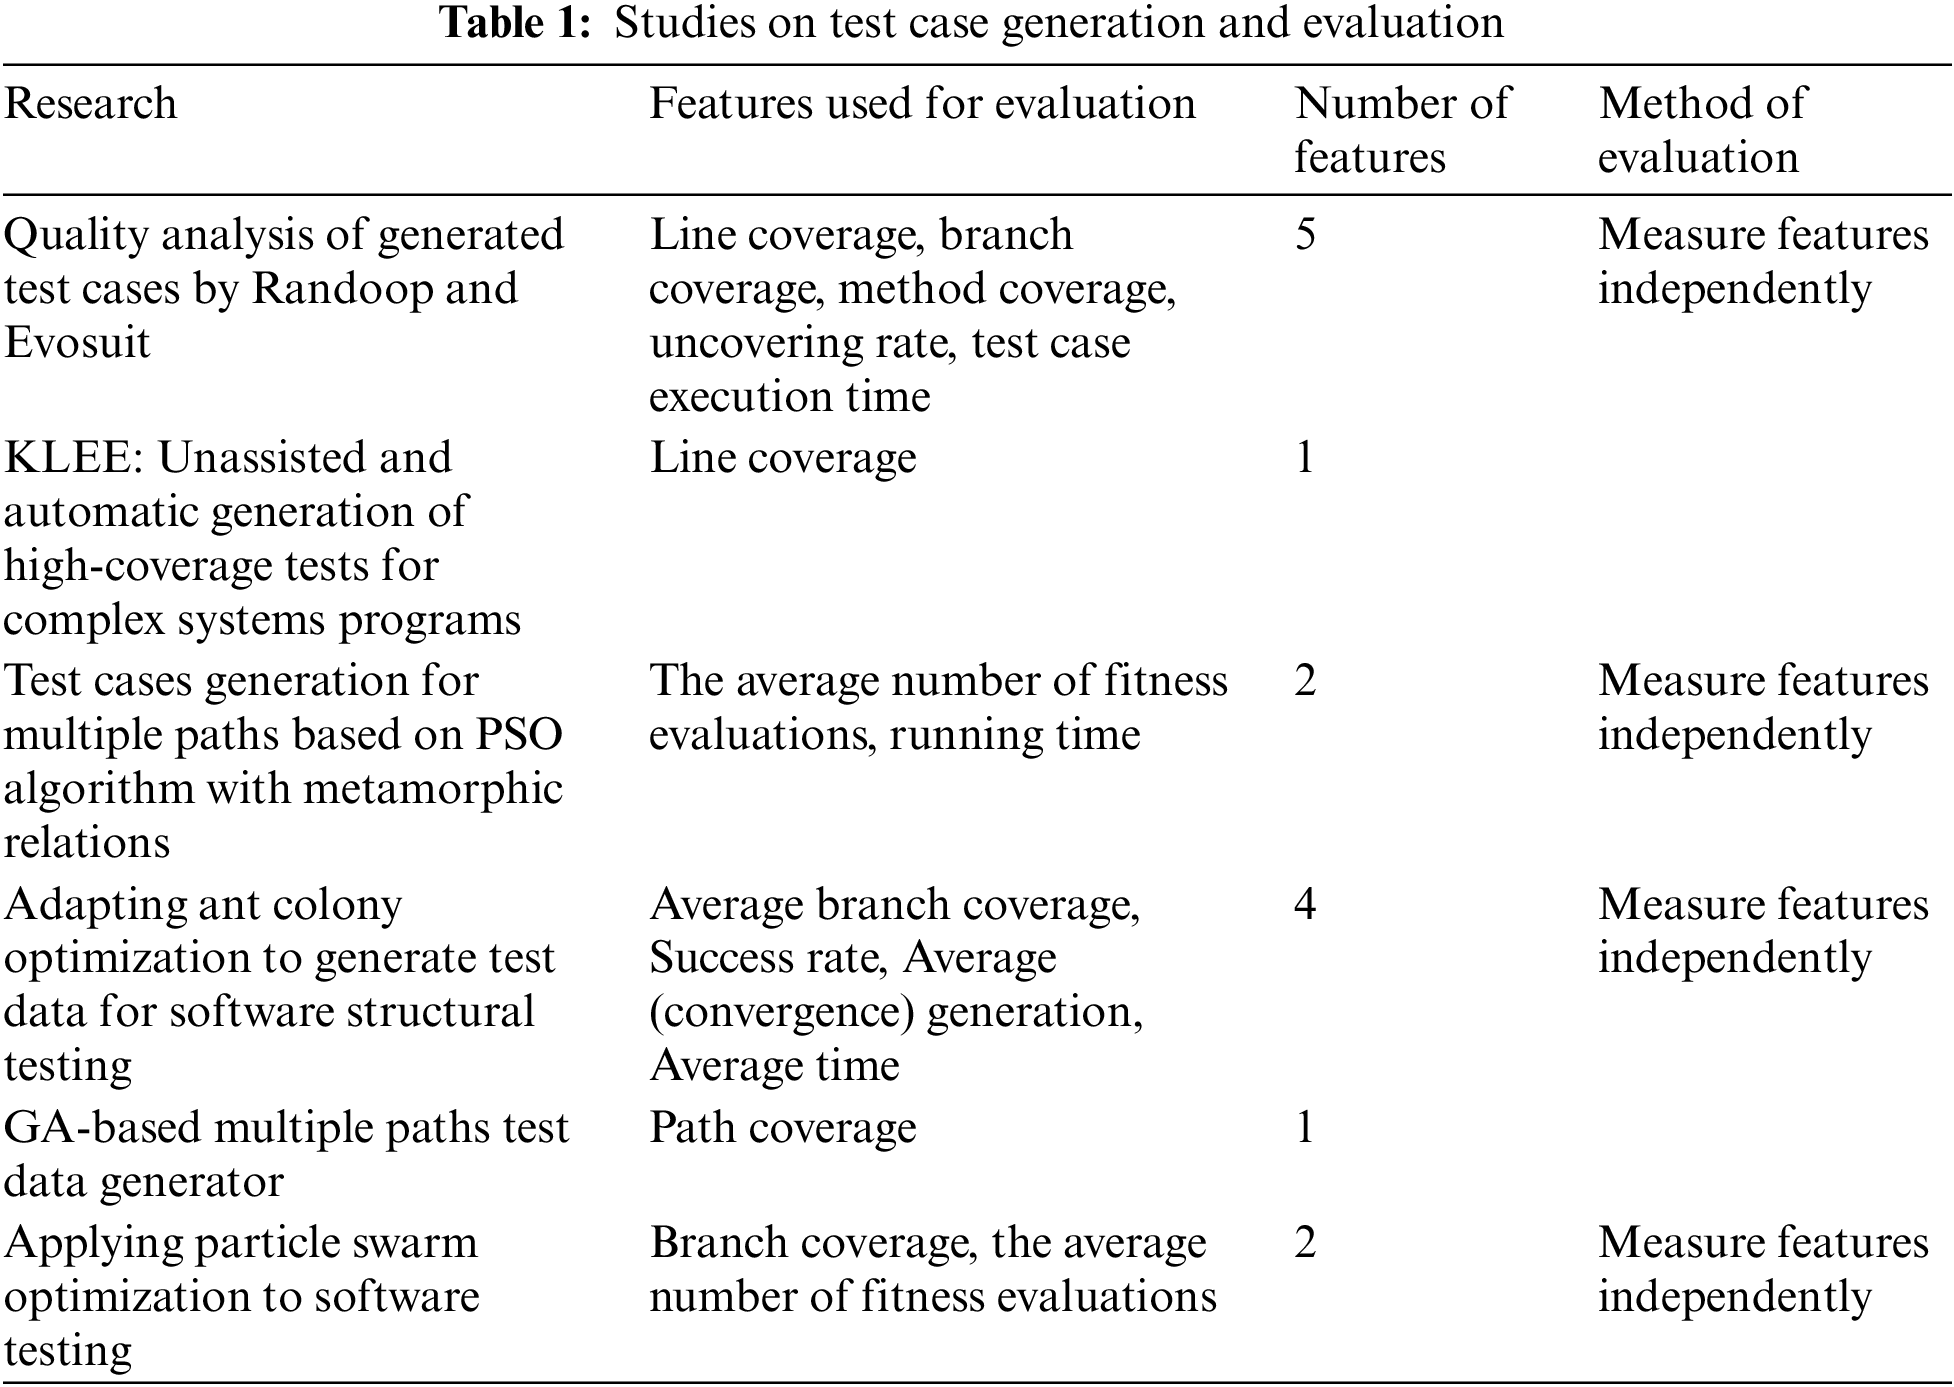
The random test case generation is a typical black box method. It refers to randomly generating values for variables within their value range in the test case, according to certain rules. Then, the test case set is generated by combining the variable values. The research of random test case generation is very mature, and there are some tools available, such as Randoop and PICT. Xiao et al. evaluated the effect of Randoop with Evosuite using five features: line coverage, branch coverage, method coverage, uncovering rate, and test case execution time [5]. The study found that the test cases generated by Evosuite have higher coverage than those of Randoop; however, Evosuite needs longer running time.
2.1.2 Static Test Case Generation
The static test case generation refers to generating test cases only by static analysis of the program without executing the code. In the static method, the most typical research is to complete the task of automatic test case generation based on symbolic execution. Symbolic execution is a program static analysis method that uses symbols, rather than specific values, as input variables to simulate the execution of code and obtain information. In this study, KLEE and enhanced KLEE are used as two automatic test case generation algorithms. Cadar et al. are the developers of KLEE [6]. They compared KLEE with the method of manually generating test cases and use the line coverage to evaluate the effect, finding that KLEE is better than the manual method. However, the measurement feature used in that study is only one (line coverage), which is not sufficiently comprehensive. The renowned tool PYNGUIN [7] is also a static test case generation tool based on symbolic execution. It focuses on generating test cases for Python programs. As the subject of our study involves C programs, PYNGUIN is not discussed in this paper.
2.1.3 Dynamic Testcase Generation
The dynamic test case generation refers to the method of generating test cases under a certain standard using information of the execution process and results of the program. Among the dynamic methods, the most typical method is to generate test cases based on a heuristic search algorithm. Some studies have used heuristic search algorithms, such as genetic algorithm and particle swarm optimization algorithm, to search in the value range of variables in test cases; then, they combine the results with the generated test cases running in the program to generate test cases that meet the certain standard.
For example, Lv et al. used the particle swarm algorithm optimized by the fitness function combined with the deformation relationship to perform test case generation [8]. They used two indicators, branch coverage and running time, to evaluate the effect of their algorithm, drawing the conclusion that the PSO algorithm exhibits a better effect on test case generation. Mao et al. used a discretized ant colony algorithm to generate test cases for structural testing [9]. This study found that using a single feature to measure the quality of test cases is inaccurate and incomplete. Therefore, they proposed four characteristics as features to evaluate the test case generation method. Ahmed et al. used a genetic algorithm to generate test cases and evaluate the effect by path coverage [1]. Windisch et al. used the probability of covering all branches and iterative algebra to evaluate the effect of particle swarm optimization [10]. They compared the effect of particle swarm optimization with genetic algorithm in generating test cases. The result shows that particle swarm optimization exhibits better effect.
The related work of evaluating test case generation algorithms is listed in Table 1. The above studies illustrate that the use of multiple features is helpful in providing a more comprehensive assessment of the quality of test case generation algorithms. Meanwhile, owing to different testing requirements and assembly characteristics, it is difficult to accurately evaluate algorithms by using fixed rules to combine objective measurement indicators. Thus, the TCGE combines eight features for the test case generation algorithm by L2R, adding subjective factors to the evaluation. Section 2.2 lists some studies on evaluation systems that comprehensively consider objective and subjective factors, from which inspiration can be obtained for the construction of the TCGE in this study.
This section introduces various studies on test case generation and their methods for evaluating their effectiveness. Many studies evaluate the performance of algorithms by individual metrics. However, this approach has several apparent shortcomings. Firstly, the selection of a limited number of metrics does not provide a comprehensive evaluation of the algorithms. Secondly, in existing research, when multiple metrics are used to evaluate algorithms, each metric is considered independently. In practice, a holistic view of the combined impact of all metrics on the evaluation results is required. To address these issues, we propose the L2R-based evaluation method named TCGE. Additionally, TCGE requires a set of test case generation algorithms as the object to be evaluated, which will be selected from the algorithms described in this section.
2.2 Evaluation Systems and Algorithms
The objective of the TCGE introduced in this study is to evaluate the quality of automated test case generation algorithms. Until now, there have been no studies that have built an evaluation system for test case generation algorithms. Therefore, we refer to evaluation systems in other domains to construct TCGE. Of particular importance are the algorithms for building the evaluation system, as the selection of a suitable algorithm can greatly enhance the evaluation capabilities of the system.
The construction of an evaluation system related to computation can be traced back to the end of last century. For example, Coleman et al. proposed a model for software maintainability evaluation in 1994, which included the characteristics, history, and related environment of the software evaluated. The model has been applied to 11 industrial software systems and shows good evaluation results [11]. At the beginning of this century, there have been studies of evaluation systems based on machine learning algorithms. For example, Ip et al. proposed a system to evaluate the site preferences of relevant users on web pages in 2000. The system used fuzzy logic to learn the historical data of the site movement of the user on the relevant webpage to evaluate the user’s preference for the site on the webpage [12].
In recent years, the use of machine learning to construct evaluation systems has showed good results in many fields. For example, in 2022, Wu et al. proposed a low-carbon fresh agricultural products cold chain model based on an improved A* algorithm and ant colony algorithm. This model evaluates various cost and satisfaction factors associated with distribution and constructs an objective function. Simulation results demonstrate the model’s effectiveness in reducing overall distribution costs and lowering carbon emissions [13]. Lima et al. published a study in 2021 using data statistics and unsupervised machine learning to evaluate robotics and programming projects targeted at female audiences [14]. In the field of natural language processing, Bashir et al. used a machine learning algorithm to evaluate subjective answers in 2021 [15]. Hina et al. used logistic regression to propose a multi-label approach for email classification in 2021 [16]. Hernández et al. proposed a method to recommend optimal parameters by learning the relationship between indexes and behaviors for task parallelization in a big data workload in 2018 [17]. In the field of medicine, Schwartz et al. developed an algorithm based on a combination of machine learning and statistical reasoning to recommend the best treatment [18]. Han et al. proposed an L2R method named LGPRank in 2014 to evaluate the quality of posts in a forum, based on a genetic coding framework in machine learning [19].
Among machine learning algorithms used for evaluation, L2R is widely used. L2R algorithms have shown their effectiveness in many fields such as rebalancing portfolios [20], search engine optimization [21], ranking web forum posts, and prevention and control of COVID-19 [22]. In the study by Poh et al., the Learning-to-Rank (L2R) algorithm is employed to comprehensively consider features within portfolio, facilitating the selection of optimal currency strategies [20]. In the research conducted by Usta et al., the L2R algorithm constructs a ranking model for an educational domain search engine by focusing on a diverse set of features related to educational content [21]. In the investigation led by Li et al., the L2R algorithm effectively and efficiently trains a COVID-19 classification network by analyzing features of negative samples to assign useful labels, thereby achieving training efficacy with only a limited number of COVID-19 CT scans and negative sample profiles [22]. Zehlike et al. summarized relevant studies and investigated ranking fairness [23]. These investigations have provided inspiration to our study. The L2R algorithm is suitable for ranking and evaluating objects with multiple features, which is exactly what we need. In the situation of our work, testers make subjective judgments on the performance of evaluation algorithms based on objective features, and use L2R algorithms to learn the judgment results. This constructs an evaluation framework that comprehensively considers objective and subjective factors. Therefore, this study adopts three listwise L2R algorithms to build a framework, TCGE, to evaluate the quality of test case generation algorithms.
The L2R algorithm used in this study to build the TCGE adopts two well-known listwise algorithms, namely Listnet [24] proposed by Cao et al. and LambdaMART [25] proposed by Svore et al. ListNet is trained by maximizing the log-likelihood of predicted permutations, employing optimization techniques such as gradient descent to iteratively adjust model parameters. This iterative process enhances the model’s capability to accurately forecast the order of permutations. LambdaMART utilizes a set of features to represent each sample and employs gradient boosting algorithms to construct a robust ranking model. In each iteration, the algorithm generates a new regression tree, which is added to the model to progressively improve ranking performance. Both ListNet and LambdaMART are well-performing L2R algorithms, forming the foundation upon which we construct the TCGE.
This chapter details the TCGE and modules within the framework. The TCGE framework proposed in this study is shown in Fig. 1, consisting of four parts: materials, preprocessing, algorithm selection, and TCGE training and application. The module, TCGE materials, prepares the materials to be evaluated for the TCGE. This module outputs test cases generated by the algorithms to be evaluated. The preprocessing module extracts features from the generated test cases, constructs feature vectors, and provides the corresponding labels. The algorithm selection module selects an L2R algorithm for the TCGE for training and testing and initializes the model. The training and application module receives the labeled feature vectors and initialized TCGE model for training, through which the model is used to evaluate the quality of the test case generation algorithms. The four modules are introduced in detail below.

Figure 1: TCGE framework comprising four components: materials, preprocessing, algorithm selection, and training application
The module named TCGE materials prepares materials to be evaluated for the TCGE. It includes test case generation algorithms to be evaluated, the source code to be tested, and test cases of the source code generated by these algorithms.
In the previous chapter, three types of classic test case generation algorithms are introduced. This study selects four algorithms from these three types of algorithms to be evaluated by the TCGE. The algorithms selected are described below.
The random method used in this study is shown in Fig. 2. First, the name and variable type of each input variable are obtained from the source code. Second, the value range and number of values are set for each variable. Then, the value of the variable is randomly generated from the range according to the number of values. Finally, a set of test cases is obtained by combining the values of the variables. In this study, the combination of variable values is based on the pairwise principle, which means that each combination of all values of any two variables occurs at least once in the test case set. In addition to satisfying the pairwise principle, this study also considers some test cases as redundant to improve the coverage of the test case set.

Figure 2: Procedure of random test case generation, based on program static analysis. Variables are randomly assigned, and test cases are generated using pairwise rules
Among the static test case generations, KLEE and enhanced KLEE are used in this study, as shown in Fig. 3. KLEE is a symbolic execution tool based on LLVM, which can perform static analysis on programs. KLEE is a frequently employed tool for automated test case generation. Its process can be summarized into three main steps. First, it symbolizes input variables and initializes a “state.” Then, it traces the execution paths of the program, recording symbolic expressions for each branching condition. As it encounters branching conditions, it updates the “state” with conditions composed of symbolic variables. Finally, at the exit point of a path, the “state” is obtained, which represents a set of constraints based on the input variables. These constraints are then solved using a constraint solver. If the constraints are satisfiable, the solutions serve as test cases covering the respective path. If unsatisfiable, the inaccessibility of the path is noted, prompting KLEE to backtrack and explore alternative paths. According to the experimental results, the test cases generated by KLEE can often obtain significantly higher coverage higher than that of the test cases written by testers [6]. The original KLEE uses two features, statement coverage and path coverage, to measure the efficiency of the test cases generated. KLEE can also record the time used to generate the test cases as a measure of the efficiency of KLEE itself. The original KLEE cannot generate test cases that meet more complex coverage criteria, such as MCDC. Therefore, the enhanced version of KLEE is added as a supplement.

Figure 3: Procedure of KLEE test case generation. Based on symbolic execution, constraints consisting of symbolic values of input variables are searched, and the constraint solver is used to solve them and obtain the test cases
The enhanced KLEE converts the task of locating the target test case into a task of locating the path where the assertion fails. The symbolic execution converts each path required to satisfy the coverage into an assertion statement. In this manner, the problem of generating test cases satisfying multiple coverage criteria is solved.
For dynamic test case generation, the particle swarm algorithm (PSO) is used in this study, as shown in Fig. 4. From the program source code, input variable names, variable types, and branch conditions should be parsed out. The number of variables is the dimension of the particle, and the branching condition is used to generate constraints to measure whether the test case set is qualified or not. Each particle represents a test case. First, initialization for a variety of parameters is performed, including the number of particles in the particle swarm, highest number of iterations, inertia weights, and learning factors. Then, the position and speed of each particle are initialized, followed by the calculation of the fitness of each particle, with the best fitness and position of each particle and of the entire particle swarm updated according to the fitness. Finally, it is determined whether the particle swarm meets the constraint conditions; if not, the particle velocity and position are updated, and the program returns to the calculation of the particle fitness. If the conditions are met, all test cases are output.

Figure 4: Procedure of the PSO to generate test cases. Based on static analysis, variables and branch conditions are analyzed and converted into particles and fitness functions, and PSO is executed to obtain test cases
This module extracts the features from the generated test cases, constructs feature vectors, and provides the corresponding labels. The feature vectors consist of the indicators of the test case generation algorithm, including coverage rate and running time. In this study, the ranking order of the algorithm is used to demonstrate its performance in this evaluation. Thus, the four test case generation algorithms are ranked, with the value of the label decreasing as the effect of the algorithm decreases. This means that the most effective algorithm is labeled as 3, and the worst algorithm is labeled as 0.
Eight features are extracted from the test case generation algorithm in this study, as explained below and shown in Table 2.

Statement coverage: Proportion of executed statements to all statements. SC is the number of statements that have been executed, and SA is the number of all statements.
Decision coverage: Proportion of fully covered branches in all branch statements. If every branch of a branch statement has been executed, the branch statement is considered to be “completely covered.” BC is the number of branches that are completely covered after the test case is executed, and BA is the number of all branch statements.
Condition coverage: In the compound condition of the branch statement, the executed simple condition accounts for the proportion of all simple conditions in the compound condition. A simple condition is an expression in which the outermost operator is not a logical operator. Simple conditions connected by logical operators are compound expressions. CC is the number of simple conditions that have been executed, and CA refers to the number of all simple conditions.
C/DC coverage: Also known as branch/condition coverage, it refers to the ratio of the number of executed branches and executed simple conditions to the total number of branches and conditions. For each branch statement, there are only two cases: meeting C/DC coverage and not meeting C/DC coverage.
MC/DC coverage: Also known as correction condition determination coverage. Each input and output must occur at least once in a program, each condition in the program must produce all possible output results at least once, and each condition in each decision must be able to independently affect the output of this decision. For each branch statement, there are only two cases where MC/DC coverage is satisfied or MC/DC coverage is not satisfied.
Path coverage: Ratio of the number of executed paths to the total number of paths. PC refers to the number of statements that have been covered after executing the test case, and PA refers to the number of all statements.
Generation time: Time required for the algorithm to generate all test cases. This metric requires normalization.
Number of test cases: Total number of all test cases generated by an algorithm for a program. This metric requires normalization. Ni is the number of test cases generated for the ith test case generation algorithm.
Table 3 is the feature vector of the identified test case generation algorithm.

In this module, the L2R algorithm is chosen, and the evaluation model is initialized according to the selected algorithm and existing information.
L2R algorithms are divided into three categories according to different labeling methods: pointwise, pairwise, and listwise. Pointwise represents single-point labeling, pairwise represents pairwise labeling, and listwise represents full list labeling. As the listwise method fully considers the relationship among the feature vectors [26], the ranking result is the most reliable among the three methods. The listwise algorithm is powerful and diverse. According to the basis of the loss function, the listwise algorithm can be classified into one of two categories: those in which the loss function is directly related to the evaluation index and those in which the loss function is not directly related to the evaluation index. Therefore, three L2R algorithms are used to construct the TCGE in this study: Listnet, in which the loss function is not directly related to evaluation indicators; LambdaMART, in which the loss function is directly related to evaluation indicators; and RFLambdaMART, which is an improved LambdaMART. The three algorithms are described below.
Listnet uses the method of minimizing the loss function to fit the weight of each feature in the feature vector, scoring each feature vector and arranging its order according to the score. Its model is not directly related to the evaluation index. In Listnet, the loss function is defined according to the probability distribution of the sorting results, in which the famous Luce model is used as the probability distribution model. The probability distribution of the sorting result means that for each sequence of sorted elements, there is a value that represents the probability of the sequence.
Here, the Luce model is briefly discussed. We denote several permuted elements as {m1, m2, ..., mn}, and their corresponding fractional values are {s1, s2, ..., sn}. The symbol π represents a certain sequence of all elements, and the probability of this sequence named
sπ(j) is the fraction of the element at position J in sequence π, ф () is an increasing positive function, which is usually described by the function exp. Using this formula, the Luce model can describe the probability of each possible sequence order of all elements, which facilitates the element ranking process. As such, all elements can be arranged in descending order of probability to obtain the optimal sequence.
Using the Luce model, the ranking model built by Listnet gradually approaches the desired ranking. In Listnet, the weight vector ω and feature vector X of each element are used to fit the score S of the elements, and the element score is used to rank the order of elements. Therefore, the aim is that the score Sl calculated by Listnet approaches the element real score Sr, where Sr is typically represented by the ranked level of the element. After initializing the weight vector ω, the score Sl of each element is calculated in Listnet. For a possible permutation sequence π, the true probability P(πr) of the sequence can be calculated according to the Luce model and Sr. According to Sl, the probability P(πl) of the sequence in the current Listnet model can be calculated. Therefore, it is the main task of Listnet to make the probability distribution P(πl) approach the real probability P(πr), which is the expected probability distribution. In Listnet, the cross-entropy loss function named L is used to describe the difference between two probability distributions.
The formula for updating the weight vector ω using the loss function L is as follows, where η is the learning rate, which is generally an artificially given hyperparameter:
Finally, each feature vector is scored with weight vector
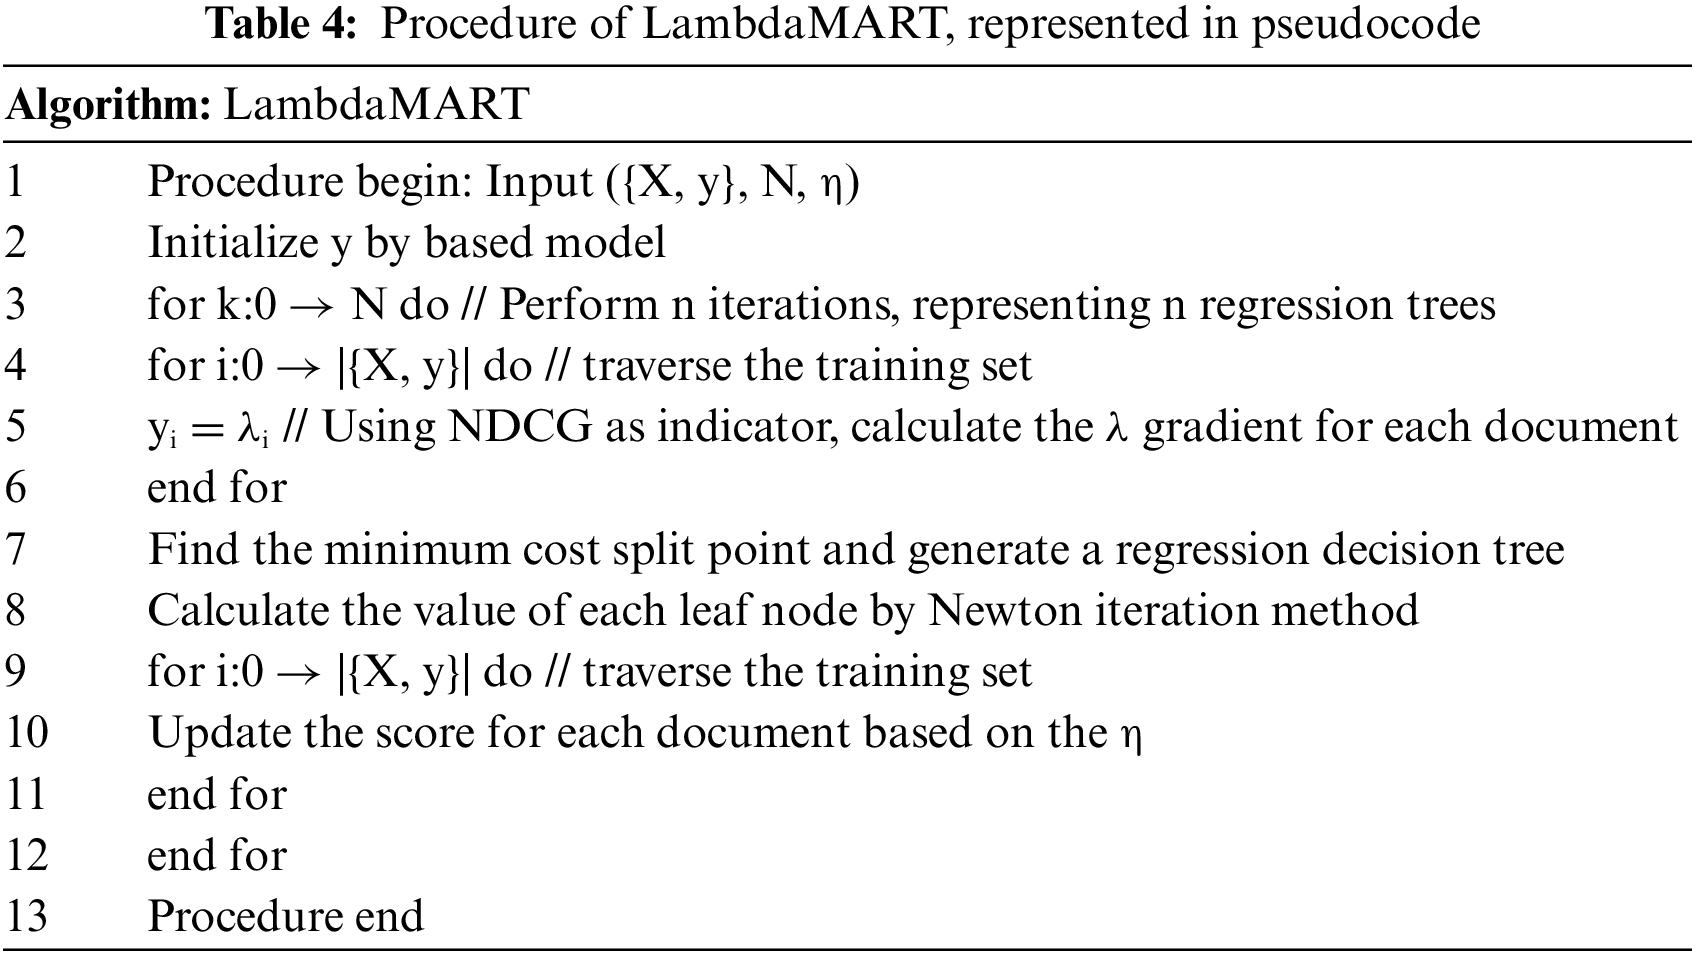
LambdaMART is an L2R algorithm with the Multiple Additive Regression Tree routine (MART) as the framework and lambda as the gradient. MART, also known as Gradient Boosting Decision Tree, is several regression decision trees at its core. A decision tree generates a predicted value Sl for an element. The difference between the predicted value Sl and actual value Sr is called the residual er. The next decision tree learns the residual left by the previous tree. This residual is then used as the gradient to make the predicted value gradually approach the true value.
Similar to Listnet, LambdaMART also needs to obtain a function F(ω, X) determined according to the weight vector ω and feature vector X to score the elements. Therefore, λ is defined to represent the gradient of the loss function to the scoring function, whereby the physical meaning of λi is the direction and intensity of the next move of the ith element. λ replaces the residual in MART as the gradient to calculate the value of the leaf node in the decision tree; then, the scoring function F(ω,X) is updated according to its value, and the score is recalculated for each element.
Table 4 shows the procedure of LambdaMART.
In LambdaMART, several regression decision trees are used to predict the output value for the input feature vector. A decision tree is an algorithm that uses a tree with several branches to perform classification or regression tasks. However, because all the training data are processed in one decision tree, when the number of leaves is small, several feature vectors that need to be regressed are assigned to the same leaf, resulting in identical scores and indistinguishable order.
Similar to individual decision trees, random forests are used to perform classification or regression tasks. As random forests are composed of multiple decision trees, their classification or regression performance is generally better than that of a single decision tree. The random forest we used in this study is illustrated in Fig. 5.

Figure 5: Regression with random forest
Therefore, a new L2R algorithm is proposed in this study. Using random forest to replace the decision tree in LambdaMART, we named it RFLambdaMART. In this study, we compare whether the TCGE using RFLambdaMART can obtain better evaluation results.
The training and application module receive the labeled feature vectors and initialized TCGE model. The labeled feature vectors are divided into a training set and test set. The TCGE performs independent learning for each training set and test set. The TCGE model is trained on the training set based on the difference between the order of the feature vectors under the existing model and their actual order. Testing is performed after each training session. The model is updated in each training session, and training is stopped if the number of training sessions reaches the upper limit or if results are not improved better after a certain number of runs. After training, the feature vectors of the algorithms are scored to evaluate the effect of the algorithms.
To evaluate the validity of the TCGE method, we seek to answer the following research questions.
RQ1: In the TCGE framework, we set up Listnet, LambdaMART, and RFLambdaMART as L2R algorithms. How should the parameters of these algorithms be adjusted such that the TCGE can obtain better evaluation results?
RQ2: RFLambdaMART is improved from LambdaMART. Compared with LambdaMART, does RFLambdaMART yield better results?
RQ3: Can TCGE evaluate the performance of test case generation algorithms on specific datasets? How do different ranking learning algorithms affect the performance of the TCGE?
RQ4: Compared with the evaluation method in other studies of test case generation, what strengths does the TCGE have?
The evaluation of test case generation algorithms can be described as the following steps. First, the test case generation algorithm is used to generate use cases for the functions on the assembly. Then, features are obtained along with the results of each method to form an eigenvector. All the eigenvectors are organized into data that can be used for evaluation. Finally, the dataset is segmented for k-cross validation, and the metrics of normalized discounted cumulative gain (NDCG), mean average precision (MAP), and mean reciprocal rank (MRR) are calculated to evaluate the effectiveness of the TCGE algorithm.
Based on the above experimental procedures, this section describes the experimental design, dataset, annotation regulation, evaluation metrics, and experiment configuration.
To answer the above four questions, we designed the following four experiments.
Experiment1: We identify the main parameters in three L2R algorithms and test the effect of each algorithm when the parameters are varied on a randomly selected test set. Ultimately, we determine the optimal parameters for each algorithm to answer question 1.
Experiment2: To answer question 2, we set the parameters of LambdaMART and RFLambdaMART in the TCGE to the optimal values obtained from Experiment 1 and compare their performances on a randomly selected test set.
Experiment3: To answer question 3, we set up three L2R algorithms for the TCGE and evaluate the TCGE on different datasets, comparing the corresponding results. This experiment can also partly answer question 2.
Experiment4: To answer question 4, we compared the results from the study in [8] with the TCGE. The study in [8] mainly uses two features, branch coverage and running time, to evaluate the test case generation algorithm. In Experiment4, we used the two evaluation methods to evaluate the four test case generation algorithms, and we compared the effectiveness of the evaluation methods.
The four algorithms for test case generation are used on an assembly named main-artifact-programs. The main-artifact-programs assembly is derived from the international competition Rigorous Examination of Reactive Systems (RERS). The purpose of the competition is to evaluate the effectiveness of different validation techniques, including static analysis, theorem proving, model checking, and abstract interpretation [27]. The functions in this assembly generally have few branches; however, the branch conditions are mostly complex-compound conditions. In this way, the conditional coverage capability and c/dc coverage capability of test cases generated by the different algorithms can be effectively measured.
In the dataset, feature vectors are labeled according to the following rules. First, we compare the average value of the six features of coverage, and assign a higher ranking to the algorithm with a larger average value. If the average values are equal, then the normalized test case values and generation time values are compared, with the algorithms having a larger average given higher rankings. If the averages are still the same, the same rank is assigned. We score the test case generation algorithms as 3, 2, 1, and 0, ranking from high to low.
In this study, the four test case algorithms generate test cases for 147 functions in RERS. Their feature vectors form 147 sets of data, each of which containing four feature vectors and the corresponding expected values. In this study, the k-cross-validation method is used to construct the training set and the test set. Here, the k parameter was 10; thus, 147 sets of data were divided into 10 parts. The first 9 pieces contained 15 sets of data, and the last one contained 13 sets of data.
This study explored the effects of the TCGE algorithm under different training conditions. Therefore, two datasets were created, named dataset1 and dataset2. Dataset1 represents the case in which the TCGE is fully trained. It contains 10 pairs of training set and test set data. For the 10 parts of data mentioned in the previous paragraph, 1 part is used as the test set each time, and the remaining 9 parts are used as the training set. Dataset2 represents the case in which the TCGE cannot be fully trained. It also contains 10 pairs of training set and test set data. For the 10 parts of data, 7 are randomly selected as the test set each time, and the remaining 3 parts are used as the training set.
We use the following metrics to measure the effectiveness of the TCGE.
MAP (Mean Average Precision) refers to the average accuracy of the evaluation. In our study, given the expected order
The value of MAP is as follows:
In the formula, the total number of sorted methods is
NDCG (Normalized Discounted Cumulative Gain) refers to the similarity between the actual result of L2R and the expected result. In this study, a grading system is used to define the relevance. The relevance of a method refers to the effect of the method on the tested function. The relevance of the method with the worst effect is defined as 0 and increases upward with a gradient of 1.
NDCG-related indicators include discounted cumulative gain (DCG) and ideal discounted cumulative gain (IDCG). DCG refers to the cumulative weighted gain of the actual relevancy of the ranking learning, and IDCG refers to the cumulative weighted gain of the expected relevancy of the ranking learning, which are defined as follows:
In the formula, i refers to the ith method in a ranking, reli refers to the actual relevance of ith method, and ideali refers to the expected relevance of the ith method. In the formula, the numerator represents the gain of method i and the denominator is the weight of method i. The formula assigns a higher weight to the method ranked first. NDCG is the ratio of DCG to IDCG:
MRR (Mean Reciprocal Rank) refers to the evaluation ability of the TCGE to rank the best-performing algorithms first. The MRR is calculated by taking the reciprocal of the actual ranking of the method with the best-performing algorithm and calculating its average. The formula is as follows:
In the formula,
4.1.4 Experiment Configuration
Experiment1: In dataset1, a pair of training set and test set data are randomly selected to adjust the parameters of three L2R algorithms in the TCGE. In this study, the L2R algorithms in the TCGE include Listnet, LambdaMART, and RFLambdaMART. The parameters and specific information are shown in Table 5:
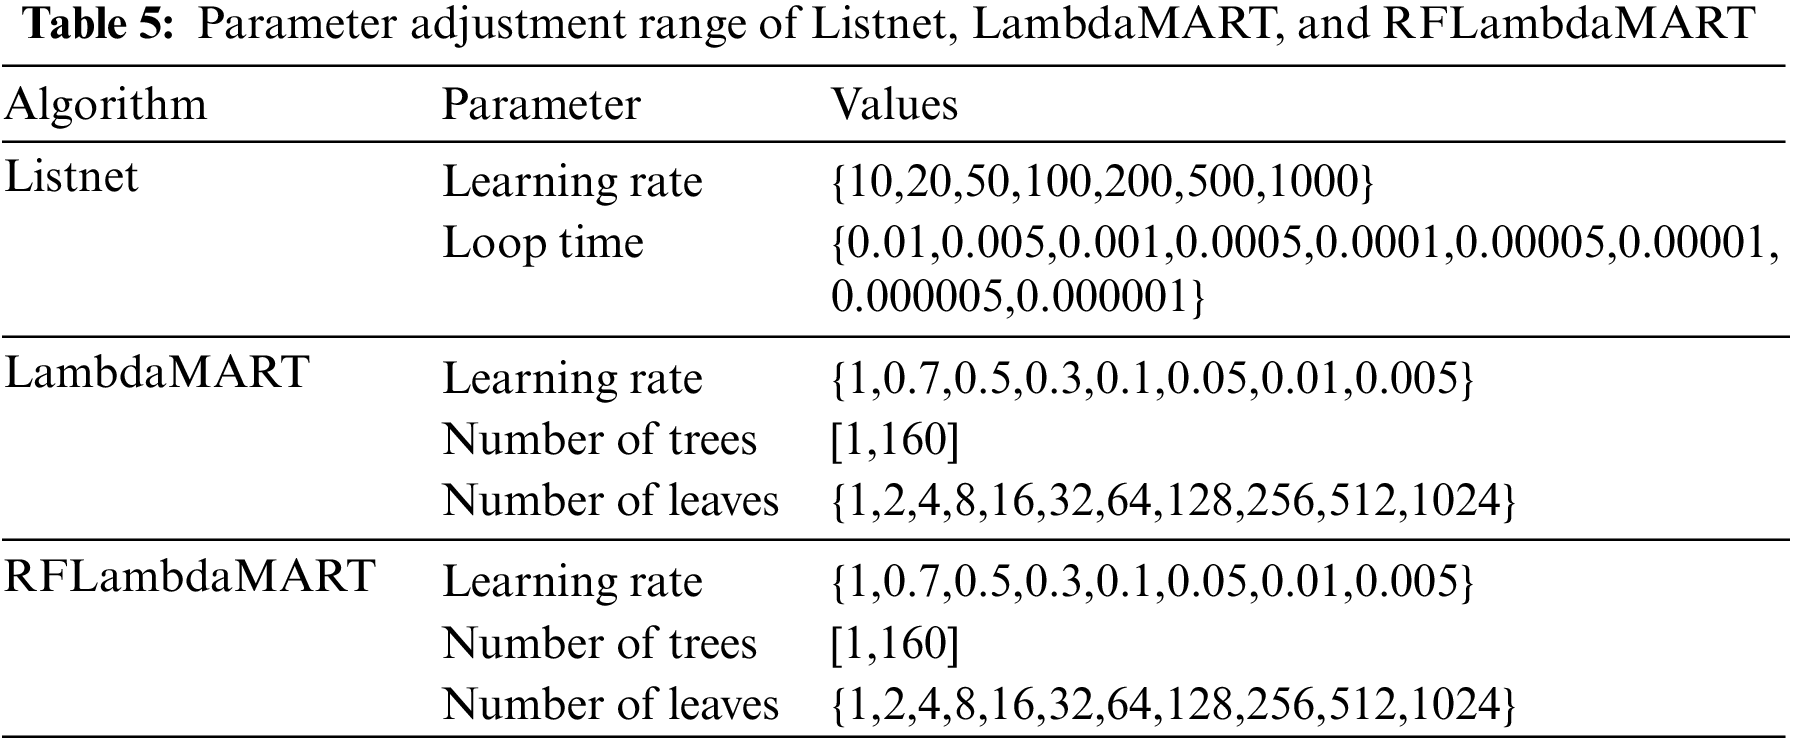
The parameters of the L2R algorithm are set according to the values given in the table. By comparing the NDCG, MAP, and MRR of the algorithm on the test set under different parameters, the optimal parameters of Listnet, LambdaMART, and RFLambdaMART can be obtained.
Experiment2: The aim of Experiment2 is to compare the effects of LambdaMART and RFLambdaMART. The optimal parameters for the two methods are obtained for a maximum number of regression trees of 50. The values of the three metrics mentioned above are used to measure the effects of the TCGE constructed by the two algorithms under different numbers of regression trees.
Experiment3: The aim of Experiment3 is to compare the performance of the three methods on the two datasets. On dataset1 and dataset2, the three L2R algorithms are used for training and testing. The NDCG, MAP, and MRR of the results are obtained and compared to analyze the characteristics of the three types of algorithms, revealing their effects in the TCGE.
Experiment4: The aim of Experiment4 is to compare the performance of the TCGE and another method for test case generation algorithm evaluation. First, a statistical analysis is performed on the distribution of the values of the eight features in dataset. Then, the feature vectors are relabeled according to new rules. Finally, the results of the two evaluation methods are compared.
In Experiment1, the aim is to adjust the parameters of the three L2R algorithms in the TCGE.
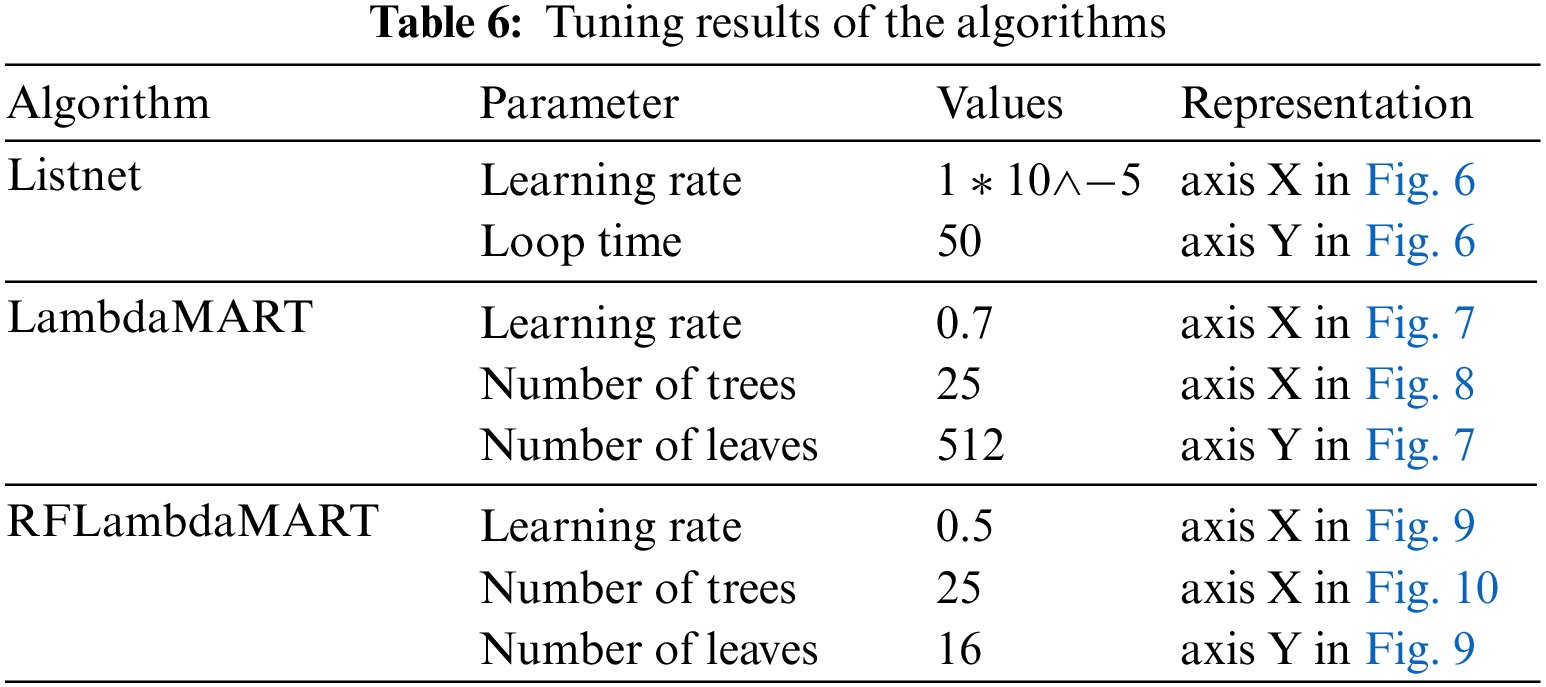
We use a three-dimensional bar chart and line chart to show the values of the metrics for different parameters. Figs. 6–10 show the parameters with the best effects. The axes and parameter values are described in Table 6.

Figure 6: Tuning parameters in Listnet; the best performance corresponds to a number of iterations of 50 and learning rate of 10−5

Figure 7: Tuning parameters in LambdaMART; the best performance corresponds to a number of leaves of 512 and learning rate of 0.7

Figure 8: Influence of the number of trees on the metrics; the best performance corresponds to a number of regression trees of 25

Figure 9: Tuning parameters in RFLambdaMART; the best performance corresponds to a number of leaves of 64 and learning rate of 0.3

Figure 10: Metrics under the parameters f1 and f2. The value of the number of random forests in RFLambdaMART is set to 25
Listnet has two parameters named learning rate and number of loops. As Fig. 6 shows, the data from scoring failures owing to a too large learning rate or too many cycles are not depicted in Fig. 6. According to the experimental results, when several groups of parameters are set for Listnet, NDCG, MAP, and MRR are all at the maximum value of the entire range. Therefore, we select the median within each range. The number of iterations is set to 50, and the learning rate is set to 10-5. At this point, good ranking results can be obtained.
LambdaMART has three parameters, which are the learning rate, number of leaves in a regression tree, and number of regression trees. When the number of leaves in a tree is less than 512, there are several examples of the same score in each group, which makes it difficult to distinguish their order. Thus, this scenario is not depicted in Fig. 7. According to the experimental results in Fig. 7, when the number of leaves is 512 and the learning rate is 0.7, the ranking result is good.
LambdaMART has another parameter, which is the number of regression trees. When the number of leaves and learning rate are determined, take the number of regression trees is taken as the X-axis, and the metrics as the Y-axis to show the influence of the number of regression trees on the three metrics. It can be seen from Fig. 8, that when the three metrics are considered comprehensively, number of regression trees set to 25 will have the best effect.
RFLambdaMART shares three parameters with LambdaMART: learning rate, number of regression tree leaves, and number of random forests. The experimental method employed for LambdaMART is also applied to RFLambdaMART. Fig. 9 presents the results, excluding indistinguishable data when the tree has less than 4 leaves. Experimental findings indicate good ranking results with 16 leaves and a learning rate of 0.5, as well as equally good results with 64 leaves and a learning rate of 0.3.
Therefore, we use the number of random forests as the X-axis and the metric value as the Y-axis to plot in Fig. 9 In the figure, we compare the influence of the number of random forests on the measurement indicators under the two sets of parameters to select a set of parameters with optimal effect and determine the appropriate number of random forests.
f1 is a pair of parameters, in which the number of leaves is 16 and the learning rate is 0.5. f2 is a pair of parameters, in which the number of leaves is 64 and the learning rate is 0.3. The range of numbers of random forests is [1,32].
As can be seen from Fig. 10, the metrics of f1 and f2 on the training set and test set ultimately tend to be stable, and their values are equal with each other. In the test set, the metrics of f2 tends to stabilize faster; however, in the training set, the metrics of f1 increases steadily with an increase in the number of random forests. Therefore, f1 is selected as the parameter of RFLambdaMART in our experiments. Fig. 10 also shows that when the number of random forests is 25, the values of the three metrics are stable. Therefore, 25 is selected as the number of random forests in RFLambdaMART.
Now, we can answer the question RQ1. When the parameters of the three L2R algorithms are set as shown in Table 6, we obtain good sorting results.
The numbers of regression trees and random forests are set to 50 (in the following description, both are referred to as “regression trees”). Then, in dataset1 and dataset2, we use TCGE with LambdaMART and RFLambdaMART, individually, to perform the rank learning.
Fig. 11 shows the results of the two algorithms on a pair of training set and test set data randomly selected from dataset1. As seen from the figure, in the training set, the metrics of LambdaMART and RFLambdaMART are equally high after full training, with all three indicators ultimately stabilized at 1.0. However, the speed of LambdaMART at which the stable value is reached is faster.

Figure 11: Comparison of the effect of LambdaMART and RFLambdaMART for dataset1. RFLambdaMART is slightly better than LambdaMART on fully trained datasets
In the test set, the NDCG and MAP of the two algorithms do not tend to be completely stable with an increase in the number of regression trees; however, they start to fluctuate within a certain range after being stable for a period of time. However, in general, the maximum value of the three metrics for RFLambdaMART is greater than or equal to the result for LambdaMART, and RFLambdaMART reaches the stable values faster. The stable values of NDCG, MAP, and MRR are 0.9819, 0.9333, and 0.9667. Therefore, we can draw the following conclusion: RFLambdaMART is slightly better than LambdaMART on fully trained datasets.
Fig. 12 displays the performance of LambdaMART and RFLambdaMART on randomly selected training and test data from dataset2. In the training set, both algorithms exhibit equally high metrics initially, stabilizing at 1.0 after inadequate training. However, LambdaMART achieves stability more rapidly. In the test set, LambdaMART’s metrics stabilize at a low value following significant fluctuations, while RFLambdaMART’s metrics progress through rise, stability, and decline stages, with the decline preceding fluctuations in NDCG and MAP values within a specific range.

Figure 12: Comparison of the effect of LambdaMART and RFLambdaMART in dataset2. RFLambdaMART is significantly better than LambdaMART
Generally, the maximum and mean values of RFLambdaMART’s three metrics surpass those of LambdaMART, with a smaller fluctuation range. Specifically, RFLambdaMART achieves stable NDCG at 0.9957 compared to LambdaMART’s 0.9828. The stable MAP for RFLambdaMART is 0.9632, while LambdaMART achieves 0.8775. Additionally, RFLambdaMART’s stable MRR is 0.9951, whereas LambdaMART attains 0.9739. Consequently, we conclude that RFLambdaMART outperforms LambdaMART on challenging datasets that are difficult to fully train.
Experiment2 can partially prove that RFLambdaMART does have advantages compared with LambdaMART. More complete experimental proof and algorithm principle analysis are presented in the Experiment3 discussion below.
We conducted statistics on the results of the TCGE with the three L2R algorithms on dataset1 and dataset2, and the results are shown in Figs. 13 and 14.

Figure 13: Statistical results of the metrics of the three algorithms on dataset1. RFLambdaMART exhibits the highest median

Figure 14: Statistical results of the metrics of the three algorithms on dataset2. RFLambdaMART exhibits the highest median
Fig. 13 shows the running results of the three algorithms on dataset1. Fig. 13a shows the NDCG of the algorithms on 10 training and test sets. The average NDCG of Listnet and LambdaMART is approximately 0.995, while the average NDCG of RFLambdaMART is larger than 0.998. Compared with the other two algorithms, the fluctuation range of RFLambdaMART is smaller, which indicates that the order evaluated by RFLambdaMART for the test case generation algorithms is closer to the real order.
Fig. 13b shows the MAP of the three algorithms on the 10 training and test sets. The mean values of MAP are arranged in descending order: RFLambdaMART, Listnet, and LambdaMART. Among them, the fluctuation range of Listnet is the smallest; however, 20% of the data are outliers. RFLambdaMART fluctuates more widely; however, all values are higher than 0.92, indicating high sorting accuracy.
Fig. 13c shows the MRR of the three algorithms on the 10 training and test sets. The mean MRR of LambdaMART and RFLambdaMART are both 1; however, they both contain outlier data. As for Listnet, the MRR fluctuates between 0.95 and 1. Clearly, LambdaMART and RFLambdaMART are better in the ability to rank the best test case generation algorithm.
Fig. 14 shows the running results of the three algorithms on dataset2. Fig. 14a shows the NDCG of the three algorithms on the 10 training and test sets, showing that the order of the average NDCG from large to small is RFLambdaMART, LambdaMART, and Listnet. The NDCG of RFLambdaMART reaches as high as 0.998, while the other two algorithms have values of 0.989 and 0.993, respectively. In addition, compared with the other two algorithms, the fluctuation range of RFLambdaMART is the smallest, which indicates that the order evaluated by RFLambdaMART for the test case generation algorithm is closer to the real order.
Fig. 14b shows the MAP of the three algorithms on the 10 training and test sets. The order of the median MAP from large to small is RFLambdaMART, Listnet, and LambdaMART, with values of 0.969, 0.943, and 0.917, respectively. This indicates that RFLambdaMART has high sorting accuracy. In addition, the MAP values of RFLambdaMART fluctuate within a small range, and the effect is stable.
Fig. 14c shows the MRR of the three algorithms on the 10 training sets and test sets. The median MRR of Listnet, LambdaMART, and RFLambdaMART increase successively, with values of 0.993,0.995, and 1.0, respectively. This shows that RFLambdaMART can stably rank the best test case generation algorithm.
At this point, we can clearly answer RQ2 and RQ3.
RQ2: According to the experimental results, the three metrics of the RFLambdaMART are slightly better than those of LambdaMART in dataset1, and fewer regression trees are required to reach a stable value. In different training sets and test sets, the metrics of RFLambdaMART vary within a small range, and the effect is more stable. In dataset2, which simulated small sample training, the metrics of RFLambdaMART were significantly better than those of LambdaMART. Similar to dataset 1, the metrics of RFLambdaMART varied within a small range and had a more stable effect on the different training and test sets of dataset2. This shows that the TCGE with RFLambdaMART has better evaluation effect and generalization ability on the test case generation algorithm.
In comparison to LambdaMART, the exceptional performance of RFLambdaMART observed in this study can be attributed to its underlying algorithmic principles. RFLambdaMART is derived from LambdaMART by replacing the decision trees with a random forest. This substitution yields two distinct advantages. First, a random forest is an ensemble model composed of multiple decision trees, each trained on different subsets of data. This ensemble effect contributes to reducing model variance, mitigating the risk of overfitting and thereby enhancing the model’s generalization ability. In ranking tasks, this facilitates better generalization to unseen data. Second, a random forest randomly selects a subset of features at each node for splitting. This aids the model in focusing on various aspects of the data, enhancing both diversity and robustness. For ranking tasks, this improved capability to capture correlations between different features contributes to enhanced sorting performance. Hence, theoretically, RFLambdaMART is poised to deliver more accurate rankings, resulting in superior evaluation results for the TCGE.
RQ3: As observed in Figs. 13 and 14, the results indicate that the TCGE exhibits a remarkable level of stability despite variations in datasets. The median NDCG consistently exceeds 98.5%, MAP exceeds 90%, and MRR surpasses 98%. Notably, the TCGE constructed using RFLambdaMART consistently outperforms the other variants. Therefore, we can draw the following conclusions: TCGE indeed proves to be an effective means of evaluating automated test case generation algorithms, with its effectiveness remaining consistent across diverse datasets. Among them, the TCGE constructed using RFLambdaMART exhibits the highest evaluation performance.
In Experiment4, the TCGE was compared with the evaluation method from [8], with a focus on two features, branch coverage and generation time, and the distribution of feature values on eight classical programs analyzed.
The distribution of the values of branch coverage and running time was examined. Fig. 15 shows the statistical results of the values of the features. As seen in Fig. 15a, both enhanced KLEE and KLEE have high branch coverage. For the feature “time,” the Random method performs best. The partial order problem mentioned above arises here. To determine which method is better, increasing the number of features is an effective way.

Figure 15: Branch coverage and running time for the four algorithms
Figs. 16 and 17 show the distribution of the eight values in the TCGE. For each coverage feature, enhanced KLEE shows the best performance, while for the features of “running time” and “number of test cases,” random and KLEE exhibit the best performance, respectively. More features can help the tester choose a more efficient algorithm.

Figure 16: Branch, CCD, condition, and MC/DC coverage for the four algorithms
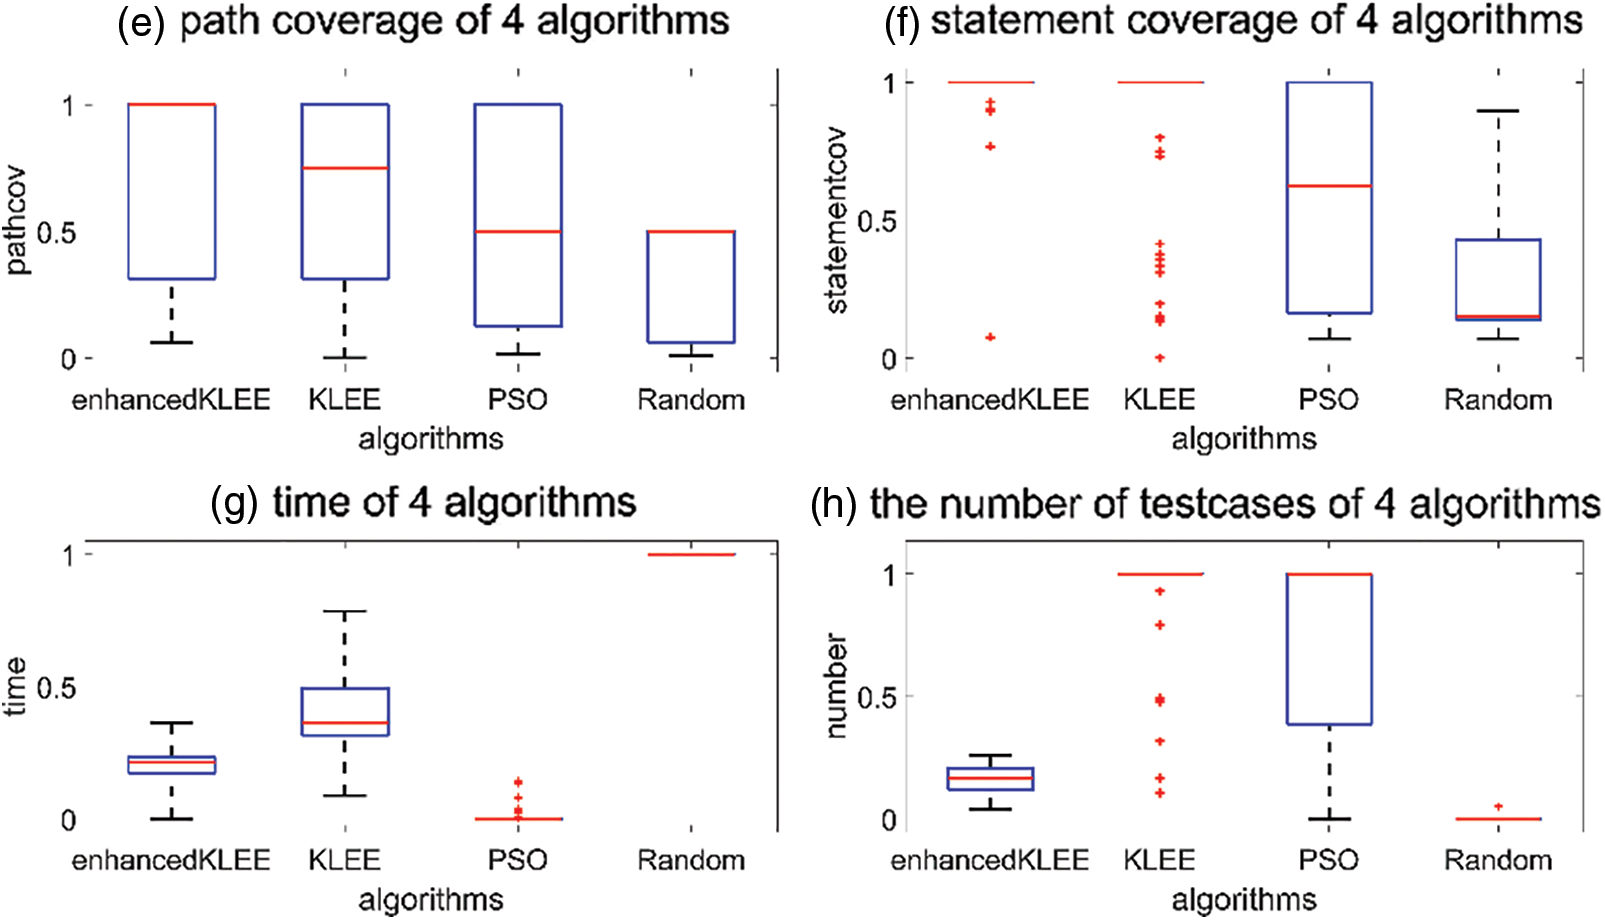
Figure 17: Path coverage, statement coverage, running time, and number of test cases for the four algorithms
However, the problem of partial order may occur as long as the number of features is greater than 1. TCGE can solve this problem well. In TCGE, testers need to label part of the feature vectors according to the test requirements; then, TCGE learns from the labeled feature vectors, scores them, and sorts them. In this manner, TCGE can not only solve the partial order problem through annotation but also meet the test requirements through sorting.
In the previous experiment, we labeled the feature vectors on the basis of eight features. To reflect the change of results caused by the change in test requirements, we relabeled the basis of only two features from [8] and conducted the experiment. The experimental results are shown in Fig. 18. The ranking results are both accurate; however, the chosen algorithm that “mostly meets the test requirements” is different: the result for the former experiment is enhanced KLEE and that for the latter one is KLEE. The results show that TCGE can accurately learn the test requirements and select the most suitable algorithm.

Figure 18: NDCG of TCGE with eight features and two features. The NDCG of TCGE with eight features is higher
The answer for RQ4 is as follows:
Compared with other evaluation methods of test case generation algorithms, TCGE has three main advantages. First, TCGE has more features for evaluation than most studies, and more information helps testers make better decisions. Second, TCGE can solve the partial order problem by labeling the feature vectors. Third, TCGE can help testers choose the most appropriate algorithm through training to learn the test requirements from the labeled feature vectors.
From the answers to the four questions mentioned above, we can conclude that TCGE has been empirically demonstrated to effectively assess the performance of automated test case generation algorithms on datasets. However, the accuracy of the TCGE does not reach 100%, with the best-performing RFLambdaMART-based TCGE achieving an accuracy of 97.5%. Among the cases in which evaluation errors occurred, the following scenario is most frequently observed: algorithm “a” has a feature vector Fa = [0.8333,0.8333,0.9375,0.8333,0.0938,0.9286,0.1847,0.2611] for a given test program, while algorithm “b” has a feature vector Fb = [1,0.75,0.975,0.75,0.3125,1,0.1645,0.1085] for the same program. Some feature values in Fa are larger than those in Fb, while others are smaller. This discrepancy leads to the TCGE result for the order between “a” and “b” possibly differing from the labeled order, resulting in the inaccurate evaluation of the sample. We discuss how to address this issue in the discussion of future work in the conclusions.
In this study, the TCGE framework is constructed for the evaluation of test case generation algorithms. By considering the features of the algorithm, TCGE can evaluate the effectiveness of the test case generation algorithm.
In order to evaluate the effectiveness of TCGE, we conducted experiments with three L2R algorithms: Listnet, LambdaMART, and RFLambdaMART, on two datasets: dataset1 and dataset2. We evaluated them using four classical test case generation algorithms: random method, KLEE, enhanced KLEE, and PSO. Finally, we performed four experiments In Experiment1, we tuned the parameters of L2R algorithms to achieve the best performance. Experiment2 compared the performance of RFLambdaMART with LambdaMART on different datasets, and RFLambdaMART outperformed LambdaMART by 4.5% and 5.7% in terms of MAP, indicating the consistent superior performance of RFLambdaMART. In Experiment3, we tested the effectiveness of TCGE built by three L2R algorithms. The results showed that, despite dataset variations, TCGE exhibited remarkable stability. The median NDCG consistently exceeded 98.5%, MAP exceeded 90%, and MRR exceeded 98%. TCGE constructed by RFLambdaMART consistently demonstrated superiority with a ranking accuracy of 96.5%, outperforming LambdaMART by 2% and Listnet by 1.5%. The fourth experiment compared the evaluation methods used in other test case generation research. The results indicated that TCGE can comprehensively consider the impact of various evaluation features, with NDCG surpassing existing methods by 0.8%. Therefore, we can conclude as follows: TCGE, proposed in this study, effectively evaluates test case generation algorithms. Furthermore, compared to other test case generation algorithm evaluation methods, TCGE can facilitate algorithm selection by training and learning to adapt to test requirements and characteristics.
Although TCGE demonstrates strong performance in evaluating automated test case generation algorithms, it still possesses certain drawbacks. TCGE’s primary shortcomings revolve around two main issues. Firstly, Listwise algorithms may result in incorrect rankings for closely related test objects. Secondly, as the number of algorithms to be evaluated increases, Listwise algorithms exhibit significantly longer runtime. In our future work, we endeavor to address the above issues through two approaches. In certain scenarios, users exhibit a heightened interest in objects ranked within the top k positions. In such instances, we substitute NDCG@k for NDCG as the benchmark for algorithmic iteration. The benefits of this approach are twofold: not only does it provide ranking information for the top k objects, but it also reduces the time complexity of the L2R algorithm. In alternative scenarios, evaluators may not be required to furnish a comprehensive ranking for all algorithms; rather, their objective is to assess the performance of various test algorithms. Inspired by the work of Duan et al. [28], we intend to adopt a pairwise ranking learning algorithm to construct an evaluation system and assess its effectiveness in future research. This approach offers two key advantages. Firstly, it explicitly evaluates the performance of two test algorithms, thus avoiding potential errors in rankings that may occur with list algorithms under intransitivity. Secondly, pairwise algorithms are computationally more efficient than list algorithms, conserving computational resources.
Acknowledgement: We would like to express our gratitude to our colleague, Zhihao Wang, for providing us with the algorithm of enhanced KLEE and its associated environment in the manuscript.
Funding Statement: This study did not receive any funding in any form.
Author Contributions: The authors confirm contribution to the paper as follows: study conception and design: Zhonghao Guo, Xiangxian Chen; data collection: Zhonghao Guo, Xinyue Xu; analysis and interpretation of results: Zhonghao Guo; draft manuscript preparation: Zhonghao Guo, Xiangxian Chen and Xinyue Xu. All authors reviewed the results and approved the final version of the manuscript.
Availability of Data and Materials: In this study, the test cases generated by the 4 test case generation algorithms, the feature values such as coverage, and the rest of the results can be obtained from the following disk links. URL: https://pan.baidu.com/s/15eX-c8r-c_vwum6lEfj-RA?pwd=testKey:test.
Conflicts of Interest: The authors declare that they have no conflicts of interest to report regarding the present study.
References
1. M. A. Ahmed and I. Hermadi, “GA-based multiple paths test data generator,” Computers & Operations Research, vol. 35, no. 10, pp. 3107–3124, 2008. [Google Scholar]
2. F. Pecorelli, F. Palomba and A. de Lucia, “The relation of test-related factors to software quality: A case study on apache systems,” Empirical Software Engineering, vol. 26, no. 2, pp. 1–42, 2021. [Google Scholar]
3. M. Dave and R. Agrawal, “Search based techniques and mutation analysis in automatic test case generation: A survey,” in 2015 IEEE Int. Advance Computing Conf. (IACC), Banglore, India, pp. 795–799, 2015. [Google Scholar]
4. P. McMinn, “Search-based software test data generation: A survey, software testing,” Verification & Reliability, vol. 14, no. 2, pp. 105–156, 2004. [Google Scholar]
5. Z. Yang, M. Hong, D. Guo, X. Wang, F. Liu et al., “Coverage comparison analysis of unit test case generation tools: Evosuite and randoop,” Computer Systems and Applications, vol. 1, no. 9, pp. 40, 2020. [Google Scholar]
6. C. Cadar, D. Dunbar and D. R. Engler, “KLEE: Unassisted and automatic generation of high-coverage tests for complex systems programs,” in Proc. of OSDI, San Diego, SD, USA, pp. 209–224, 2008. [Google Scholar]
7. S. Lukasczyk, F. Kroiß and G. Fraser, “An empirical study of automated unit test generation for Python,” Empirical Software Engineer, vol. 28, no. 2, pp. 138–183, 2023. [Google Scholar]
8. X. W. Lv, S. Huang, Z. W. Hui and H. J. Ji, “Test cases generation for multiple paths based on PSO algorithm with metamorphic relations,” IET Software, vol. 12, no. 4, pp. 306–317, 2018. [Google Scholar]
9. C. Mao, L. Xiao, X. Yu and J. Chen, “Adapting ant colony optimization to generate test data for software structural testing,” Swarm and Evolutionary Computation, vol. 20, no. 1, pp. 23–36, 2015. [Google Scholar]
10. A. Windisch, S. Wappler and J. Wegener, “Applying particle swarm optimization to software testing,” in Proc. of the 9th Annual Conf. on Genetic and Evolutionary Computation, London, LD, UK, pp. 1121–1128, 2007. [Google Scholar]
11. D. Coleman, D. Ash, B. Lowther and P. Oman, “Using metrics to evaluate software system maintainability,” Computer, vol. 27, no. 8, pp. 44–49, 1994. [Google Scholar]
12. R. Ip, “An intelligent internet information delivery system to evaluate site preferences,” Expert Systems with Applications, vol. 18, no. 1, pp. 33–42, 2000. [Google Scholar]
13. D. Q. Wu, Z. W. Zhu, D. Hu and F. M. Romany, “Optimizing fresh logistics distribution route based on improved ant colony algorithm,” Computers, Materials & Continua, vol. 73, no. 1, pp. 2079–2095, 2022. [Google Scholar]
14. D. A. Lima, M. E. A. Ferreira and A. F. F. Silva, “Machine learning and data visualization to evaluate a robotics and programming project targeted for women,” Journal of Intelligent & Robotic Systems, vol. 103, no. 1, pp. 1–20, 2021. [Google Scholar]
15. M. F. Bashir, H. Arshad, A. R. Javed, N. Kryvinska and S. S. Band, “Subjective answers evaluation using machine learning and natural language processing,” IEEE Access, vol. 9, no. 1, pp. 158972–158983, 2021. [Google Scholar]
16. M. Hina, M. Ali, A. R. Javed, G. Srivastava, T. R. Gadekallu et al., “Email classification and forensics analysis using machine learning,” in Proc. of 2021 IEEE SmartWorld, Ubiquitous Intelligence & Computing, Advanced & Trusted Computing, Scalable Computing & Communications, Internet of People and Smart City Innovation (SmartWorld/SCALCOM/UIC/ATC/IOP/SCI), Atlanta, ATL, USA, pp. 630–635, 2021. [Google Scholar]
17. Á. B. Hernández, M. S. Perez, S. Gupta and V. Muntés-Mulero, “Using machine learning to optimize parallelism in big data applications,” Future Generations Computer Systems, vol. 86, no. 1, pp. 1076–1092, 2018. [Google Scholar]
18. B. Schwartz, Z. D. Cohen, J. A. Rubel, D. Zimmermann, W. W. Wittmann et al., “Personalized treatment selection in routine care: Integrating machine learning and statistical algorithms to recommend cognitive behavioral or psychodynamic therapy,” Psychotherapy Research: Journal of the Society for Psychotherapy Research, vol. 31, no. 1, pp. 33–51, 2021. [Google Scholar] [PubMed]
19. X. Han, J. Ma, Y. Wu and C. Cui, “A novel machine learning approach to rank web forum posts,” Soft Computing, vol. 18, no. 5, pp. 941–959, 2014. [Google Scholar]
20. D. Poh, B. Lim, S. Zohren and S. Roberts, “Enhancing cross-sectional currency strategies by context-aware learning to rank with self-attention,” The Journal of Financial Data Science, vol. 4, no. 3, pp. 89–107, 2022. [Google Scholar]
21. A. Usta, I. S. Altingovde, R. Ozcan and O. Ulusoy, “Learning to rank for educational search engines,” IEEE Transactions on Learning Technologies, vol. 14, no. 2, pp. 211–225, 2021. [Google Scholar]
22. Y. Li, D. Wei, J. W. Chen, S. L. Cao, H. Y. Zhou et al., “Efficient and effective training of COVID-19 classification networks with self-supervised dual-track learning to rank,” IEEE Journal of Biomedical and Health Informatics, vol. 24, no. 10, pp. 2787–2797, 2020. [Google Scholar] [PubMed]
23. M. Zehlike, K. Yang and J. Stoyanovich, “Fairness in ranking, part II: Learning-to-rank and recommender systems,” ACM Computing Surveys, vol. 55, no. 6, pp. 1–41, 2023. [Google Scholar]
24. Z. Cao, T. Qin, T. Y. Liu, M. F. Tsai and H. Li, “Learning to rank: From pairwise approach to listwise approach,” in Proc. of the 24th Int. Conf. on Machine Learning (ICML), New York, NY, USA, pp. 129–136, 2007. [Google Scholar]
25. K. M. Svore, M. N. Volkovs and C. J. C. Burges, “Learning to rank with multiple objective functions,” in Proc. of the 20th Int. Conf. on World Wide Web, Hyderabad, pp. 367–376, 2011. [Google Scholar]
26. D. Liu, Z. Li, Y. Ma and Y. Zhang, “Listwise learning to rank with extreme order sensitive constraint via cross-correntropy,” Concurrency and Computation: Practice & Experience, vol. 33, no. 22, 2021. [Online]. Available: https://onlinelibrary.wiley.com/doi/full/10.1002/cpe.5796?saml_referrer (accessed on 01/07/2022) [Google Scholar]
27. F. Howar, M. Isberner, M. Merten, B. Steffen, D. Beyer et al., “Rigorous examination of reactive systems: The RERS challenges 2012 and 2013,” International Journal on Software Tools for Technology Transfer, vol. 16, no. 5, pp. 457–464, 2014. [Google Scholar]
28. J. Duan, J. Li, Y. Baba and H. Kashima, “A generalized model for multidimensional intransitivity,” in Knowledge Discovery and Data Mining. Springer, Cham, pp. 840–852, 2017. [Google Scholar]
Cite This Article
 Copyright © 2024 The Author(s). Published by Tech Science Press.
This work is licensed under a Creative Commons Attribution 4.0 International License , which permits unrestricted use, distribution, and reproduction in any medium, provided the original work is properly cited.
 Downloads
 Citation Tools