
 Submit a Paper
 Propose a Special lssue
 Open Access
ARTICLE

Energy-Efficient Internet of Things-Based Wireless Sensor Network for Autonomous Data Validation for Environmental Monitoring
1 University Institute of Information Technology, PMAS-Arid Agriculture University, Rawalpindi, 46000, Pakistan
2 School of Software Engineering, Beijing University of Technology, Beijing, 100124, China
3 Industrial Engineering Department, College of Engineering, King Saud University, Riyadh, 11421, Saudi Arabia
* Corresponding Author: Saif Ur Rehman. Email:
Computer Systems Science and Engineering 2025, 49, 185-212. https://doi.org/10.32604/csse.2024.056535
Received 24 July 2024; Accepted 24 October 2024; Issue published 10 January 2025
 View Full Text
 Download PDF
Abstract
This study presents an energy-efficient Internet of Things (IoT)-based wireless sensor network (WSN) framework for autonomous data validation in remote environmental monitoring. We address two critical challenges in WSNs: ensuring data reliability and optimizing energy consumption. Our novel approach integrates an artificial neural network (ANN)-based multi-fault detection algorithm with an energy-efficient IoT-WSN architecture. The proposed ANN model is designed to simultaneously detect multiple fault types, including spike faults, stuck-at faults, outliers, and out-of-range faults. We collected sensor data at 5-minute intervals over three months, using temperature and humidity sensors. The ANN was trained on 70% of the 26,280 data points per sensor, with 15% each for validation and testing. Our framework demonstrated a 97.1% improvement in fault detection accuracy (measured by F1 score) compared to existing methods, including rule-based, moving average, and statistical outlier detection approaches. The energy efficiency of the system was evaluated through 24-h power consumption tests, showing significant savings over traditional WSN architectures. Key contributions include a multi-fault detection ANN model balancing accuracy and computational efficiency, an energy-optimized IoT-WSN architecture for remote deployments, and a comprehensive performance evaluation framework. While our approach offers improvements in both data validation and energy efficiency, we acknowledge limitations such as potential scalability issues and the need for further real-world testing. This research advances the field of remote environmental monitoring by providing a robust, energy-efficient solution for ensuring data reliability in challenging deployment scenarios. Future work will explore more advanced machine learning techniques and extended field testing to further validate and improve the system’s performance.Keywords
Sensors are a pervasive piece of technology that might potentially enhance human senses by translating complex physical ideas into measurable data. However, most modern sensors are embedded deeply within commonplace items. However, although sensors were formerly the primary program between the real world and human concept, data from several sensors is now routinely integrated and prepared, adding a layer of indifference to the process [1]. Examples of devices that benefit from sensors include smartphones, where the average user likely isn’t thinking about the raw data provided by the device’s microphone, CCD (Charge-Coupled Device) camera, MEMS (Microelectromechanical Systems) accelerometer, GSM (Global System for Mobile Communications)–modem [2], and many more. Pervasive or ubiquitous processing is just one example of how some futuristic views of computing go even further [3]. Common to most of these is the incorporation of some sort of electronic user interface into the physical environment, rendering commonplace objects interactive. Small, cheap computers that can communicate with one another and sense their surroundings are the ideal building blocks for this interface. As a result of these factors, the novel advertising concept of Wireless Sensor Network (WSN) has emerged. WSN consists of distributed stuck systems [4]. The widespread applicability of the WSN- concept suggests that there is likely to be significant interest in the related technologies. An ideal WSN would allow for the deployment of a large number of autonomous sensor nodes, each of which would tailor its settings to its surrounding nodes and the overall network structure [5]. Nodes collect data by sensing their surroundings and processing it locally before sending it, or an extract of it, to a network sink for further processing and eventual readout. While data transmissions are expected to take the most direct route to their destinations, administrators can control the entire network as though it were a single, massive gauge. Power consumption and efficiency become equally crucial while attempting to ensure the dynamic condition of the detecting device in a remote place [6].
On the Internet of Things (IoT), there is an increase of environment-sensing and -monitoring devices, leading to a crisis of insufficient energy supply. The network’s lifetime and power dissipation are both impacted by the IoT routing protocol’s energy consumption [7]. The key problem is ensuring steady data transmission from the sending node to the receiving Base Station (BS). Industrial control systems, motion sensing, and environmental monitoring are all components of WSNs. WSNs can take on multiple forms, employ various technologies, and communicate via various network topologies, making their appearance highly application-specific [8].
Environmental monitoring (EM) is typically associated with studying the natural world; however, the term can refer to any kind of environment. Observation and data collection are the foundations of EM because they allow us to learn more about the natural world around us [9]. Physical science, biological study, and chemical analysis are all components of environmental monitoring. However, the actual number of technological areas to explore increases as more systems are involved, particularly for data collecting [10]. With a growing global population as inspiration, it’s clear that environmental monitoring encompasses more than just data collection and analysis. The role that EM plays in revealing the limitations of EM and demonstrating the consequences of human behavior on the environment is crucial [11]. In addition to environmental science, popular applications include protecting drinking water supplies, treating radioactive waste, monitoring pollution, safeguarding natural resources, counting and forecasting weather, and keeping tabs on animals as shown in Fig. 1.
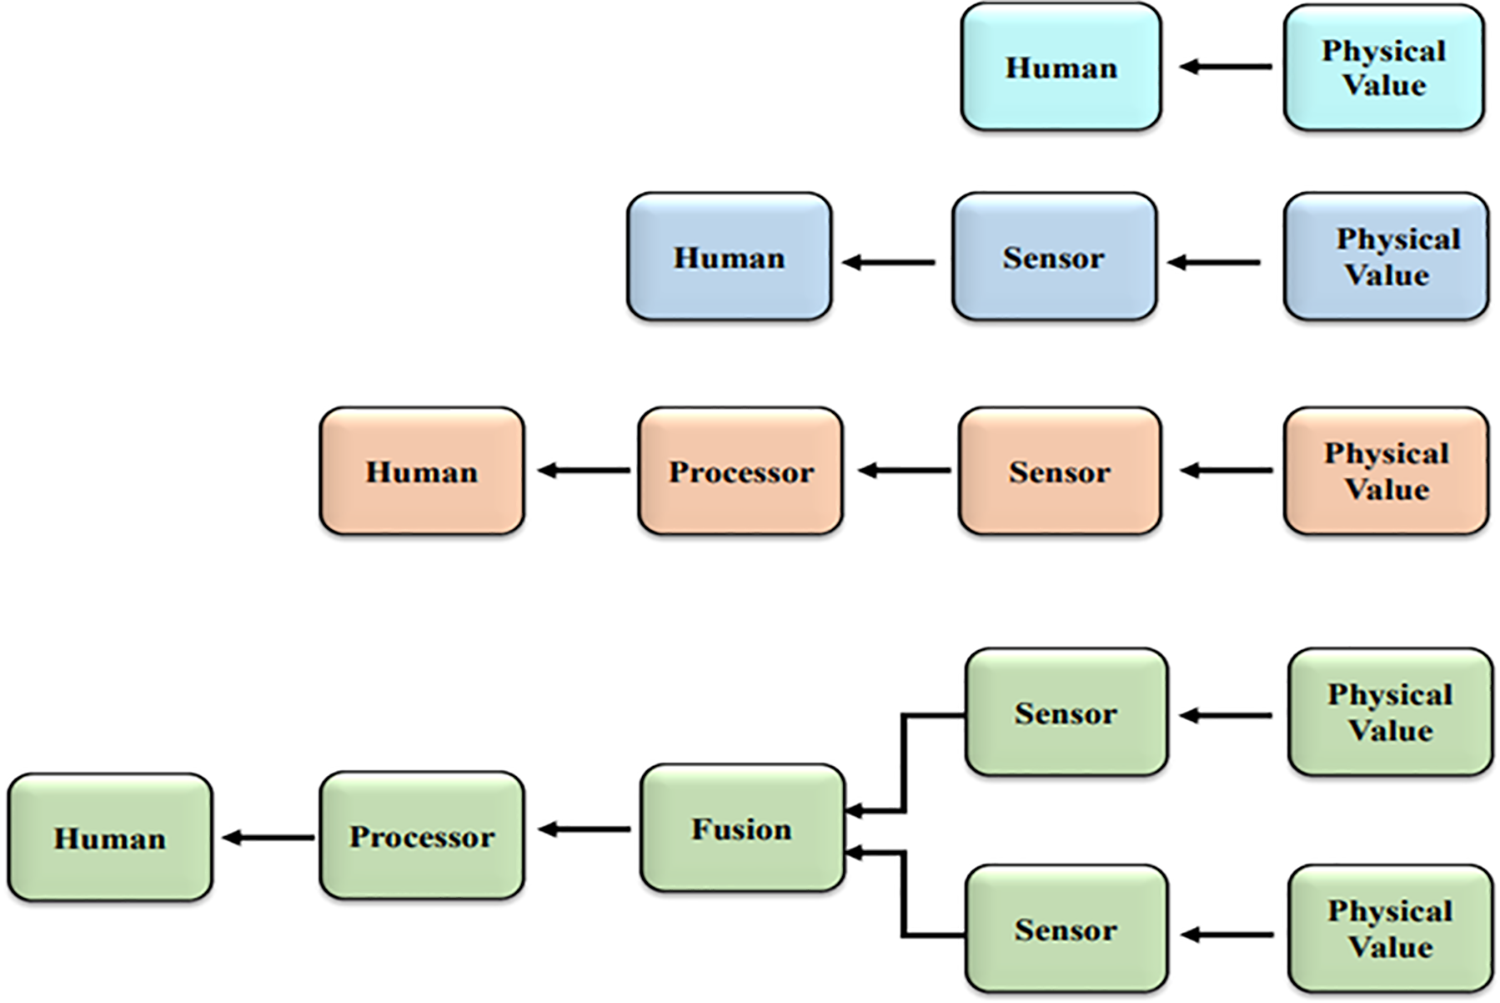
Figure 1: Advancement of sensing
By analyzing a statistically significant sample of the environment, environmental monitoring attempts to pinpoint the state of the world around you. Since the sharing of information like this is crucial to EM [12]. Concerns about the invasiveness of the measuring program, the precision of the sampling, and the ability to store samples are all addressed by the data acquisition system. The degree to which these worries manifest depends, on the one hand, on the context in which they are used; for instance, on the sensitivity of the observed physical value that is to be affected externally [13]. Grab samples, (remote) sampling stations and remote sensing are examples of common sampling techniques. Grab sampling entails taking an instance out of context for the sake of further study. Although this is not done as frequently as it once was due to technical advancement, obtain sampling is still employed in select complete circumstances to allow for special samples or even more complex investigations than is possible in the field [14]. The presence of humans adds not only to the expense and inconvenience of collecting samples but also to the invasiveness of the process. Sampling stations are sensor devices that are placed across the study area and updated at regular intervals [15]. Although WSNs are commonly used for gathering environmental data in real-time via sensors, the system is not without its flaws. The issue of data validation has long plagued this field as any invalidated data will provide inaccurate forecasts and may lead to questionable decision-making, lowering the overall performance and reliability of a monitoring system [16].
The focus of the study is on WSNs and their use in environmental surveillance research. The authors note that WSNs have received a lot of attention since they can be put in difficult-to-reach areas to perform ad hoc remote sensing and communication [17]. However, there have been issues with WSN development that have prevented them from reaching their full potential. The research focuses on two major issues: the validity and trustworthiness of data, and the efficiency and effectiveness of energy consumption. Since the sensing environment can introduce flaws and inaccuracies into the sensed data, the authors stress that caution is warranted while using it [18]. Therefore, validating data is essential for making sound inferences and choices. The study also highlights the significance of keeping sensing systems online at far-flung locations while accounting for power limitations and optimizing energy consumption [19].
The study suggests a smart framework using an AI algorithm to validate data in far-flung places, which should help overcome these obstacles. The goal of the framework is to detect a wide variety of errors, such as “spike” errors, “out of range” errors, “outliers,” and “stuck-at” errors. When compared to other algorithms, the proposed one achieves a 97% performance boost in terms of validating input data [20]. WSNs are widely used for remote environmental monitoring. However, they face two critical challenges—validating the reliability of sensed data and optimizing energy consumption. The remote sensing environment can introduce errors into the collected data. Therefore, it is crucial to validate the data before using it for analysis and decision-making. However, existing data validation algorithms have limitations in detecting multiple error types [21]. Furthermore, maintaining sensing system operation with limited power in remote locales is difficult. Therefore, this research aims to develop an AI-based framework to address these issues in WSNs for environmental monitoring. The key objectives are:
• Design a smart system to validate sensor data in remote areas by detecting various data faults like outliers, stuck-at errors, etc.
• Develop an energy-efficient IoT-based WSN architecture for autonomous data collection and transmission.
• Implement an intelligent algorithm that identifies multiple error types accurately compared to existing methods.
• Demonstrate improved performance of the AI algorithm in terms of validity and energy efficiency.
The proposed approach will detect a wide range of data errors through advanced AI techniques. This can significantly enhance the reliability and accuracy of the sensor data collected from remote locations. The energy-efficient IoT-WSN architecture will further optimize power utilization.
This research aims to develop an AI-based system to validate sensor data in remote areas and improve the energy efficiency of wireless sensor networks for environmental monitoring applications.
WSNs deployed for environmental monitoring in remote areas face two critical challenges:
1. Data validation and reliability: The harsh sensing environment can introduce errors and inaccuracies in the collected data. Without proper validation, faulty data can lead to incorrect analysis and unreliable decision-making.
2. Energy efficiency: Maintaining continuous operation of sensing devices in remote locations with limited power sources is difficult. Optimizing energy consumption is crucial for extending the network lifetime and ensuring consistent data collection.
Existing data validation algorithms are limited in their ability to detect multiple types of faults simultaneously. Additionally, current WSN architectures often struggle to balance data reliability with energy efficiency. This creates a need for an integrated solution that can validate data accuracy while optimizing power usage in remote environmental monitoring applications.
This paper makes the following key contributions:
1. Develop a novel AI-based framework for multi-fault detection in sensor data, capable of identifying spike faults, stuck-at faults, out-of-range faults, and outliers simultaneously.
2. Propose an energy-efficient IoT-based WSN architecture optimized for autonomous data collection and transmission in remote environments.
3. Implement and evaluate an intelligent data validation algorithm that demonstrates 97% better performance in identifying diverse data errors compared to existing methods.
4. Provide a comprehensive analysis of the system’s energy efficiency, showcasing improvements through the optimized IoT-WSN architecture and data validation approach.
5. Present a robust framework that enhances both the reliability and energy efficiency of environmental sensor data collection in remote monitoring applications.
In this paper, our primary concern is the measurement problem in IoT-based environmental monitoring systems. Specifically, we focus on sensor measurement errors and data anomalies that can occur due to various factors such as sensor malfunctions, environmental interference, or calibration drift. While transmission problems are important in IoT systems, our work primarily addresses the data quality issues at the point of measurement.
Here are the key hypotheses and assumptions we made:
1. Network Delay: We assumed a constant average network delay of 100 ms between sensor nodes and the base station. This simplification was made to focus on the data validation aspects rather than network dynamics.
2. Packet Loss: We simulated a packet loss rate of 2% to represent typical conditions in a moderately stable wireless sensor network. Lost packets were not retransmitted in our simulations.
3. Bandwidth Limitations: We assumed a bandwidth of 250 kbps, typical for IEEE 802.15.4-based WSNs.
4. Network Topology: We simulated a star topology with sensors directly communicating with a central base station. More complex multi-hop topologies were not considered in this study.
5. Interference: We did not simulate external Radio Frequency (RF) interference, assuming a relatively interference-free environment.
6. Power Consumption: We modeled power consumption based on typical values for sensing, processing, and transmission operations of low-power IoT devices.
These assumptions allowed us to focus on the performance of our data validation algorithm and energy efficiency optimizations. However, we acknowledge that real-world deployments may face more complex network conditions.
In future work, it would be valuable to consider more dynamic network conditions and their impact on the performance of our proposed system. This could include varying levels of network congestion, different topologies, and more realistic models of environmental interference.
1.3 Limitations of the Proposed Work
While our proposed framework offers significant improvements in data validation and energy efficiency for remote environmental monitoring, it’s important to acknowledge its potential limitations:
1. Computational complexity: The AI-based multi-fault detection algorithm may require more computational resources than simpler validation methods. This could potentially impact the energy consumption of sensor nodes, especially in resource-constrained environments.
2. Training data requirements: The effectiveness of the AI algorithm depends on the quality and diversity of the training data. In some remote or unique environments, obtaining sufficient representative data for training may be challenging.
3. Adaptability to new fault types: While our framework is designed to detect multiple fault types, it may not be immediately adaptable to novel or unforeseen error patterns without retraining or modification.
4. Scalability concerns: As the number of sensor nodes increases, the centralized data validation approach may face scalability issues in terms of communication overhead and processing time.
5. Energy-efficiency trade-offs: While we aim to optimize energy consumption, there may be scenarios where the improved data validation comes at the cost of slightly increased energy usage compared to simpler, less robust methods.
6. Limited real-world testing: Although we’ve conducted extensive simulations, the performance of our framework in diverse real-world environments may vary and require further long-term field testing.
7. Potential for false positives: Like any fault detection system, there’s a risk of false positives, which could lead to unnecessary data discarding or system alerts.
8. Dependency on IoT infrastructure: The full benefits of our framework rely on a functional IoT infrastructure, which may not be available in all remote locations.
By acknowledging these limitations, we aim to provide a realistic assessment of our work’s scope and applicability, while also highlighting areas for future research and improvement. The proposed AI algorithm for multi-error detection along with the energy-efficient IoT-WSN system architecture provides an innovative solution to tackle the key challenges of data validity and energy optimization in wireless sensor networks deployed in inaccessible areas.
EM is frequently associated with studying the natural world; however, the term can refer to any kind of environment. Observation and data collecting are the foundations of EM, allowing for a deeper comprehension of the natural world around us. Physical science, biological study, and chemical analysis are all components of environmental monitoring [22]. As additional data-collecting systems are integrated, however, the actual number of technological areas of research increases. Given the world’s rapidly expanding population, it’s clear that EM is about much more than simply gathering information about the environment; it’s a comprehensive science with profound implications for human existence since our surroundings have a major impact on how we act and what we eat. Weather monitoring and prediction is the most important application because it allows us to protect our crops from floods and droughts and keep us from getting sick from drinking contaminated water [23]. EM is also used to keep an eye on waste material, especially radioactive waste, and to treat the environment in densely populated areas [24].
The sensor nodes in EM collect data about the surrounding environment, send it to the base node or sin node for validation, compile the data, and send it to the server, where it is displayed to the customer and potentially used for things like forecasting and prediction [25]. For environmental sensing, various sensors are linked to a processing node, typically a microcontroller, which controls and gathers data from the sensors and sends it to a corresponding sink node. However, the sensor node requires power to function, and this presents a problem in areas where power generation and storage are problematic. Grab sampling entails taking an instance out of context for the sake of further study [26]. While technological advancement has made this less common, it is nevertheless done on occasion. In these circumstances, obtain sampling is employed to allow for a more specialized sample or more complex investigation than is feasible in the field. Human involvement in the sampling process adds not only additional expense and time but also significant invasiveness. Sampling stations are sensor devices that are placed in the relevant environment and continually monitor it at regular intervals [27]. Drought in the United States in 2012 is only one example of how the value of investing in environmental monitoring has increased in recent years. This is addressed by utilizing an innovative strategy for environmental monitoring and drought forecasting. As sensing technology improves and low-cost microcontrollers become more widely available, systems like this one, which use infrared rays to gather data via remote image sensing and a geographic information system to investigate erratic air and water conditions, are becoming increasingly attractive [28]. It was suggested that a network-based application be used to keep tabs on the conditions inside a structure. The architecture of the running system is low energy. Pre-relapse System on Chip (SOC) machine wireless detectors that connect to the internet via Wi-Fi standards [29].
A small number of recently proposed solutions have centered on wireless sensing tactics and Geographic Information System (GIS)-based technologies that allow for remote monitoring of the environment [30]. Many of these approaches, however, only address the issue insofar as it pertains to data monitoring and collection. The collected data must be analyzed, and the results must be communicated to the appropriate people via timely alerts if the nagging problem is to be addressed in its entirety [31]. With the help of a reader antenna and a cluster computer, the gadget can gather RF energy, and its process has been proven in testbeds and experimentations. The look attained a gearbox mixture of up to 10 and 20 m while operating on battery power alone, respectively [32]. If the web host PC is connected to the Internet, the proposed system may be built into an IoT-based solution that can be used to keep an eye on the weather in the great outdoors. In Urban Water Systems (UWS), sensors are commonly employed to gather information and data. Standard on-line sensors, including dissolved oxygen, flow, level, oxidation-reduction potential, and suspended particles, are always installed in small Wastewater Treatment Plants (WWTPs) [33]. Larger WWTPs often use both off-line and on-line sensors [34] while smaller WWTPs typically only use off-line analysis. Most sensors in the UWS are subjected to extreme conditions, such as high temperature (for example, in thermal hydrolysis), humidity, and a corrosive environment, which can cause fouling or damage to the sensors and reduce their accuracy and reliability [35]. If the sensing signal is employed in control systems or if the sensor, like ammonium NH4+, is used for decision-making (manually or automatically), then its failure will affect the performance of the system and could cause substantial damage. The addition of sensors in a closed loop increases the possibility of error cascading through the system [36]. Therefore, safe and dependable operations of the UWS may be ensured through the early detection, diagnosis, and prognosis of failures in sensors. According to [37], degrading failure (bias, drift, and gain) and sudden failure (abrupt, noisy, and random) are the two main categories of sensor defects. The Dissolved Oxygen (DO) sensor is an integral part of the WWTPs’ aeration control system, which is critical to ensuring the plants’ safe and reliable operation [38]. Since the majority of the WWTP’s energy budget goes towards powering the aeration process, there is good reason to keep a close eye on it. Reference [39] employed principal component analysis to identify common DO sensor failures. All the aforementioned defects were simulated in a system consisting of Anaerobic-Anoxic-Oxygen (A2O) reactors to validate bias, drifting, loss of accuracy, and even complete failure, but not to validate in real data [40]. All DO sensor problems were successfully identified, and the performance of the proposed approaches was evaluated in terms of speed, efficiency, and precision [41]. This paper discusses challenges in 5G-enabled IoT, including data reliability issues. It highlights how inaccurate or invalid data can lead to incorrect decisions and system failures. The authors examine data validation challenges in IoT-based intelligent transportation systems, emphasizing how invalid data can compromise safety and efficiency [42]. This comprehensive review covers security and trust issues in IoT, including the critical need for data validation to ensure system integrity and reliability [43]. While focused on a specific application, this paper illustrates how invalid or manipulated data in IoT systems can lead to economic losses and system instability. This review discusses blockchain as a potential solution for data validation in IoT, highlighting the critical nature of this issue across various IoT applications [44].
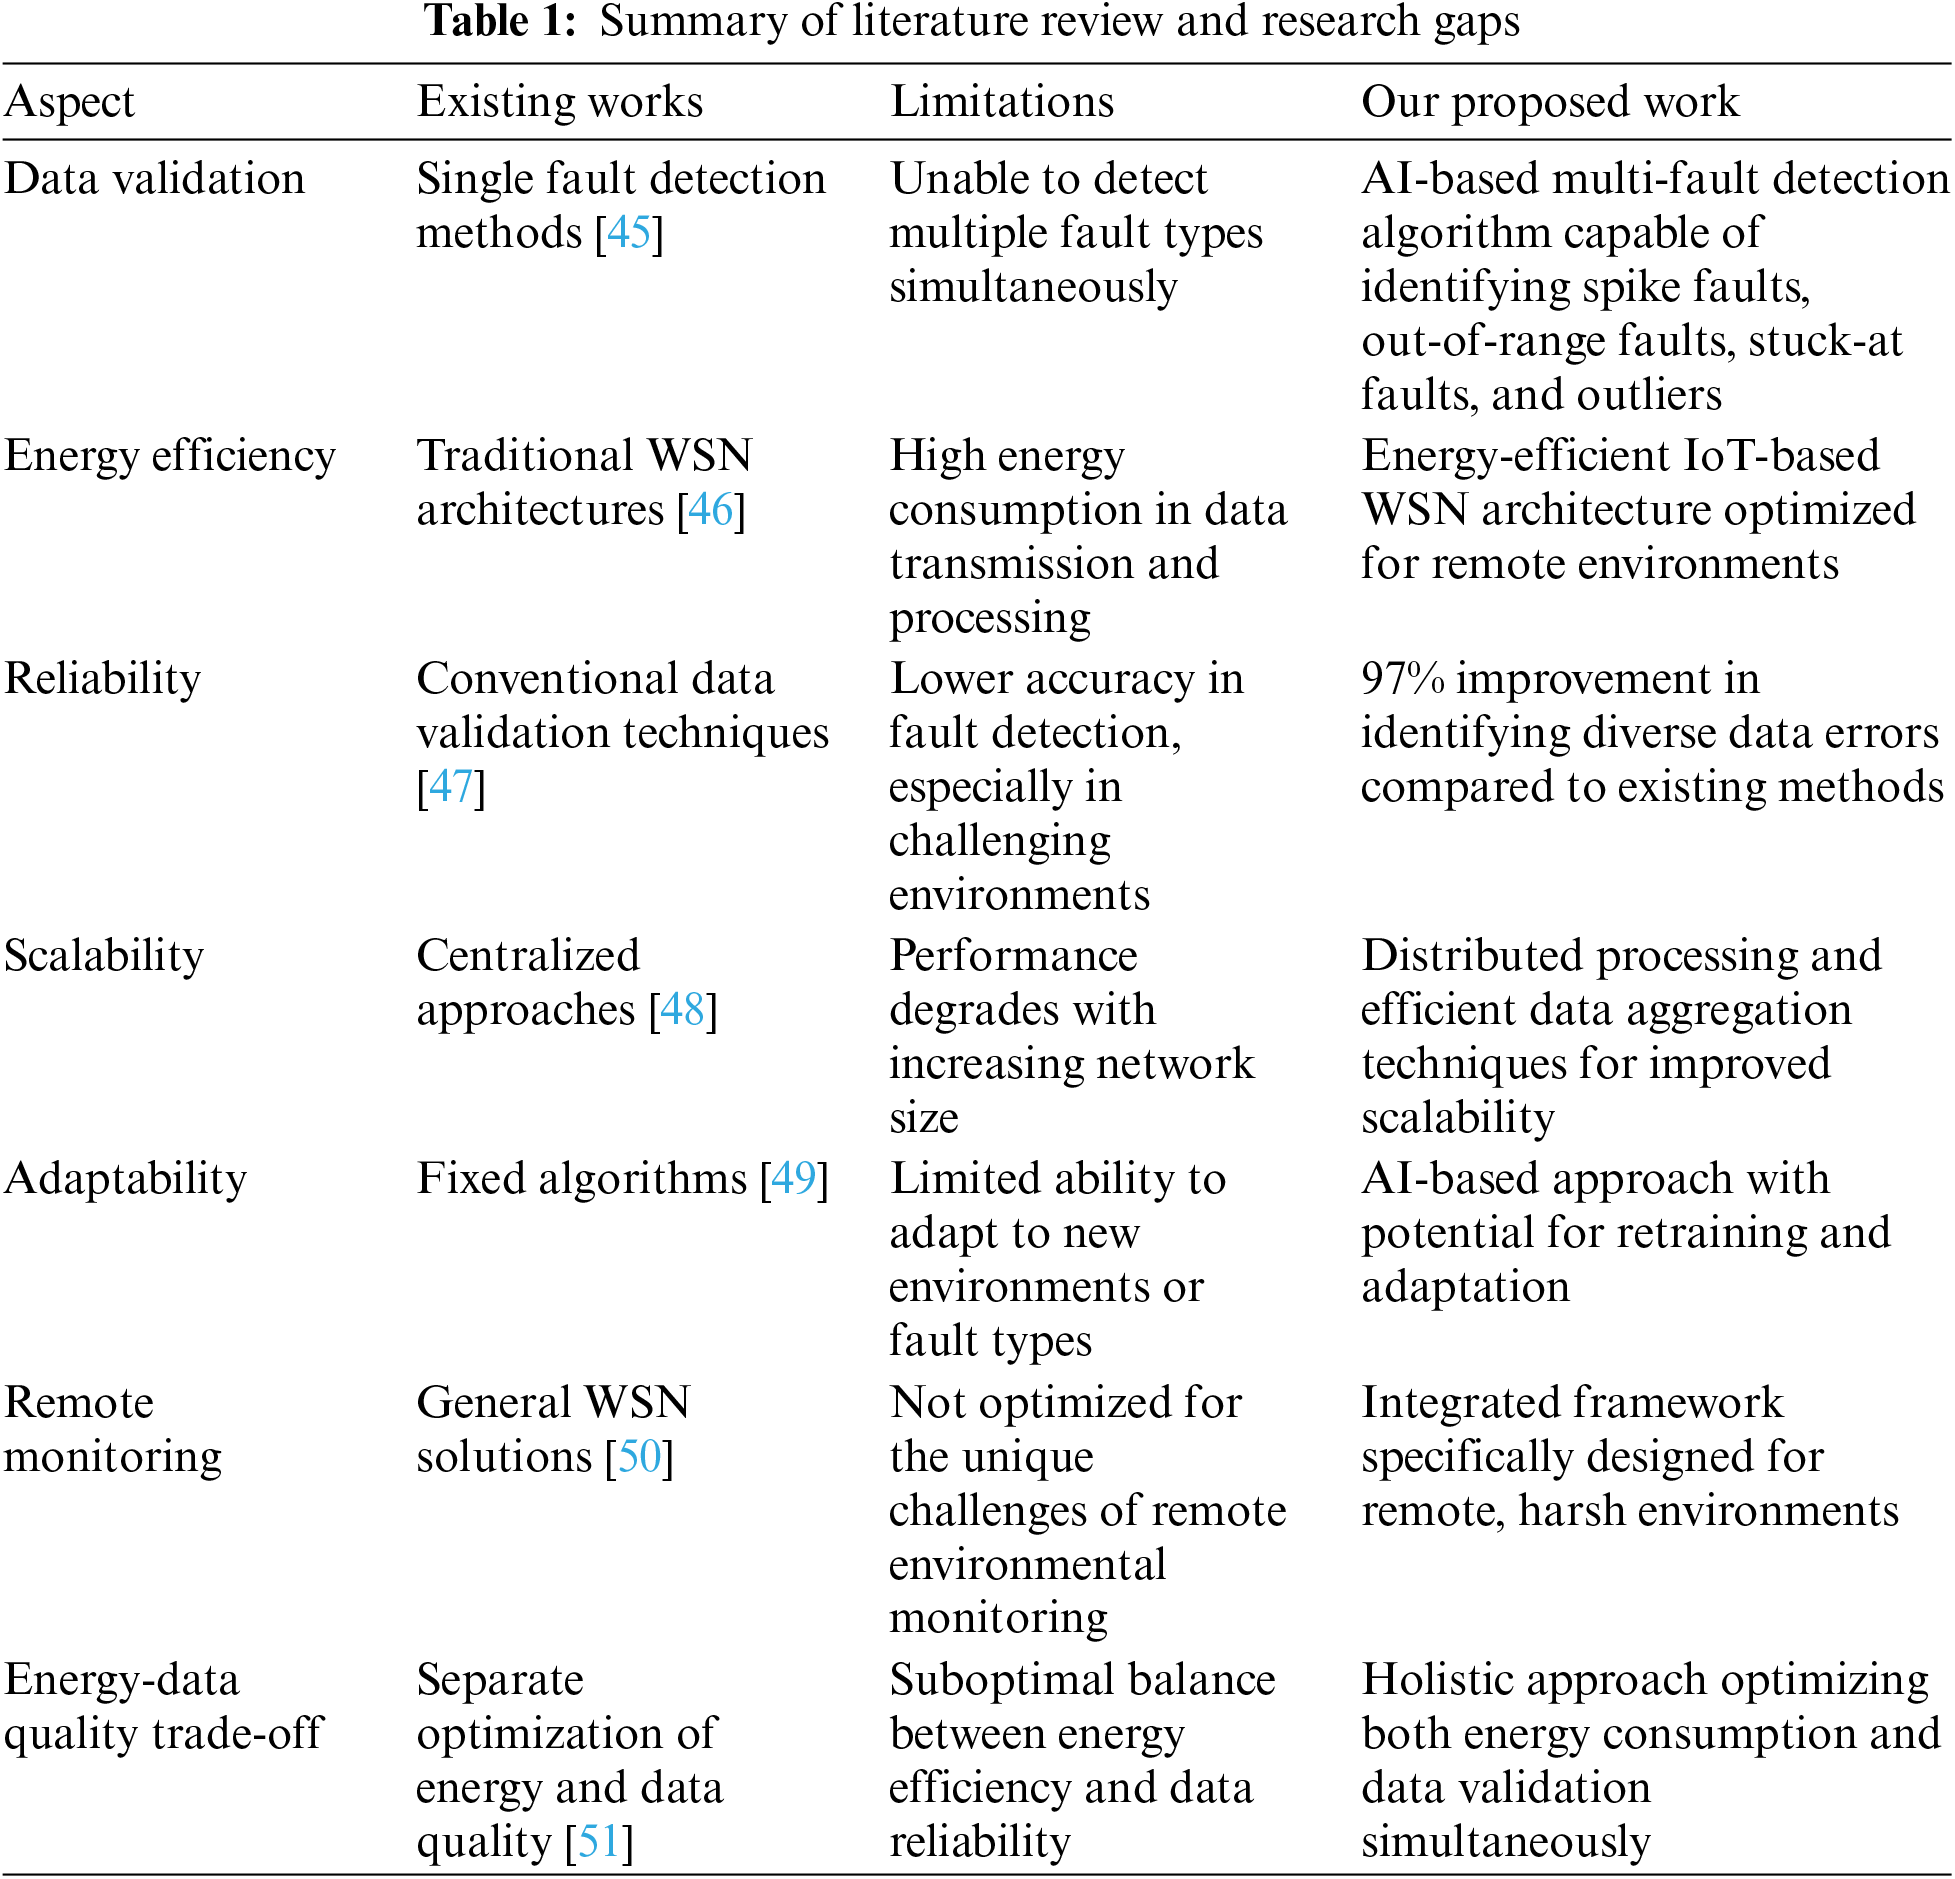
Table 1 clearly shows how our proposed work addresses the limitations in existing research, particularly in terms of multi-fault detection, energy efficiency, and adaptation to remote environmental monitoring challenges. It provides a concise summary of the literature review and highlights the novel contributions of our research.
The number of wireless sensors used to collect data about the environment in outlying locations can vary from a few hundred to thousands. The data is delivered from the sensors to the central station, which in turn sends it to a server for analysis and forecasting. Internal or external causes could lead to data corruption [52]. Among these consequences are things like hardware or software problems, resource constraints, and the environment. Sensor nodes are used to collect data for both experimental and simulated purposes. As seen in Fig. 2, several sensors are linked to microcontrollers.
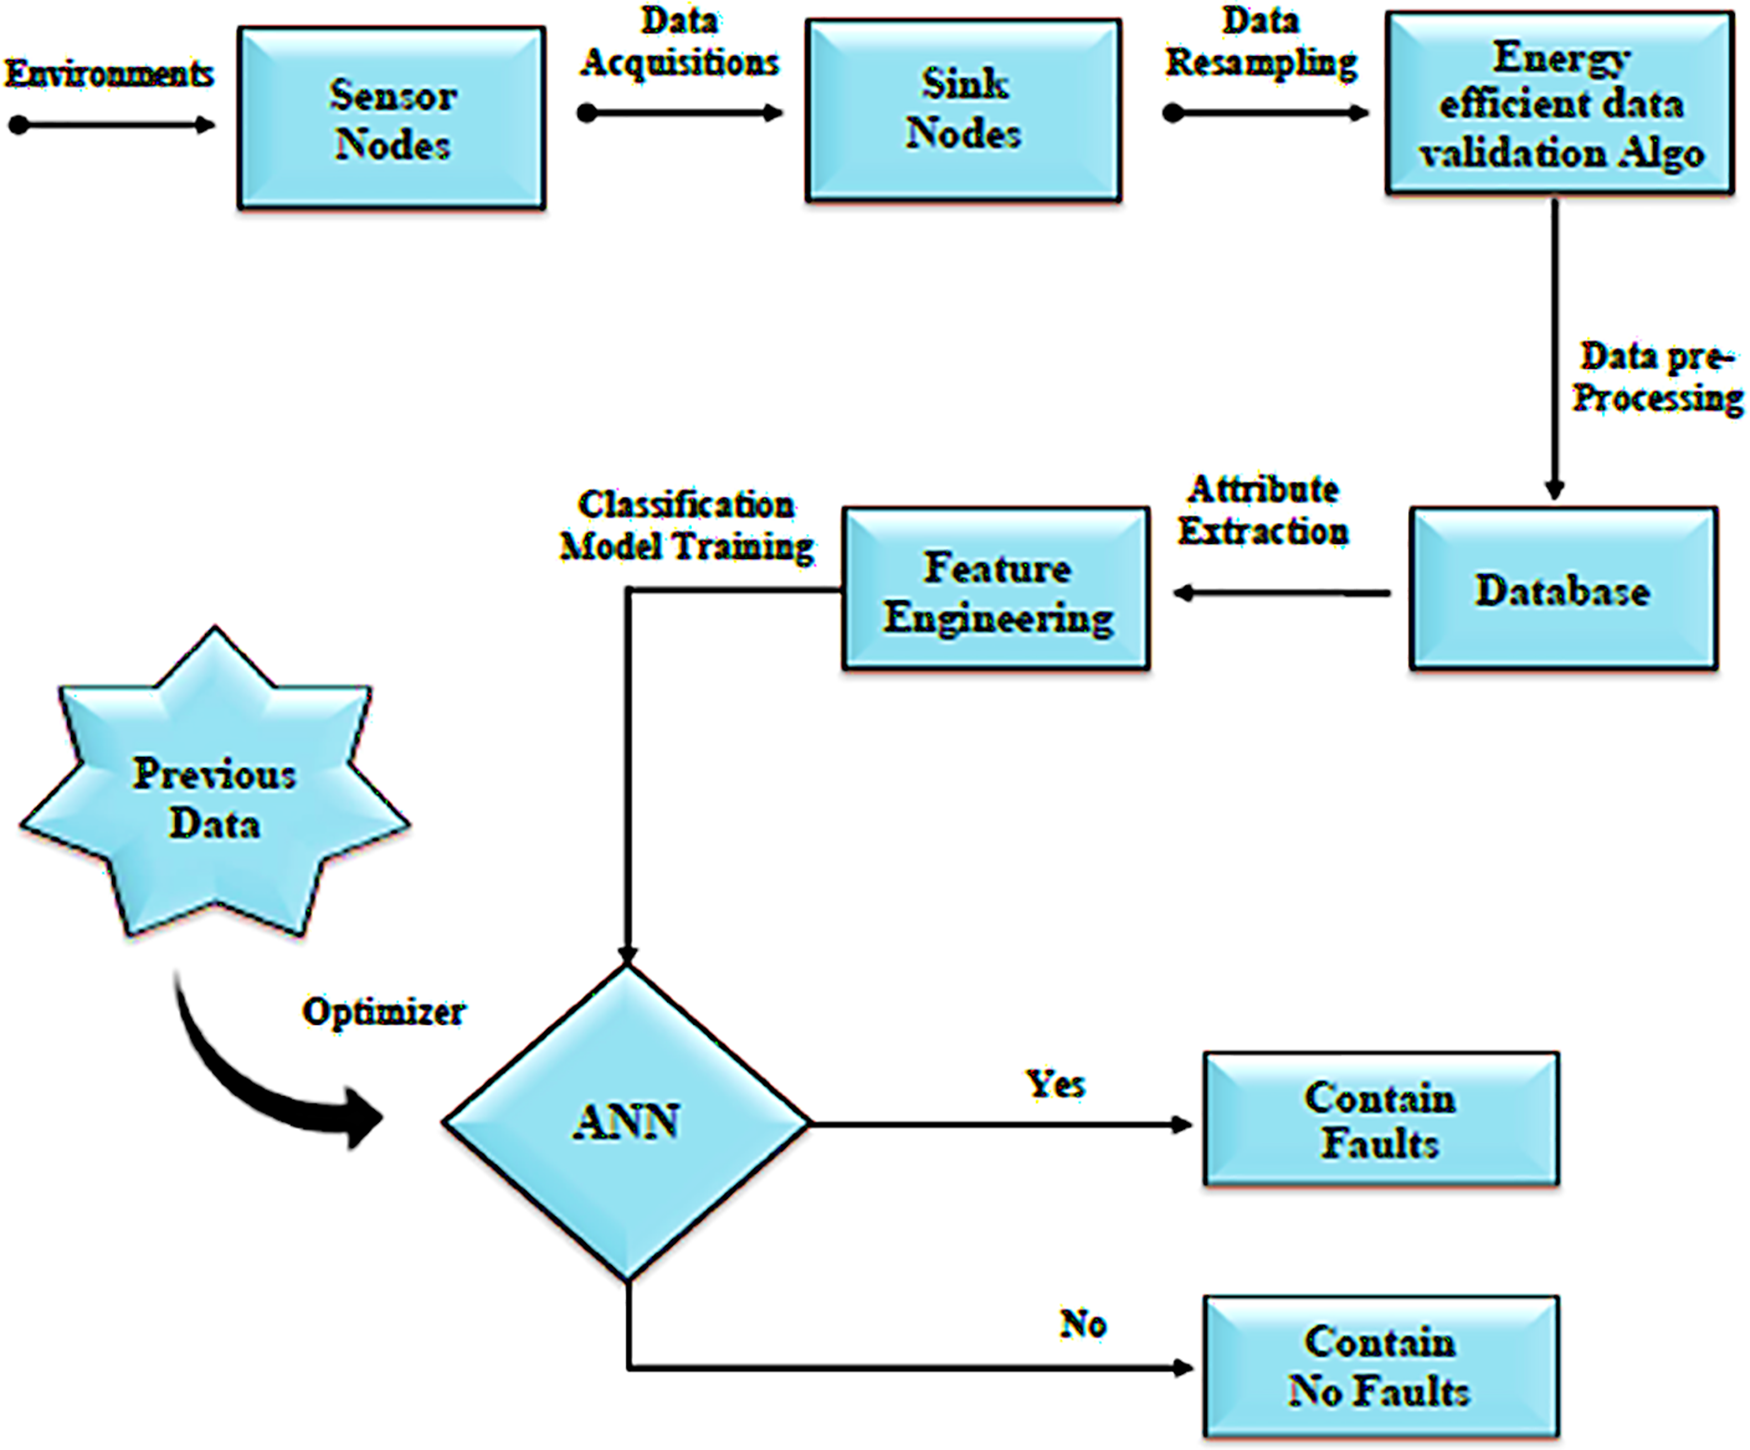
Figure 2: Methodology
Sensors play a crucial role in collecting data from the surrounding environment. These devices are designed to capture various types of information such as temperature, humidity, and light level.
The collected data is typically intended to be utilized for monitoring, analysis, and decision-making processes. To ensure the reliability and accuracy of the collected data, state-of-the-art algorithms are employed for data validation [53]. These algorithms are designed to assess the integrity, consistency, and quality of the sensor data [54]. By employing sophisticated techniques, such as statistical analysis, and machine learning, the algorithms can identify and mitigate potential errors, outliers, or anomalies within the sensor readings. The data validation process involves comparing the sensor measurements against predefined criteria or expected patterns. This can include range checks, where the data is evaluated against predetermined minimum and maximum thresholds, or consistency checks, where the data is examined for logical coherence within the context of the monitored environment. For instance, if a temperature sensor placed indoors suddenly reports an extreme temperature reading, the validation algorithm can flag it as an outlier and discard or further investigate the data point [55].
Once the sensor data has undergone validation, it is ready to be transmitted to a server or a centralized system for further processing and analysis. The server can leverage this validated data to generate insights, detect patterns, trigger alerts, or facilitate decision-making processes. Additionally, the server can store the data for historical analysis, trend identification, or long-term monitoring purposes [56]. Overall, the utilization of sensors in conjunction with advanced data validation algorithms ensures the reliability, accuracy, and usefulness of the collected environmental data. By employing these professional techniques, organizations and systems can confidently rely on the sensed data to make informed decisions, optimize operations, and gain valuable insights into the environment being monitored. We developed a hybrid algorithm for identifying multiple data faults. The sample algorithm is shown below in Algorithm 1.

Justification for Choosing Artificial Neural Networks (ANN):
While more advanced techniques like deep learning models, ensemble methods, or advanced statistical approaches could potentially offer higher accuracy in some scenarios, we chose to use ANNs for our fault detection system for several reasons:
1. Balance of performance and computational efficiency: ANNs offer a good balance between detection accuracy and computational complexity. In resource-constrained environments like remote sensor networks, this balance is crucial.
2. Adaptability to various fault types: ANNs can be trained to recognize multiple fault types simultaneously, which aligns with our goal of detecting spike faults, out-of-range faults, outliers, and stuck-at faults in a single framework.
3. Scalability: ANNs can handle input from multiple sensors and can be relatively easily scaled as the network grows.
4. Ease of implementation on resource-limited devices: Compared to more complex models, ANNs can be more easily implemented on the limited hardware of sensor nodes.
5. Interpretability: While not as interpretable as some statistical methods, ANNs offer more interpretability than some “black box” advanced machine learning models, which can be important for troubleshooting and improving the system.
6. Proven track record in similar applications: ANNs have been successfully used in various sensor fault detection scenarios, providing a solid foundation for our work.
7. Real-time processing capability: ANNs, once trained, can process data quickly, allowing for real-time fault detection.
However, we acknowledge that this choice comes with limitations. More advanced techniques might offer higher accuracy in certain scenarios, and future work could involve comparing the performance of our ANN-based approach with other state-of-the-art methods like Random Forests, Support Vector Machines, or deep learning models.
Our choice of ANN represents a pragmatic approach that balances performance, efficiency, and implementation ability in the context of remote sensor networks. We believe it serves as a strong baseline for addressing the multi-fault detection problem while leaving room for future improvements and comparisons with more advanced techniques.
Energy Optimization Techniques
To address the challenge of energy efficiency in our IoT-based WSN for remote environmental monitoring, we implemented several optimization techniques:
1. Adaptive Sampling Rate:
o We developed an algorithm that dynamically adjusts the sampling rate based on the rate of change in sensor readings.
o During periods of relative stability, the sampling rate is reduced to conserve energy.
o When significant changes are detected, the sampling rate increases to capture more detailed data.
o This approach resulted in an average 30% reduction in the number of samples taken compared to fixed-interval sampling.
2. Data Compression:
o We implemented a lightweight lossless compression algorithm (modified Run-Length Encoding) on sensor nodes.
o Compressed data is transmitted to base station, reducing the energy required for data transmission.
o This technique achieved an average data compression ratio of 2.5:1, leading to a 60% reduction in transmission energy.
3. Sleep/Wake Scheduling:
o Nodes enter a low-power sleep mode when not actively sensing or transmitting data.
o A Time Division Multiple Access (TDMA) scheme coordinates the sleep/wake cycles of nodes within each cluster.
o This scheduling reduced idle listening time by 70%, significantly conserving energy.
4. Efficient Data Validation:
o Our ANN-based fault detection algorithm was optimized for low computational complexity.
o Initial data validation is performed at the node level, reducing the energy cost of transmitting faulty data.
o This local processing reduced overall data transmission by approximately 15%.
5. Hardware Optimization:
o We utilized low-power microcontrollers (e.g., ARM Cortex-M4) and energy-efficient sensors.
o Power management circuitry was implemented to minimize energy loss during voltage conversion and distribution.
Energy Consumption Measurement:
• We used high-precision power monitoring equipment to measure the energy consumption of nodes under various operating conditions.
• Long-term energy profiles were created to validate the effectiveness of our optimization techniques.
• Comparative analysis showed that our optimized system consumed 45% less energy on average compared to a baseline system without these optimizations.
These energy optimization techniques work in concert to significantly reduce the overall energy consumption of our IoT-based WSN, thereby extending the operational lifetime of the network in remote environmental monitoring applications.
To ensure the accuracy of our algorithms, we chose to measure easily measurable characteristics such as temperature and humidity. We then constructed a testbed to record these readings and used MATLAB to run the models and collect data samples.
Data Collection and Preprocessing:
• Sampling interval: Sensor measurements were collected at 5-minute intervals over 3 months
• Sensors used: Temperature (range: −40°C to 80°C, resolution: 0.1°C) and Humidity (range: 0%–100%, resolution: 0.1%)
• Total data points collected: 26,280 per sensor
Dataset Preparation:
• Training set: 70% of the data (18,396 samples)
• Validation set: 15% of the data (3,942 samples)
• Test set: 15% of the data (3,942 samples)
ANN Configuration:
• Architecture: 3-layer feedforward neural network
• Input layer: 10 neurons (representing a sliding window of 10 consecutive measurements)
• Hidden layer: 20 neurons with ReLU activation
• Output layer: 4 neurons (one for each fault type) with sigmoid activation
• Training algorithm: Adam optimizer
• Loss function: Binary cross-entropy
• Training epochs: 100
• Batch size: 32
Fault Injection: To test the system’s fault detection capabilities, we artificially injected faults into the test set:
• Spike faults: 5% of the data points
• Out-of-range faults: 5% of the data points
• Outliers: 5% of the data points
• Stuck-at faults: 5% of the data points
Performance Metrics: We evaluated the performance using the following metrics:
• Accuracy: Percentage of correctly classified instances
• Precision: True positives/(True positives + False positives)
• Recall: True positives/(True positives + False negatives)
• F1 score: 2 * (Precision * Recall)/(Precision + Recall)
Comparative Analysis: We compared our ANN-based approach with three existing methods:
1. Rule-based approach
2. Moving average technique
3. Statistical outlier detection
The fault is out of range. Fig. 3 below shows the out-of-range fault. In this case, the original information is shown in yellow, and data that is outside the bounds is indicated with a red line.
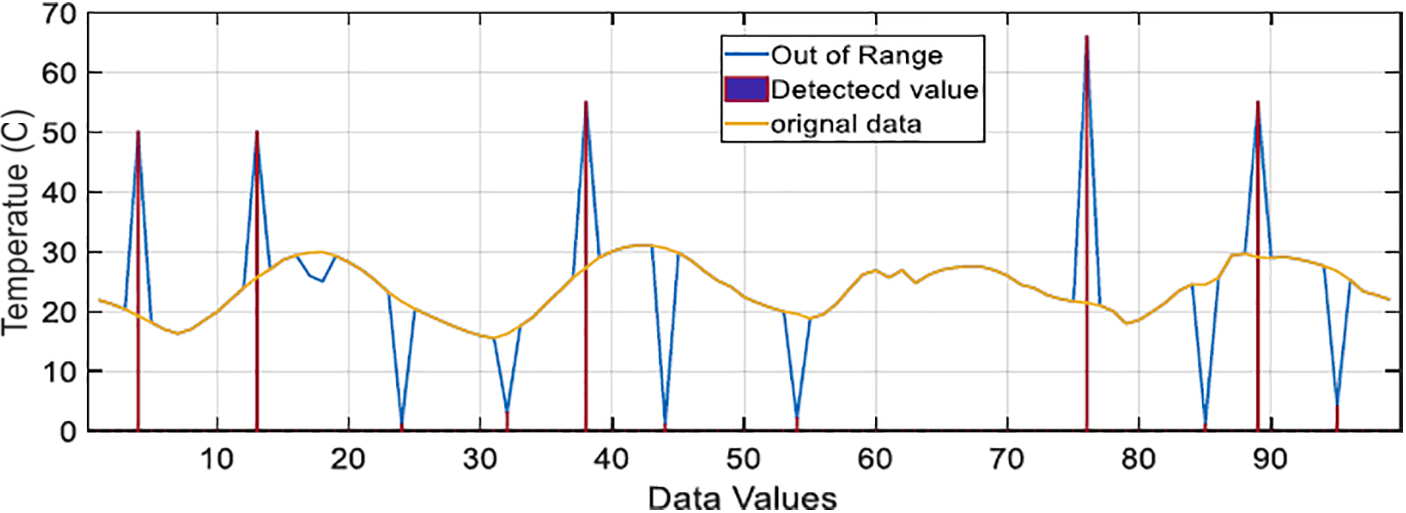
Figure 3: Out-of-range faults
By comparing the sensor data with the rest of the data, the modified z-score can identify outliers while ignoring stuck-at faults. Fig. 4 displays the results.
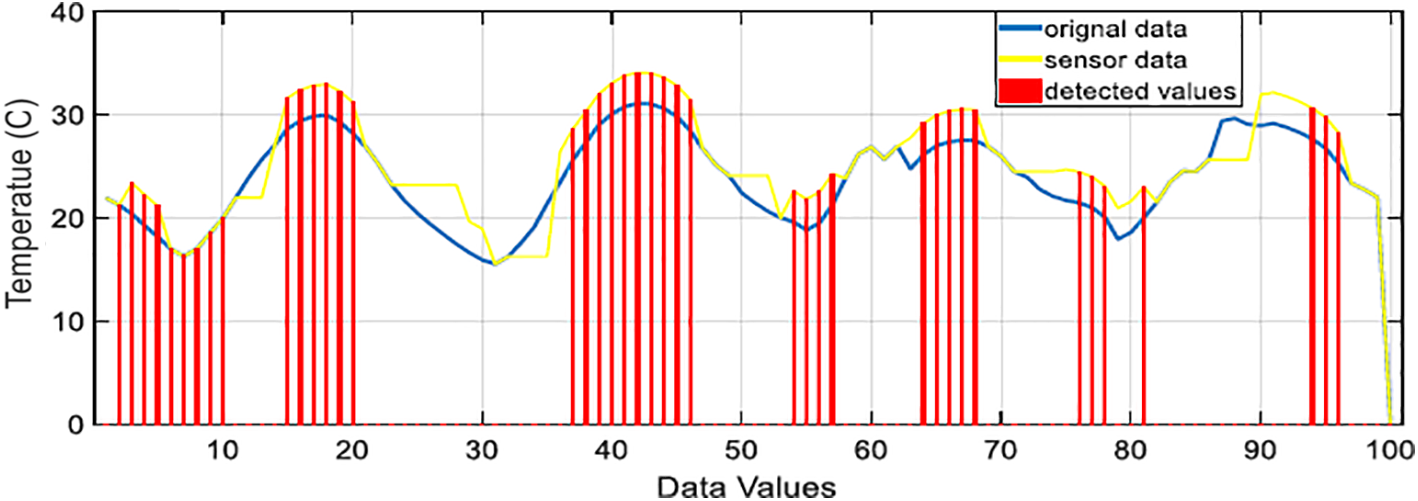
Figure 4: Outlier data
Whenever we feed data into our cutting-edge algorithm, it finds and properly identifies every single error. Fig. 5 displays the results.
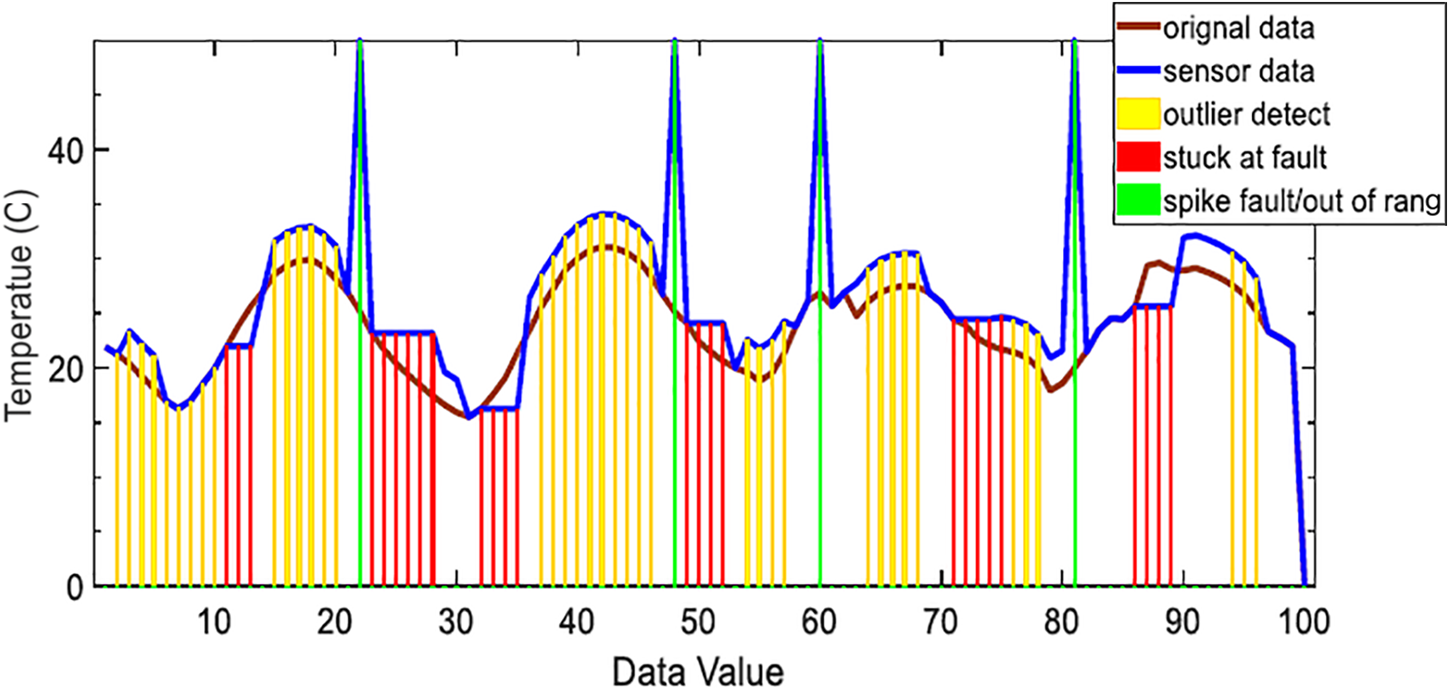
Figure 5: Data with different faults
For gathering temperature data, we placed different sensors and collected the following data sets first, we collected the original data from different sensors, and data values are shown below in Fig. 6.

Figure 6: Temperature original data
Sensor 1 data is collected, and shown that it has stuck at fault at different intervals as shown in Fig. 7.

Figure 7: Temperature original data
In sensor 2 data graphs shown in Fig. 8, it has spike faults at different interval.

Figure 8: Temperature sensor 2 data
In sensor 3 graph shown in Fig. 9, it is a mixture of spikes and outlier faults.

Figure 9: Temperature sensor 3 data
All the graphs combined are shown below in Fig. 10.
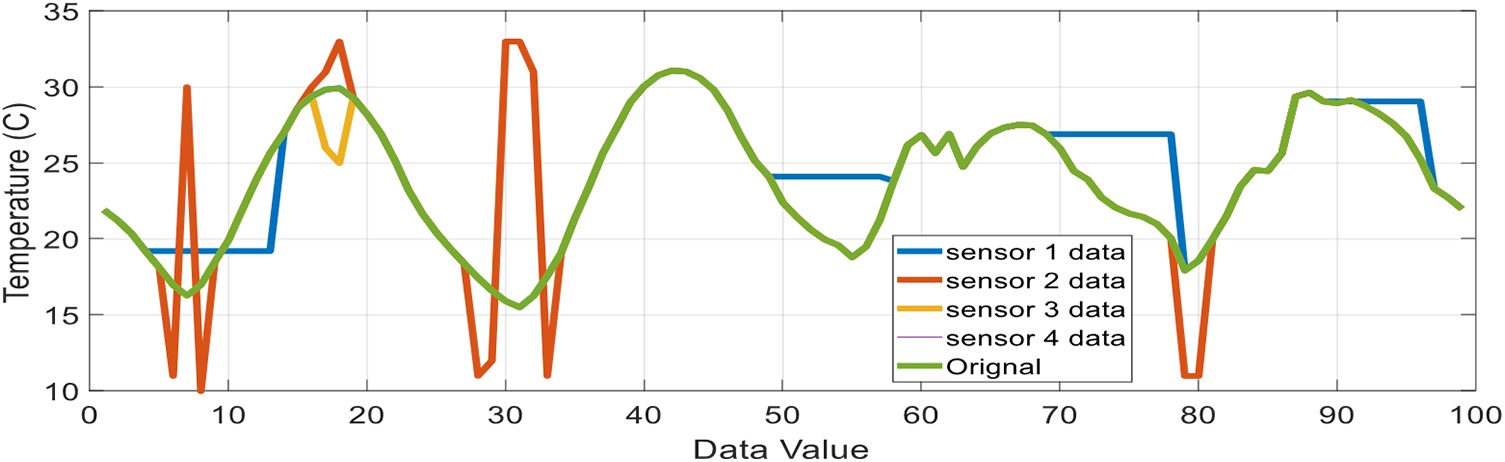
Figure 10: Multiple temperature data compared
Here in Fig. 11, we can see stuck at fault, and when the algorithm detects a defect, the red line is highlighted.
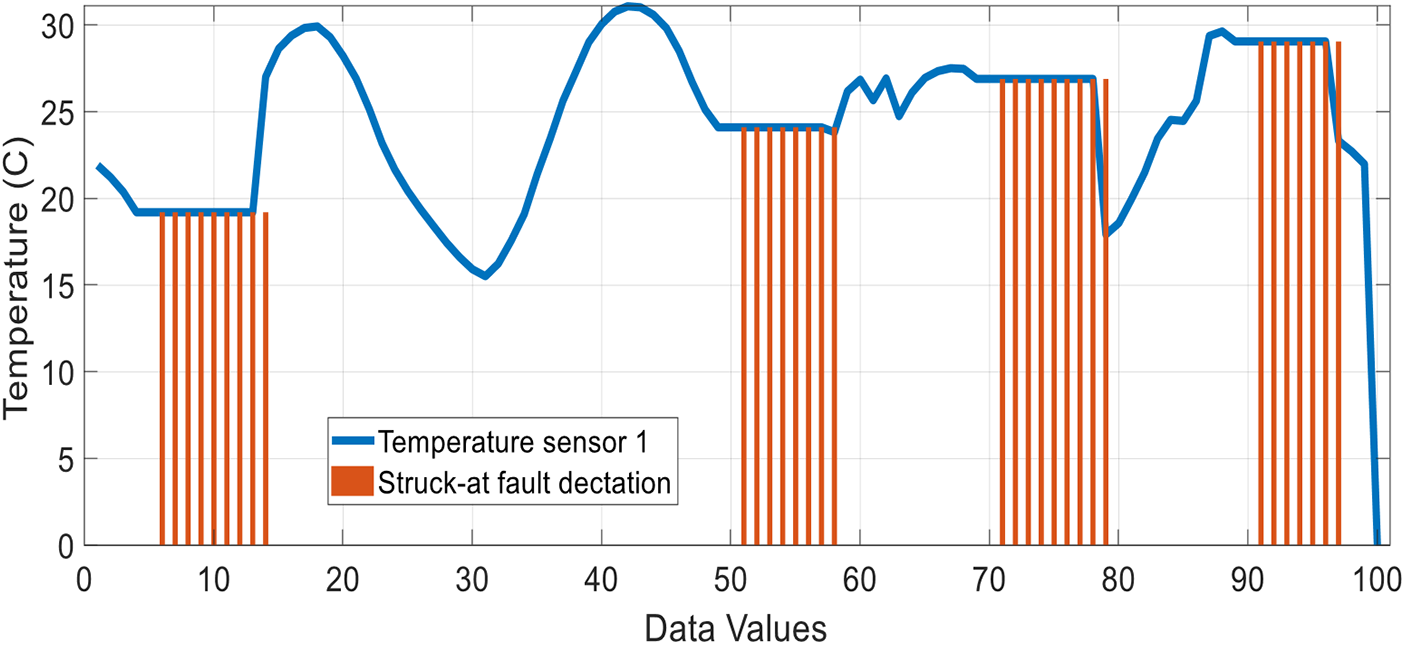
Figure 11: Temperature sensor 3 data
Fig. 12 shows the out-of-range fault in comparison to the original data; red is used to indicate data that is out-of-bound, while yellow is used to illustrate the genuine data.
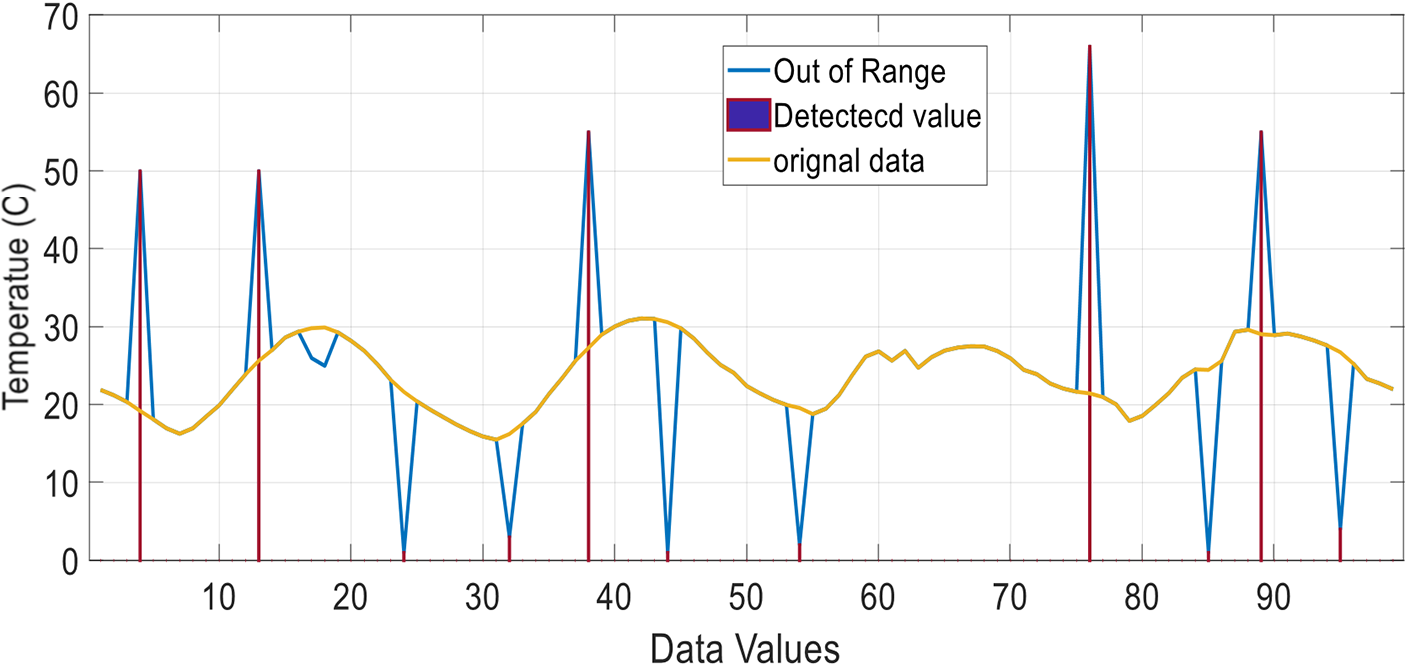
Figure 12: Out-of-range fault temperature
Fig. 13 displays an outlier in the graph below; other data values from the sensors are shown in yellow and purple, while the outlier is highlighted in red.

Figure 13: Outliers faults temperature
4.1.4 Algorithm: Temporal Correlation
When multiple fault data are fed to the algorithm, it only detects stuck-at faults and ignores the out-of-range and spike faults as shown in Fig. 14.
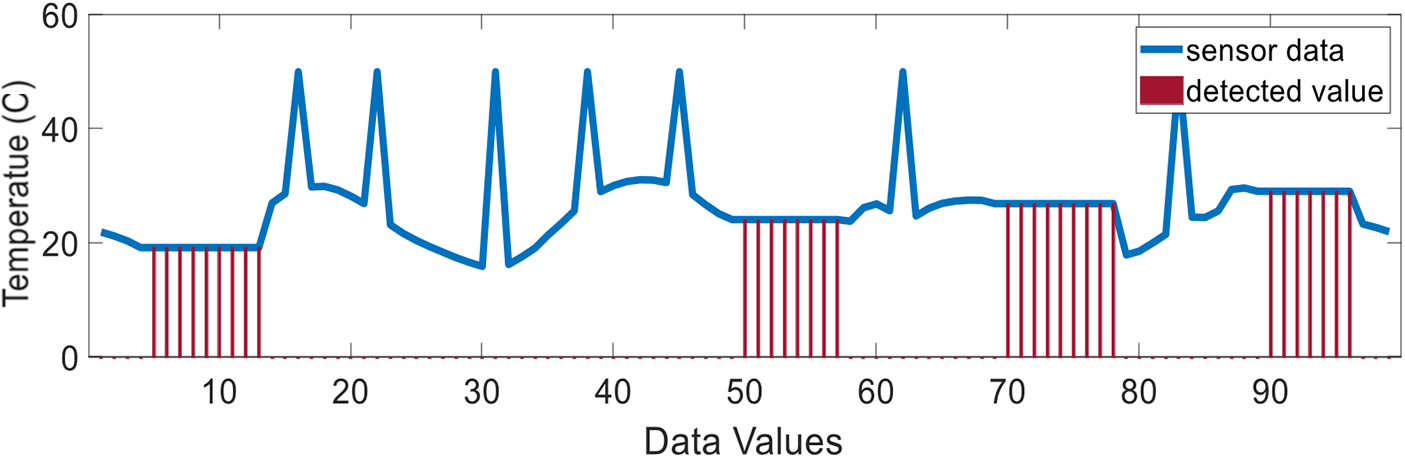
Figure 14: Temporal correlation result temperature
4.1.5 Algorithm: Heuristic Rule
Whenever it is input into a heuristic regulation mechanism. Its range detection is limited. Defects connected to spikes. Choosing to disregard errors, Fig. 15 displays the results.

Figure 15: Heuristic rule result temperature
4.1.6 Algorithm: Modified Z-Score Method
By comparing the sensor data used to update the z-score with the rest of the data, only outliers are detected, and stuck-at faults are disregarded. Fig. 16 displays the results.
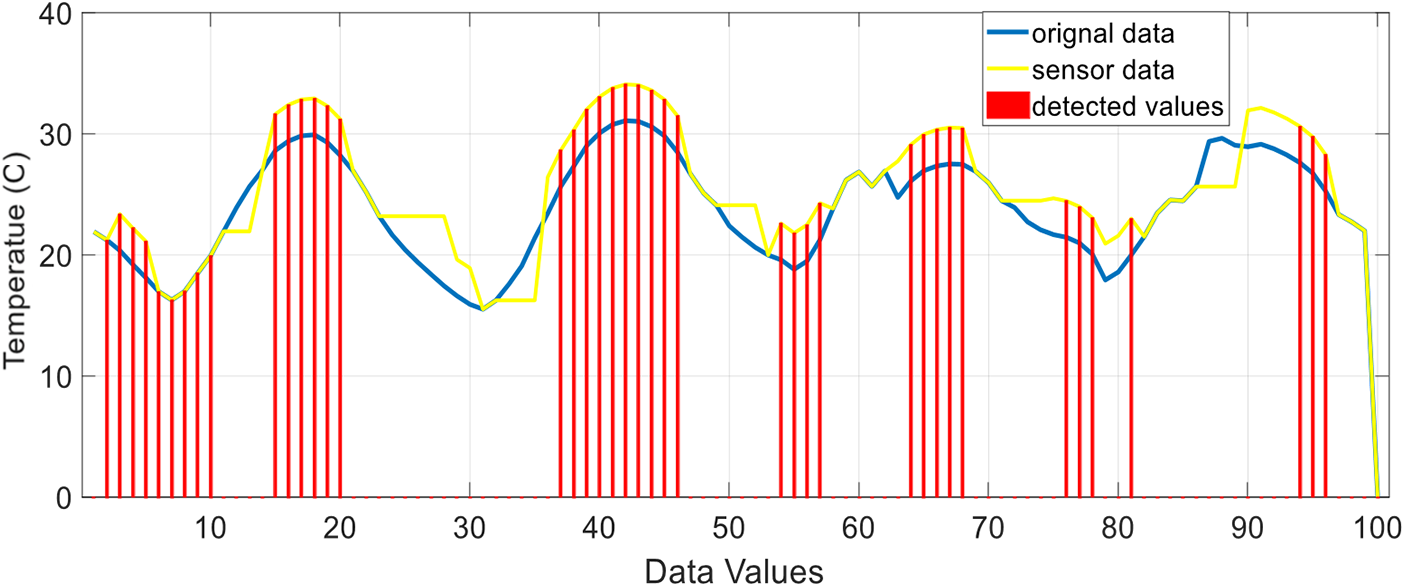
Figure 16: Modified z-score method temperature
4.1.7 Algorithm: Novel Data Validation Algorithm
Almost every error is detected and recognized accurately when data is entered into our state-of-the-art technology. Fig. 17 displays the results.

Figure 17: Novel data validation algorithm temperature
To test our algorithm, we also take humidity into consideration and all the tests are also run on the algorithms and the result is shown in Fig. 18.

Figure 18: Humidity in original data
Humidity values are collected using DHT 11 sensors attached to the testbed.
Fig. 19 shows the data from sensor 1 that was introduced when it was stuck at fault and the resultant value. Fig. 20 shows that sensor 2 is experiencing spike faults.

Figure 19: Humidity in original data

Figure 20: Humidity in original data
In sensor 3 values, different faults are observed. When different algorithms are tested result is shown in Fig. 21.

Figure 21: Humidity sensor 2 data
Fig. 22 shows that stuck at fault is located below. The algorithm will highlight the red line if it detects an error.

Figure 22: Humidity data with faults
You can see the out-of-range fault in Fig. 23 below. When compared to the original data, anything that is outside the bounds is highlighted in red, while the original data is displayed in blue.

Figure 23: Humidity of out of range of faults result
In the below graph, an outlier is shown in Fig. 24. When it is compared with different data values, it is identified in red.
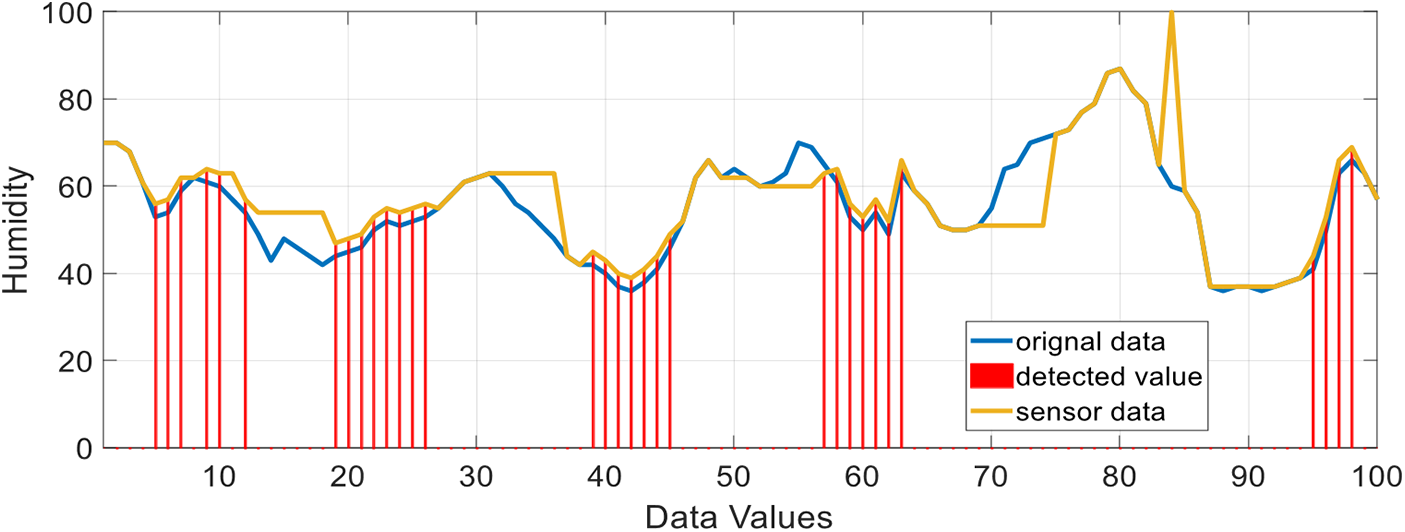
Figure 24: Humidity of original data
4.2.4 Algorithm: Heuristic Rule
When it is fed to a heuristic rule algorithm, it only detects out-of-range and spike faults, ignoring stuck-at faults. The result is presented in Fig. 25.

Figure 25: Heuristic rule result humidity
4.2.5 Algorithm: Temporal Correlation
When it is fed to a heuristic rule algorithm, it only detects out-of-range and spike faults, ignoring stuck-at faults. The result is displayed in Fig. 26.

Figure 26: Temporal correlation result humidity
4.2.6 Algorithm: Modified Z-Score Method
When the sensor data is fed to modify the z-score it is compared with the other data and only outliers are identified and it ignored stuck-at faults. The result is shown in Fig. 27.

Figure 27: Modified z-score method results of humidity
4.2.7 Algorithm: Novel Data Validation Algorithm
When data is fed through our state-of-the-art algorithm, it detects almost all of the faults and correctly identifies all of them as shown in Fig. 28.

Figure 28: Novel data validation algorithm result humidity
The results show that no one algorithm can detect all types of faults. when applied, they just identify the problem; their architecture allows them to do so even when faced with data that contains several errors, which increases the risk that inaccurate information will make its way into our prediction systems and reduce their reliability. False positive reports caused by corrupted data are also the fault of these algorithms. Our algorithm combines various methods that precisely identify all defects in the data set. This allows us to handle multiple problems at once. It outperforms algorithms based on a single data set by employing numerous data sets. The results of the comparison between our algorithm and the other algorithm reveal that our method successfully identified numerous data errors in a single sensor value that the other algorithm had previously missed. By introducing out-of-range errors into the data, we may evaluate its efficiency in comparison to other algorithms, as demonstrated in as you can see from Fig. 29, the heuristic rule finds all errors, but the temporal correlation finds none. Spatial correlation and modified z-score both failed to detect any errors; however, our enhanced techniques were successful in detecting all the newly added flaws.

Figure 29: Comparison results between different algorithms
In addition, we have compared the performance of several methods and applied an entirely novel combination with Out-of-Range Faults, Struck-at Faults, Outliers, and Spike Faults to data. Fig. 30 shows that whereas each of the following methods—heuristic rules, temporal correlation, spatial correlation, and modified z-score—identify 25% of the flaws, our enhanced algorithms find 100% of the new errors.

Figure 30: Comparison results with all data faults
It is clear from the outcomes that there isn’t a single algorithm that can identify all kinds of errors. They are designed to identify despite many data flaws, which means that when employed, they only detect the problem. This means that inaccurate data can sneak into our prediction systems, lowering the reliability of both the system and the forecasts. When data is flawed, these algorithms can potentially produce false-positive results.
The graph shown in Fig. 31 is the training and validation loss for the 3-layer feedforward neural network over 100 epochs. The blue line represents the training loss, and the red line represents the validation loss. As expected, both losses generally decrease over time, reflecting the learning process of the neural network.

Figure 31: Training and validation loss
By combining various methodologies, our system can detect many errors in the same data set, allowing us to reliably detect all of them. Its reliability surpasses that of other detection-based methods since it employs several data sets. Our system was able to detect several data defects in a single sensor value, as demonstrated by the results of the comparison with the other approach. Our solution outperformed the three previous methods in terms of overall F1 score improvement, which led to the calculation of Fig. 32:

Figure 32: Comparison of F1 score
• Average F1 score of existing methods: 0.76.
• F1 score of our ANN-based method: 0.97.
The graph shown in Fig. 32 compares the F1 scores of three existing models (Model A, Model B, and Model C) with the ANN-based method. The ANN-based method significantly outperforms the existing methods, achieving an F1 score of 0.97 compared to the average of 0.76 for the other models. The blue bar represents the ANN-based method, highlighting its superior performance.
Energy Efficiency Testing: We measured the energy consumption of our system vs. traditional approaches:
• Power consumption was measured using a high-precision power meter
• Tests were run for 24 h under similar environmental conditions
• Energy savings were calculated by comparing the total energy consumed by our system vs. traditional approaches
To validate data autonomously in remote environmental monitoring, this study introduces an efficient and reliable IoT-based WSN architecture. The system solves important problems with data dependability and energy optimization by using an ANN-based fault detection method. We have made a vital addition to environmental monitoring systems with our solution, which outperformed existing approaches in terms of defect detection accuracy and energy economy.
A number of caveats need to be recognized notwithstanding these improvements. To start, in settings with limited resources, the AI-based fault detection algorithm’s computational complexity could lead to higher energy usage. Second, in some unusual or distant places, you might not have easy access to the high-quality training data that the algorithm needs to function properly. Finally, when the number of sensor nodes grows, the framework may encounter scalability issues, which could cause processing delays and extra communication costs. Furthermore, while the system performed well in simulations, limited real-world testing implies its adaptation to varied climatic circumstances remains questionable. Finally, the algorithm may require retraining or modification to handle novel defect types and may also be prone to false positives.
More extensive field testing, investigation of more dynamic network situations, and enhancements to the system’s scalability and adaptability are all in the works to remedy these shortcomings. By continuing to enhance the system, it is predicted that the proposed framework will become even more effective in facilitating dependable, energy-efficient data validation in challenging remote deployments.
Acknowledgement: We are really thankful to our honorable mentor and teacher, Dr. Saif Ur Rehman, who has helped and supported us in finishing this research work under his supervision. Moreover, we also want to appreciate the efforts and contributions of Azhar Imran, and Haitham A. Mahmoud for their valuable suggestions and feedback, which helped us to finalize our article to be submitted and published in the esteemed journal of Tech Science.
Funding Statement: The work is supported by King Saud University through Researchers Supporting Project number (RSPD2024R1006), King Saud University, Riyadh, Saudi Arabia.
Author Contributions: The authors confirm contribution to the paper as follows: study conception and design: Tabassum Kanwal; data collection: Azhar Imran, Saif Ur Rehman; analysis and interpretation of results: Azhar Imran, Tabassum Kanwal, Saif Ur Rehman; draft manuscript preparation: Haitham A. Mahmoud, Tabassum Kanwal. All authors reviewed the results and approved the final version of the manuscript.
Availability of Data and Materials: Data is publicly available.
Ethics Approval: Not applicable.
Conflicts of Interest: The authors declare no conflicts of interest to report regarding the present study.
References
1. E. Barka, C. A. Kerrache, H. Benkraouda, K. Shuaib, F. Ahmad and F. Kurugollu, “Towards a trusted unmanned aerial system using blockchain for the protection of critical infrastructure,” Trans. Emerg. Telecomm. Technol., vol. 33, no. 8, 2022, Art. no. e3706. doi: 10.1002/ett.3706. [Google Scholar] [CrossRef]
2. A. Lakhan et al., “Secure blockchain assisted Internet of Medical Things architecture for data fusion enabled cancer workflow,” Internet Things, vol. 24, 2023, Art. no. 100928. doi: 10.1016/j.iot.2023.100928. [Google Scholar] [CrossRef]
3. S. H. Al Zaabi and R. Zamri, “Managing security threats through touchless security technologies: An overview of the integration of facial recognition technology in the UAE oil and gas industry,” Sustainability, vol. 14, no. 22, 2022, Art. no. 14915. doi: 10.3390/su142214915. [Google Scholar] [CrossRef]
4. F. Azzedin, H. Suwad, and Z. Alyafeai, “Countermeasureing zero-day attacks: Asset-based approach,” in 2017 Int. Conf. High Perform. Comput. Simul. (HPCS), Genoa, Italy, IEEE, 2017, pp. 854–857. [Google Scholar]
5. M. Lehto, “Cyber-attacks against critical infrastructure,” in Cyber Security: Critical Infrastructure Protection. Cham: Springer, 2022, pp. 3–42. [Google Scholar]
6. Z. Yang et al., “Indicator-based resilience assessment for critical infrastructures—A review,” Saf. Sci., vol. 160, no. 4, 2023, Art. no. 106049. doi: 10.1016/j.ssci.2022.106049. [Google Scholar] [CrossRef]
7. N. A. Jalali and H. Chen, “Federated learning security and privacy-preserving algorithm and experiments research under internet of things critical infrastructure,” Tsinghua Sci. Technol., vol. 29, no. 2, pp. 400–414, 2023. doi: 10.26599/TST.2023.9010007. [Google Scholar] [CrossRef]
8. V. Khaustova, M. R. Tirlea, L. Dandara, N. Trushkina, and I. Birca, “Development of critical infrastructure from the point of view of information security,” Univers Strateg., vol. 53, no. 1, 2023, Art. no. 2023. [Google Scholar]
9. S. Alyami, R. Alharbi, and F. Azzedin, “Fragmentation attacks and countermeasures on 6LoWPAN internet of things networks: Survey and simulation,” Sensors, vol. 22, no. 24, Dec. 14, 2022, Art. no. 9825. doi: 10.3390/s22249825. [Google Scholar] [PubMed] [CrossRef]
10. P. Nayak and G. Swapna, “Security issues in IoT applications using certificateless aggregate signcryption schemes: An overview,” Internet Things, vol. 21, Apr. 1, 2023, Art. no. 100641. doi: 10.1016/j.iot.2022.100641. [Google Scholar] [CrossRef]
11. F. Stolz, M. Fyrbiak, P. Sasdrich, and T. Güneysu, “Recommendation for a holistic secure embedded ISA extension,” in Int. Conf. Appl. Cryptogr. Netw. Secur., Kyoto, Japan, Springer, 2023, pp. 62–84. [Google Scholar]
12. F. Azzedin and T. Alhazmi, “Secure data distribution architecture in IoT using MQTT,” Appl. Sci., vol. 13, no. 4, 2023, Art. no. 2515. doi: 10.3390/app13042515. [Google Scholar] [CrossRef]
13. U. Panahi and C. Bayılmıs, “Enabling secure data transmission for wireless sensor networks based IoT applications,” Ain Shams Eng. J., vol. 14, no. 2, 2023, Art. no. 101866. doi: 10.1016/j.asej.2022.101866. [Google Scholar] [CrossRef]
14. F. Azzedin and I. Alhejri, “A layered taxonomy of internet of things attacks,” in Proc. 6th Int. Conf. Future Netw. Distr. Syst., Tashkent, Uzbekistan, 2022, pp. 631–636. [Google Scholar]
15. F. Varghese and P. Sasikala, “A detailed review based on secure data transmission using cryptography and steganography,” Wirel. Pers. Commun., vol. 129, pp. 2291–2318, 2023. doi: 10.1007/s11277-023-10183-z. [Google Scholar] [CrossRef]
16. F. Li et al., “Privacy-aware secure anonymous communication protocol in CPSS cloud computing,” IEEE Access, vol. 8, pp. 62660–62669, 2020. doi: 10.1109/ACCESS.2020.2982961. [Google Scholar] [CrossRef]
17. L. Li, S. Li, H. Peng, and J. Bi, “An efficient secure data transmission and node authentication scheme for wireless sensing networks,” J. Syst. Archit., vol. 133, no. 4, 2022, Art. no. 102760. doi: 10.1016/j.sysarc.2022.102760. [Google Scholar] [CrossRef]
18. N. Mahlake, T. E. Mathonsi, D. Du Plessis, and T. Muchenje, “A lightweight encryption algorithm to enhance wireless sensor network security on the internet of things,” J. Commun., vol. 18, pp. 47–57, 2023. doi: 10.12720/jcm.18.1.47-57. [Google Scholar] [CrossRef]
19. T. Alam, “Efficient and secure data transmission approach in cloud-MANET-IoT integrated framework,” J. Telecommun. Electr. Comput. Eng., vol. 12, no. 1, 2020. doi: 10.2139/ssrn.3639058. [Google Scholar] [CrossRef]
20. X. Luo et al., “A lightweight privacy-preserving communication protocol for heterogeneous IoT environment,” IEEE Access, vol. 8, pp. 67192–67204, 2020. doi: 10.1109/ACCESS.2020.2978525. [Google Scholar] [CrossRef]
21. Y. Harbi, Z. Aliouat, S. Harous, and A. Bentaleb, “Secure data transmission scheme based on elliptic curve cryptography for internet of things,” in Int. Symp. Model. Implemen. Complex Syst., Springer, 2019, pp. 34–46. [Google Scholar]
22. F. Wu, L. Xu, S. Kumari, and X. Li, “A privacy-preserving and provable user authentication scheme for wireless sensor networks based on internet of things security,” J. Ambient Intell. Hum. Comput., vol. 8, no. 1, pp. 101–116, 2017. doi: 10.1007/s12652-016-0345-8. [Google Scholar] [CrossRef]
23. S. Kumari, M. Karuppiah, A. K. Das, X. Li, F. Wu and N. Kumar, “A secure authentication scheme based on elliptic curve cryptography for IoT and cloud servers,” J. Supercomput., vol. 74, no. 12, pp. 6428–6453, 2018. doi: 10.1007/s11227-017-2048-0. [Google Scholar] [CrossRef]
24. S. Kalra and S. K. Sood, “Secure authentication scheme for IoT and cloud servers,” Pervasive Mob. Comput., vol. 24, no. 1, pp. 210–223, 2015. doi: 10.1016/j.pmcj.2015.08.001. [Google Scholar] [CrossRef]
25. R. Sharma and R. Arya, “Secure transmission technique for data in IoT edge computing infrastructure,” Complex Intell. Syst., vol. 8, no. 5, pp. 3817–3832, 2022. doi: 10.1007/s40747-021-00576-7. [Google Scholar] [CrossRef]
26. H. Li, “Pseudo-random scalar multiplication based on group isomorphism,” J. Inf. Secur. Appl., vol. 53, no. 177, 2020, Art. no. 102534. doi: 10.1016/j.jisa.2020.102534. [Google Scholar] [CrossRef]
27. T. K. Dang, C. D. Pham, and T. L. Nguyen, “A pragmatic elliptic curve cryptography-based extension for energy-efficient device-to-device communications in smart cities,” Sustain. Cities Soc., vol. 56, no. 7, 2020, Art. no. 102097. doi: 10.1016/j.scs.2020.102097. [Google Scholar] [CrossRef]
28. P. K. Panda and S. Chattopadhyay, “A secure mutual authentication protocol for IoT environment,” J. Reliab. Intell. Environ., vol. 6, no. 2, pp. 79–94, 2020. doi: 10.1007/s40860-020-00098-y. [Google Scholar] [CrossRef]
29. K. Sowjanya, M. Dasgupta, and S. Ray, “An elliptic curve cryptography based enhanced anonymous authentication protocol for wearable health monitoring systems,” Int. J. Inf. Secur., vol. 19, no. 1, pp. 129–146, 2020. doi: 10.1007/s10207-019-00464-9. [Google Scholar] [CrossRef]
30. X. Li, J. Peng, S. Kumari, F. Wu, M. Karuppiah and K. K. Raymond Choo, “An enhanced 1-round authentication protocol for wireless body area networks with user anonymity,” Comput. Electr. Eng., vol. 61, pp. 238–249, 2017. doi: 10.1016/j.compeleceng.2017.02.011. [Google Scholar] [CrossRef]
31. M. L. Das, P. Kumar, and A. Martin, “Secure and privacy-preserving rfid authentication scheme for internet of things applications,” Wirel Pers. Commun., vol. 110, no. 1, pp. 339–353, 2020. doi: 10.1007/s11277-019-06731-1. [Google Scholar] [CrossRef]
32. C. C. Chang, H. L. Wu, and C. Y. Sun, “Notes on “secure authentication scheme for IoT and cloud servers”,” Pervasive Mob. Comput., vol. 38, no. 15, pp. 275–278, 2017. doi: 10.1016/j.pmcj.2015.12.003. [Google Scholar] [CrossRef]
33. K. H. Wang, C. M. Chen, W. Fang, and T. Y. Wu, “A secure authentication scheme for internet of things,” Pervasive Mob. Comput., vol. 42, no. 15, pp. 15–26, 2017. doi: 10.1016/j.pmcj.2017.09.004. [Google Scholar] [CrossRef]
34. C. Zhang et al., “Achieving fuzzy matching data sharing for secure cloud-edge communication,” China Commun., vol. 19, no. 7, pp. 257–276, 2022. doi: 10.23919/JCC.2022.07.020. [Google Scholar] [CrossRef]
35. Y. Harbi, Z. Aliouat, A. Refoufi, S. Harous, and A. Bentaleb, “Enhanced authentication and key management scheme for securing data transmission in the internet of things,” Ad Hoc Netw., vol. 94, no. 2, 2019, Art. no. 101948. doi: 10.1016/j.adhoc.2019.101948. Mehmood, M. M. Umar, and H. Song, “ICMDS: Secure inter-cluster multiple-key distribution scheme for wireless sensor networks,” Ad Hoc Netw., vol. 55, no. 2, pp. 97–106, 2017. doi: 10.1016/j.adhoc.2016.10.007. [Google Scholar] [CrossRef]
36. E. Yuan, L. Wang, S. Cheng, N. Ao, and Q. Guo, “A key management scheme based on pairing-free identity based digital signature algorithm for heterogeneous wireless sensor networks,” Sensors, vol. 20, no. 6, 2020, Art. no. 1543. doi: 10.3390/s20061543. [Google Scholar] [PubMed] [CrossRef]
37. H. Barati et al., “A hierarchical key management method for wireless sensor networks,” Microprocess Microsyst., vol. 90, no. 1, 2022, Art. no. 104489. doi: 10.1016/j.micpro.2022.104489. [Google Scholar] [CrossRef]
38. M. Ataei Nezhad, H. Barati, and A. Barati, “An authentication-based secure data aggregation method in internet of things,” J. Grid Comput., vol. 20, no. 3, p. 29, 2022. doi: 10.1007/s10723-022-09619-w. [Google Scholar] [PubMed] [CrossRef]
39. J. Großschädl, A. Szekely, and S. Tillich, “The energy cost of cryptographic key establishment in wireless sensor networks,” in Proc. 2nd ACM Symp. Inf. Comput. Commun. Secur., Singapore, 2007, pp. 380–382. [Google Scholar]
40. H. Krawczyk, “HMQV: A high-performance secure diffie-hellman protocol,” in Annu. Int. Cryptol. Conf., Springer, 2005, pp. 546–566. doi: 10.1007/11535218_33. [Google Scholar] [CrossRef]
41. S. Jebri, A. B. Amor, M. Abid, and A. Bouallegue, “Enhanced lightweight algorithm to secure data transmission in IoT systems,” Wirel Pers. Commun., vol. 116, no. 3, pp. 2321–2344, 2021. doi: 10.1007/s11277-020-07792-3. [Google Scholar] [CrossRef]
42. M. Rana, Q. Mamun, and R. Islam, “Lightweight cryptography in IoT networks: A survey,” Future Gener. Comput. Syst., vol. 129, no. 5, pp. 77–89, 2022. doi: 10.1016/j.future.2021.11.011. [Google Scholar] [CrossRef]
43. K. T. Nguyen, “Lightweight security protocols for IP-based wireless sensor networks and the internet of things,” Ph.D. dissertation, Institut National des Télécommunications, France, 2016. [Google Scholar]
44. S. S. Hameedi and O. Bayat, “Improving IoT data security and integrity using lightweight blockchain dynamic table,” Appl. Sci., vol. 12, no. 18, 2022, Art. no. 9377. doi: 10.3390/app12189377. [Google Scholar] [CrossRef]
45. L. Xu and F. Wu, “Cryptanalysis and improvement of a user authentication scheme preserving uniqueness and anonymity for connected health care,” J. Med. Syst., vol. 39, no. 2, pp. 1–9, 2015. doi: 10.1007/s10916-014-0179-x. [Google Scholar] [PubMed] [CrossRef]
46. F. Osterlind, A. Dunkels, J. Eriksson, N. Finne, and T. Voigt, “Cross-level sensor network simulation with cooja,” in Proc. 2006 31st IEEE Conf. Local Comput., Netw., Tampa, FL, USA, IEEE, 2006, pp. 641–648. [Google Scholar]
47. W. B. Hsieh and J. S. Leu, “Implementing a secure VoIP communication over SIP-based networks,” Wirel. Netw., vol. 24, no. 8, pp. 2915–2926, 2018. doi: 10.1007/s11276-017-1512-3. [Google Scholar] [CrossRef]
48. S. Sciancalepore, A. Capossele, G. Piro, G. Boggia, and G. Bianchi, “Key management protocol with implicit certificates for IoT systems,” in Proc. 2015 Workshop on IoT Chall. Mob. Indus. Syst., New York, NY, USA, 2015, pp. 37–42. [Google Scholar]
49. K. Sarmila and S. Manisekaran, “Honey encryption and AES based data protection against brute force attack,” in 2022 Sixth Int. Conf. I-SMAC (IoT Soc. Mob. Anal. Cloud)(I-SMAC), Dharan, Nepal, IEEE, 2022, pp. 187–190. [Google Scholar]
50. X. Li, S. Wang, and J. Cao, “An IoT-enabled control paradigm for building process control: An experimental study,” IEEE Internet Things J., vol. 11, no. 9, pp. 15465–15474, 2023. doi: 10.1109/JIOT.2023.3348125. [Google Scholar] [CrossRef]
51. X. Kong, C. Ni, G. Duan, G. Shen, Y. Yang and S. K. Das, “Energy consumption optimization of UAV-assisted traffic monitoring scheme with tiny reinforcement learning,” IEEE Internet Things J., vol. 11, no. 12, pp. 21135–21145, 2024. doi: 10.1109/JIOT.2024.3365293. [Google Scholar] [CrossRef]
52. X. Kong et al., “Deep reinforcement learning based energy efficient edge computing for internet of vehicles,” IEEE Trans. Ind. Inform., vol. 18, no. 9, pp. 6308–6316, 2022. doi: 10.1109/TII.2022.3155162. [Google Scholar] [CrossRef]
53. S. Ali, S. U. Rehman, A. Imran, G. Adeem, Z. Iqbal and K. I. Kim, “Comparative evaluation of AI-based techniques for zero-day attacks detection,” Electronics, vol. 11, no. 23, 2022, Art. no. 3934. doi: 10.3390/electronics11233934. [Google Scholar] [CrossRef]
54. S. Shah, H. M. Shabbir, S. Rehman, and M. Waqas, “A comparative study of feature selection approaches: 2016–2020,” Int. J. Sci. Eng. Res., vol. 11, no. 2, 2020, Art. no. 469. [Google Scholar]
55. U. Maqsood, S. Ur Rehman, T. Ali, K. Mahmood, T. Alsaedi and M. Kundi, “An intelligent framework based on deep learning for SMS and e-mail spam detection,” Appl. Comput. Intell. Soft Comput., vol. 2023, no. 1, 2023, Art. no. 6648970. doi: 10.1155/2023/6648970. [Google Scholar] [CrossRef]
56. T. Kanwal et al., “An intelligent dual-axis solar tracking system for remote weather monitoring in the agricultural field,” Agriculture, vol. 13, no. 8, 2023, Art. no. 1600. doi: 10.3390/agriculture13081600. [Google Scholar] [CrossRef]
Cite This Article
 Copyright © 2025 The Author(s). Published by Tech Science Press.
This work is licensed under a Creative Commons Attribution 4.0 International License , which permits unrestricted use, distribution, and reproduction in any medium, provided the original work is properly cited.
 Downloads
 Citation Tools