
 Submit a Paper
 Propose a Special lssue
 Open Access
ARTICLE
Low Carbon Building Design Optimization Based on Intelligent Energy Management System
College of Tourism and Urban-Rural Planning, Chengdu University of Technology, Chengdu, 610059, China
* Corresponding Author: Zhenyi Feng. Email:
Energy Engineering 2023, 120(1), 201-219. https://doi.org/10.32604/ee.2022.023471
Received 27 April 2022; Accepted 27 June 2022; Issue published 27 October 2022
 View Full Text
 Download PDF
Abstract
The construction of relevant standards for building carbon emission assessment in China has just started, and the quantitative analysis method and evaluation system are still imperfect, which hinders the development of lowcarbon building design. Therefore, the use of intelligent energy management system is very necessary. The purpose of this paper is to explore the design optimization of low-carbon buildings based on intelligent energy management systems. Based on the proposed quantitative method of building carbon emission, this paper establishes the quota theoretical system of building carbon emission analysis, and develops the quota based carbon emission calculation software. Smart energy management system is a low-carbon energy-saving system based on the reference of largescale building energy-saving system and combined with energy consumption. It provides a fast and effective calculation tool for the quantitative evaluation of carbon emission of construction projects, so as to realize the carbon emission control and optimization in the early stage of architectural design and construction. On this basis, the evaluation, analysis and calculation method of building structure based on carbon reduction target is proposed, combined with the carbon emission quota management standard proposed in this paper. Taking small high-rise residential buildings as an example, this paper compares and analyzes different building structural systems from the perspectives of structural performance, economy and carbon emission level. It provides a reference for the design and evaluation of low-carbon building structures. The smart energy management system collects user energy use parameters. It uses time period and time sequence to obtain a large amount of data for analysis and integration, which provides users with intuitive energy consumption data. Compared with the traditional architectural design method, the industrialized construction method can save 589.22 megajoules (MJ) per square meter. Based on 29270 megajoules (MJ) per ton of standard coal, the construction area of the case is about 8000 m2, and the energy saving of residential buildings is 161.04 tons of standard coal. This research is of great significance in reducing the carbon emission intensity of buildings.Keywords
With the rapid development of human industrial civilization, mankind began to demand a large amount of natural resources regardless of the consequences, and ignored the environmental problems caused by rapid development for a long time. However, in recent ten years, many disasters and more and more serious energy problems caused by global climate change. It makes people begin to examine a series of survival and development tests caused by the unsustainable development model for a long time. As the construction industry involves many fields of carbon emissions, many carbon emissions are generated in the production, transportation and construction of building materials. The global construction industry and related fields cause 70% of the greenhouse effect. It can be seen that reducing the carbon emission of buildings will play an important role in controlling the overall carbon emission.
China’s construction industry has long been uneconomical, and the energy consumption and construction waste of repeated construction are huge. The whole life cycle of low-carbon buildings can minimize the impact of buildings on the environment. At the same time, low-carbon buildings can drive the development and transformation of construction related fields, such as material research and manufacturing and real estate mode. Thirdly, the development of low-carbon buildings promotes the research of Chinese architectural design and the R & D and promotion of low-carbon technologies in building technology related fields. In the whole life cycle of low-carbon buildings, architectural design plays a decisive role in their carbon emission performance, and the strategy selection and adjustment in the early stage of design are very important. Therefore, in addition to the qualitative strategy proposed by the traditional architectural design method, the low-carbon architectural design also needs to make a scientific analysis on the effectiveness and rationality of the design strategy. Therefore, new quantitative analysis methods and tools must be used to quantitatively analyze and select the methods and strategies used in the design.
Low carbon building design plays a very important role in environmental energy conservation and environmental protection. The purpose of Charoenkit et al. [1] was to propose a new method for developing self-help housing low-carbon disaster resistance assessment tool (lodat SH). It combines the opinions of experts and community residents, assigns weights, determines indicators, and establishes benchmarks. It aims to develop a simple, relevant and practical tool for non expert users such as self-help residents. Xie et al. [2] used the combination of Monte Carlo and analytic hierarchy process to calculate the index weight to ensure that the weight judgment matrix can pass the consistency test. He selected a typical urban community to test the operability of the system. The sensitivity of each index was analyzed by one at a time (OAT) method. He discussed the impact of these indicators on the evaluation results. The results show that the proportion of green buildings, the proportion of new energy vehicles and low-carbon public transport are the most sensitive. Luo et al. [3] believed that low carbon buildings have been adopted as a strategic objective, demonstrating the great potential of reducing carbon emissions. He aimed to make a comprehensive and objective analysis of the research field of low-carbon buildings by using scientific metrology methods. Oti et al. [4] reported stable clay and hemp construction materials for sustainability and low carbon use. Ground blast furnace slag (GGBS) is used as a partial substitute for traditional stabilizers (lime or Portland cement) to stabilize lower Oxford clay (LOC) containing industrial hemp. The parameters considered in his study include: material properties, unconfined compressive strength, linear expansion and cost. The low-carbon building design technology they put forward is not very good in low-carbon energy conservation. In order to solve this problem, we expect to introduce smart energy management system, so we have collected some research on smart energy management system. Compared to traditional buildings, the building types mentioned in this article will be smarter and more energy efficient.
Aktas et al. [5] proposed a new intelligent energy management algorithm for the hybrid energy storage system of three-phase four wire photovoltaic grid connected power generation system. In the experimental test, he conducted dynamic test with SEMA and gave some test results under eight different operation modes. Zhou et al. [6] believed that the successful implementation of intelligent energy management depends on the ubiquitous and reliable information exchange between millions of sensors and actuators deployed on site, with little need for human intervention. Sekhar et al. [7] proposed a new smart energy management scheme for microgrid. The scheme consists of diesel generators and renewable energy generators with power electronic converter interfaces, such as photovoltaic (PV) and fuel cells, for frequency regulation without any storage. Mosannenzadeh et al. [8] aimed to systematically classify and analyze the obstacles to successful implementation of intelligent energy city projects. Through empirical methods, he surveyed 43 communities implementing smart and sustainable energy city projects under the sixth and seventh framework plans of the European Union. Their proposed solution suffers from obvious inefficiencies in low carbon building design. Their proposed low-carbon building design has been improved. In order to further optimize the architectural design, we will further introduce the smart energy management system later.
This paper takes the development of intelligent energy management system as the route, and puts forward the architecture of B/S mode from the business demand analysis of the system. It will collect, store, process and analyze the data of users’ energy consumption equipment in real time, and display it in detail on the web or app side, so that users can see their own energy consumption data at a glance. To develop smart energy and boost the development of smart cities, we need top-level design to build a flat system of energy organizations. The flattening of energy organization will eventually promote the benign and sustainable construction of low-carbon cities by encouraging scientific and technological innovation, optimizing industrial structure, advocating energy conservation and promoting multi-party cooperation. Compared with concrete shear wall structures, reinforced masonry structures reduce carbon emissions by 9.1%, 10.8%, and 3.4% during material production, material transportation, and building construction, respectively. Total carbon emissions from production and construction can be reduced by 8.6%. Smart energy management system can be used as intelligent perception system, information interaction network and data computing center of buildings. Good design is the guarantee of low-carbon architectural design, and a low-carbon architectural design evaluation system and review mechanism should be established.
2 Low Carbon Building Design Optimization
2.1 Low Carbon Building Design
The starting point of low-carbon building is the carbon emission reduction in the whole life cycle of the building. It includes energy conservation in building use. It also includes paying attention to resource consumption and environmental impact by investigating carbon emissions, and it also includes the sustainable guidance of people’s lifestyle in buildings [9].
General low-carbon buildings refer to buildings that adopt low-carbon strategies and technologies and have low carbon emissions compared with traditional buildings. Such buildings often do not specifically set the carbon emissions of buildings in the early design stage, but rely on quantitative evaluation after the construction is completed. General low-carbon building is the main form of low-carbon building at present. Zero carbon building refers to the building form that realizes zero emission of carbon dioxide to the environment during the operation and use of the building. The carbon emission during the operation and use of buildings is 70% of the total. Although zero carbon buildings are not really zero carbon in the whole life cycle. However, its quantitative setting of objectives and effective control over the realization effect have far exceeded the general low-carbon buildings [10].
Net zero carbon building, or carbon neutral building, realizes zero emission of carbon dioxide based on the whole life cycle of the building through reduction, reuse and compensation. Net carbon building aims to realize zero carbon building in the real sense. It is the building type with the strictest carbon emission control in low-carbon buildings. It should be noted that if zero emission cannot be achieved through technical means, the excess carbon emission limit can be realized through carbon trading or carbon compensation method.
The pattern of product life cycle is shown in Fig. 1. Building life cycle analysis is based on the product attributes and system attributes of buildings. It introduces the concept of life cycle to investigate the environmental load generated by buildings. Referring to the mode of product life cycle and combined with the characteristics of production and use of construction products, the construction life cycle is divided into three stages: materialization stage, use and maintenance stage, demolition and reuse stage. Materialization stage refers to the process of building from scratch, that is, the process of building body formation before delivery. Its use and maintenance stage refers to the long process from the delivery of the building to its complete abandonment and extinction. It includes the daily use, maintenance and repair of buildings. The demolition and reuse stage is the extinction stage of buildings, including building demolition, material recycling and construction waste treatment [11].
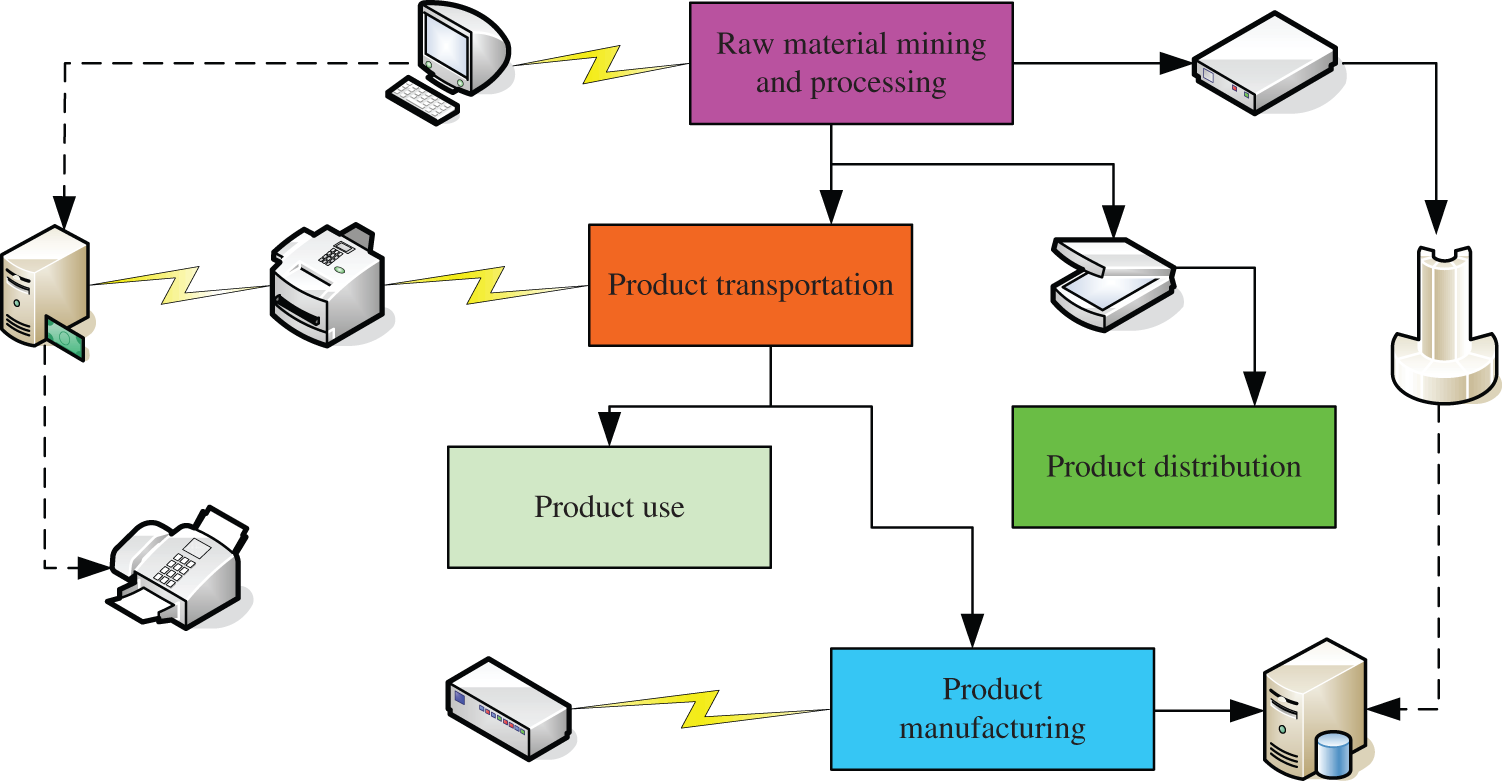
Figure 1: Model of product life cycle
The carbon emission generated by a certain amount of energy is equal to its consumption multiplied by the carbon emission coefficient. When multiple energy sources are mixed, the formula is:
Ce is the carbon emission of total energy (t or kg); Ei is the consumption of the ith energy (KWH).
At the level of architectural design, the simpler way is to count the greening area or the number of trees of the base, and then multiply it by its carbon sink coefficient. The basic calculation formula is [12]:
Cs is the total annual carbon sink of the base (T/A or kg/a); Csi is the carbon sink coefficient of the ith vegetation (T/hm2/a); Asi is the total area of the i-th vegetation (hm2).
The basic calculation formula of carbon emission is [13]:
C is the total carbon emission in the whole life cycle of the building (t or kg); ci is the carbon emission of the ith carbon emission source (t or kg).
2.3 Low Carbon Building Evaluation System
In the process of constructing the index system, the expert consultation method is an important step in each link. On the basis of constantly listening to the opinions of experts, it continues to improve the problems existing in the construction of the index system. Through the repeated modification of the irrationality, it can ensure the rationality of the index system to the greatest extent.
The work in the decision-making stage must be based on relevant planning documents and design specifications. It analyzes the scale, content and nature of the construction project according to the specification requirements. It widely listens to the opinions of experts in various fields and strives to make the feasibility scheme scientific and reasonable. In the planning and design stage, it formulates appropriate design scheme through comprehensive analysis of the geographical environment and surrounding energy resources of the project to minimize carbon emissions. Any change in the planning and design stage will have a great impact on the later stage, so reasonable planning and design is particularly important. In the construction stage, the implementation of low-carbon design is the key to realize the low-carbon of the whole life cycle of construction products. The selection of construction engineering materials is the basis to ensure the low-carbon structure of the construction engineering entity, through the low-carbon construction technology and construction organization design. It realizes low-carbon production in the whole construction process. In the operation and maintenance stage, the interests of users need to be fully considered through the maintenance of building ventilation and air conditioning system, lighting system, heating system and building environment. It can effectively improve the work efficiency of each system. While meeting the sensory needs of users to the greatest extent, it can also reduce the consumption of energy resources and realize the low-carbon operation of the system. In the process of building demolition, it is necessary to improve the utilization of recyclable resources. It obtains the old building components as completely as possible, and can make them play a role again through simple processing. For materials that cannot be reused directly, it strives to find the most environmentally friendly and energy-saving way to apply them to buildings again [14].
2.4 Smart Energy Management System
Since users access the background through the web or app, the B/S architecture mode is adopted. The back-end management system mainly includes data collection and processing, data storage and verification, analysis and optimization, visual display and other functions. It realizes the analysis of users’ energy consumption and the various needs of managers and decision-makers for energy supervision, as shown in Fig. 2.
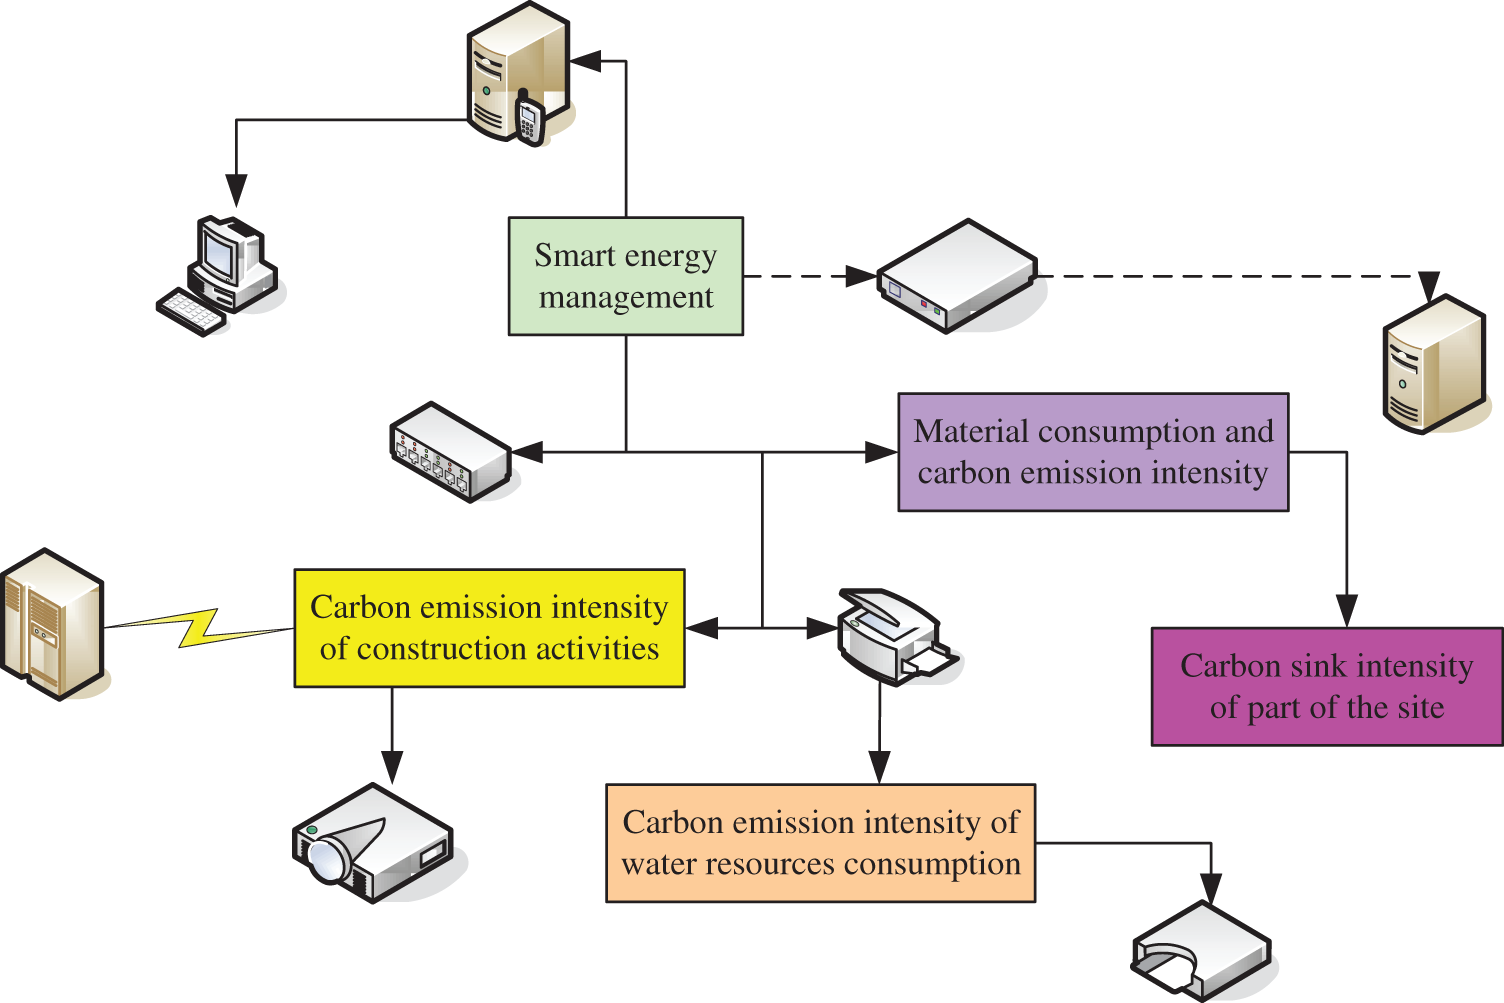
Figure 2: System architecture
2.5 Optimization Design of Building Energy Efficiency
The stability calculation formula is as follows:
ST is the stability evaluation index of single objective optimization algorithm, and N is the running times of optimization algorithm [15].
Euclidean distance generally refers to Euclidean measurement. In mathematics, Euclidean distance or Euclidean measure is the “normal” (i.e., straight line) distance between two points in Euclidean space. The effectiveness of the optimization algorithm can be measured by the proximity between the obtained optimal solution and the real optimal solution. The Euclidean distance d (x*, X′) and the relative distance g (f (x*), f (x′)) of the objective function value of the two can be calculated:
The method to quantitatively evaluate the coverage of the optimization algorithm is to first calculate the standard deviation of all solutions on each component searched by the algorithm in the optimization process, and then multiply them. The larger the product value is, the wider the distribution range of the solution is, and the better the coverage of the algorithm is. The calculation formula is as follows [16]:
CoV is the index to evaluate the coverage of the optimization algorithm. The greater the CoV, the better the coverage of the algorithm. Covariance cov (x, y) between two real random variables X and Y whose expected values are e [x] and E [y], respectively.
The robustness calculation formula is as follows:
The method to quantitatively evaluate the convergence of the optimization algorithm is to first determine the convergence stage of the optimization process, that is, from finding the optimal solution to terminating the operation, and then calculate the standard deviation of the objective function values of all solutions in the convergence stage. The calculation formula is as follows [17]:
In order to quantitatively evaluate the diversity of solutions on the Pareto front, the standardized spacing measurement method can be used to investigate the distribution of solutions on the Pareto front. The calculation formula is as follows [18].
The calculation formula of carbon emission contained in the material part in the construction stage is as follows:
Calculation of grey evaluation weight coefficient:
Calculating the weight of each index with the square root method:
2.6 Respond to Ecological Allocation of Regional Environment
(1) Configuration of greening vegetation
The vegetation setting in the planning stage is mainly to increase the greening degree of the surrounding environment. It can also consciously combine the building itself with greening. The reasonable allocation of plants ensures the fixed amount of carbon dioxide while increasing the greening rate.
(2) Allocation of ecological water body
When setting the water body, we need to consider its relationship with the building orientation. It places the outdoor swimming pool or landscape water surface upwind of the dominant wind direction of the building and close to the air inlet of the building. It will have a strong cooling effect in summer, which is conducive to produce more comfortable air flow. At the same time, the designed water body can activate the atmosphere of the whole area and form a better landscape effect [19].
2.7 Intelligent Carbon Management
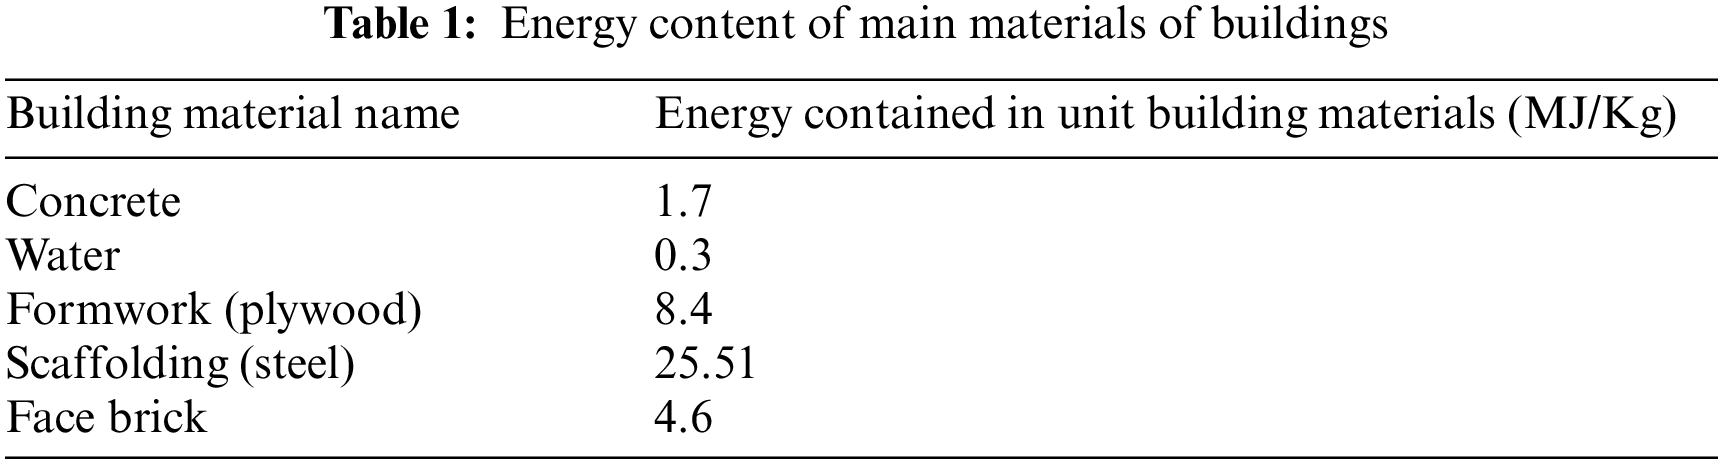
The intelligent carbon management system detects the energy load of each energy consumption system of the building. The scientific and effective management function system can also predict the future construction transformation and demolition. It should also predict and provide minimum carbon emission transformation or demolition through intelligent system. Low carbon economy is an economic model based on low energy consumption, low pollution and low emission. The digitization of building carbon management mainly includes the following data: it provides the main energy consumption data, including the data of main building materials, main water resource consumption data, greening system data, etc. Due to the relatively single chemical formation form of each material, a table of energy consumption required for the production of main building materials has been formed at this stage. It provides a calculation basis for quantifying the energy consumption of main building materials. The energy content of main materials of buildings is shown in Table 1 [20].
3 Low Carbon Building Design Optimization Results
In the later period of the eleventh five year plan, the added value of China’s construction industry accounted for about 55% of GDP, and the industrial scale continued to expand steadily. The output value of construction industry is shown in Fig. 3. The added value of construction industry in most provinces and cities accounts for 6%–8% of GDP, and more than 10% in some areas. In 2020, the total output value of construction industry completed by national construction enterprises will reach 16681.3 billion yuan.
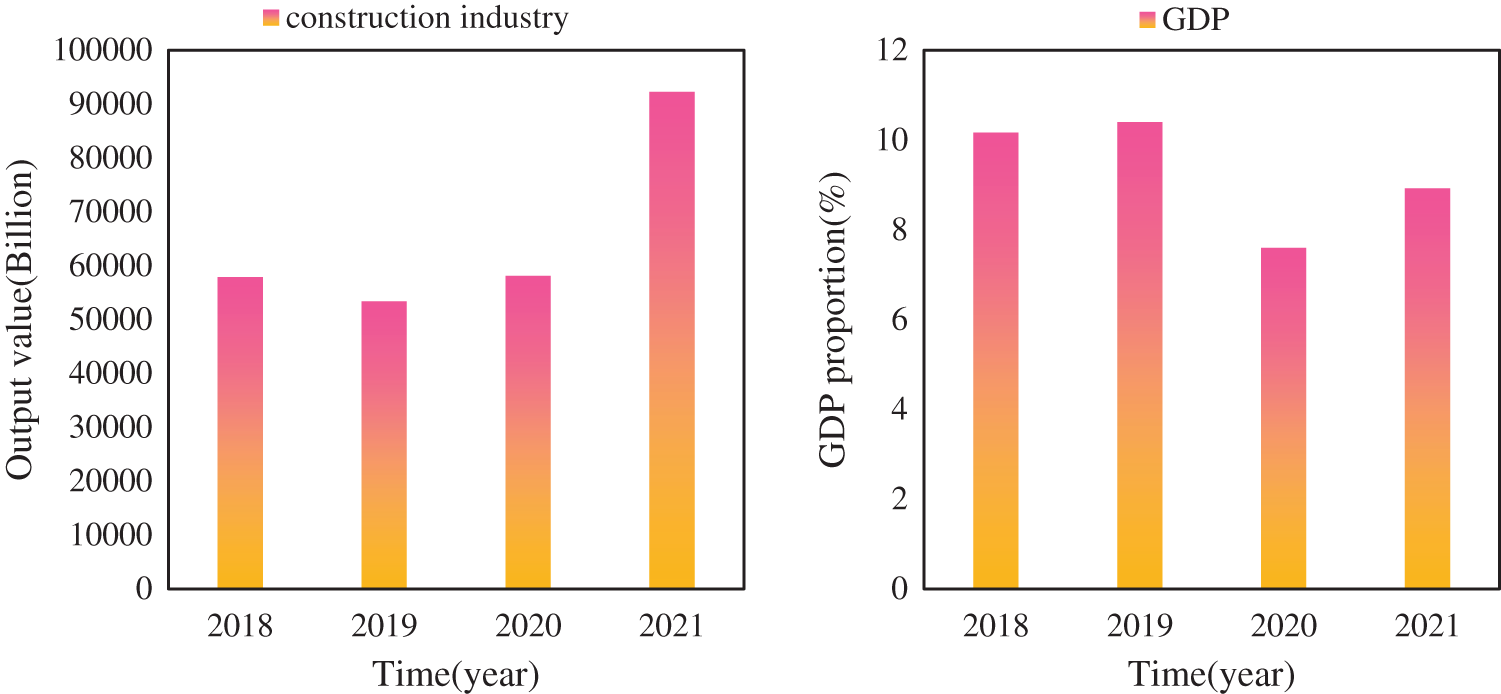
Figure 3: Output value of construction industry
From the full implementation of building energy conservation in 2018 to the full promotion of green buildings in 2021, energy conservation and emission reduction has become an important principle for the development of the construction industry. The research on construction industrialization, industrialization and integration of construction and decoration has also become the focus of industrial development. The contribution rate and completed area are shown in Fig. 4. In 2020, under the overall layout of the state to continue to strengthen and improve macro-control and promote steady and rapid economic development, China’s construction industry achieved an added value of 3587.6 billion yuan, 15 percentage points higher than the growth rate of GDP.
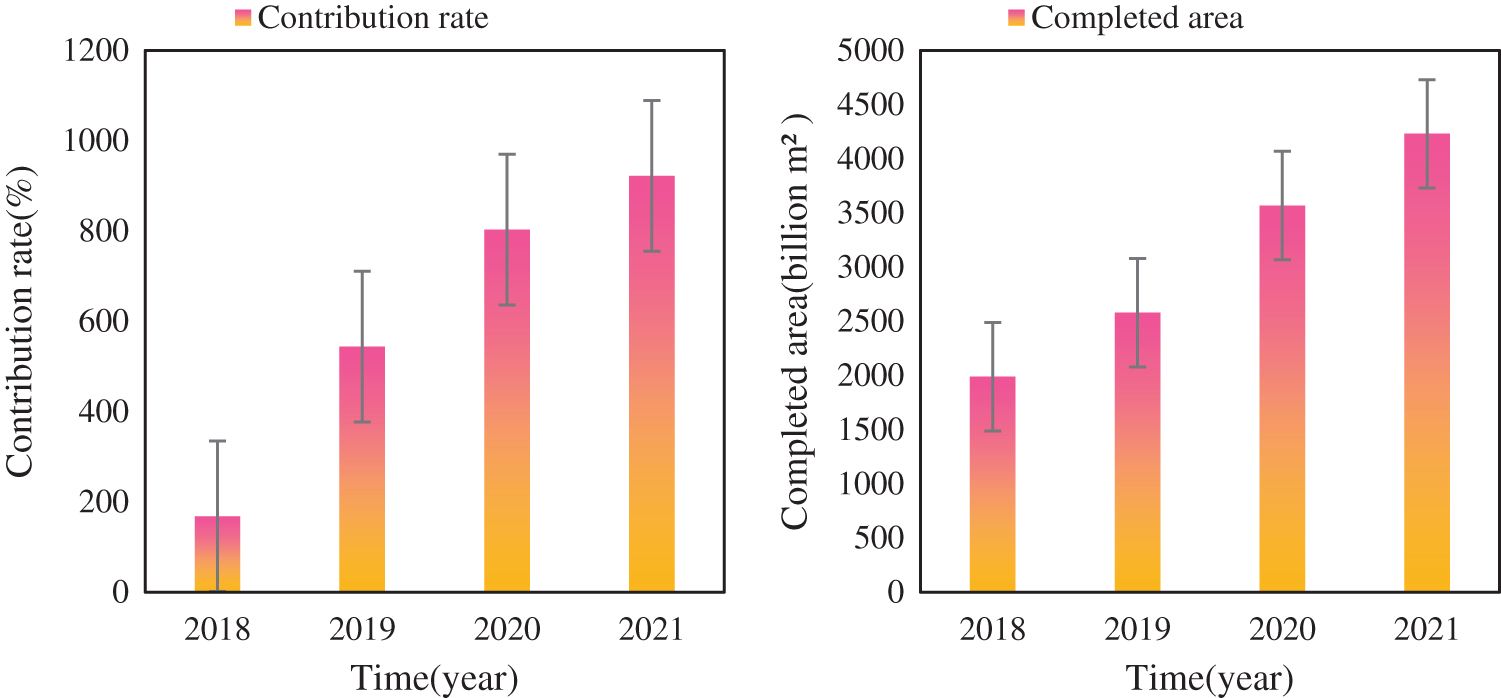
Figure 4: Contribution rate and completed area
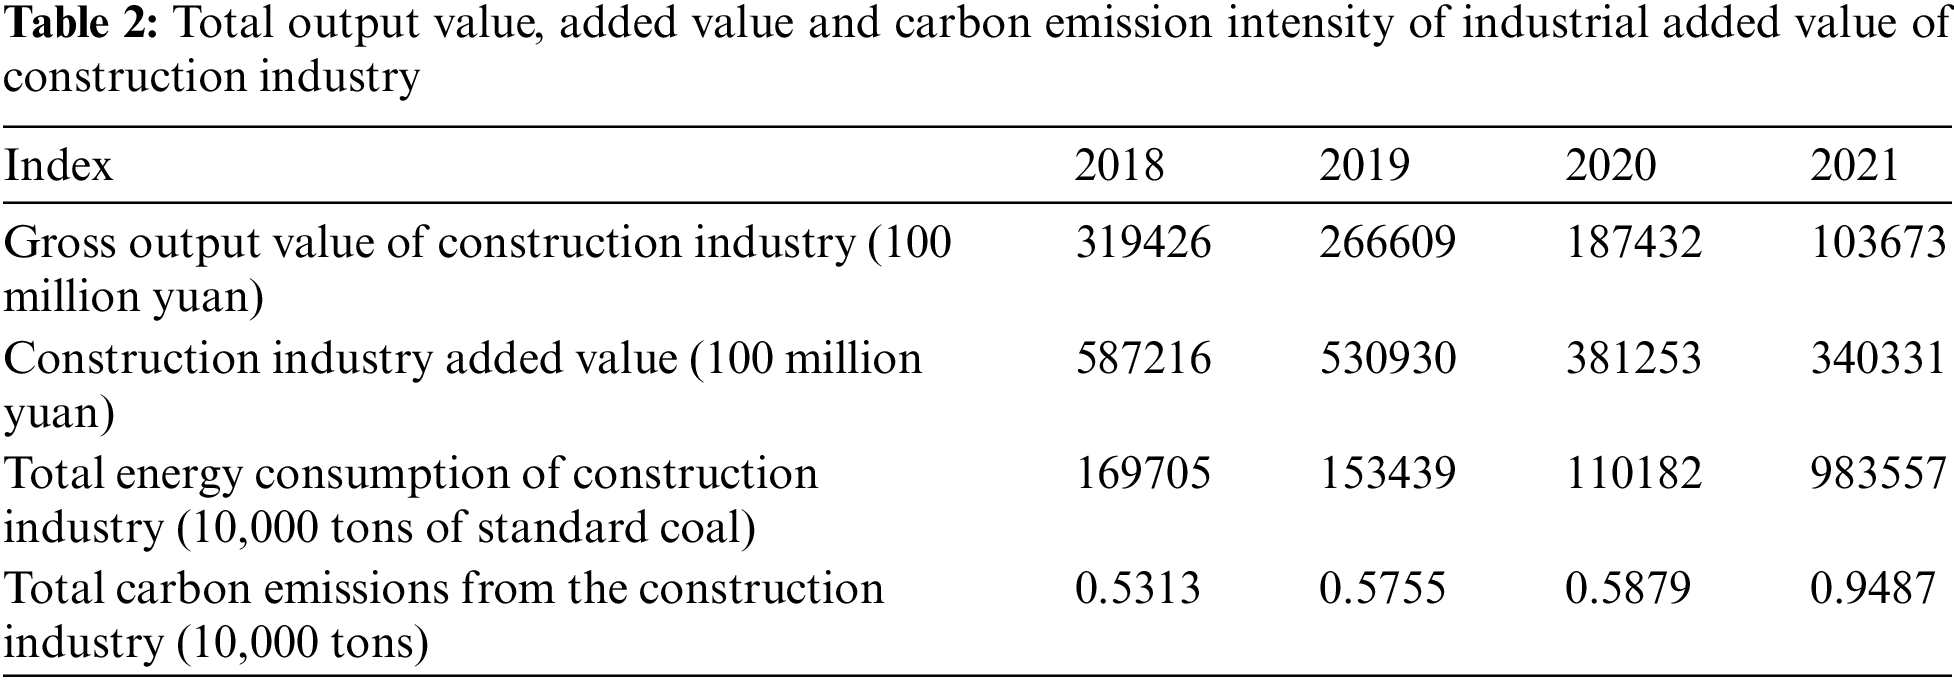
Calculate the total output value, added value and carbon emission intensity of industrial added value of the construction industry over the years from 2017 to 2021, as shown in Table 2. Compared with 2018, the price index in 2021 is about 1.25. Compared with 2018, calculated at constant prices, the added value of the construction industry in 2021 is 28338.8 billion yuan, and the carbon emission intensity is 629 thousand tons of CO2/billion yuan, a decrease of 33.7% over 2018. The price indexes of fixed asset investment in 2021 and 2018 were 274.8 and 229.1, respectively [21].
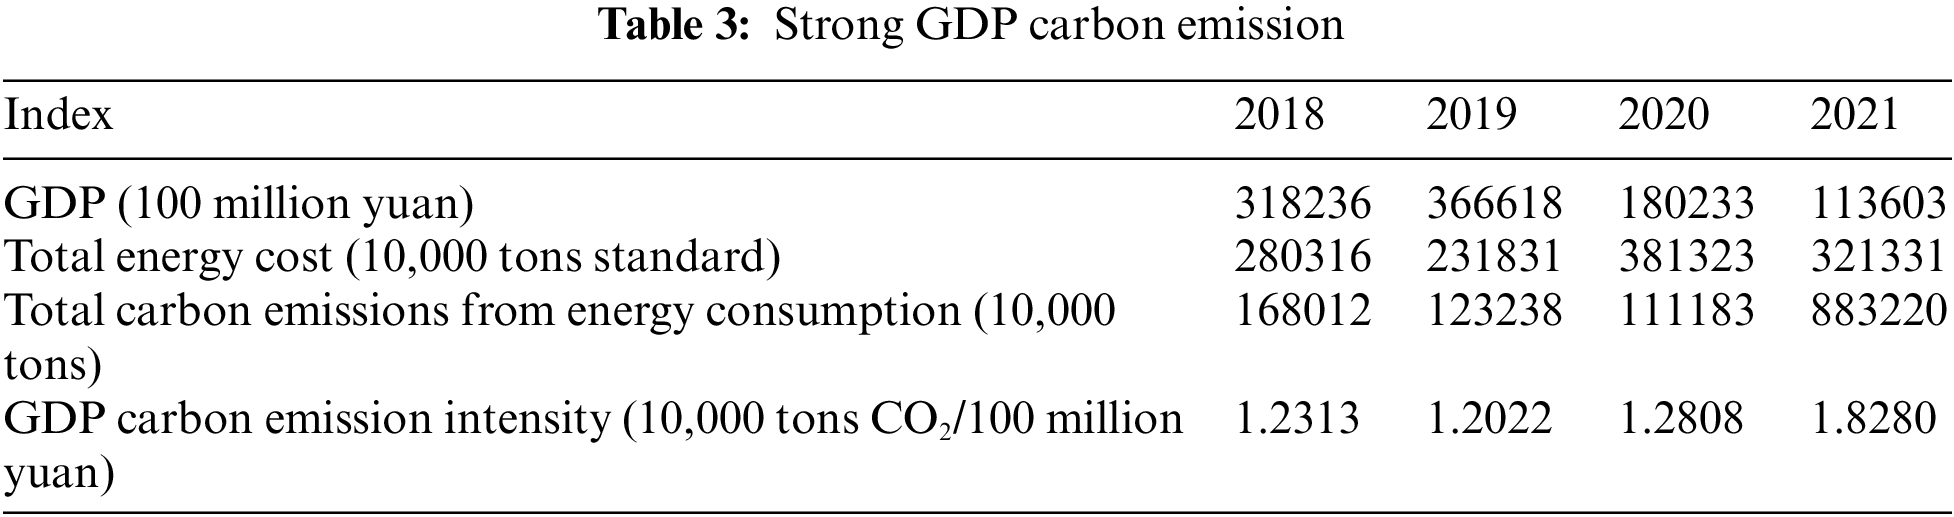
Based on GDP and energy consumption, according to the analysis and calculation results from 2018 to 2021, regardless of price changes, the carbon emission intensity of GDP in 2021 decreased by 454% compared with 2018. Considering the price index factor, the price index in 2021 is about 125 compared with 2018. Compared with 2018, the carbon emission intensity of GDP in 2021 is 2.52 tons of CO2/10000 yuan at constant prices, a decrease of 31.7% compared with 2018 [22]. The carbon emission intensity of GDP is shown in Table 3.
The comparison of GDP carbon emission intensity and building carbon emission intensity over the years is shown in Fig. 5. As can be seen from Fig. 5, the carbon emission intensity of buildings is higher than that of national GDP, and the gap is widening. The carbon emission intensity of buildings is less than 20% higher in 2018 and about 35% higher in 2020. From the development trend, the carbon reduction task of China’s construction industry is more arduous, and the construction industry should develop synchronously with the country’s low-carbon economy.
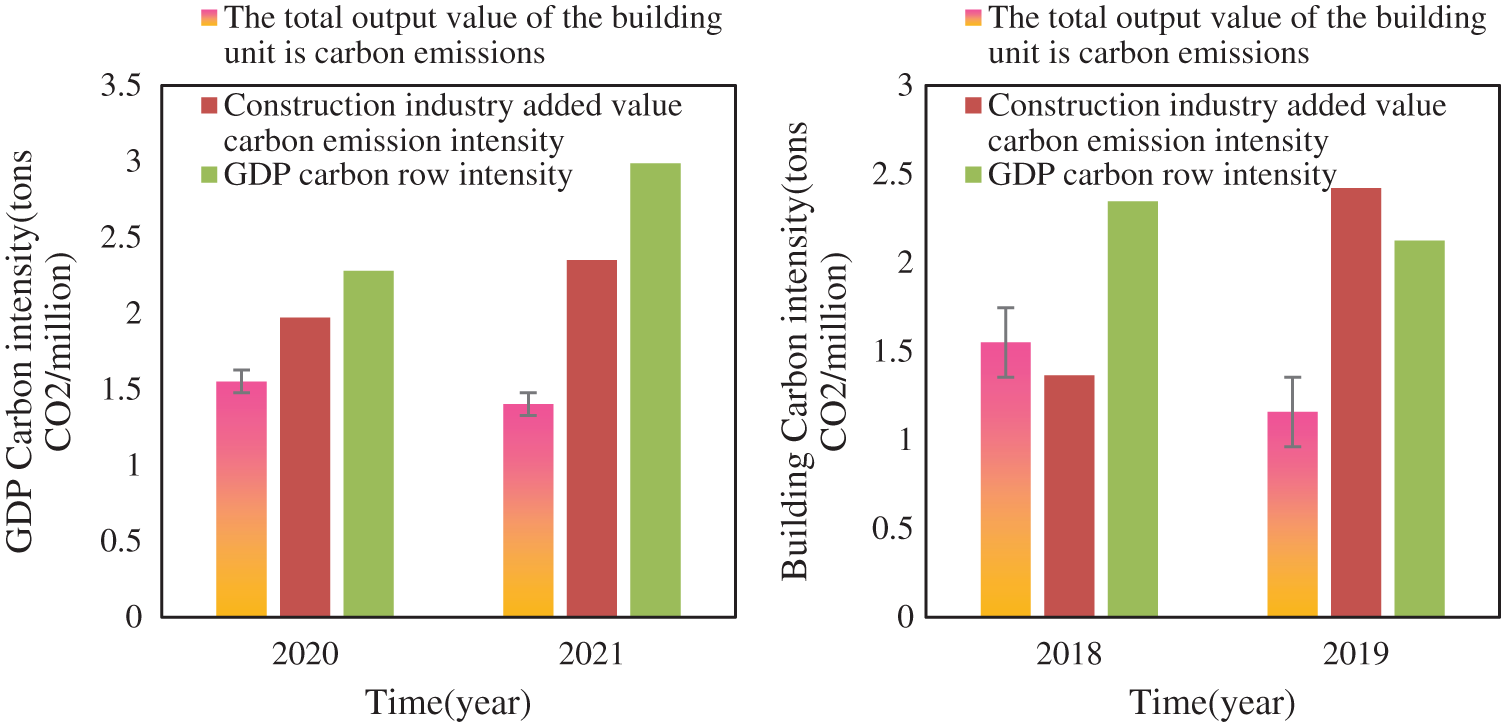
Figure 5: Comparison of carbon emission intensity of GDP and buildings over the years
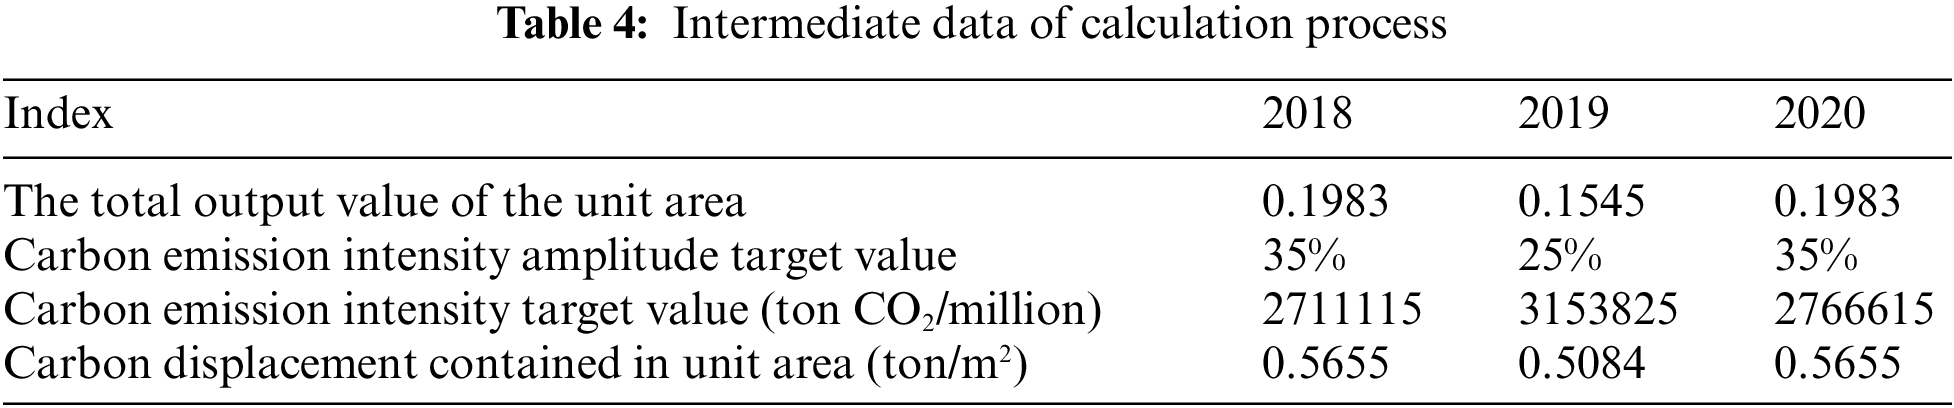
According to the output value contained in the unit area of houses and buildings and its corresponding carbon emission intensity value, the target value of carbon emission per unit area of buildings is calculated. According to this calculation rule, the carbon emissions per unit building area in 2018 and 2020 are 0.6712 T/m2 and 0.6931 T/m2, respectively [23]. The intermediate data of the calculation process are shown in Table 4.
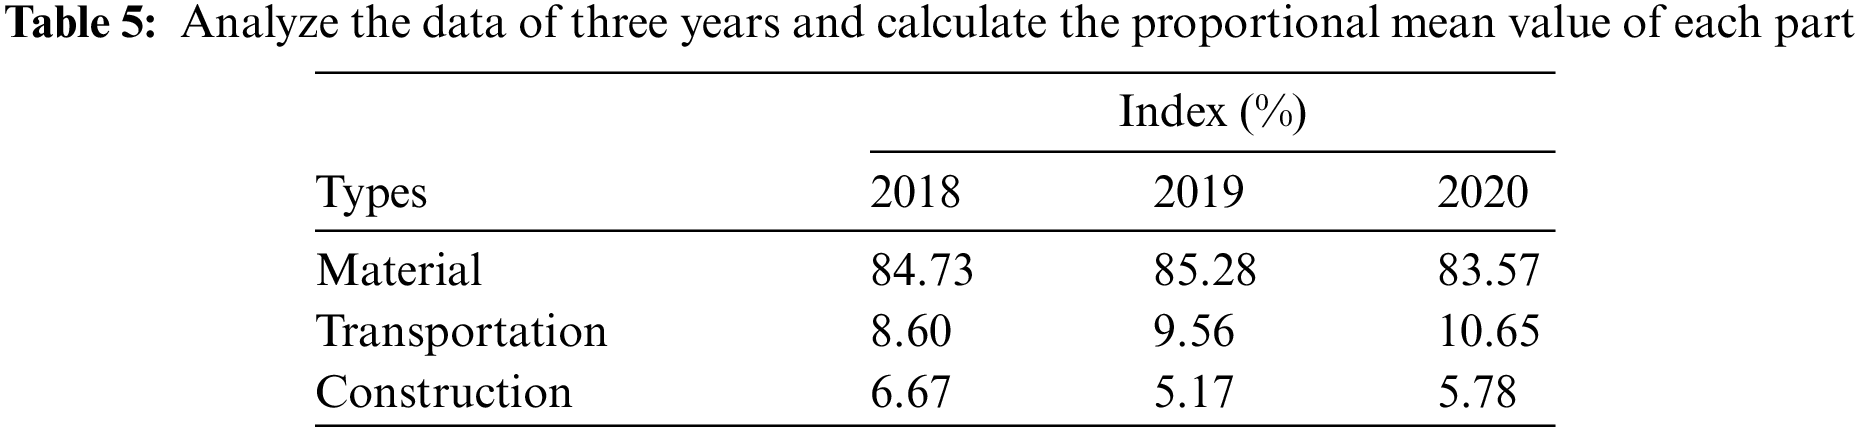
From the intermediate input part of the construction industry, the carbon emission of the total output value of buildings includes three parts: carbon emission of materials, carbon emission of construction activities and carbon emission of material transportation [24]. This paper analyzes the data of three years and calculates the proportional mean value of each part, as shown in Table 5.
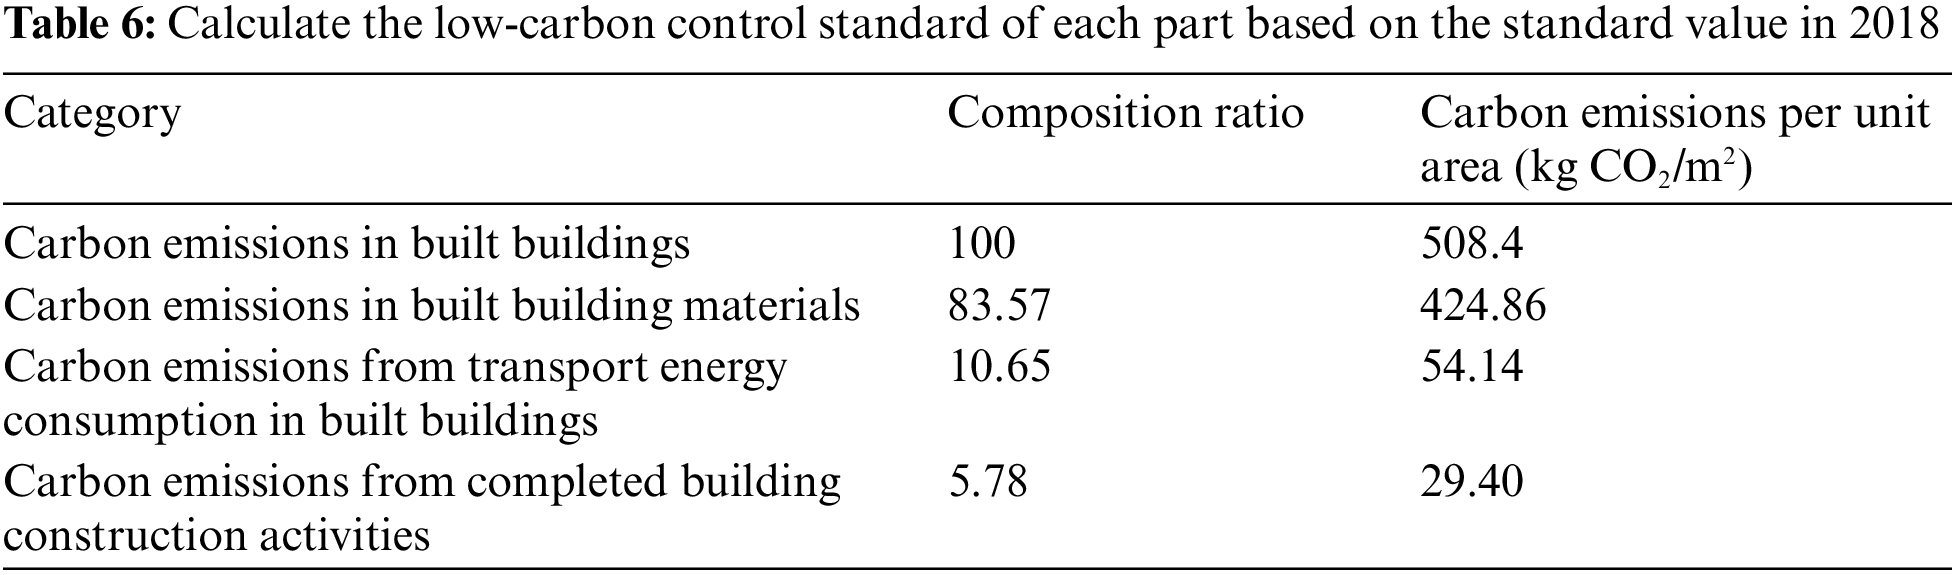
Determining the control index of carbon emission per unit area of buildings: In 2018, the carbon emission generated by the completion of buildings (carbon emission in the construction stage) should not exceed 0.5084 T/m2. By 2020, due to the improvement of the scientific and technological content of the construction industry and the requirements of green buildings, the carbon emission in the construction stage will be further increased. Based on the forecast data in 2020, 0.5655 T/m2 can be considered as the benchmark value after 2020 [25]. In this paper, the low-carbon control standards of each part are calculated based on the standard values in 2018, as shown in Table 6.
Through the questionnaire survey of the design project, this paper summarizes the number of on-site activities in each stage of the project and the distance from the design unit to the site. The respondents were divided into three categories: large, medium and small. The composition of personnel in the architectural design stage is shown in Fig. 6.
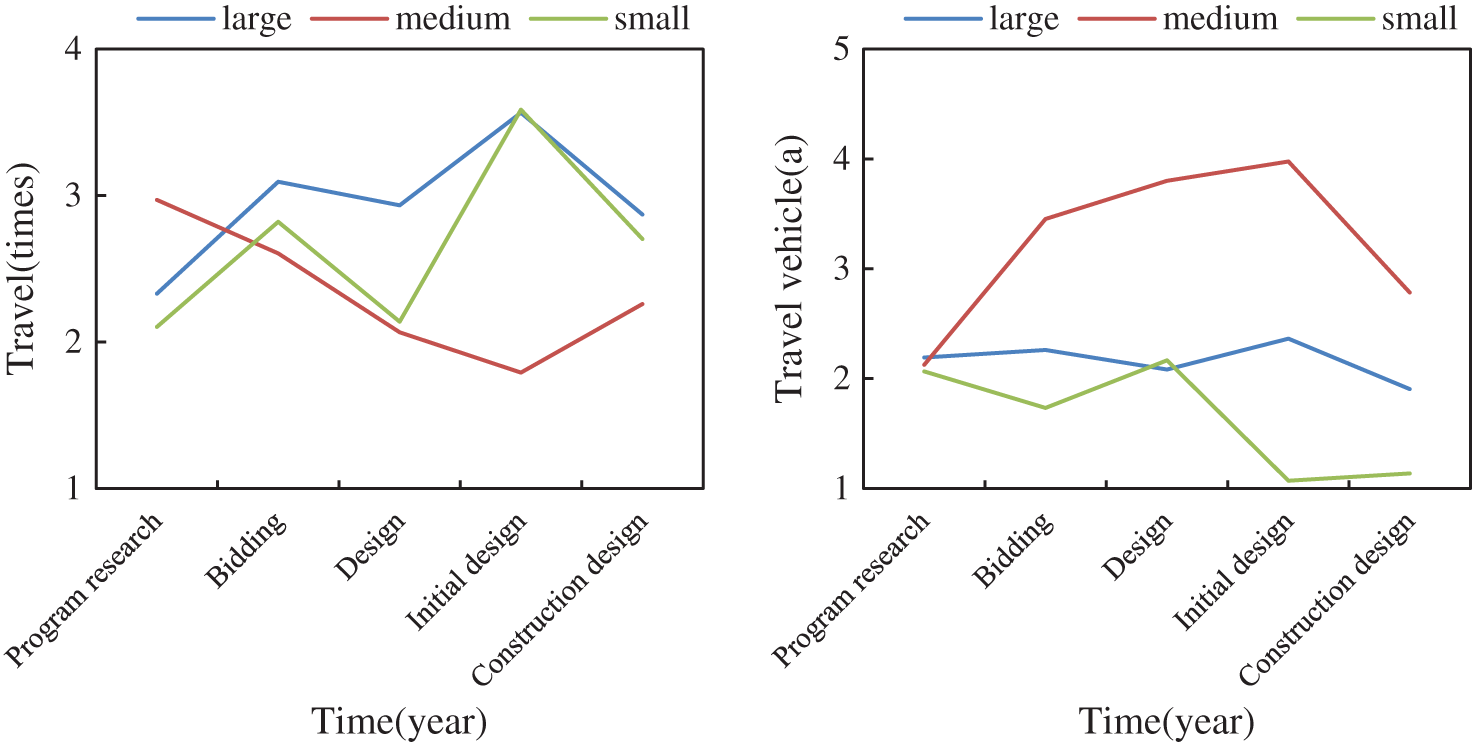
Figure 6: Personnel composition in architectural design stage
Although the total energy consumption of the building life cycle includes the physical and chemical energy of various materials used in the construction stage, the energy consumption of energy-saving buildings in the operation stage is also reduced. However, the total energy consumption in the operation stage still accounts for the main part. Due to the increase in the use of heating and air conditioning equipment caused by the general improvement of indoor environmental comfort requirements, the daily energy consumption in the operation process of buildings has become the main part of the energy consumption in the operation stage.
The energy consumption during operation can be calculated by computer software simulation as the basis for carbon emission calculation. The budget of water consumption is determined according to the design of water consumption, which is mainly related to the use nature of buildings. The daily water consumption of several main types of buildings is shown in Fig. 7.
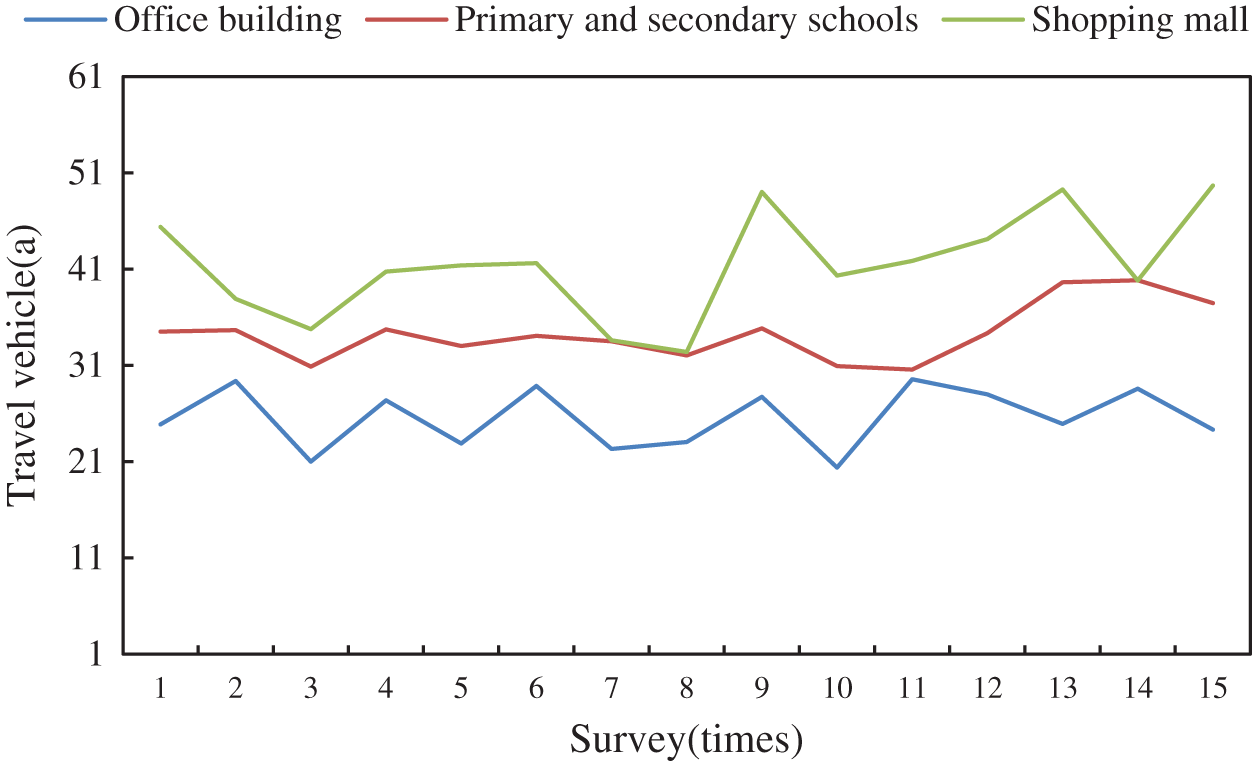
Figure 7: Daily water consumption of several main types of buildings
According to the energy consumption difference between unified construction and industrialized construction, the energy-saving effect of industrialized construction mode on construction water, scaffold and formwork can be calculated. The comparison of energy-saving effects is shown in Fig. 8. Compared with the traditional construction method, the industrialized construction method can save 589.22 megajoules (MJ) per square meter, and the construction area of the case is about 8000 m2, which is calculated according to 29270 megajoules (MJ) per ton of standard coal. The single residential building can save 161.04 tons of standard coal.
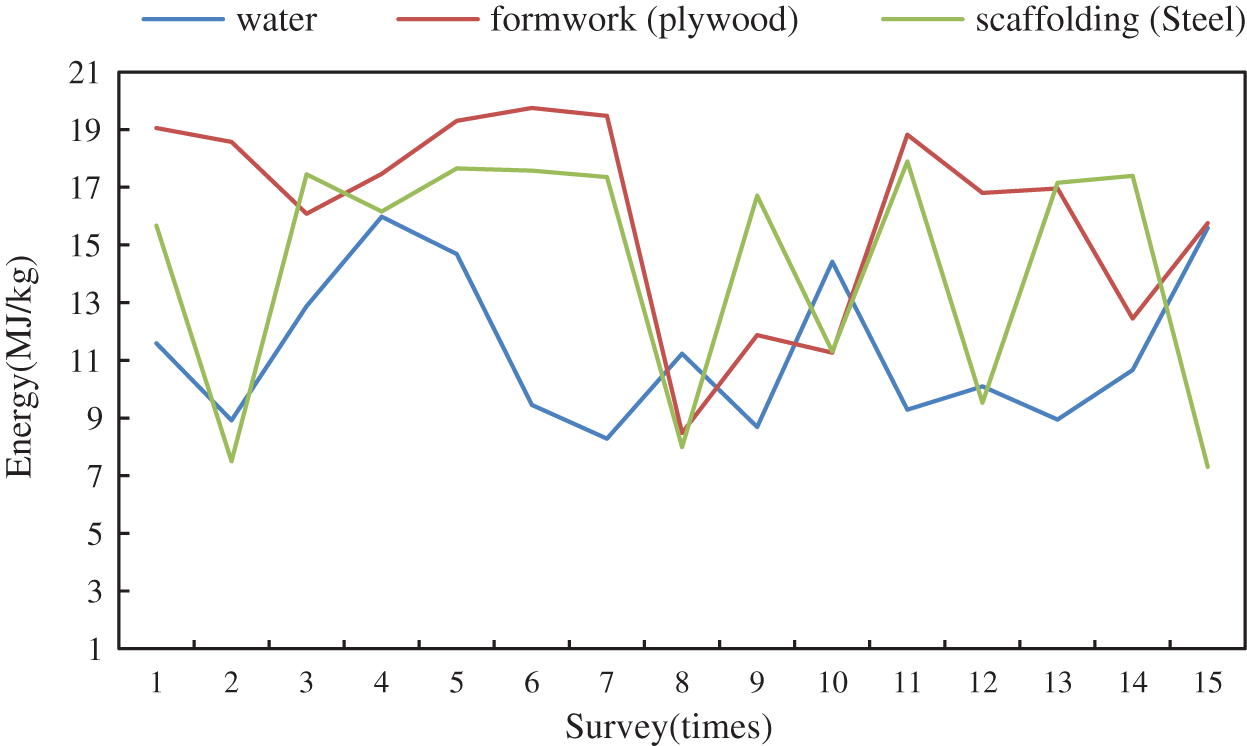
Figure 8: Comparison of energy saving effects
The total carbon emissions during the production and construction of concrete shear wall structure and reinforced block masonry structure are 8506.2 and 7771.2 kg CO2, respectively, and the carbon emissions per unit building area are 484.4 and 442.6 kg CO2/m2 respectively. Compared with the concrete shear wall structure, the carbon emission of reinforced block masonry structure in the process of material production, material transportation and building construction can be reduced by 38.1 kg CO2/m2 (9.1%), 2.2 kg CO2/m2 (10.8%) and 1.6 kg CO2/m2 (3.4%), respectively. Total carbon emissions from production and construction can be reduced by 735 tCO2 (8.6%). In order to verify the reliability of the above results, this paper uses the random analysis method to further study the emission reduction. Through the statistical analysis of 10000 Monte Carlo simulation results, it is concluded that the average value of emission reduction samples in the production and construction process is 729 tCO2 (excluding the supplementary calculation part of the quota system). It is basically consistent with the result of deterministic analysis according to the quota method. According to the random analysis, the 90% confidence interval of emission reduction is [3851060] tCO2, and the corresponding emission reduction proportion is 4.5%~12.4%. It shows that reinforced block masonry structure has the advantage of reducing carbon emission in production and construction. In addition, when the additional carbon emission of human input calculated by input-output analysis method is included, the reinforced block masonry structure scheme can reduce 1298 tCO2 due to the relatively low labor volume and labor cost. The statistics of carbon emission reduction during construction are shown in Fig. 9.
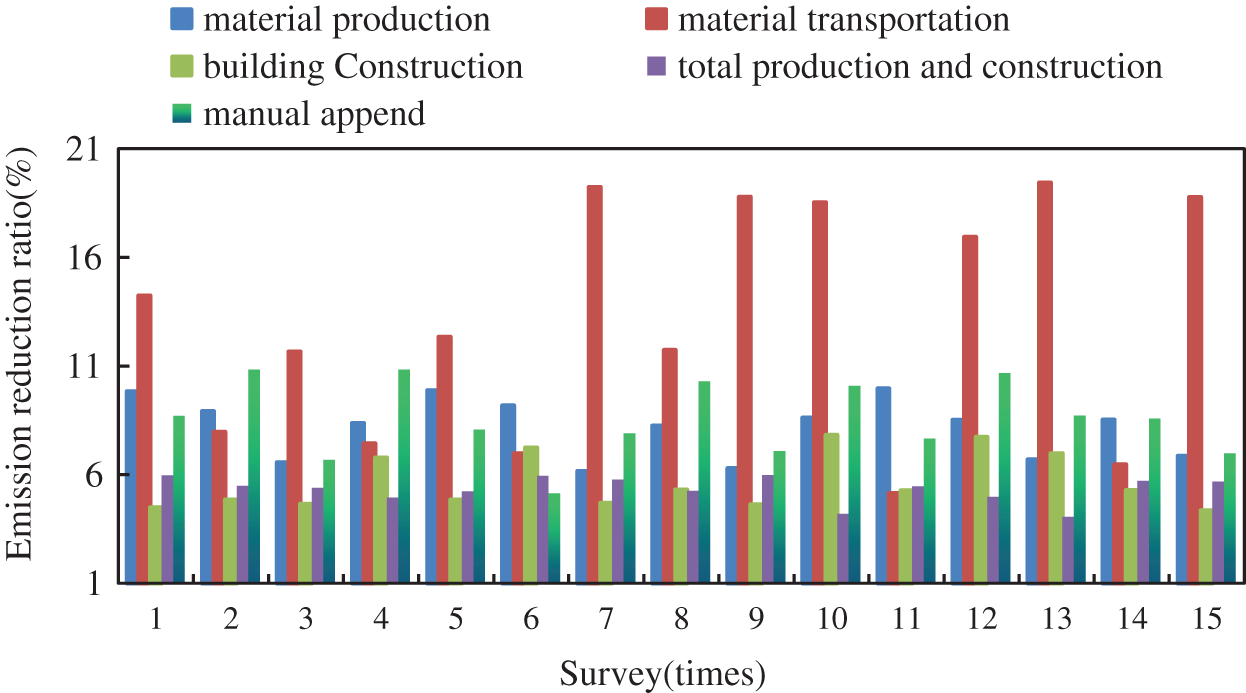
Figure 9: Carbon emission reduction during construction
With the growth of world population, the improvement of per capita living area and office conditions, new buildings will increase significantly. It can reduce building carbon emissions, which can make a great contribution to the reduction of carbon emissions of the whole earth. On the one hand, the huge total construction area leads to the necessity of emission reduction. On the other hand, the space for building energy conservation and emission reduction is more than that for reducing the carbon emission of buildings, which is more feasible.
In the seven years of intelligent building with safety, efficiency, convenience, energy conservation, environmental protection and health as the core development concept, green energy conservation is very important. Among them, green refers to the utilization of new energy such as solar energy and geothermal energy, such as solar heat collection and water supply system, ground source heat pump air conditioning system, etc. Energy saving is mainly aimed at building equipment management system, which uses operation management based on energy-saving strategy in key energy consuming systems such as lighting, air conditioning, elevator, water supply and drainage. Of course, the material selection and construction technology of the envelope also belong to the concept of green energy conservation. According to the three-stage division of intelligent building and the understanding and analysis of actual successful cases, the energy conservation of intelligent building at this stage is essentially in the period of transition from the second stage to the third stage. In the process of fully implementing the third stage intelligent building in the future, green energy conservation will put forward higher technical requirements and bring us richer services.
In order to make the environmental adaptability of the building become the driving direction of parameterization, various factors in the environment of the building can be introduced into the design logic. Usually, environmental factors can be described by specific physical quantities. This makes it possible to transform the objective environmental factors into parametric parameters described by mathematical symbols, and use these parameters to participate in the parametric design process. At the same time, the idea of parametric design also urges architects to use advanced digital chemical tools to maximize the adaptive parametric expression of the environmental site. Because of the uncertainty and multi solution of parametric design, it is different from the traditional design in the past, which requires the whole process of parametric design to be dynamic. With the continuous change of parameter input values, it is required to produce a corresponding changing multidirectional scheme in order to find the most suitable solution. Different factors are expressed in different forms as physical quantities. The conversion of sunlight into parameters in architectural design can reflect the size of window openings, shading and building spacing. The wind environment as a parameter in the design can know the layout and window opening form of the building. As a parameter, building thermal performance can guide building thermal insulation, heat insulation and energy consumption in design. In addition, a series of environmental factors such as the contour line around the building and the original crowd streamline of the base can be parameterized to turn them into accurate mathematical information and participate in and guide the parametric design.
The intelligent carbon management system detects the energy load of each energy consumption system of the building. The scientific and effective management function system can also predict the future construction transformation and demolition. It should also predict and provide minimum carbon emission transformation or demolition through intelligent system. Building carbon measurement requires a lot of basic data. However, after a large number of venue research, it is found that CSCEC has basically not recorded its energy consumption and carbon emissions, so it is difficult to obtain basic data. Through the intelligent system to detect and automatically record the data, this paper intelligently collects the carbon emission information and constructs its own resource database. It is of great practical significance for building targeted energy conservation and emission reduction. These basic data will lay the foundation for the smooth progress of building carbon measurement in the future, which can make the data of building energy conservation and emission reduction clear and actively participate in social carbon trading.
As users of low-carbon buildings, they gradually recognize and establish the concept of low-carbon life. For example, walking can be used as much as possible when watching competitions or participating in activities, and bicycles or public transportation can be used for distant spectators. Generally, there are only a few floors in the building, and each floor can be easily reached by stairs, so as to minimize the operation frequency of elevators, garbage classification, etc. From the perspective of operators, low-carbon management is also very important. If natural ventilation is used as much as possible to reduce the use of air conditioning system, do not adjust the air conditioning temperature too low when it needs to use air conditioning. In case of sufficient sunshine, it does not use artificial lighting, turn off the lights, etc. At the same time, posters on the technical means of building energy conservation and emission reduction can be posted in the building to make the people know more about low-carbon technology. It also makes people realize that the protection of the environment is not overnight, which needs everyone’s participation and lasting. The low-carbon change of human behavior can make buildings play a certain role in emission reduction. As a large-scale public building, the building needs all users to participate in the process of building its low-carbon.
Structural system is the skeleton of long-span buildings. Its efficiency and material consumption directly affect the carbon emission of the building process. There are two main development directions of modern long-span spatial structures: one is lightweight, that is, starting from building structural materials, developing lightweight and high-strength structural materials to reduce the self weight of the structure. On the other hand, starting from the structural form, study a more reasonable and efficient structural form to enhance the effectiveness of the structure. It can achieve a larger span without consuming a lot of materials. At present, most of the commonly used light-weight structures are composed of light and high-strength membrane materials and other materials, such as steel cable, steel frame and so on. The development of light structure makes the building get rid of the heavy volume form in the past and form a light and natural beauty.
In recent years, the continuous emergence of new materials has promoted the development of architectural form. Materials and structures play a complementary role in shaping the form of sports architecture. They play an important role in expressing the character of architecture. From concrete and glass to metal and membrane materials commonly used today, the application of building materials gradually tends to be low-carbon. In addition to emphasizing functionality and comfort, it also requires a minimum impact on the environment throughout the life cycle of the material. Compared with traditional materials, green materials use low pollution production technology to minimize the impact on the environment in the configuration process. It can purify the environment and be beneficial to human health in use, and it should also have good recycling capacity. The solidified carbon emission of buildings mainly comes from the carbon emission related to materials. The carbon emissions of different materials are quite different, so it is necessary to comprehensively consider the local materials, economic level and other conditions and select appropriate green materials.
Renewable materials can be recycled in the recycling stage of building demolition. Through certain processing carbon emissions to regain the opportunity to be used, this part of the carbon emissions are often much lower than the carbon emissions needed to produce materials. This difference becomes the carbon emissions offset by renewable materials. Thus, the solidified carbon emission of the building itself will also be effectively reduced. The backfill materials usually used are sand and stone, but sand and stone are not green materials. A large amount of sand and stone landfill will cause great waste. With the development of technology, the steel slag remaining in steelmaking for many years can fully meet various functional requirements as backfill materials after treatment, which just solves the needs of building backfill.
In view of the lack of research on quantitative analysis and calculation methods of building carbon emissions, and the important impact of production and construction process on building life cycle carbon emissions, this study is based on the basic needs of China’s current economic development and urbanization. From the professional perspective of structure, this paper comprehensively uses the relevant knowledge of Architectural Science, environmental science, economics and management. This paper uses the combination of theoretical research, data statistics and case analysis to construct the structure of building carbon emission. The difference of environmental and climatic conditions leads to the difference of architectural design carbon emission. It only uses the value of carbon emission to evaluate the low-carbon of architectural design, which is not convenient for the comparative study of buildings in different regions. This paper needs to further study the adaptability and variability of evaluation standards in combination with regional differences. Combined with the existing building cost control and management methods, this paper clarifies the controlling role of architectural design in the low-carbon development of the building’s full life cycle, and affirms the value and urgency of low-carbon evaluation and optimization of architectural design.
Availability of Data and Materials: The data that support the findings of this study are available from the corresponding author upon reasonable request.
Funding Statement: This work was supported by “Key Technology Research on Operational Performance Improvement of the Green Building” (2020YFS0060)-Key Project of Science and Technology Department of Sichuan Province. This work was supported by “Creative VR Teaching and Learning Research Based on ‘PBL+’ and Multidimensional Collaboration” (JG2021-721) and “Reform in the Mode and Practice of Architecture Education with the Characteristics of Geology” (JG2021-672)-Education Quality and Teaching Reform Project of Higher Education in Sichuan Province in 2021–2023.
Conflicts of Interest: The authors declare that they have no conflicts of interest to report regarding the present study.
References
1. Charoenkit, S., Kumar, S. (2017). Building low-carbon and disaster-resilient communities: Integrating climate mitigation and adaptation into the assessment of self-help housing design. Mitigation & Adaptation Strategies for Global Change, 22(5), 695–728. DOI 10.1007/s11027-015-9694-4. [Google Scholar] [CrossRef]
2. Xie, Z., Gao, X., Feng, C. (2017). Study on the evaluation system of urban low carbon communities in Guangdong province. Ecological Indicators, 74, 500–515. DOI 10.1016/j.ecolind.2016.11.010. [Google Scholar] [CrossRef]
3. Luo, T., Tan, Y., Langston, C., Xue, X. (2019). Mapping the knowledge roadmap of low carbon building: A scientometric analysis. Energy and Buildings, 194, 163–176. DOI 10.1016/j.enbuild.2019.03.050. [Google Scholar] [CrossRef]
4. Oti, J. E., Kinuthia, J. M. (2020). The development of stabilised clay-hemp building material for sustainability and low carbon use. Journal of Civil Engineering and Construction, 9(4), 205–214. DOI 10.32732/jcec.2020.9.4.205. [Google Scholar] [CrossRef]
5. Aktas, A., Erhan, K., Ozdemir, S. (2017). Experimental investigation of a new smart energy management algorithm for a hybrid energy storage system in smart grid applications. Electric Power Systems Research, 144(8), 185–196. DOI 10.1016/j.epsr.2016.11.022. [Google Scholar] [CrossRef]
6. Zhou, Z., Gong, J., He, Y. (2017). Software defined machine-to-machine communication for smart energy management. IEEE Communications Magazine, 55(10), 52–60. DOI 10.1109/MCOM.2017.1700169. [Google Scholar] [CrossRef]
7. Sekhar, P. C., Mishra, S. (2017). Storage free smart energy management for frequency control in a Diesel-PV-Fuel cell-based hybrid AC microgrid. IEEE Transactions on Neural Networks & Learning Systems, 27(8), 1657–1671. DOI 10.1109/TNNLS.2015.2428611. [Google Scholar] [CrossRef]
8. Mosannenzadeh, F., Nucci, M., Vettorato, D. (2017). Identifying and prioritizing barriers to implementation of smart energy city projects in Europe: An empirical approach. Energy Policy, 105(10), 191–201. DOI 10.1016/j.enpol.2017.02.007. [Google Scholar] [CrossRef]
9. Sathanandam, T., Awoyera, P. O., Vijayan, V. (2017). Low carbon building: Experimental insight on the use of fly ash and glass fibre for making geopolymer concrete. Sustainable Environment Research, 27(3), 146–153. DOI 10.1016/j.serj.2017.03.005. [Google Scholar] [CrossRef]
10. Novikova, A., Csoknyai, T., Szalay, Z. (2018). Low carbon scenarios for higher thermal comfort in the residential building sector of South Eastern Europe. Energy Efficiency, 11(4), 1–31. DOI 10.1007/s12053-017-9604-6. [Google Scholar] [CrossRef]
11. Saleki, S., Bahramani, S. K. (2019). Designing a low-carbon building via LCB method 3.0, Case study: An educational building in Tehran. Journal of Construction in Developing Countries, 23(2), 129–150. DOI 10.21315/jcdc2018.23.2.8. [Google Scholar] [CrossRef]
12. Ness, D. A., Xing, K. (2020). Consumption-based and embodied carbon in the built environment: Implications for APEC’s low-carbon model town project. Journal of Green Building, 15(3), 67–82. DOI 10.3992/jgb.15.3.67. [Google Scholar] [CrossRef]
13. Ilham, N., Hasanuzzaman, M. (2018). Energy consumption and low carbon initiatives in an academic building: A case study in Malaysia. International Journal of Engineering and Technology, 7(4), 170–175. [Google Scholar]
14. Kikuchi, Y. (2017). Simulation-based approaches for design of smart energy system: A review applying bibliometric analysis. Journal of Chemical Engineering of Japan, 50(6), 385–396. DOI 10.1252/jcej.16we374. [Google Scholar] [CrossRef]
15. Mosannenzadeh, F., Bisello, A., Vaccaro, R., D'Alonzo, V., Hunter, G. W. et al. (2017). Smart energy city development: A story told by urban planners. Cities, 64(1), 54–65. DOI 10.1016/j.cities.2017.02.001. [Google Scholar] [CrossRef]
16. Lund, H., Duic, N., Ostergaard, P. A., Mathiesen, B. V. (2018). Future district heating systems and technologies: On the role of smart energy systems and 4th generation district heating. Energy, 165, 614–619. DOI 10.1016/j.energy.2018.09.115. [Google Scholar] [CrossRef]
17. Oseni, M. O., Pollitt, M. G. (2017). The prospects for smart energy prices: observations from 50 years of residential pricing for fixed line telecoms and electricity. Renewable & Sustainable Energy Reviews, 70(86–92), 150–160. DOI 10.1016/j.rser.2016.11.214. [Google Scholar] [CrossRef]
18. Labib, L., Billah, M., Sultan Mahmud Rana, G. M., Sadat, M. N., Kibria, M. G. et al. (2017). Design and implementation of low-cost universal smart energy meter with demand side load management. IET Generation, Transmission and Distribution, 11(16), 3938–3945. DOI 10.1049/iet-gtd.2016.1852. [Google Scholar] [CrossRef]
19. Mylrea, M. (2017). Smart energy-internet-of-things opportunities require smart treatment of legal, privacy and cybersecurity challenges. Journal of World Energy Law & Business, 10(2), 147–158. DOI 10.1093/jwelb/jwx001. [Google Scholar] [CrossRef]
20. Yeboah, S. J. (2021). Design and development of RFID based multi-user smart energy distribution system at Sunyani Technical University, Ghana. Turkish Journal of Computer and Mathematics Education (TURCOMAT), 12(3), 4596–4603. DOI 10.17762/turcomat.v12i3.1852. [Google Scholar] [CrossRef]
21. Heinzelman, W. B., Chandrakasan, A. P., Alakrishnan, H. (2017). An application-specific protocol architecture for. IEEE Trans Wireless Communications, 1(4), 660–670. DOI 10.1109/TWC.2002.804190. [Google Scholar] [CrossRef]
22. Peng, Z., Dan, W., Wang, J. (2017). Neural network-based adaptive dynamic surface control for a class of uncertain nonlinear systems in strict-feedback form. IEEE Transactions on Neural Networks, 28(9), 2156–2167. DOI 10.1109/TNNLS.2016.2577342. [Google Scholar] [CrossRef]
23. Gharachorloo, K., Gupta, A., Hennessy, J. (2017). Performance evaluation of memory consistency models for shared-memory multiprocessors. ACM Sigops Operating Systems Review, 25, 245–257. DOI 10.1145/106974.106997. [Google Scholar] [CrossRef]
24. Chiang, M., Zhang, T. (2016). Fog and IoT: An overview of research opportunities. IEEE Internet of Things Journal, 3(6), 854–864. DOI 10.1109/JIOT.2016.2584538. [Google Scholar] [CrossRef]
25. Wang, T., Gao, H., Qiu, J. (2017). A combined adaptive neural network and nonlinear model predictive control for multirate networked industrial process control. IEEE Transactions on Neural Networks & Learning Systems, 27(2), 416–425. DOI 10.1109/TNNLS.2015.2411671. [Google Scholar] [CrossRef]
Cite This Article
 Copyright © 2023 The Author(s). Published by Tech Science Press.
This work is licensed under a Creative Commons Attribution 4.0 International License , which permits unrestricted use, distribution, and reproduction in any medium, provided the original work is properly cited.
 Downloads
 Citation Tools