
 Submit a Paper
 Propose a Special lssue
 Open Access
ARTICLE
Energy Consumption Analysis and Characterization of Aerospace Manufacturing Facilities in the United States–A Step towards Sustainable Development
1 Department of Decision Science, School of Business Administration, Clark Atlanta University, Atlanta, GA, 30314, USA
2 Department of Engineering & Technology, Southeast Missouri State University, Cape Girardeau, MO, 630701, USA
3 Department of Industrial and Systems Engineering, Kennesaw State University, Atlanta, GA, 30114, USA
* Corresponding Author: Khaled Bawaneh. Email:
Energy Engineering 2023, 120(1), 23-34. https://doi.org/10.32604/ee.2023.019813
Received 16 October 2021; Accepted 17 August 2022; Issue published 27 October 2022
 View Full Text
 Download PDF
Abstract
In this study, information on energy usage in the United States (U.S.) aerospace manufacturing sector has been analyzed and then represented as energy intensities (kWh/m2) to establish benchmark data and to compare facilities of varying sizes. First, public sources were identified and the data from these previously published sources were aggregated to determine the energy usage of aerospace manufacturing facilities within the U.S. From this dataset, a sample of 28 buildings were selected and the energy intensity for each building was estimated from the data. Next, as a part of this study the energy data for three additional aerospace manufacturing facilities in the U.S. were collected firsthand. That data was analyzed and the energy intensity (kWh/m2) for each facility was calculated and then compared with the energy intensities of the 28 buildings from the sample. Three different indicators of energy consumption in aerospace manufacturing facilities were used as comparators to assist facility managers with determining potential energy savings and help in the decision-making process. On average, aerospace manufacturing facilities in the United States spent 4 cents for each dollar of sale on energy. The energy intensity (kWh/m2) and the power intensity (W/m2) for each facility were calculated based on the actual facility energy bills. The power intensity for these facilities ranges from 34 to 134 W/m2. The energy intensity ranged from 232 to 949 kWh/m2. We found that the power intensity could be used to estimate energy consumption when the annual operating hours of the facility are considered. and to estimate the energy-related carbon dioxide emissions.Keywords
As shown in Fig. 1, the U.S. industrial sector uses more energy than either the commercial or residential sectors. The industrial sector consumed more than 32,709 trillion Btu (9.59 trillion kWh) in 2018 and 32,556 trillion Btu (9.54 trillion kWh) in 2019. This is equivalent to more than 32% of the total U.S. energy consumption (EIA, 2019). As with the other sectors, there has been significant and relatively consistent growth in the energy consumed in the U.S. industrial sector last 70 years as shown in Fig. 1.

Figure 1: U.S. energy consumption by end sector [1]
Buildings are one of the major contributors to climate change and account for more than one third of global energy consumption and responsible for one fourth of CO2 emissions [2]. Because of the enormity of this usage, energy is one of the most significant considerations when analyzing and looking for potential savings in the industrial sector. According to the annual energy outlook report for the year 2020, the manufacturing sector is responsible for more than 77% of the U.S. industrial energy sector consumption, as shown in Fig. 2 [3].

Figure 2: U.S. energy use by industry [3]
In this research, a focus was placed on the energy consumption within aerospace manufacturing. This is an important area and while there are examples of energy intensity quantification for commercial and government sectors Bawaneh et al. [4] and Esmaeili et al. [5–7] little literature has been found on it relating to energy consumption of the entire manufacturing facility. article about the energy intensity of computer manufacturing [8], study of the impact of automation on manufacturing energy intensity [9]. Publication about the energy intensity changes in Indian manufacturing sector [10], and the suggested approach for energy and carbon intensity quantifications by Gutowski [11] are all examples in the literature that highlight the need for and importance of the energy intensity analysis for each specific type of manufacturing facilities. However, based on the conducted literature review by authors, most of the studies have focused on comparing energy consumption for different materials and the amount of energy per unit of production volume. For example, Sihag et al. [12] provided a methodology to estimate that the energy demand of the HVAC for machining 1 kg of aluminum was 11.86 kWh/kg. Sihag et al. [12] and Huang et al. [13] quantified energy intensity of additive manufacturing processes to be used in aerospace facilities, Cooper et al. [14] focused on energy requirement of five metal forming processes. Furthermore, an analysis of the energy required for manufacturing processes for sheet metal used in the aerospace industry conducted by Rossie shows that forming titanium requires 337 kWh/part and for aluminum 156 kWh/part [15]. This research attempts to specifically look at aerospace manufacturing while broadly viewing the data for the facilities as whole. An analysis was made to estimate the industrial facility non process energy using the utility bills and/or production rate. The results of this analysis indicated that non process energy ranges from 7 to 26 kWh/ft2 [16].
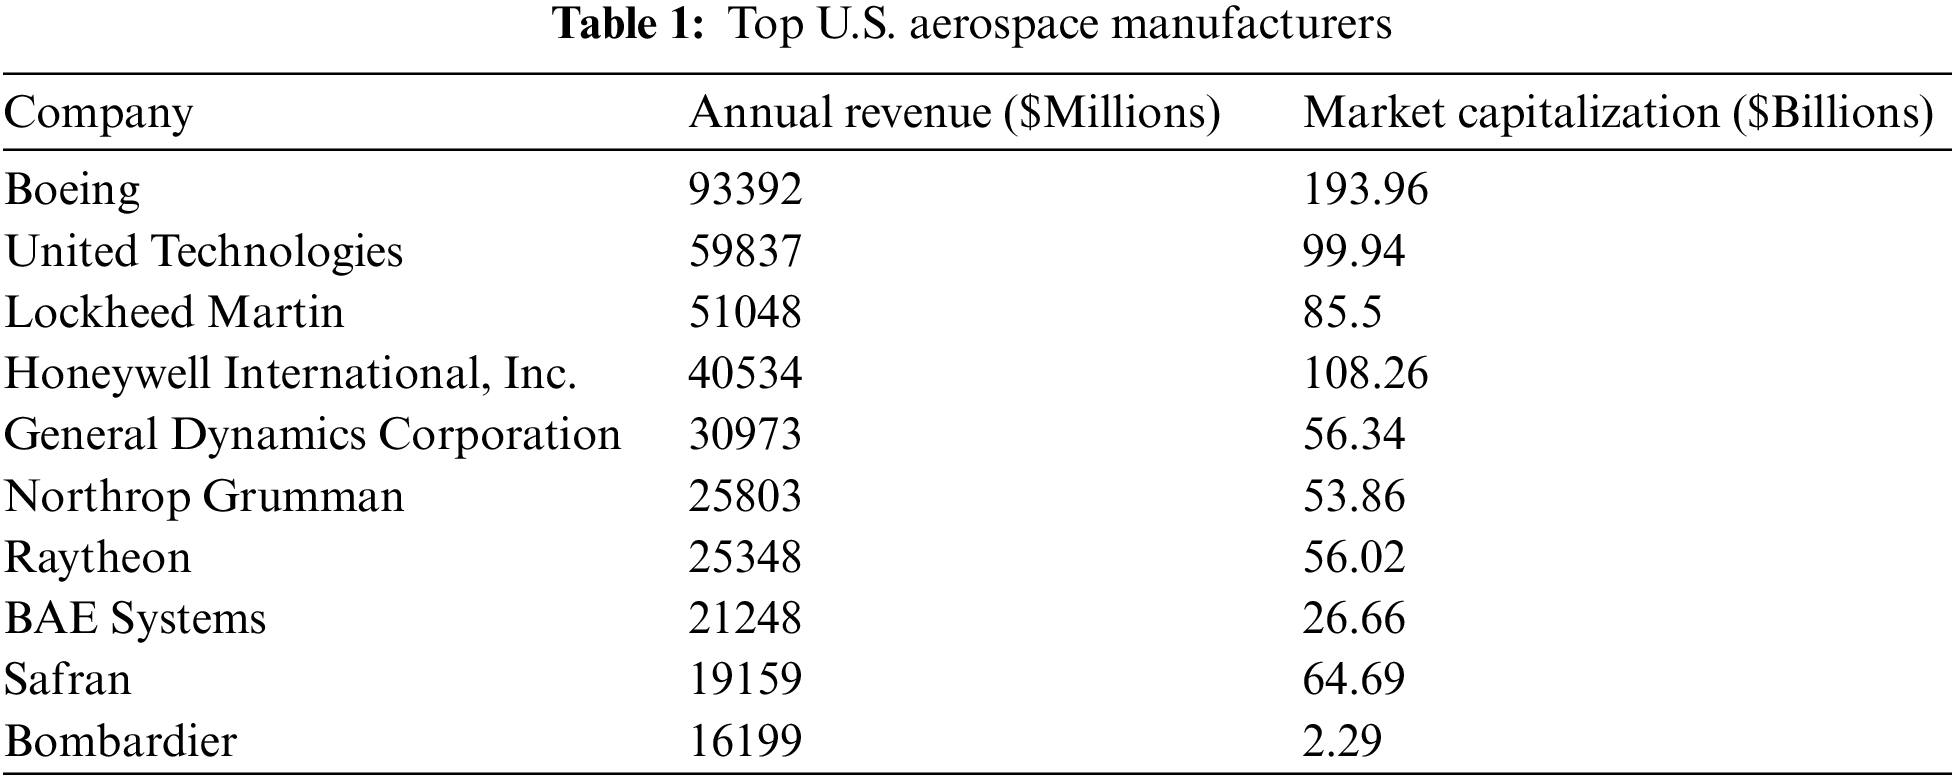
According to the National Association of Manufacturers, around 93% of the U.S. manufacturing companies believe that high energy prices have negative financial effects on their businesses. Therefore, it is important to reduce and control energy consumption to be able to minimize its negative impacts on these businesses [17]. The United States Aerospace Industries Association reported that aerospace and defense are responsible for $909 billion in sales in 2019 and contributed more than 1.8% of the U.S. GDP in 2018 [18]. The annual revenue and market capitalization for the top U.S. aerospace/aviation companies and manufacturers are shown in Table 1 [18].
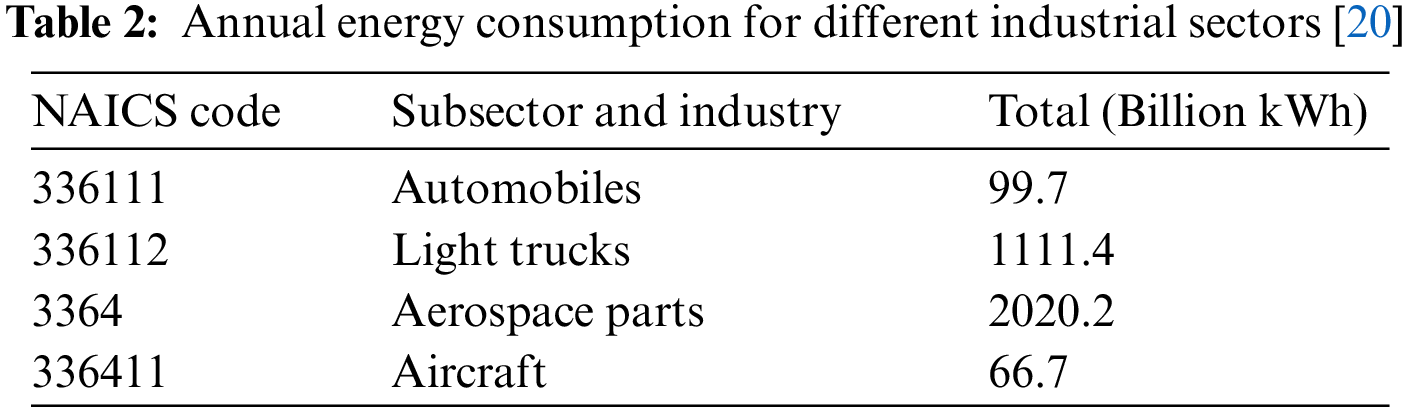
The United States Census Bureau reported that in 2018, aerospace products, aerospace parts, and defense manufacturers spent more than 1.4 billion dollars on electricity and fuels. The aerospace industries spend a disproportion amount on electricity and fuel when comparisons are made to other industries [19]. According to the Energy Information Administration, the total energy consumed by the aerospace parts industries in the United States in 2018 was estimated to be 20 billion kWh. This is more than double the energy consumed by the automobile industry. This data and the energy consumption for other similar sectors are shown in Table 2 with their NAICS codes.
According to the EPA report, which was released in the year 2018, energy-related carbon dioxide emissions account for 84 percent of the total emissions in the United States. The industrial sector consumes nearly 33% of the annual energy usage in the United States [20]. Because of the high cost of energy, facility managers need to look for more efficient ways to use energy and take care of environmental requirements [21]. Studying the characterization of the energy usage within aerospace manufacturing facilities will allow us to determine the potential for reductions in energy usage and allow us to look for effective ways to manage energy and reduce the environmental impacts of aerospace manufacturing. The main objective of this study is to collect and analyze the publicly available data in the literature related to aerospace manufacturing facilities and estimate their energy intensity per building. Additionally, energy data for three aerospace manufacturing facilities in the United States were collected firsthand as a part of this research and analyzed. The energy intensities for these buildings were calculated and compared with those from the publicly available data to determine possible improvements and to evaluate the environmental impacts for aerospace manufacturing facilities energy.
The main objective of this study is to analyze energy use in aerospace manufacturing facilities using published data from the literature and government reports. In addition to the published data, the energy data for three aerospace manufacturing facilities in the U.S. were collected firsthand and analyzed. The energy intensity is defined in this research, as the power consumed in kWh per square meter (kWh/m2) of the building’s footprint. To understand and analyze the energy consumption in aerospace manufacturing facilities, the following approach was followed:
1. Published information on energy usage for aerospace parts manufacturing facilities has been analyzed and compiled.
2. The energy intensity for each manufacturing building was estimated based on the annual energy consumption, the square footage for each facility, and the operating hours.
3. The energy data on utility bills, operating hours, and building area for three aerospace facilities in the U.S. were collected and analyzed.
4. The energy intensity for each of these three facilities was calculated using the actual annual energy consumption and summarized to allow for comparison of trends.
Presented in this section are individual results for three different aerospace facilities in the United States followed by data from a sample of other facilities.
The facility produces metal formed aerospace parts in the Midwest. The energy data for this facility was collected. The total area of the facility was estimated to be around 4293.047 m2. While this data was collected, the facility was operating at only one 8-h shift per day. As shown in Table 3, the monthly energy consumption for the case 1 facility ranges from 63,400 kWh in November to 144,365 kWh in January. The monthly energy consumption is affected by the weather and the production rate of the facility.
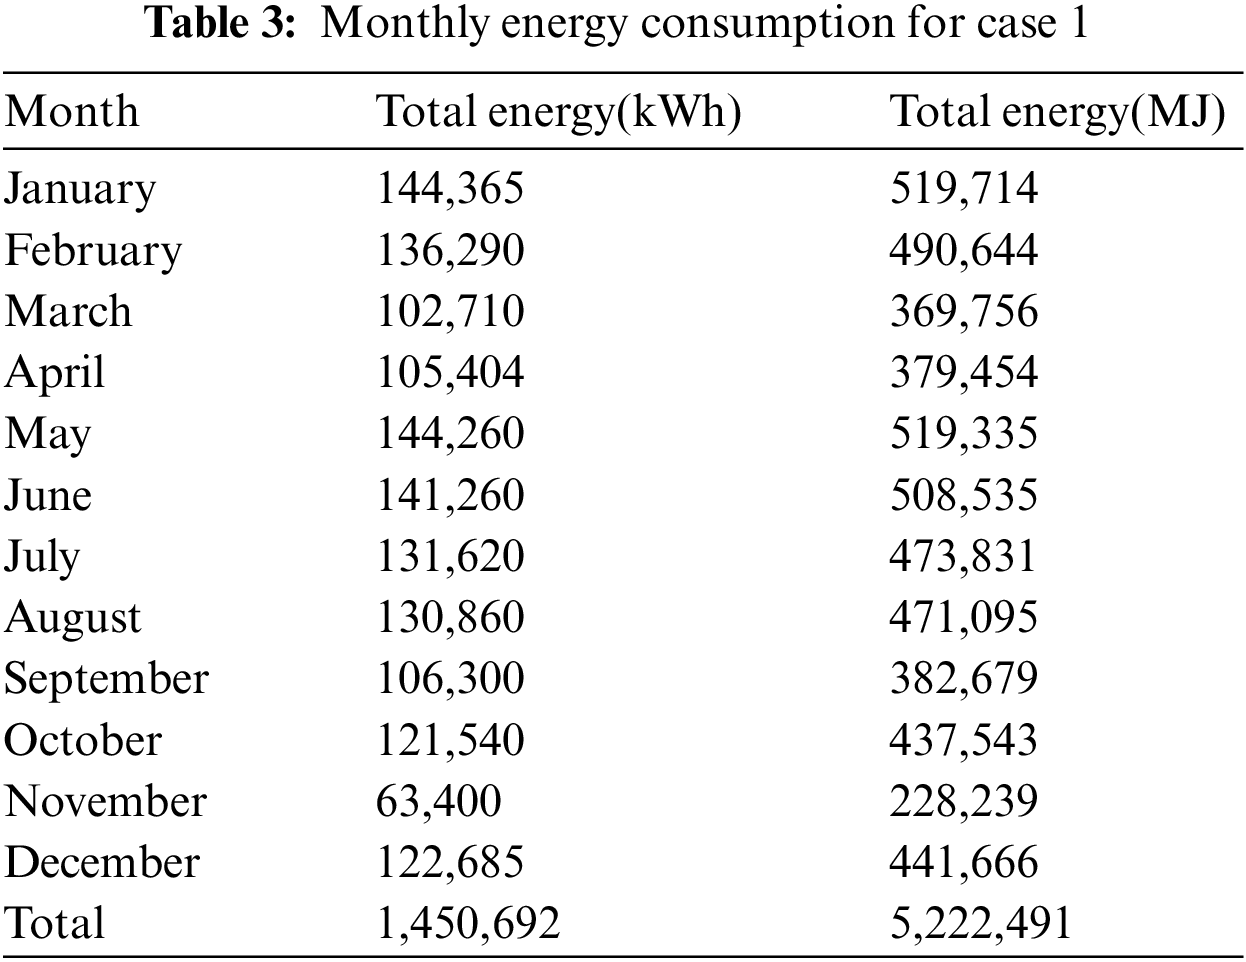
To analyze and understand the energy characteristics for this aerospace facility, the utility bills, operating hours, and building information were collected from the facility. Then the energy intensity was calculated. The annual energy consumption for this facility, based on the utility bills, was provided in kWh and it is equal to 1,450,692 kWh (5,222,484 MJ). The energy intensity is the total energy (in kWh or MJ) divided by the facility area (in square foot or square meter). We have used a unit of kWh/m2 for energy intensity and found the value for this facility to be 337 kWh/m2.
The facility produces metal formed aerospace parts and it is located in the Midwest area of the United States. The total area of the facility was estimated to be 10,172 m2. The data were collected while the facility was running three 8-h shifts per day. To analyze and understand the energy usage for this facility, the utility bills, and building information were collected from the facility. Then the energy intensity was calculated. The energy consumption for 12 months for this facility, based on the utility bills, was equal to 5356311.38 kWh. The energy intensity was found to be equal to 526 kWh/m2.
The facility which located in the Midwest and produces metal formed aerospace parts. The total area of the facility was 5520 m2. The annual energy consumption for this facility, based on the utility bills, was equal to 3,424,488.88 kWh. The monthly energy consumption for the facility ranges from 878,086 MJ in April to 1,260,979 MJ in December. The energy intensity was estimated to be equal to 620 kWh/m2.
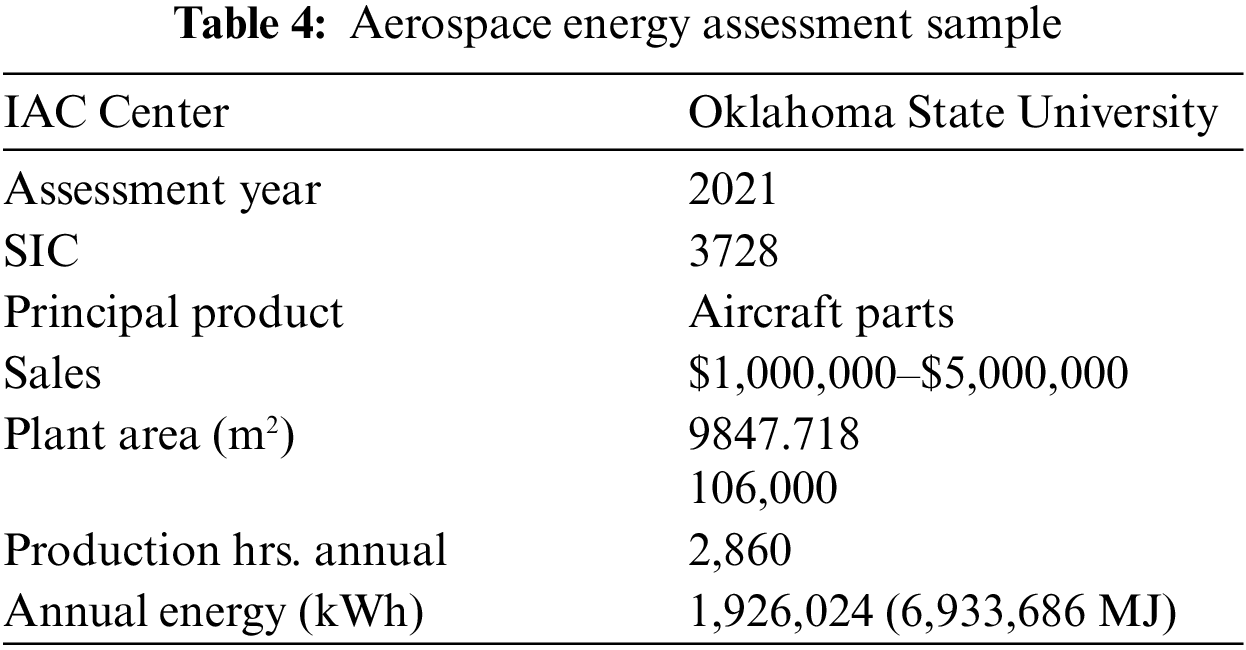
In the 2006, the U.S. Department of Energy initiated the Industrial Assessment Center (IAC). The IAC has centers in different areas of the United States to implement industrial energy assessments. Each center implements energy assessments and investigate potential energy savings and find most effective ways to improve energy efficiency such as energy waste minimization and other improvements. The energy assessments include the SIC number, all energy consumption information, annual production rate, facility information and recommendations for savings after changes. To analyze and understand the energy consumption for these facilities, the building and energy information were collected from these IAC reports. Then the energy intensity was calculated. The annual energy consumption for 28 aerospace facilities was collected and analyzed based on the information published on the IAC website. As an example, the Oklahoma State University Industrial Assessment Center conducted an assessment for an aerospace facility in Kansas in 2021 and a sample of the facility information is shown in Table 4 [22].
The energy intensity was calculated as follows:
For this example:
The energy intensity was calculated using the same method for the 27 other aerospace facilities shown in Table 5.

To get a better understanding of the energy consumption and to compare the case studies energy consumptions with the literature on aerospace facilities energy consumptions, a Boxplot of the energy and power intensities was created. As shown in Fig. 3, the energy intensity ranges from 399 to 851 kWh/m2 with a median equal to 381 kWh/m2. The energy intensity for the case 1 facility was estimated to be equal to 337 kWh/m2, which is below average. Therefore, we would be using this message does not expect significant energy savings from this facility. Meanwhile, the case 3 facility had an energy intensity of 620 kWh/m2, which is above the average for other similar facilities. Based on this result, a major energy assessment should be conducted to investigate the energy consumption for potential savings.

Figure 3: Boxplot of aerospace facilities energy & power intensities
The energy intensity (kWh/m2) indicator reflects the actual annual energy consumption for a manufacturing facility which can be used to compare the energy consumption for different facilities with the same operating hours. Comparing the energy consumption for facilities with different operating hours requires another indicator that consider the operating hours. To get a better understanding of the energy usage, another comparison indicator can be used such as the power intensity (W/m2) that has the operating hours considered in the calculations. The power intensity can be calculated as follows:
As shown in Fig. 4, the power intensity ranges from 11 to 134 W/m2 with the median equal to 129 W/m2. The power intensity for case 3 was estimated to be equal to 13.5 Watts/ft2 which is above the average of the power intensity for the sample.
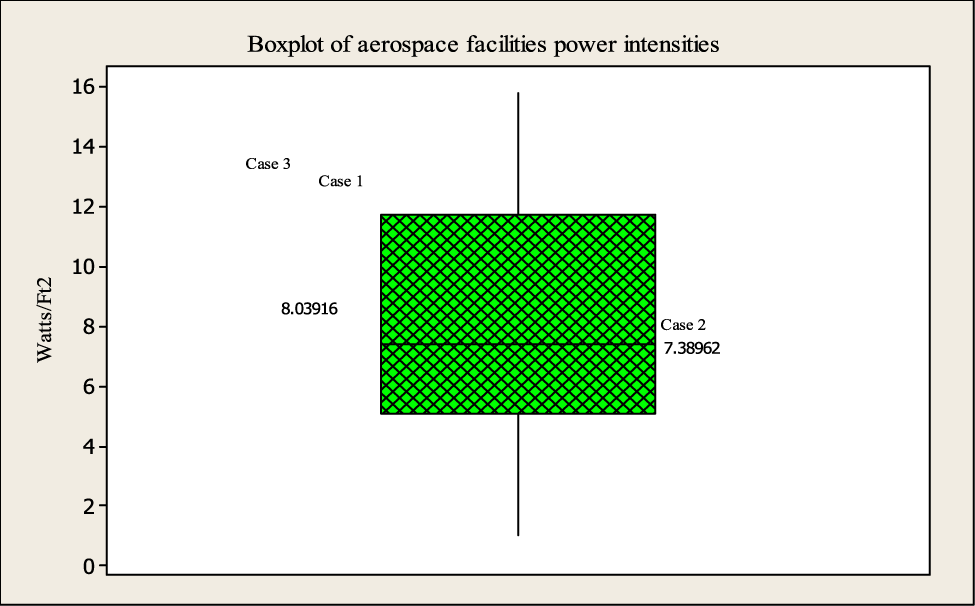
Figure 4: Boxplot of power intensities for 3 case studies
Another indicator that relates the annual sales to the kWh consumed can be used to compare the cost of energy for each facility with the annual sales. For example, a facility with $23,000,000 annual sales and 9,195,192 kWh annual energy consumption, the $/kWh can be calculated as follows:
This means that for every kWh or energy used, this facility has $2.5 dollars in sales. If the price of 1 kWh is 20 cents, then for each one dollar of sale, this business spent 8 cents for energy. The amount of money spent on energy per dollar of sale were calculated for each facility. As shown in Fig. 5, the average $/kWh is equal to 4.9 while the median is 5.6 $/kWh. On average, the U.S. aerospace manufacturing business spends 4 cents for each dollar of sale on energy.
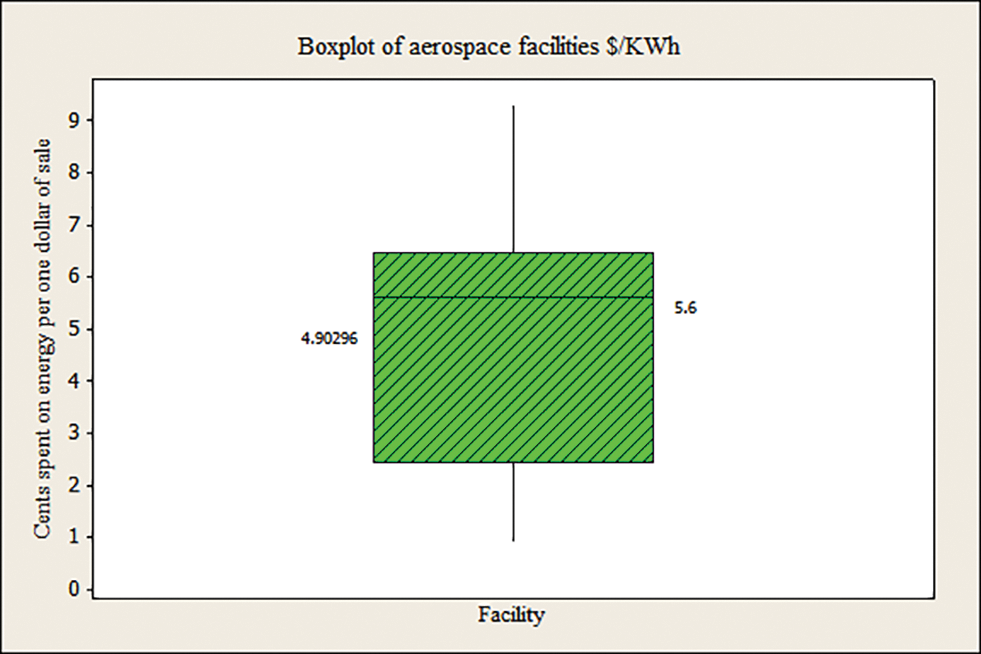
Figure 5: Boxplot of aerospace facilities $/kWh
Three aerospace manufacturing facilities were studied and the energy data for these facilities were collected. The energy intensity (kWh/m2) and the power intensity (W/m2) for each facility were calculated based on the actual facility energy bills. The power intensity for these facilities ranges from 80 kW/mm2 for the case 2 facility to 145 W/mm2 for the case 3 facility. It is concluded that the power intensity is a better estimate for energy consumption than the energy intensity since the annual operating hours are considered.
Two different estimated values were used to compare the energy consumption for aerospace manufacturing facilities, energy intensity and power intensity. The average, range, and standard deviation for the power and energy intensity are shown in Table 6. This result further contributes to the life cycle of products by using the power intensity.

This paper has provided a more complete review of the energy information for the aerospace manufacturing facilities in the United States. This result further contributes to the life cycle of aerospace manufacturing buildings and products by using the result for energy consumption for facilities per square foot or meter. These results can be used in life cycle studies of aerospace manufacturing facilities and products. In this study, three different indicators of energy consumption in aerospace manufacturing facilities were used as comparators. These comparators have been shown to be valuable in assisting facility managers to determine potential energy savings and to help in the decision-making process.
Data Availability Statement: The authors confirm that all data, models, and code generated or used during the study appear in the submitted article.
Acknowledgement: All co-authors have seen and agree with the contents of the manuscript and there is no financial interest to report. We certify that the submission is original work and is not under review at any other publication.
Funding Statement: The authors received no specific funding for this study.
Conflicts of Interest: The authors declare that they have no conflicts of interest to report regarding the present study.
References
1. Energy Information Administration (2019). End uses of fuel consumption report for the U.S. manufacturing industry. https://www.eia.gov/energyexplained/use-of-energy/. [Google Scholar]
2. González-Torres, M., Pérez-Lombard, L., Coronel, J. F., Maestre, I. R., Yan, D. (2022). A review on buildings energy information: Trends, end-uses, fuels, and drivers. Energy Reports, 8, 626–637. DOI 10.1016/j.egyr.2021.11.280. [Google Scholar] [CrossRef]
3. Energy Information Administration (2020). Annual energy outlook 2020. https://www.connaissancedesenergies.org/sites/default/files/pdf-actualites/AEO2020%20Full%20Report.pdf. [Google Scholar]
4. Bawaneh, K., Ghazi Nezami, F., Rasheduzzaman, M., Deken, B. (2019). Energy consumption analysis and characterization of healthcare facilities in the United States. Energies, 12(19), 3775. DOI 10.3390/en12193775. [Google Scholar] [CrossRef]
5. Esmaeili, A., McGuire, C., Overcash, M., Ali, K., Soltani, S. et al. (2018). Environmental impact reduction as a new dimension for quality measurement of healthcare services: The case of magnetic resonance imaging. International Journal of Health Care Quality Assurance, 31(8), 910–922. DOI 10.1108/IJHCQA-10-2016-0153. [Google Scholar] [CrossRef]
6. Esmaeili, A., Twomey, J. M., Overcash, M. R., Soltani, S. A., McGuire, C. et al. (2015). Scope for energy improvement for hospital imaging services in the USA. Journal of Health Services Research & Policy, 20(2), 67–73. DOI 10.1177/1355819614554845. [Google Scholar] [CrossRef]
7. Esmaeili, M. A., Jahromi, A., Twomey, J., Yildirim, B., Overcash, M. et al. (2011). Energy consumption of VA hospital CT scans. Proceedings of the 2011 IEEE International Symposium on Sustainable Systems and Technology, pp. 1–5. Chicago, IEEE. [Google Scholar]
8. Williams, E. (2004). Energy intensity of computer manufacturing: Hybrid assessment combining process and economic input−output methods. Environmental Science & Technology, 38(22), 6166–6174. DOI 10.1021/es035152j. [Google Scholar] [CrossRef]
9. Wang, E. Z., Lee, C. C., Li, Y. (2022). Assessing the impact of industrial robots on manufacturing energy intensity in 38 countries. Energy Economics, 105(6), 105748. DOI 10.1016/j.eneco.2021.105748. [Google Scholar] [CrossRef]
10. Reddy, B. S., Ray, B. K. (2011). Understanding industrial energy use: Physical energy intensity changes in Indian manufacturing sector. Energy Policy, 39(11), 7234–7243. DOI 10.1016/j.enpol.2011.08.044. [Google Scholar] [CrossRef]
11. Gutowski, T. G. (2007). The carbon and energy intensity of manufacturing. 40th Seminar of CIRP, Liverpool, UK, Keynote Address, Liverpool University. [Google Scholar]
12. Sihag, N., Leiden, A., Bhakar, Y., Thiede, S., Sangwan, K. et al. (2019). The influence of manufacturing plants site selection on the environmental impact of the machining process. The 25th CIRP Life Cycle Engineering Conference, Copenhagen. In: Procedia CIRP, vol. 80, pp. 186–191. https://ris.utwente.nl/ws/portalfiles/portal/189573109/10.1016_j.procir.2019.01.023.pdf. [Google Scholar]
13. Huang, R., Riddle, M., Graziano, D., Warren, J., Das, S. et al. (2016). Energy and emissions saving potential of additive manufacturing: The case of lightweight aircraft components. Journal of Cleaner Production, 135, 1559–1570. DOI 10.1016/j.jclepro.2015.04.109. [Google Scholar] [CrossRef]
14. Cooper, D. R., Rossie, K. E., Gutowski, T. G. (2017). The energy requirements and environmental impacts of sheet metal forming: An analysis of five forming processes. Journal of Materials Processing Technology, 244(7), 116–135. DOI 10.1016/j.jmatprotec.2017.01.010. [Google Scholar] [CrossRef]
15. Rossie, K. (2015). An energy and environmental analysis of aerospace sheet metal part manufacturing (Master’s Thesis). Massachusetts Institute of Technology, MA, USA. [Google Scholar]
16. Bawaneh, K., Overcash, M., Twomey, J. (2018). Industrial facilities non-process energy. Critical Reviews in Environmental Science and Technology Journal, 47(23), 2259–2274. DOI 10.1080/10643389.2013.782168. [Google Scholar] [CrossRef]
17. Love, D. (2008). Greening industrial facility: A sustainable approach to addressing energy concerns. Proceedings from the Thirtieth Industrial Energy Technology Conference, New Orleans. [Google Scholar]
18. Aerospace Industries Association (2019). U.S. facts and figures report. https://www.aia-aerospace.org/research-center/statistics/industry-data/financial/. [Google Scholar]
19. United States Census Bureau (2019). Annual survey of manufactures: Summary statistics for industry groups and industries in the U.S. https://data.census.gov/cedsci/table?n=3133%3A332993%3A3364%3A336611%3A336992&tid=ASMAREA2017.AM1831BASIC01&hidePreview=true [Google Scholar]
20. Energy Information Administration (2020). Energy use in industry for the U.S. manufacturing industry. https://www.eia.gov/energyexplained/use-of-energy/industry.php. [Google Scholar]
21. Zhu, Y. (2006). Applying computer-based simulation to energy auditing: A case stud. Energy and Buildings, 38, 421–428. DOI 10.1016/j.enbuild.2005.07.007. [Google Scholar] [CrossRef]
22. United States Department of Energy (2021). Industrial Assessment Center Database (IAC). https://iac.university/assessment/OK1045. [Google Scholar]
Cite This Article
 Copyright © 2023 The Author(s). Published by Tech Science Press.
This work is licensed under a Creative Commons Attribution 4.0 International License , which permits unrestricted use, distribution, and reproduction in any medium, provided the original work is properly cited.
 Downloads
 Citation Tools