
 Submit a Paper
 Propose a Special lssue
 Open Access
ARTICLE
Power Incomplete Data Clustering Based on Fuzzy Fusion Algorithm
1 Guangdong Electric Power Information Technology Co., Ltd., Guangzhou, 520000, China
2 Guangdong Power Grid Co., Ltd., Guangzhou, 520000, China
* Corresponding Author: Yutian Hong. Email:
Energy Engineering 2023, 120(1), 245-261. https://doi.org/10.32604/ee.2022.022877
Received 30 March 2022; Accepted 31 May 2022; Issue published 27 October 2022
 View Full Text
 Download PDF
Abstract
With the rapid development of the economy, the scale of the power grid is expanding. The number of power equipment that constitutes the power grid has been very large, which makes the state data of power equipment grow explosively. These multi-source heterogeneous data have data differences, which lead to data variation in the process of transmission and preservation, thus forming the bad information of incomplete data. Therefore, the research on data integrity has become an urgent task. This paper is based on the characteristics of random chance and the Spatio-temporal difference of the system. According to the characteristics and data sources of the massive data generated by power equipment, the fuzzy mining model of power equipment data is established, and the data is divided into numerical and non-numerical data based on numerical data. Take the text data of power equipment defects as the mining material. Then, the Apriori algorithm based on an array is used to mine deeply. The strong association rules in incomplete data of power equipment are obtained and analyzed. From the change trend of NRMSE metrics and classification accuracy, most of the filling methods combined with the two frameworks in this method usually show a relatively stable filling trend, and will not fluctuate greatly with the growth of the missing rate. The experimental results show that the proposed algorithm model can effectively improve the filling effect of the existing filling methods on most data sets, and the filling effect fluctuates greatly with the increase of the missing rate, that is, with the increase of the missing rate, the improvement effect of the model for the existing filling methods is higher than 4.3%. Through the incomplete data clustering technology studied in this paper, a more innovative state assessment of smart grid reliability operation is carried out, which has good research value and reference significance.Keywords
With social progress and economic development, the scale of the power grid is increasing brutally and expanding continuously. The voltage level of the power grid is constantly improving, and the UHV (ultra-high voltage), large-capacity and long-distance transmission have become a reality. The reliable and safe operation of power grid is related to the development of economy and people’s livelihood, and the investment in operation and maintenance equipment of the power grid enterprises is increasing. Ubiquitous Power Internet of things aims to cover all aspects of energy production, transmission and consumption, establish a “second network” based on the existing power network, and form the energy Internet together with the smart grid to realize the transformation of SGCC (State Grid Corporation of China) to a world-class energy Internet enterprise through the construction of ubiquitous power Internet of things. Energy Internet has the characteristics of holographic perception of power grid status, the comprehensive connection of operation data, online company business, a new experience of customer service and open sharing of energy ecology [1]. Under such a strategic concept, with the gradual application of power grid sensors to the power grid, the panoramic information condition monitoring of power equipment is becoming more and more perfect, the power data is growing rapidly, and the information fusion and integration technology is progressing, which provides sufficient data support for equipment fault diagnosis, condition assessment and comprehensive analysis [2]. Power data presents the characteristics of big data, which can be applied to the current widely used big data mining analysis technology in the Internet industry to provide technical support for power big data mining analysis and condition assessment.
The power grid should realize the desire of comprehensive state perception, efficient information processing and convenient and flexible application. Ubiquitous Power Internet of Things aims to cover all aspects of energy production, transmission and consumption, establish a “second network” on the basis of the existing power network, and form the energy Internet together with the smart grid, so as to realize the transformation of SGCC companies to world-class energy Internet enterprises through the construction of ubiquitous Power Internet of Things.
Gholami et al. [3] used the current power grid company’s power equipment condition assessment method to assess the condition of transformers, relays and other equipment. The final result obtained in this way is more subjective. Liu et al. [4] introduced the state function and the initial value when the equipment is put into operation. By calculating the distance between the state value and the limit value, the current state of an index is obtained. This is to reduce subjective factors as much as possible. The final state evaluation of the equipment is based on multi-index information fusion. This method also layers the equipment. In this way, the fault parts of the equipment can be identified to a certain extent, which is convenient for the later maintenance of the equipment. In addition, in recent years, the research on improving the classification effect of incomplete data by using rough set and three-branch decision theory is also very common. For example, Kryszkiewicz and others first proposed to use the tolerance relation in the data object to deal with the knowledge system containing missing values [5]; Min et al. [6] used mutual information as a metric to reduce data before classification.; However, this study does not divide the equipment into more detailed levels, and further improvement is needed. Hu et al. defined attribute reduction based on consistency, considering the distribution of each decision class on the premise of keeping the positive domain unchanged [7]. However, the evaluation is not comprehensive in the selection of qualitative indicators. Although these methods can improve the classification effect of incomplete data to a certain extent, these classical rough set methods often require the existence of equivalence relations in the data set, which is difficult to meet for the ubiquitous incomplete data in real life [8]. From the above literature, we can see that some progress has been made in the condition assessment of power equipment. These studies are committed to the selection of power equipment state quantity index, and then determine the weight of each state quantity index. The guiding significance of equipment condition assessment to equipment condition-based maintenance is not very clear, and it is necessary to carry out further research on these issues.
Incomplete data of power equipment is typical semi-structured data, including equipment model, voltage level, manufacturer, discovery time and nature, so it can be used as structured data [9]. Based on the different data characteristics, this paper establishes the differentiated power equipment condition assessment method, studies the power equipment condition analysis methods of different types of power equipment and different data types, and realizes the condition assessment of power equipment according to the data type and the assessment method suitable for the data characteristics. This differentiated condition assessment method not only absorbs the benefits of the current technology, but also combines the existing mature application technology in other fields to improve the current condition assessment method of power equipment according to the principles of scientificity, subjective and objective combination and operability. The results show that this study can effectively improve the accuracy of condition evaluation of power equipment, and better serve the condition-based maintenance of power equipment to improve the efficiency of equipment maintenance in power enterprises and reduce the operating costs of enterprises, which has important research value and practical reference significance.
The main innovations of this paper are:
(1) Construct a power equipment data structure, adopt a power equipment state mode of fuzzy mathematics for numerical data and an assessment mode of a pow equipment state assessment guideline for non-numerical data, and finally fuses that data.
(2) A clustering method for establishing different power equipment data types according to different data types is proposed.
(3) An array-based Apriori algorithm is proposed to mine incomplete structured data.
The overall process of the research framework in this paper is shown in Fig. 1.
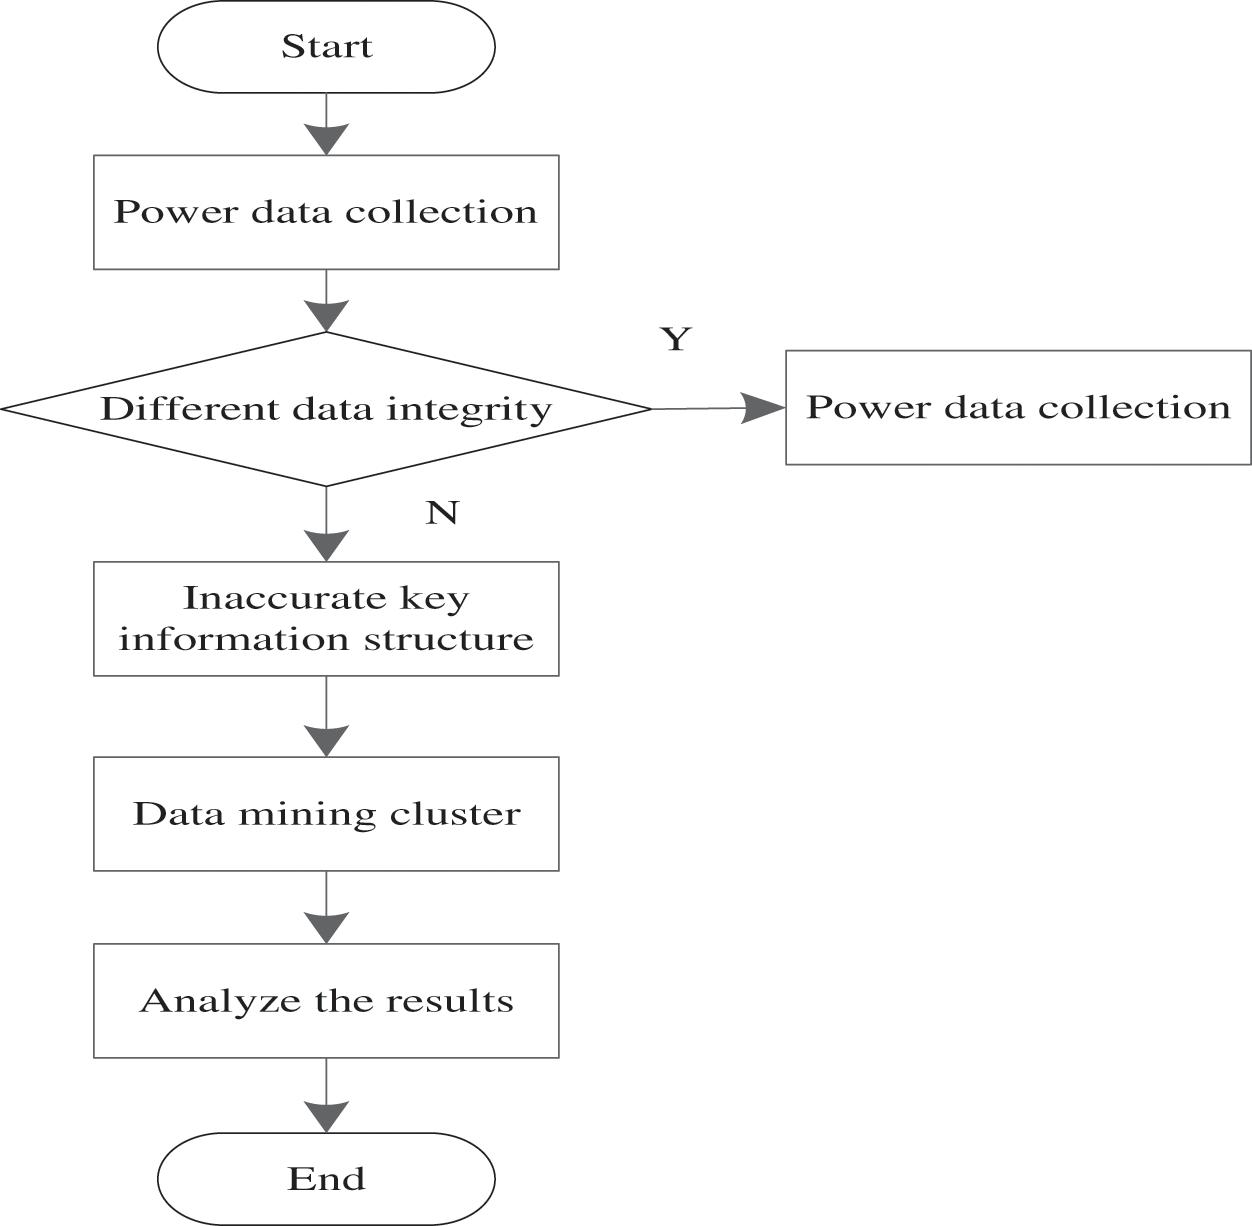
Figure 1: Overall flow of the system framework
2.1 Fuzzy Modified Cluster Analysis
Fuzzy clustering is used to integrate multi-source heterogeneous data into a unified system, and the initial weight phasor of an element in the index layer relative to the middle layer is obtained through calculation [10]. However, the initial weighted phasor has the problem of large subjective experience, and the scientificity of the evaluation process and the accuracy of the evaluation results are questioned [11]. Fuzzy mathematics has been widely used to solve the problem of fuzzy evaluation boundary. The fuzzy membership function is introduced to modify the initial weight phasor so that the evaluation process combines the advantages of subjective experience and objective calculation as much as possible. Finally, a more accurate evaluation result is obtained [12]. Set up an index set for all the state quantity indexes to be evaluated:
To establish the associated index set of power equipment, the membership function can be used to solve the problem of the degree to which an element belongs to the boundary fuzzy set, and the value range is between 0 and 1 [13]. The larger the value, the greater the probability that the element belongs to the fuzzy set. In the evaluation process, the data is divided into numerical data and non-numerical data according to different data types, and different membership functions are used for calculation [14]. In the process of numerical data evaluation, there is usually a warning value as the reference value of equipment condition evaluation. And the trend of data change is generally divided into two types, so the fuzzy membership distribution functions of increasing and decreasing type (the smaller the better type) and decreasing type (the bigger the better type) are established, respectively [15].
Association rules can be expressed by the implication
The things to be associated in the association rule are called items, which are the components of the itemset I. The length of the itemset is used to represent the number of items in the itemset. A k-itemset is an itemset that contains k items. The sample set Y to be mined is defined as a subset of the item set, and the sample database D includes all samples [17]. Support and confidence are two important concepts of association rules. In the sample database D, support refers to the probability that A and B appear simultaneously [18]. Record as:
where,
The support degree of the association rule
where,
The confidence of an association rule
where,
In addition, the minimum support
The mining of Apriori algorithm is divided into two stages:
In sample data, an iteration method is adopted to calculate and retrieve the itemsets of which the support degree is not less than the minimum support degree to obtain frequent itemsets.
Select the frequent itemsets with confidence not less than the minimum confidence to obtain the strong association rules [20].
The operation process of the Apriori algorithm in the execution of the above two stages is to first calculate the support, retain the itemsets that are greater than or equal to the minimum support (meet the minimum support), that is, to obtain “order 1 frequent itemsets
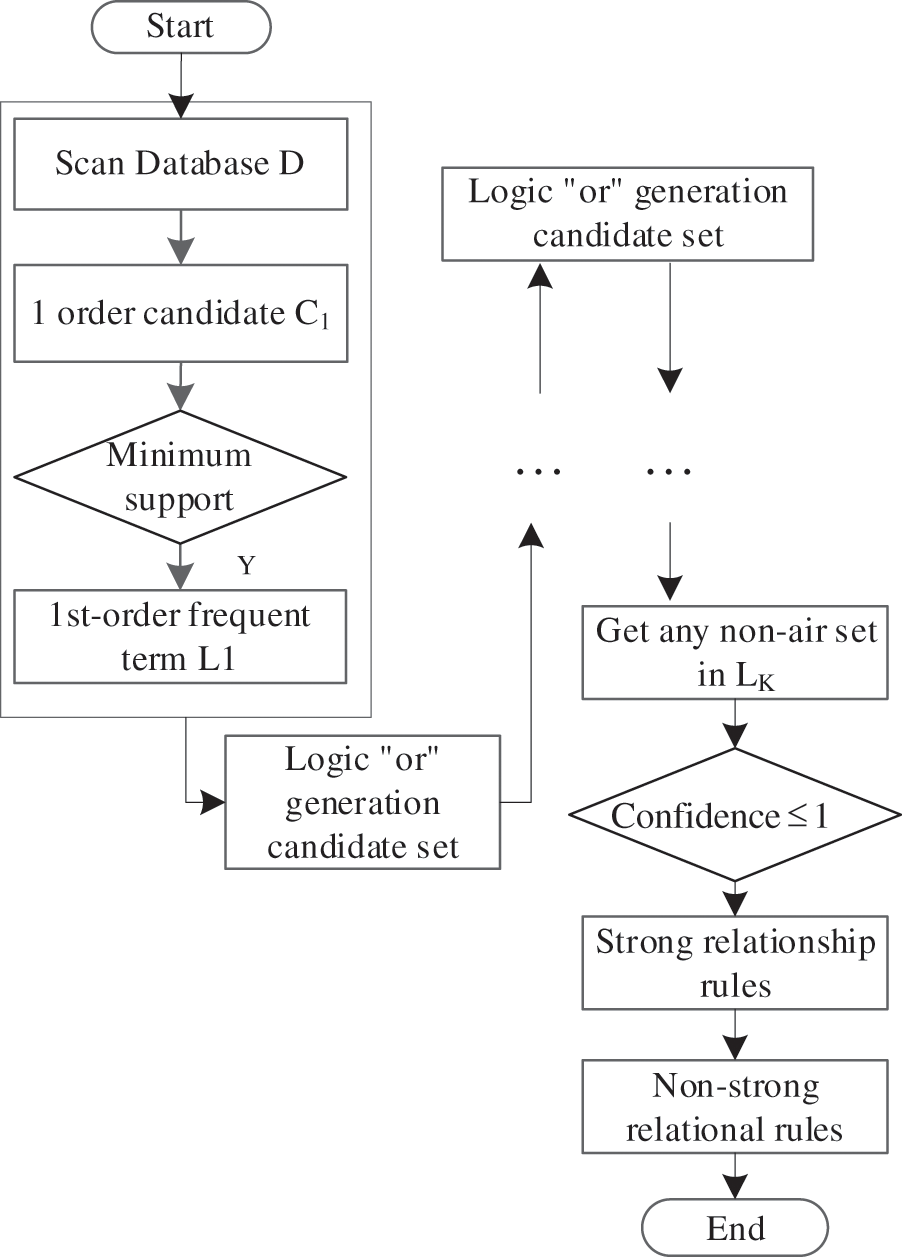
Figure 2: Flow chart of Apriori algorithm
To reduce the number of times the program scans the database space and to speed up the program processing, two important properties need to be used in the algorithm:
If an itemset
If the itemset
3 Association Rules of Incomplete Data in Power System Based on Apriori Algorithm
3.1 Power System Incomplete Critical Information Structured
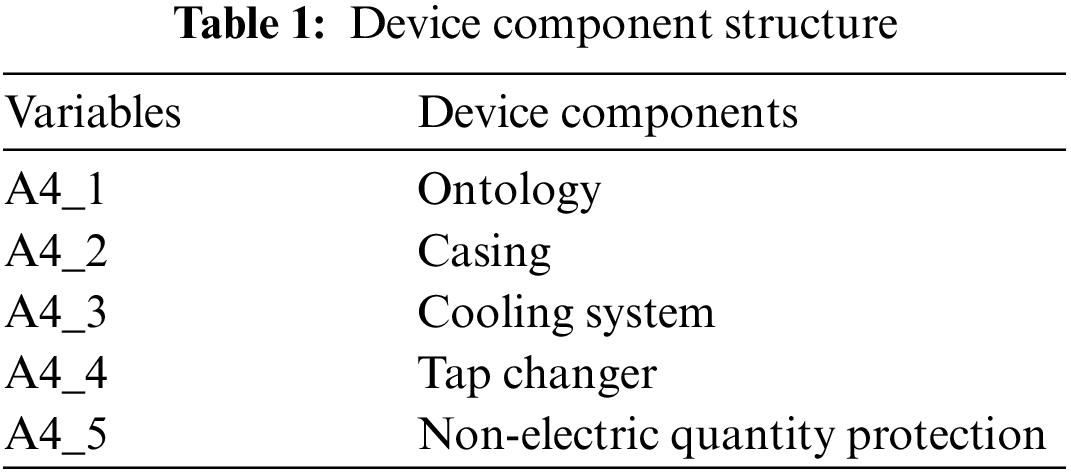
Incomplete data includes incomplete key information of power equipment such as manufacturer, equipment type, equipment components and voltage level, as well as peripheral key information such as discovery time, service location and nature. To ensure convenient and accurate reading, these unstructured data are structured [22]. The corresponding faults and structural indexes of power transformer are listed as follows: oil seepage/leakage, crack, rust, exothermic fault and abnormal vibration. The structural numbers of the selected power equipment manufacturers are A1_1-A1_n, the equipment types are A2_1 and A2_2, corresponding to transformers and circuit breakers, respectively. The equipment model numbers are A3_1-A3_n, and the equipment component numbers are A4_1-A4_n, as shown in Table 1.
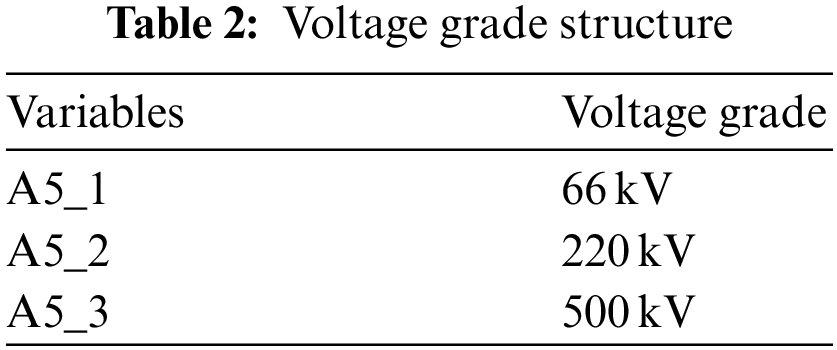
Select three voltage levels and number them A5_1-A5_3, as shown in Table 2.
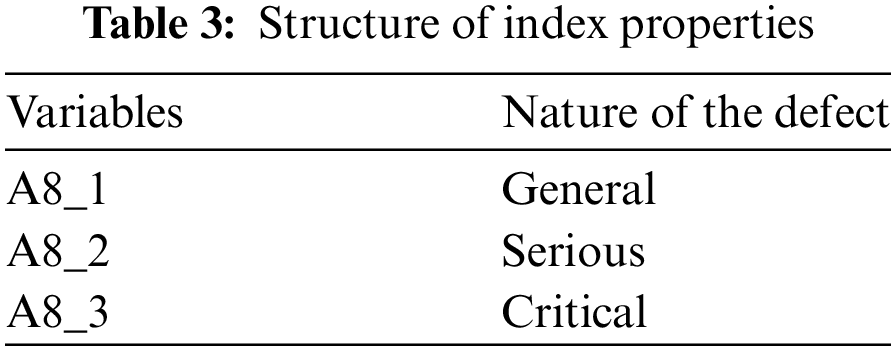
The time of discovery and the place of service are integrated as an important basis for the prediction of the operating environment of power equipment. Among them, the discovery time is classified by month, and there are 12 categories that can be structured, which are A6_1-A6_12. The location is divided into 14 categories according to the source administrative region of the incomplete data of the current analysis of power equipment, which are A7_1-A7_14. The final index nature is divided into 3 categories according to the Classification Standard for Primary Power Transmission and Transformation Equipment [23]. The standardization numbers are A8_1-A8_3, respectively, as shown in Table 3.
For the data that is larger and closer to the warning value, the initial value is q and the warning value is c4. The value range of the state quantity index i is divided into four intervals, which are respectively represented as
(1) Membership function of increasing and decreasing type
In the formula, A represents four state levels, c1 is the initial value of the index, c4 is the alert value of the index, and A represents the membership degree of the state quantity index I under different health state levels Qs.
(2) Degraded membership function
In the formula, s = 1, 2, 3 and 4 represent four state levels, c1 is the alert value of the index, c4 is the initial value of the index, and V represents the membership degree of the state quantity index I under different health state levels Qs.
3.2 Construction of Clustering Model for Power Incomplete Data Mining
Equations in display format are separated from the paragraphs of the text. Equations should be flushed to the left of the column. Equations should be made editable. Displayed equations should be numbered consecutively, using Arabic numbers in parentheses. See Eq. (1) for an example. The number should be aligned to the right margin. Equations in display format are separated from the paragraphs of the text. Equations should be flushed to the left of the column. Equations should be made editable. Displayed equations should be numbered consecutively, using Arabic numbers in parentheses. See Eq. (1) for an example. The number should be aligned to the right margin.
Considering the characteristics of incomplete data of power equipment and the problem of low mining efficiency caused by the repeated scanning of the database in the mining process of the Apriori algorithm, the frequent item mining based on an array is selected to improve the mining efficiency. The specific improvement idea of the algorithm is as follows:
(1) The transaction database is divided into different transaction units according to different manufacturers, and the data in these transaction units are stored in two-dimensional arrays.
(2) Mine frequent items until no k item set can be found and searched.
(3) Merge the obtained frequent itemsets to obtain the merged high-order frequent item sets, then calculate the confidence degree. Keep the itemsets that are more than or equal to the minimum confidence degree (meeting the minimum confidence degree), namely obtain the strong association rule, and finally find the strong association rule. The key information and types are marked with corresponding structured identifications. The transaction units are divided according to the manufacturer, and the structured data in each unit is stored in a two-dimensional array. The data is scanned and compared with the data in the thing database, the data existing in the two-dimensional array is represented by ‘1’, and the data not existing in the two-dimensional array is represented by ‘0’. The Boolean distribution data is obtained by processing in this way so that the counting is convenient, the support degree is calculated, the frequent itemsets are obtained, and the strong association rules are found. The clustering model flow of the array-based Apriori algorithm is shown in Fig. 3.
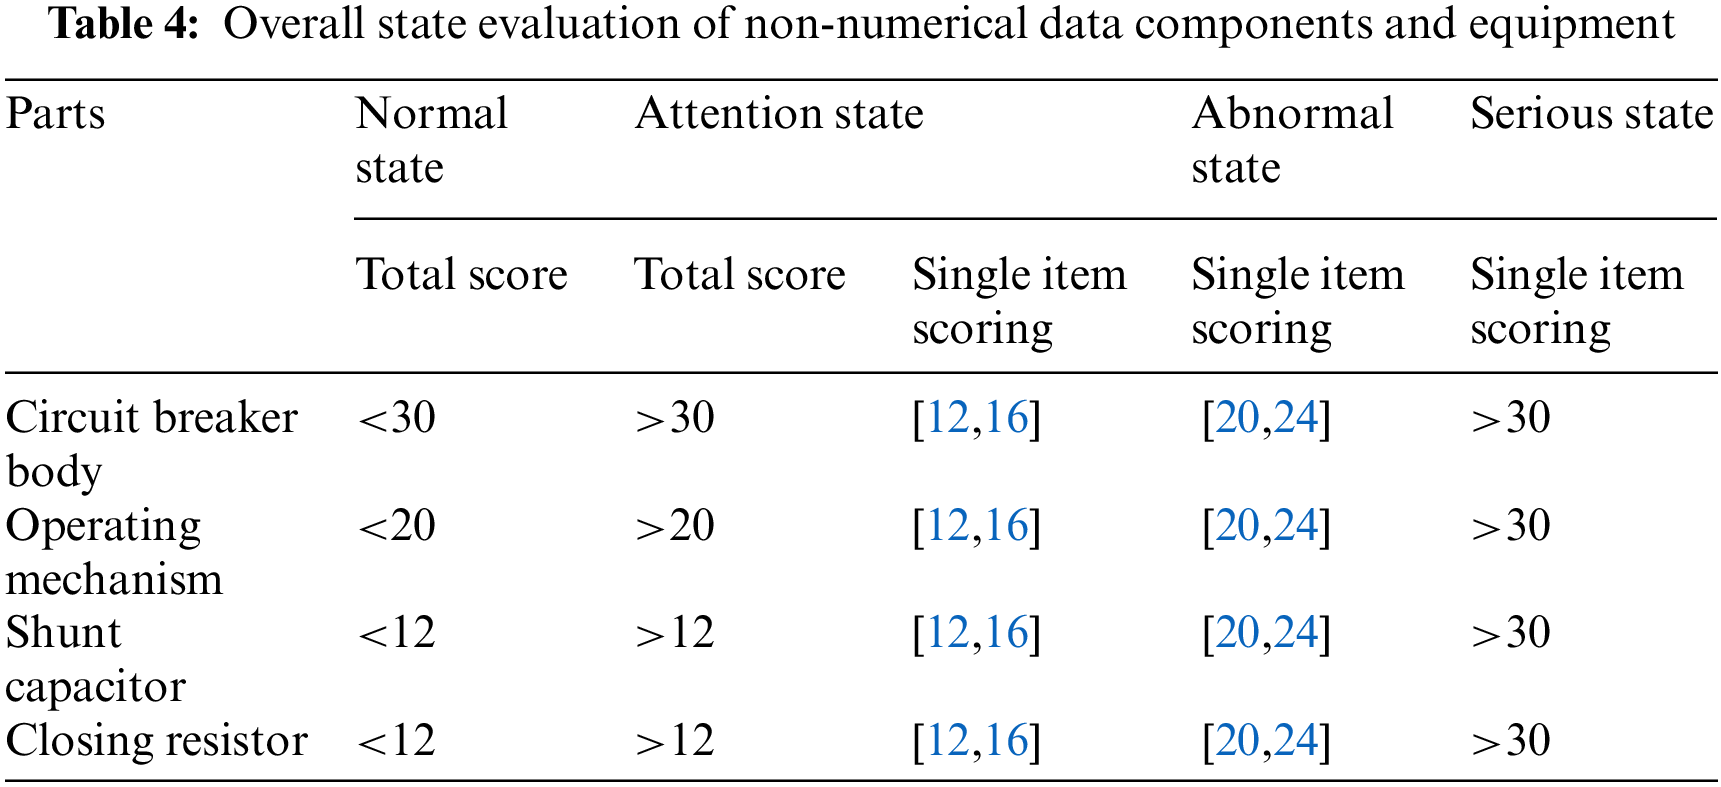
(4) Quantitative evaluation method for non-numerical data
Because the non-numerical data does not have the characteristics of numerical continuous change, it is difficult to use the general fuzzy distribution membership function to quantify the membership degree of each state quantity index to the state level. It is difficult to quantify the weight of each index and the value of equipment deterioration by using fuzzy mathematics. The evaluation method of reference guideline scoring, that is, the comprehensive scoring of state quantity is obtained by the product of basic scoring value and weight coefficient. The evaluation method of quantitative membership degree of non-numerical data is shown in Table 4.
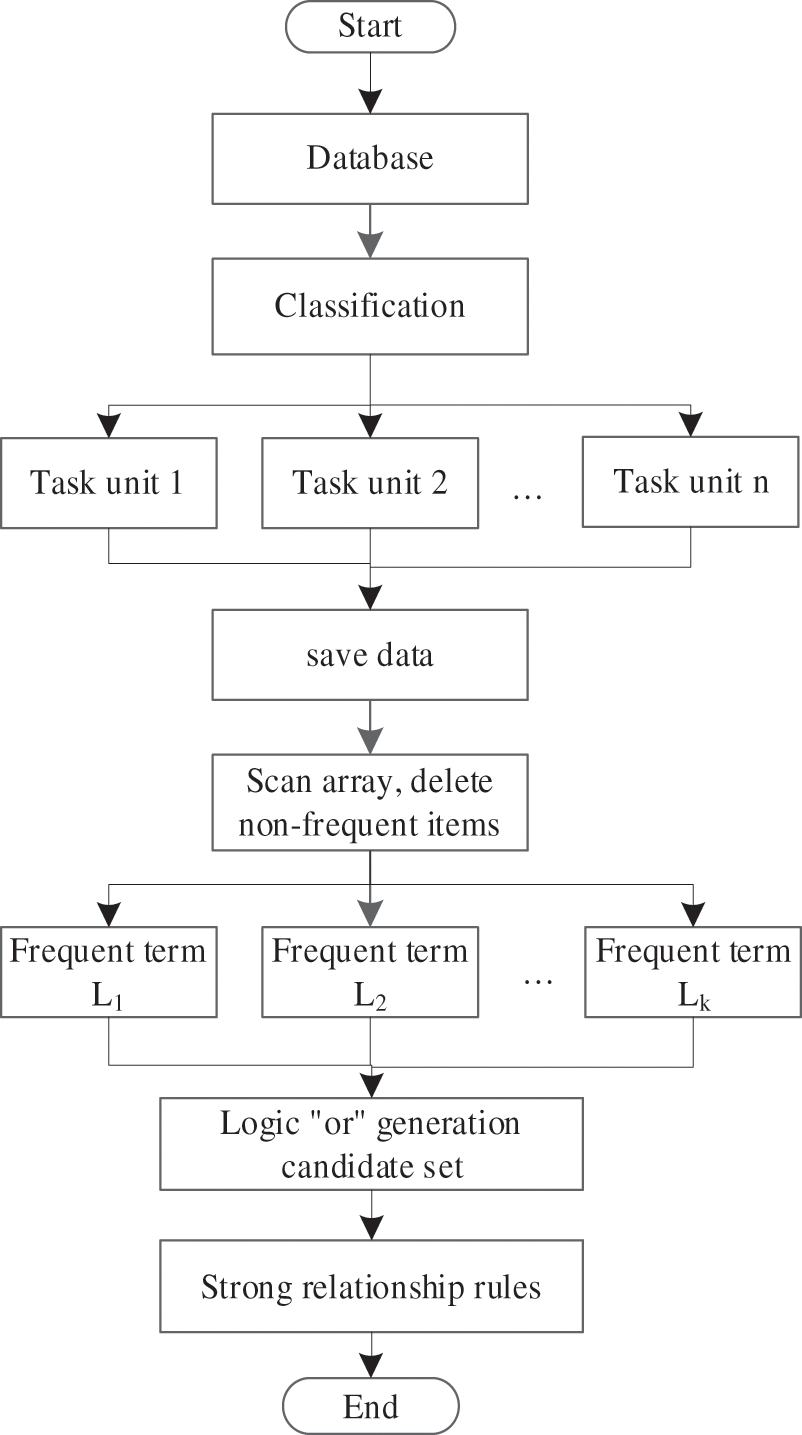
Figure 3: Clustering mining model of Apriori algorithm
The state quantity index evaluation matrix is obtained after the calculation of the membership function, which contains the membership values of the four state levels corresponding to the measured values of each state quantity index. This evaluation matrix A is expressed as:
The maximum membership value of each state quantity index belonging to four state levels is extracted from the evaluation matrix, and the state information phasor is constructed, namely:
Calculate the objective correction coefficient of each state quantity index according to the state information phasor e:
In the formula, n is the number of state quantity indicators. Finally, the comprehensive weight
3.3 An Example of Incomplete Clustering Mining Based on Array Apriori Algorithm
3.3.1 Acquisition of Strong Association Rule
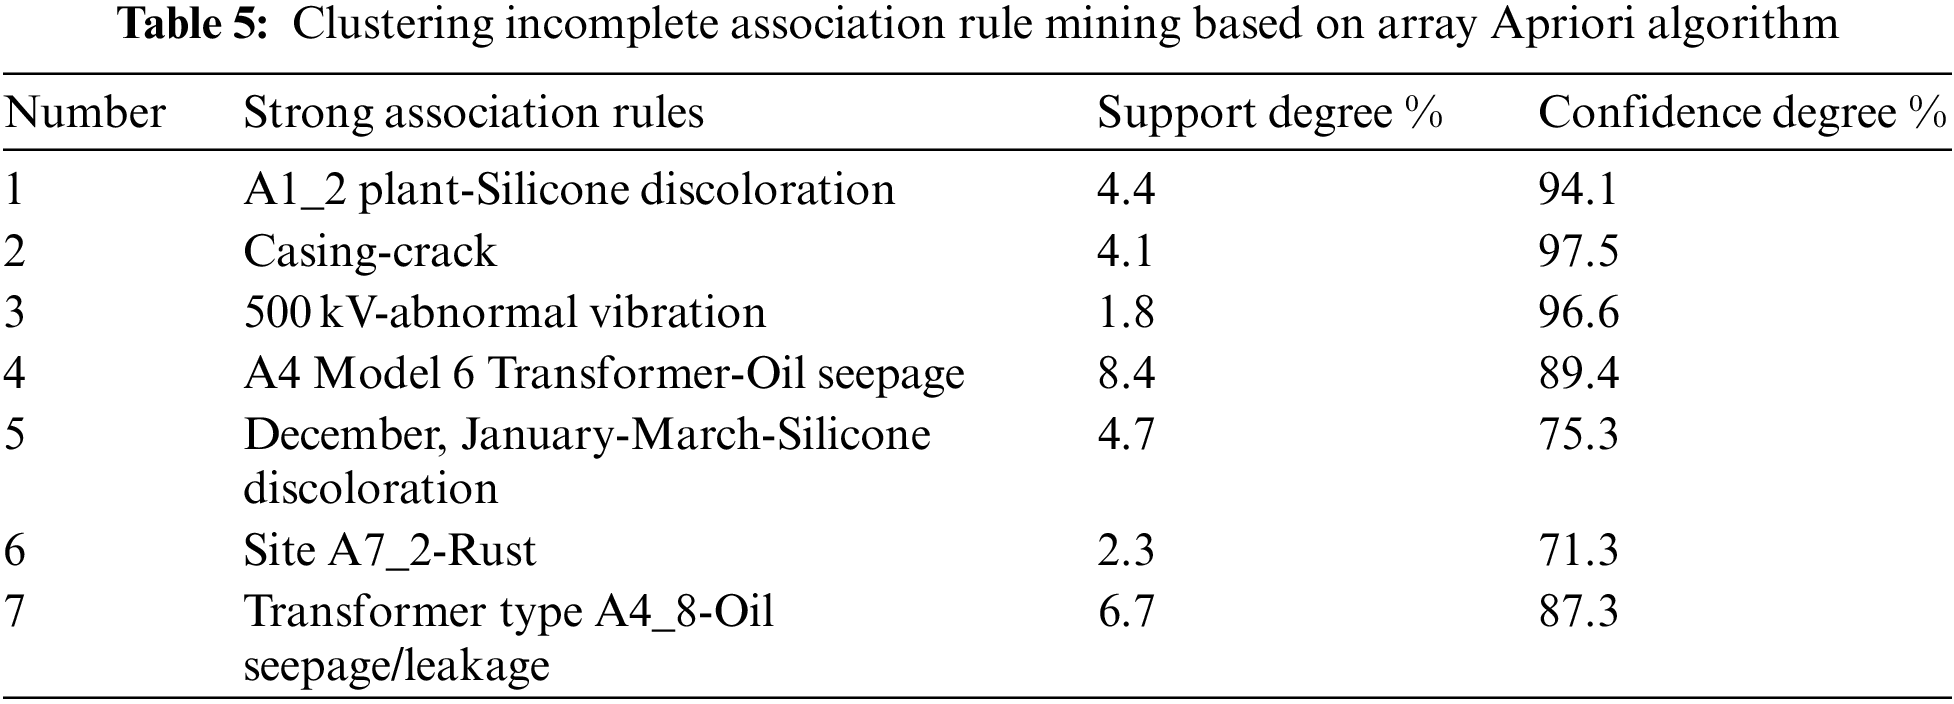
Collect incomplete data of a power company data transform. Select the important information such as a manufacturer, an equipment type, an equipment component, an equipment model, a voltage level, a discovery time, a service place, a property and that like to be represented by a variable A and correspond faults to be represented by a variable B as objects of data mining and analysis. Minimum support and minimum confidence are set in cluster mining using the array-based Apriori algorithm. Frequent itemsets are generated after mining processing, in which 1 itemset of frequent items is generated, and higher order frequent items are not obtained [24]. A large number of frequent itemsets are generated, and the most meaningful ones are selected for analysis. Table 5 shows the mining results of the clustering association rules of the array-based Apriori algorithm for incomplete data:
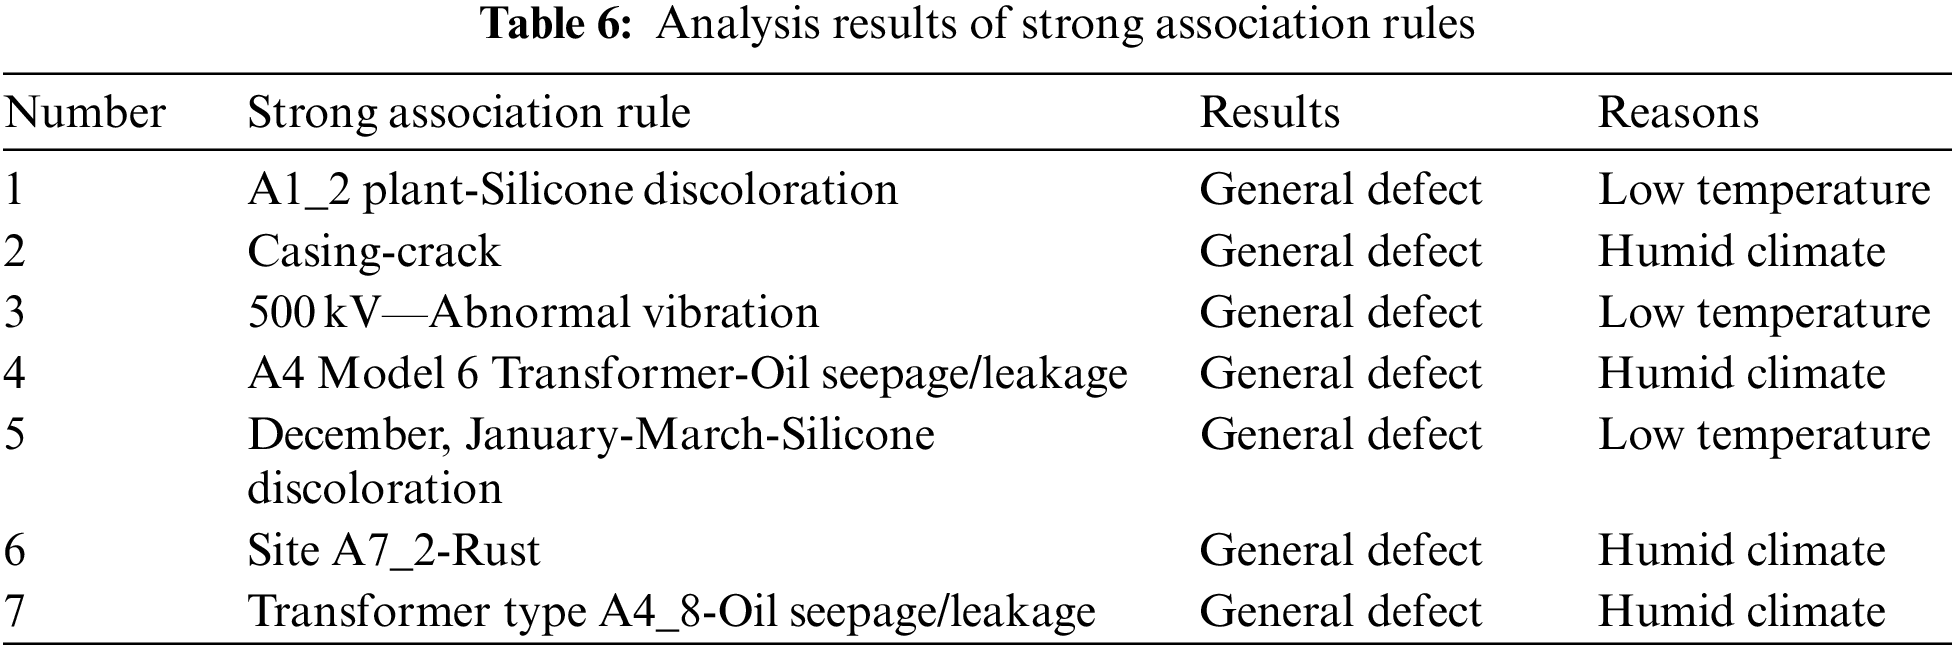
3.3.2 Analysis of Strong Association Rule
The strong association rule in the first row indicates that the respirator silica gel of the transformer produced by Factory 2 is easy to change color. In fact, in the actual mining data, the respirator silica gel of the transformer produced by almost all manufacturers changes color. Here is the most prominent one. Row 2 shows that the casing often cracks. Line 3 indicates that abnormal vibration is more likely to occur during the operation of power transformers of 500 kV voltage class. Lines 4 and 7 show that the transformers with equipment model numbers 6 and 8 are prone to oil seepage/leakage. Similarly, during the excavation process, it was found that almost every type of transformer had more or less oil seepage/leakage [23]. The analysis of strong association rules is shown in Table 6.
4 Experimental Results and Analysis
The Apriori rule algorithm proposed in this paper mines the spatial neighborhood information of the samples, and uses the local information of the samples in the spatial distribution to realize the secondary correction and filling of the missing values. To verify the effectiveness of this method, the corresponding experimental results and analysis are given in this section. This paper focuses on the CCA-IR framework to improve the effect of classical filling methods. Thus, this paper selects five classical filling methods, including mean filling, SoftI, KNN filling, MFI and MICE, as the filling methods in the pre-filling stage. These five methods are selected for comparison because they are very representative. Specifically, on the one hand, mean filling, SoftI, MFI and MICE are all based on statistical filling methods, while KNN filling is a typical representative of machine learning filling methods; On the other hand, mean padding, SoftI, KNNI, and MFI are all single padding methods, while the MICE method is a classic algorithm representing multiple padding. The details of the experimental data set are as follows.
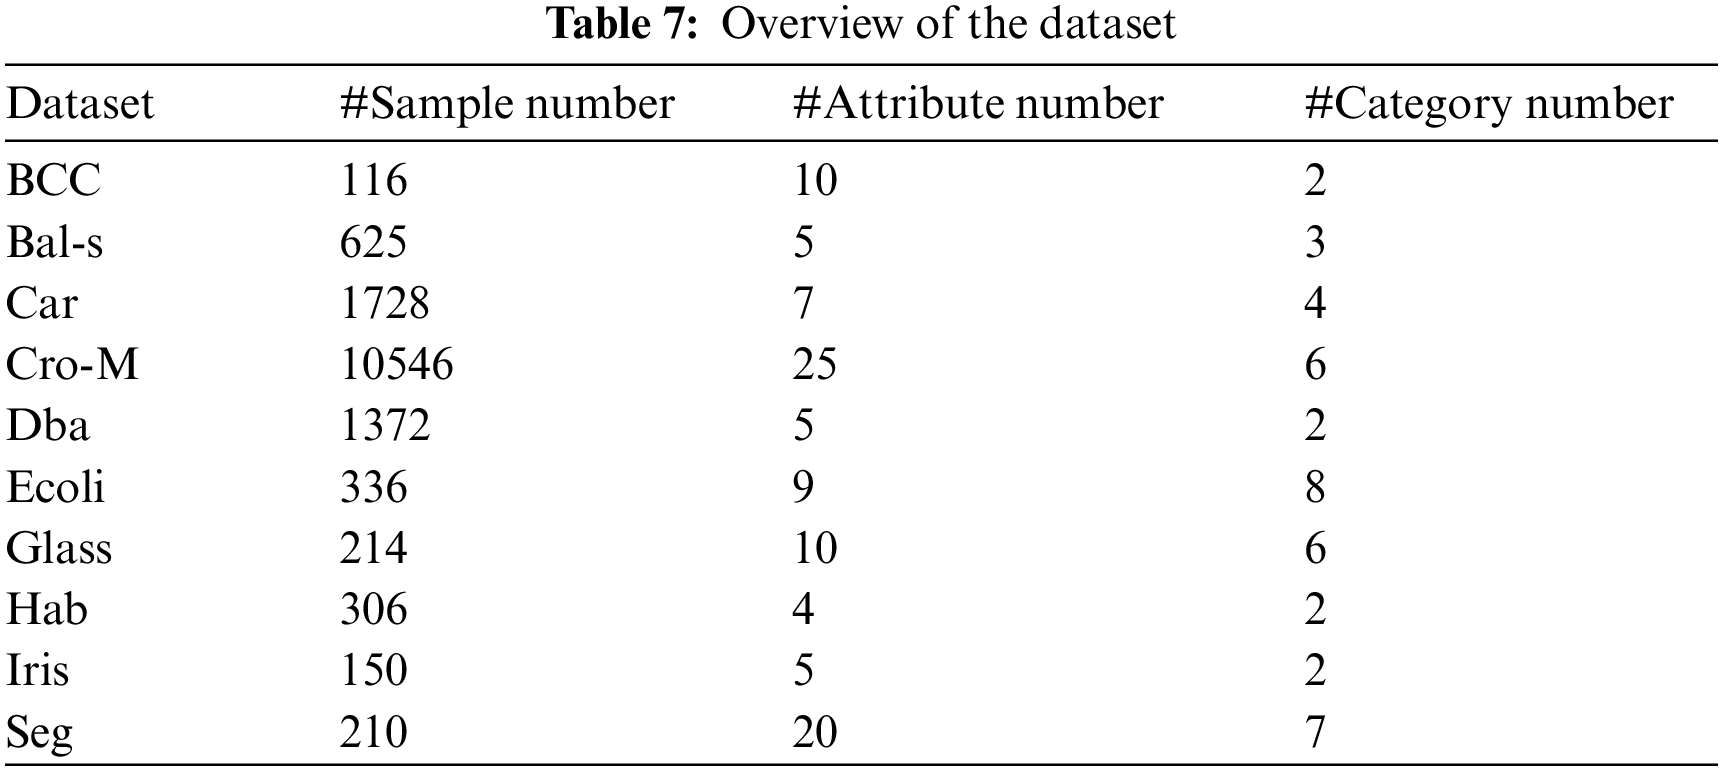
In this paper, ten data sets are selected from UCI for experiments. Table 7 shows the basic information of the ten data sets, including the name of the data set, the number of samples, the number of attributes and the number of categories, which includes BCC (Breast Cancer Coimbra), Bal-s (balance-scale), Cro-M (Crowd sourced Mapping), Dba (Data _ Banknote _ Authentication), Hab (Haberman), Lym (Lymphography) and Seg (Segment) [24].
In the experiment, incomplete data is obtained from the complete data set on UCI in a random missing way, and the missing rate ranges from 0 to 0.25. Then, the incomplete data is pre-filled with the filling method chosen by the paper. Based on that, the pre-filling result is corrected with the method of missing value correction filling based on the spatial neighborhood information proposed in this paper. Finally, according to the original data set before the correction filling and the final complete set after the correction filling, the NRMSE values and change trends under different missing rates are obtained:
In the formula,
To avoid the influence of the error caused by single filling on the experimental results, the experiment repeated random deletion for 100 times under each deletion rate, and finally obtained the NRMSE value, which is the mean value obtained after deletion of 100 repetitions. Figs. 4d–6 show the change trend of the corresponding NRMSE values of the five groups of filling methods on different data sets and under different missing rates.

Figure 4: Comparison of NRMSE values at different deletion rates (1)

Figure 5: Comparison of NRMSE values at different deletion rates (2)

Figure 6: Comparison of NRMSE values at different deletion rates (3)
In the experiment, the incomplete data is obtained by randomly deleting the complete data sets on the ten UCIs in Tables 3 to 5, where IR-MEI, IR-SoftI, IR-KNNI, IR-MFI and IR-MICE respectively represent five methods to correct and fill the missing values corresponding to the neighborhood of the mining space.
Generally speaking, for some data sets with fewer features (dimensions) and more samples, when the missing rate is small, the corresponding NRMSE value is also small, when the missing rate reaches the minimum, the NRMSE value often reaches the minimum, which means that the filling effect is the best, but with the increasing missing rate, the corresponding NRMSE gradually shows an increasing trend. This is because the smaller the missing rate is, the less the number of missing attributes is. When the number of samples is larger than the feature (dimension) number, for example, the feature (dimension) number of Car data set is 7. When the missing rate is 1%, the number of missing attributes is 121, and the data itself has 1728 samples, so there are many remaining complete samples that can be used for filling. This is very beneficial for data recovery. With the increase of the missing rate, the remaining complete samples become less and less, and the corresponding NRMSE values also show an upward trend.
Five classical filling methods (including single filling and multiple filling) are selected and compared on the UCI data set. The results show that the framework proposed in this paper can effectively improve the filling effect of existing filling methods on most data sets. Although the improvement effect is not good on a few data sets, from the change trend of NRMSE metrics under different missing rates obtained from the experiment, most of the filling methods combined with the framework usually show a relatively stable filling trend. The framework proposed in this paper can also improve the filling effect of some poor single filling methods to the effect achieved by multiple filling methods.
This paper mainly analyzes the multi-source heterogeneous data of power system, and expounds the method of how to deal with the missing data and error data in the incomplete data of power equipment. The next step is to structure the unstructured information in these incomplete data. Based on the comprehensive analysis of the incomplete data of power equipment and the characteristics of the Apriori algorithm, the array-based Apriori algorithm is used to find the key information in the incomplete data of power equipment and the strong association rules between clustering rules. The experimental results show that the proposed method can indeed achieve the best results on most data sets, and can also improve the classification accuracy of some poor single filling methods to be similar to that of better multiple filling methods.
In this paper, we propose a framework that can be widely applied to the existing filling methods, aiming at the fact that most of the existing filling methods ignore the impact of the spatial distribution information of samples on data recovery, aiming at improving the filling effect.
Pre-filling a sample by using the prior filling method, and correct the filling result obtained by using the prior method.
Find a plurality of spatial neighborhoods with higher similarity with the sample to be filled by introducing a spatial neighborhood information mining method.
Finally, correct the filling result generated by the existing filling method by using the effective information in the space neighborhood of the sample to be filled.
In the future work, based on the incomplete data clustering and condition assessment in this paper, we can further study the fuzzy analysis of power equipment data in the whole system, arrange timely maintenance according to the impact of equipment condition on the system, and provide guidance for staff in the form of visualization.
Funding Statement: The authors received no specific funding for this study.
Conflicts of Interest: The authors declare that they have no conflicts of interest to report regarding the present study.
References
1. Nwulu, N. I., Xia, X. (2017). Optimal dispatch for a microgrid incorporating renewables and demand response. Renewable Energy, 101(2), 16–28. DOI 10.1016/j.renene.2016.08.026. [Google Scholar] [CrossRef]
2. Hussain, A., Bui, V., Kim, H. A. (2018). Resilient and privacy-preserving energy management strategy for networked microgrids. IEEE Transactions on Smart Grid, 9(3), 2127–2139. DOI 10.1109/TSG.2016.2607422. [Google Scholar] [CrossRef]
3. Gholami, A., Shekari, T., Grijalva, S. (2019). Proactive management of microgrids for resiliency enhancement: An adaptive robust approach. IEEE Transactions on Sustainable Energy, 10(1), 470–480. DOI 10.1109/TSTE.5165391. [Google Scholar] [CrossRef]
4. Liu, B., Meng, K., Dong, Z. Y., Zhang, W. (2020). Marginal bottleneck identification in power system considering correlated wind power prediction errors. Journal of Modern Power System and Clean Energy, 8(1), 187–192. DOI 10.35833/MPCE.2019.000215. [Google Scholar] [CrossRef]
5. Han, B., Lu, S., Xue, F., Jiang, L. (2019). Day-ahead electric vehicle aggregator bidding strategy using stochastic programming in an uncertain reserve market. IET Generation Transmission & Distribution, 13(12), 2517–2525. DOI 10.1049/iet-gtd.2018.6951. [Google Scholar] [CrossRef]
6. Min, X., Jing, X., Ke, S., Liu, M. (2017). Two-stage compensation algorithm for dynamic economic dispatching considering copula correlation of multiwind farms generation. IEEE Transactions on Sustainable Energy, 8(2), 763–771. DOI 10.1109/TSTE.2016.2618939. [Google Scholar] [CrossRef]
7. Qin, C., Zeng, Y. (2019). SR-based chance-constrained economic dispatch for power systems with wind power. IET Generation Transmission & Distribution, 13(13), 2779–2788. DOI 10.1049/iet-gtd.2018.6549. [Google Scholar] [CrossRef]
8. Rodrigues, T., Ramírez, P. J., Strbac, G. (2018). Risk-averse bidding of energy and spinning reserve by wind farms with on-site energy storage. IET Renewable Power Generation, 12(2), 165–173. DOI 10.1049/iet-rpg.2017.0223. [Google Scholar] [CrossRef]
9. Shuai, H., Fang, J., Ai, X., Tang, Y., Wen, J. et al. (2019). Stochastic optimization of economic dispatch for microgrid based on approximate dynamic programming. IEEE Transactions on Smart Grid, 10(3), 2440–2452. DOI 10.1109/TSG.5165411. [Google Scholar] [CrossRef]
10. Li, M., Ji, T. Y., Ye, X., Hua, Q., Yang, X. (2019). Operating mechanism for profit improvement of a smart microgrid based on dynamic demand response. IET Smart Grid, 2(3), 364–370. DOI 10.1049/iet-stg.2018.0082. [Google Scholar] [CrossRef]
11. Karimi, A., Khayat, Y., Naderi, M., Dragievi, T., Mirzaei, R. et al. (2020). Inertia response improvement in AC microgrids: A fuzzy-based virtual synchronous generator control. IEEE Transactions on Power Electronics, 35(4), 4322–4331. DOI 10.1109/TPEL.63. [Google Scholar] [CrossRef]
12. Andalib-Bin-Karim, C., Liang, X. D., Zhang, H. (2018). Fuzzy-secondary-controller-based virtual synchronous generator control scheme for interfacing inverters of renewable distributed generation in microgrids. IEEE Transactions on Industry Applications, 54(2), 1047–1061. DOI 10.1109/TIA.2017.2773432. [Google Scholar] [CrossRef]
13. Li, S., Xiang, L., Xiang, Z. (2019). Frequency response enhance control method based on two-step MPC for VSG. 2019 IEEE 3rd Conference on Energy Internet and Energy System Integration (EI2), pp. 359–363. Changsha, China. [Google Scholar]
14. Babayomi, O., Li, Z., Zhang, Z. (2020). Distributed secondary frequency and voltage control of parallel-connected VCVS in microgrids: A predictive VSG-based solution. CPSS Transactions on Power Electronics and Applications, 5(4), 342–351. DOI 10.24295/CPSSTPEA. [Google Scholar] [CrossRef]
15. Jongudomkarn, J., Liu, J., Yanagisawa, Y., Bevrani, H., Ise, T. (2020). Model predictive control for indirect boost matrix converter based on virtual synchronous generator. IEEE Access, 8, 60364–60381. DOI 10.1109/Access.6287639. [Google Scholar] [CrossRef]
16. Dehkordi, N. M., Sadati, N., Hamzeh, M. (2017). Fully distributed cooperative secondary frequency and voltage control of islanded microgrids. IEEE Transactions on Energy Conversion, 32(2), 675–685. DOI 10.1109/TEC.2016.2638858. [Google Scholar] [CrossRef]
17. Neves, R. V. A., Machado, R. Q., Oliveira, V. A., Wang, X., Blaabjerg, F. (2019). Multitask fuzzy secondary controller for AC microgrid operating in stand-alone and grid-tied mode. IEEE Transactions on Smart Grid, 10(5), 5640–5649. DOI 10.1109/TSG.5165411. [Google Scholar] [CrossRef]
18. Lai, J., Lu, X., Wang, F., Dehghanian, P., Tang, R. (2019). Broad cast gossip algorithms for distributed peer-to-peer control in AC microgrids. IEEE Transactions on Industry Applications, 55(3), 2242–2251. [Google Scholar]
19. Khazaei, J., Nguyen, D. H. (2019). Multi-agent consensus design for hetero generous energy storage devices with droop control in smart grids. IEEE Transactions on Smart Grid, 10(2), 1395–1404. DOI 10.1109/TSG.5165411. [Google Scholar] [CrossRef]
20. Fan, B., Peng, J., Yang, Q., Liu, W. (2019). Distributed periodic event-triggered algorithm for current sharing and voltage regulation in DC microgrids. IEEE Transactions on Smart Grid, 11(1), 577–589. DOI 10.1109/TSG.5165411. [Google Scholar] [CrossRef]
21. Chen, M., Xiao, X. (2018). Secondary voltage control in islanded microgrids using event-triggered control. IET Generation, Transmission & Distribution, 12(8), 1872–1878. DOI 10.1049/iet-gtd.2017.0698. [Google Scholar] [CrossRef]
22. Meng, X., Liu, J. J., Liu, Z. A. (2019). Generalized droop control for grid-supporting inverter based on comparison between traditional droop control and virtual synchronous generator control. IEEE Transactions on Power Electronics, 34, 5416–5438. DOI 10.1109/TPEL.63. [Google Scholar] [CrossRef]
23. Cózar, J., Fernández, A., Herrera, F., Gámez, J. A. (2019). A metahierarchical rule decision system to design robust fuzzy classifiers based on data complexity. IEEE Transactions on Fuzzy Systems, 27(4), 701–715. [Google Scholar]
24. Chen, X., Wu, W., Gao, N., Chung, H. S. H., Blaabjerg, F. (2020). Finite control set model predictive control for LCL-filtered grid-tied inverter with minimum sensors. IEEE Transactions on Industrial Electronics, 67(2), 9980–9990. [Google Scholar]
Cite This Article
 Copyright © 2023 The Author(s). Published by Tech Science Press.
This work is licensed under a Creative Commons Attribution 4.0 International License , which permits unrestricted use, distribution, and reproduction in any medium, provided the original work is properly cited.
 Downloads
 Citation Tools